Embed Size (px)
Citation preview
Electronic copy available at: http://ssrn.com/abstract=2627735
WHEN THE LAWYER SCREWS UP: A PORTRAIT OF LEGAL MALPRACTICE CLAIMS AND THEIR
RESOLUTION*
Herbert M. Kritzer** and Neil Vidmar*** [Legal malpractice] is not a synonym for undistinguished representation.” Judge Richard Posner1
INTRODUCTION
Legal services is big business in the United States, producing $270.6
billion in revenue in 2012 according to a United States Commerce Department report on professional services.2 It is surpassed only by physician and clinical services medical and clinical services at $566.6 billion in 2012 according to the Centers for Medicare & Medicaid Services.3 We are all familiar with the issue of negligence and error in the delivery of medical services. In contrast we hear little about those issues in the delivery of legal services. Medical malpractice and redress for the victims of medical malpractice have long been prominent public issues, engaging medical
* Several people provided important assistance in carrying out the research reported
here. Suzanne Thorpe at the University Minnesota Law Library and Soren Lagaard, JD 2015, University of Minnesota, responded to numerous requests for locating information and data. Tim Gephart (Minnesota Lawyers Mutual Insurance Company) responded to a range of questions about the operation of legal malpractice insurance and Carol Bernick (Oregon State Bar Professional Liability Fund) assisted us in interpreting some of the information in the annual reports published by PLF and provided some supplemental unpublished information. We also thank the many lawyers and the insurance company representatives who were willing to take the time to talk with us about their work.
* Marvin J. Sonosky Chair of Law and Public Policy, University of Minnesota Law School; BA Haverford College, Ph.D. University of North Carolina at Chapel Hill.
** Russell M. Robinson II Professor of Law and Professor of Psychology, Duke University; BA MacMurray College, Ph.D. University of Illinois.
1 McKnight v. Dean, 279 F.3d 513, 518 (2001). 2 See http://selectusa.commerce.gov/industry-snapshots/professional-services-industry-
united-states.html, last visited June 13, 2015. The Commerce Department reported revenue for five service subsectors: accounting, architectural services, engineering services, legal services, and management consulting. The next highest subsector was engineering services at $184.1 billion.
3 Centers for Medicare & Medicaid Services, National Health Expenditure Projections 2012-2022, http://www.cms.gov/Research-Statistics-Data-and-Systems/Statistics-Trends-and-Reports/NationalHealthExpendData/downloads/proj2012.pdf, last visited, June 13, 2015. The other two components of healthcare expenditures, hospitals and prescription drugs, totaled $892.4 billion and $260.8 billion respectively.

Electronic copy available at: http://ssrn.com/abstract=2627735
2 WHEN THE LAWYER SCREWS UP [29-Jun-15
professionals and their organizations, policy makers, and legal scholars.4 Over the last 30 years extensive empirical research has documented the myths and realities of medical malpractice, showing among other things that the incidence of medical negligence is very high while the volume of medical malpractice claims has remained a tiny fraction of the incidence of actual malpractice.5 In contrast legal malpractice, along with malpractice in other areas of professional services—accounting, architectural, engineering, and consulting, has received virtually no attention from anyone other than the legal profession itself.
What are the characteristics of legal malpractice claims? That is the question we seek to answer here. What is clear from our analysis is that there are two distinct worlds of legal malpractice roughly aligning with what Heinz and Laumann labeled the “two hemispheres” of the bar. Based on their study of the Chicago bar in 1975, Heinz and Laumann found two distinct segments of legal practitioners, one serving primarily the corporate sector and one serving primarily the personal services sector.6 At the time of the 1975 study, these two segments each comprised roughly have the legal services produced by private practitioners.7 While our information on the legal malpractice cases involving the large-firm corporate sector is much more limited that what we have regarding the personal services sector, the contrasts that we do find are very clear, and not necessarily surprising.
In the following pages, we draw on a wide range of sources to provide a statistical description of key aspects of legal malpractice claims and how they are handled.
4 One can find articles in the popular press bemoaning medical malpractice litigation at
least as far back as the 1930s,4 and professional journals even farther back See, for example, Eugene F. Sanger, Malpractice, 6 TRANSACTIONS OF THE MAINE MED. ASSOC. 360 (1879). For academic discussions of the early development of medical malpractice litigation see Charles J. Weigel, III, Medical Malpractice in America's Middle Years, 32 TEX. REP. BIOL. MED. 191 (1974);JAMES C. MOHR, DOCTORS AND THE LAW: MEDICAL JURISPRUDENCE IN
NINETEENTH CENTURY AMERICA 109 (1993).; or Robert I. Field, The Medical Malpractice Crisis Turns 175: What Lessons Does History Hold for Reform? 4 DREXEL LAW REVIEW 7 (2011).
5 See TOM BAKER, THE MEDICAL MALPRACTICE MYTH 22 (2005). for a good summary of what is known about the incidence of medical malpractice and Bernard Black, et al., Stability, Not Crisis: Medical Malpractice Claim Outcomes in Texas, 1988-2002, 2 J. EMPIRICAL LEGAL STUD. 207 (2005). for evidence that the system of redress for medical malpractice has remained reasonably stable over a 25 year period.
6 See JOHN P. HEINZ & EDWARD O. LAUMANN, CHICAGO LAWYERS: THE SOCIAL
STRUCTURE OF THE BAR 319 (1982). 7 A replication of the study in 1995 found that the corporate sector’s share of legal effort
was up to 64 percent from 53 percent twenty years earlier while the personal services sector’s share was down to 29 percent from the previous 40 percent; see P. JOHN HEINZ, et al., URBAN
LAWYERS: THE NEW SOCIAL STRUCTURE OF THE BAR 42 (2005).
Electronic copy available at: http://ssrn.com/abstract=2627735
29-Jun-15] WHEN THE LAWYER SCREWS UP 3
The next section discusses several preliminaries. Section II reviews the very limited extant empirical research on legal malpractice. Section III examines patterns of claims and their resolution using a variety of data sources. Section IV looks at claim rates. Section V examines the sources of claims in terms of such things as area of practice and size of law firm. Section VI looks at the frequency that legal malpractice claims because lawsuits. Section VII looks at the outcomes of legal malpractice. Section VIII looks at the incidence of legal malpractice trials and the outcomes of those trials.
I. SOME PRELIMINARIES There are several aspects of legal malpractice that differentiate it from
medical malpractice. The first difference concerns insurance. While most, if not virtually all, medical providers either carry insurance or have sufficient personal or organizational resources to pay significant damage awards, a significant proportion of legal practitioners serving private clients are uninsured. This is particularly true of practitioners working solo or in very small firms. Only one state, Oregon, requires that all private practitioners carry professional liability insurance,8 and that insurance is through the Oregon State Bar’s Professional Liability Fund (PLF); Oregon practitioners may carry insurance in addition to that provided by PLF and PLF itself provides some “excess” coverage.9 In some states lawyers who organize in some form of limited liability entity are required to carry insurance for the entity.10 Some states require that practitioners report whether they have insurance at the time of their annual registration with the relevant regulatory
8 Throughout this article we will usually refer to lawyers’ professional liability (LPL)
insurance as legal malpractice insurance even though LPL insurance covers more than liability due to negligence. For simplicity we refer to most liability arising from a lawyer’s professional activities as “legal malpractice”; the exceptions are premises liability related to injuries to someone while in a lawyer’s office or liability related to the operation of a motor vehicle in connection with the lawyer’s professional work,
9 See https://www.osbplf.org/ (last visited April 10, 2015). 10 There are various forms for these limited liability structures including limited liability
company (LLC), professional limited liability company (PLLC), limited liability partnership (LLP), and service corporation (SC). An example of these requirements can be found in the Rules of Professional Conduct (SCR 20:5.7) for attorneys in Wisconsin require that attorneys organized as an LLC, and LLP, or an SC must carry professional liability for the firm with the required amount of coverage starting at $100,000 per claim/$300,000 in aggregate for firms of 1 to 3 lawyers and increasing to $10 million/$10 million for firms of 51 or more lawyers. See Clay R. Williams, LLCs, LLPs and S.C.s: The Rules for Lawyers Have Changed, 70(5) WISC. LAWYER 11 (May 1997) [available at http://www.wisbar.org/NewsPublications/WisconsinLawyer/Pages/Article.aspx?Volume=70&Issue=5&ArticleID=22718, last visited April 10, 2015).

4 WHEN THE LAWYER SCREWS UP [29-Jun-15
authority (e.g., Minnesota) and others (e.g., California) require that lawyers inform clients if they are not insured by including a statement to that effect in retainer agreements.11 Appendix 1 consists of a chart listing each state’s requirement regarding reporting insurance coverage plus any insurance requirement for legal practices organized in some limited liability association.
There are no national figures for the proportion of private practitioners who choose to practice without liability insurance. A survey of Texas lawyers in 2005 found that 36 percent of private practitioners and 63 percent of solo practitioners did not carry malpractice insurance.12 In California a demographic survey of the state bar conducted in 2001 found that 18 percent of private practitioners did not carry malpractice insurance.13 An examination of registration data in Minnesota in 2012 found that 18 percent of lawyers representing private clients did not report having insurance;14 in South Dakota only four percent were uninsured.15
In addition to the significant proportion of lawyers who practice without insurance the market for legal malpractice insurance differs substantially from the market for medical malpractice insurance.16 First, the market is highly stratified with one group of insurers—many of them mutual companies started by the state bar—that focus primarily on solo and small firm practitioners, commercial insurers covering small through medium-sized practice. A few insurers cover the large firms, most prominently the Attorneys’ Liability Assurance Society, generally known as ALAS,
11 As of early 2006, 15 states had adopted a disclosure rule; at that time seven states
including California were considering adopting such a rule; Possible Disclosure Rule for Uninsured Lawyers, CAL. B.J. (January 2006) [http://archive.calbar.ca.gov/Archive.aspx?articleId=73308&categoryId=73304&month=1&year=2006, last visited April 12, 2015]. One issue with such rules is whether a lawyer who is insured when the retainer is signed but subsequently goes bare is required to inform clients of the change in the lawyer’s insurance status.
12 Chuck Herring, Pro/Con Professional Liability Insurance Disclosure; Pro: Disclosure Should Be Required, 72 (10) TEX B.J 822, 823n2.
13 Possible Disclosure Rule, supra note 11. The percentage “going bare” in California appears to have declined from what was the case 20 years prior to the 2006 report; see Debra Cassens Moss, Going Bare: Practicing Without Malpractice Insurance, 73 (12) ABA J. 82 (December 1987).
14 Email to Herbert Kritzer dated June 1, 2012, from Bridget C. Gernander, Clerk of the Appellate Courts, on file with the first author.
15 Texas Bar Task Force on Insurance Disclosure, June 11, 2008 Memorandum from David J. Beck, p. 3 [http://www.texasbar.com/pliflashdrive/material/3_TaskForce_Report_June08.pdf, last visited April 11, 2015].
16 For a detailed description of the structure of the insurance market for legal malpractice insurance, see Tom Baker and Rick Swedloff, Liability Insurer Data as a Window on Lawyers’ Professional Liability, xx U.C. IRVINE L. REV. [forthcoming].

29-Jun-15] WHEN THE LAWYER SCREWS UP 5
effectively is a mutual insurer insuring over 200 firms with an average of over 250 lawyers in the firm.17 Some of the largest firms, particularly those located in New York and California, arrange insurance through brokers such as Aon who assemble a group of insurers each of which takes on a fraction of the risk.18
A second difference is that medical malpractice insurance is normally first dollar coverage while most legal malpractice insurance policies have deductibles or self-insured retentions (SIRs). For the largest firms the SIRs can be multiple-millions of dollars. Even for the smallest firms or solo practitioners the deductible will usually be at least $1,000, and often $5,000 or $10,000. Also, unlike medical malpractice insurance the costs expended to defend claims count against the limit and the deductible/SIR.19 This means that even when no compensation is paid to a claimant, an insured lawyer will often have to pay up to his or her deductible if the insurer incurs costs beyond internal expenses of the insurer’s claims staff.
Moving beyond the issue of insurance a major issue in legal malpractice cases is often whether the claimant has in fact suffered any damages. In medical malpractice an error is likely to produce at least some physical impact usually in the form of pain, emotional distress, or other unpleasant consequences.20 In legal malpractice, where damages are almost always limited to financial loss—i.e., seldom is there a claim for emotional distress—and very occasionally to punitive damages. Additionally, there is often a question of whether the error caused any actual harm. In the medical context, even if the error can be treated so that there are no lasting consequences, it is still possible to claim damages for any lost wages incurred and for pain and suffering. However, in the legal context errors can often be “fixed” and even when a legal error gets as far as a legal malpractice claim, it is not uncommon for the insurer to assist the defendant lawyer in what is referred to as “claim repair.”21
17 See http://www.alas.com/public/about.aspx [last visited April 11, 2015]. 18 AON operates a subsidiary called the Attorneys Mutual Risk Retention Group which
handles packaging insurance for large firms in California and at least some other states. 19 Some insurers may include in their policies a separate amount for defense, but if that
gets fully expended additional defense costs go against the policy limit. 20 In many instances it may be that the nature of the consequences of medical negligence
is temporary and so limited (e.g., pain extended for an extra day or two, or hospitalization extended by a few days) that it is uneconomical to pursue a claim.
21 For example, in the course of the first author’s study of contingency fee legal practice—this study, but not the incident described here, is reported in HERBERT M. KRITZER, RISKS, REPUTATIONS, AND REWARDS: CONTINGENCY FEE PRACTICE IN THE UNITED
STATES—he observed a situation where a lawyer had missed a filing deadline which had lead to the dismissal of the case. The firm had appealed the dismissal asserting that the way the deadline was determined was incorrect—the brief on this issue was prepared while Kritzer was in the office and he observed the lawyer working on the brief conferring with either staff

6 WHEN THE LAWYER SCREWS UP [29-Jun-15
II. PRIOR EMPIRICAL RESEARCH ON LEGAL MALPRACTICE
As noted above, while there is an extensive literature of empirical
research on medical malpractice, there is a limited similar literature on legal malpractice. In a 1980 article Werner Pfennigstorf reviewed available research.22 He found data from four insurance sources and summarized the information regarding claim rates during the 1970s extending for one source back to the late 1960s. He reported that rate to vary from 1 claim per 100 insured lawyers to about 6 claims per 100 insured lawyers;23 the average amount of the claims ranged from about $5,000 to as high as $20,000.24 Drawing on data reported by the American Home Assurance Company describing claims for the period 1969-78, Pfennigstorf reported that the two most common alleged types of negligence were missing a statute of limitations (14.8 percent) and improper handling of a title or real estate matter (13.5%). 25
Pfennigstorf also briefly referenced an empirical study done Duke Nordlinger Stern.26 Stern surveyed lawyers in eleven southern states asking respondents about claims experience over the period 1972 to 1977. Only fragmentary reports of that study are available, and there are serious issues regarding response rates. The survey did show an increasing incidence of claims over the six year period.27 The study also showed that missing deadlines was a prominent allegation; however, because of the categories Stern used, there is no way to determine how often the claim concerned a
at the firm’s insurer or a lawyer retained by the insurer to assist in preparing the appeal. The appeal was successful, and hence the potential claim was “repaired.”
22 Werner Pfennigstorf, Types and Causes of Lawyers' Professional Liability Claims: The Search for Facts, 1980 AMERICAN BAR FOUNDATION RESEARCH JOURNAL 253 (1980).
23 Id., at 259. 24 Id., at 260. 25 Id., at 274; an additional 8.7 percent of claims alleged a failure to properly or timely
file a document or appeal. 26 Id., at 272. 27 Duke Norlinger Stern, The West Virginia Legal Malpractice Experience, 4 W. VA.
ST. B.J. 135, 139 (1978). Other articles about legal malpractice during this period also make reference to an increasing incidence of claims during the 1970s and then extending into the 1980s; see, for example, Fredric Goldfein, Legal Malpractice Insurance, 61 TEMPLE L. REV. 1285 (1988); or George M. Cohen, Legal Malpractice Insurance and Loss Prevention: A Comparative Analysis of Economic Institutions, 4 CONN. INS. L.J. 306, 309 (1997). By mid-1980s rising claim volume, rising claim payouts, and rising malpractice premiums produced a crisis for firms seeking legal malpractice coverage; see Mary Ann Galante, Malpractice Rates Zoom, NAT. L. J. 1 (June 3, 1985); Mary Ann Galante, Lawyers Face New Fights on Malpractice Coverage, NAT. L. J. 3 (September 2, 1985); Mary Ann Galante, Insurance Costs Soar; Is There Any Way Out? NAT. L. J. 1 (March 10, 1986).

29-Jun-15] WHEN THE LAWYER SCREWS UP 7
botched real estate matter.28 The study also found that only about a third (36.4 percent) of claims resulted in payments, and that about two thirds (64.0 percent) of the payments were $5,000 or less.29
The central argument that Pfennigstorf advanced is that there needed to be a systematic collection of data on legal malpractice claims, and to this end he proposed establishing what became known as the National Legal Malpractice Data Center which operated under the auspices the ABA Committee on Professional Liability.30 In 1985 the chairman of that center, William Gates, published a brief report summarizing some of the findings based on four years of case-level data provided by a number of legal malpractice insurers;31 key points were
Almost 80 percent of the reported claims were brought against solo practitioners or lawyers in firms of 2 to 5 lawyers.32
Almost half of the claims involved just two areas of practice, plaintiffs’ personal injury and real estate.33
About two-thirds of claims were brought against lawyers in practice more than ten years.34
About two-thirds were closed with no payment and only about four percent of paid claims were a result of a judgment.35
The frequency of payment and the size of payments varied by the area of practice, and amounts paid tended to be relatively modest.36
In 1989 what was by then called the ABA Standing Committee on Lawyers’ Professional Liability (SCLPL) published a detailed report of statistical tabulations,37 and a year later a more analytic report based on those same
28 Id. 29 Id., at 137. The two other extant reports of this study are Duke Norlinger Stern,
Lawyers’ Professional Liability in Kentucky, 42 KY. BENCH & B. 14 (1978), and Duke Nordlinger Stern, Causes of Attorney Malpractice Claims, 3 PROFESSIONAL LIABILITY REP. 199 (1979).
30 Pfennigstorf, supra note 22, at 275-87. 31 William H. Gates, Lawyers' Malpractice: Some Recent Data About a Growing
Problem, 37 MERCER L. REV. 559 (1986). 32 Id. However, it is important to note that according to the 1985 Lawyers Statistical
Report 63.5 percent of private practitioners were either solo or in firms of five or fewer lawyers.
33 Id. 34 Id. 35 Id., at 563. 36 Id., at 564. 37 Standing Committee on Lawyers’ Professional Liability, Characteristics of Legal
Malpractice: Report of the National Legal Malpractice Data Center (1989). Summaries of the reports can be found in Richard E. Mallen and Jeffrey M. Smith, Legal Malpractice:

8 WHEN THE LAWYER SCREWS UP [29-Jun-15
data.38 Subsequently, the SCLPL has published a series of reports entitled “Profile of Legal Malpractice Claims” covering four year periods: 1992-1995, 1996-1999, 2000-2003, 2004-2007, and 2008-2011. These later reports are based on summary statistics provided by insurers rather than on individual case reports. The insurers providing information to the ABA tend to be more oriented to insuring solo practice and small firm lawyers than to lawyers in medium to large firms. The most recent report includes comparative figures for all of the studies which will be discussed in a later section.39
The only other empirical study of legal malpractice we could locate was a pair of articles published in the mid-1990s by Tulane University law professor Manuel Ramos. In those articles, Ramos drew on a variety of data sources, including his own 20-year experience defending legal malpractice claims.40 The thrust of Ramos’s argument was that legal malpractice was a much larger problem than suggested by the then extant research, particularly as indicated by the SCLPL reports. In the first of the two articles Ramos looked to an analysis of 42 cases that he had defended between February 1991 and December 1992, all but one of which were in suit,41 plus the SCLPL study, data obtained from Oregon’s Professional Liability Fund (PLF), data on claims reported to the Florida Insurance Commission, and statistics from reports published by two large legal malpractice insurers.42 Comparing the SCLPL statistics to those from his own experience, Ramos argued that insurers responding to the SCLPL data request must have been underreporting their claims experience.43 However, Ramos appears to have
Liability, Prevention, Litigation, Insurance vol. 1, 33-45 (2014 edition).
38 Standing Committee on Lawyers’ Professional Liability, Profile of Legal Malpractice: A Statistical Study of Determinative Characteristics of Claims Asserted Against Attorneys (1990). According to the report (p. 3) the analysis was based on individual reports of 29,227 claims from January 1983 through the end of September 1985.
39 See Baker and Swedloff, supra note 16, for a summary of some of the ABA figures. 40 Manuel Ramos, Legal Malpractice: The Profession's Dirty Little Secret, 47 VAND. L.
REV. 1657 (1994). [henceforth “Ramos, Dirty Little Secret”]; Manuel R. Ramos, Legal Malpracitce: No Lawyer or Client Is Safe, 47 FLA. L. REV. 1 (1995). [henceforth “Ramos, No Lawyer or Client Is Safe”]. In the author’s notes to both articles, Ramos notes that he “personally handled or supervised associates on over 900 legal malpractice cases for approximately twenty insurance carriers in southern California.” In one of these articles Ramos briefly summarizes a number of early analyses of legal malpractice claims, both insurance claims studies the earliest of which was done in 1952 and studies based on surveys of lawyers; see “No Lawyer or Client Is Safe,” at 10-14. In another article, Ramos advocates for mandatory legal malpractice insurance along the lines of what is required in Oregon; see Manuel R. Ramos, Legal Malpractice: Reforming Lawyers and Law Professors, 70 TUL. L. REV. 2583 (1996).
41 Id. [Dirty Little Secret”], at 1735-40; Ramos coded information about the cases using the same form used in the original SCLPL study.
42 Id., at 1662. 43 Id., at 1669-70.

29-Jun-15] WHEN THE LAWYER SCREWS UP 9
placed too much confidence in the data he compiled for the 42 cases he handled while in practice; almost all of those cases became lawsuits, and we have no way of knowing how the insurer decided to refer cases to Ramos’s firm or which of those cases he handled himself. It is interesting that as a defense lawyer, Ramos reported that most of the cases resulted in payments to the plaintiff.44 This may reflect the nature of the cases Ramos handled, which were heavily weighted toward plaintiffs’ personal injury matters and somewhat higher value cases than the typical paid case in the ABA data.45 Ramos appeared to believe that his personal experience was more typical than that reflected in the various other sets of data which he saw as biased in a way that understated the significance of legal malpractice as a problem for lawyers and their clients.
One interesting aspect of the information provided by Ramos involves figures he abstracted from periodic reports from ALAS; he did note the high-value of cases where ALAS was the insurer,46 but did not take into account the very different profile of cases in terms of the distribution of the areas of law in those cases. For the other insurers he considered, the dominant areas of law producing claims were plaintiffs’ personal injury and real estate, but for the ALAS cases the two dominant areas were corporate/banking and litigation.47 Given the clients of ALAS’s insureds it seems safe to assume that litigation handled by those insureds is seldom, if ever, plaintiffs’ personal injury.
In his second article, Ramos tried to use case-level data he obtained from the Florida Insurance Commission in order to assess what factors might be associated with facing a legal malpractice claim.48 The data he obtained included the name of the lawyer whose action generated the claim.49 This allowed Ramos to merge information from the Martindale-Hubbell legal
44 Id., at 1736. As we will show later, this is not at all inconsistent with some insurer
reports and depends on what actually is treated as a claim. 45 Id., at 1737-38. Ramos seem generally positive about the data he obtained from
Oregon’s PLF, but those data also show that his practice is unrepresentative of all legal malpractice claims; id., at 1741.
46 Id., at 1676-77. 47 Id., at 1749. 48 Ramos, No Client or Lawyer is Safe, supra note 40. At the time of Ramos’s analysis
the Florida Insurance Commission required insurers to report all legal malpractice claims regardless of whether a claim resulted in payment; around 1998, Florida law changed to require reporting of claims where no payment was made only if the loss adjustment expenses exceeded $50,000; FL. STAT. 627.912(1)(c)4. Neil Vidmar and Mirya Holman report a later, but very limited, analysis of the Florida Insurance data; see Legal Malpractice: Ordinary Claims, Mega-Payments, and Punitive Damages, unpublished paper presented at 2010 Law and Society Association Annual Meeting, May 26-29, Chicago, Illinois; on file with the authors.
49 Id., at 22.

10 WHEN THE LAWYER SCREWS UP [29-Jun-15
directory (size of firm, location of practice, areas of practice, Martindale-Hubbell ratings for the firm and the lawyer, birth date, law school attended, date of admittance to the Bar, years of practice) with information from the regulatory authority on any disciplinary complaints faced by the lawyer (any complaints, any actual discipline, nature of any disciplinary dispositions).50 s Ramos’s analysis is difficult to interpret because it consists largely of tables of distributions, often comparing malpractice rates to the overall distribution of lawyers without undertaking any statistical tests to see if the distributions differ. Ramos did find some patterns that were consistent with the SCLPL reports. Lawyers facing legal malpractice were more likely to practice solo or in small firms although solo was if anything underrepresented compared to the population of lawyers but this might mean they are underrepresented among lawyers carrying malpractice insurance). Targets of legal malpractice claims tended to be older rather than younger. He found no particular relationship with quality of law school attended, having been disciplined, practicing in an urban versus a rural setting, or Martindale-Hubbell rating. He zeroed in on lawyers who were the subject of two or more malpractice claims during the period covered by the Florida data, and found that they did not differ in major ways from Florida lawyers in general.51 His general conclusion was that “nobody is safe” and that “everyone and anyone commits [sic] malpractice.”52
I. A PORTRAIT OF LEGAL MALPRACTICE CLAIMS
III. DATA SOURCES We draw on four broad types of data sources, each of which differs in
coverage and content.
A. Reports of the ABA’s Standing Committee on Lawyers’ Professional Liability (SCLPL)
In our discussion of previous research we described the study done in the 1980s on behalf of the SCLPL Since that original study, the SCLPL has published reports about every four years. While the initial study was based on case-level reports provided by the participating insurers, subsequent reports rely upon a compilation of summary information provided by the insurers to the SCLPL. Participation in the SCLPL’s data collection effort include a combination of bar-related mutual insurers and commercial
50 Id., at 23-26. 51 Id., at 53-54. 52 Id., at 59.
29-Jun-15] WHEN THE LAWYER SCREWS UP 11
insurers;53 missing from the contributors are many of the insurers that focus on large firms (100 or more lawyers).54 The SCLPL has now published six reports: the initial report published in 1986 plus reports covering claims closed in 1992-1994, 1996-99. 2000-03, 2004-07, and 2008-11;55 the latest report provides a lot of information comparing patterns across the various reports, and we look to this report as a major source. 56 We draw on and expand from the summaries of the SCLPL reports compiled by Tom Baker and Rick Swedloff.57
B. Reports of individual insurers
One type of insurer in the legal malpractice marketplace are bar-related companies, all of which are affiliated with the National Association of Bar Related Insurance Companies (NABRICO). Our second type of source is reports published by six of these insurers:58 Minnesota Lawyers Mutual Insurance Company (MLMINS),59 the Wisconsin Lawyers Mutual Insurance Company (WILMIC),60 Lawyers Mutual Insurance Company (of North Carolina—LMICNC),61 Lawyers Mutual Insurance Company of Kentucky (LMICK),62 the Bar Plan Mutual Insurance company (BPMIC),63 and the
53 Eleven of the fourteen members of the National Association of Bar-Related Insurance
Companies (NABRICO) contributed to the 2008-2011 study; there were eight commercial insurance companies contributing, but we have no information on the number of commercial companies writing lawyers professional liability insurance during the period covered by the study. We sought to determine what proportion of the claims covered in the 2008-11 report came from NABRICO companies, but SCLPL would not provide that information. Two of the people we contacted in seeking this information expressed the view that more of the cases came from the NABRICO companies than from the commercial companies.
54 It would be nice to be able to say what percentage of the market for legal malpractice insurance the participants have, but that information is not readily ascertainable.
55 The specific participating companies vary from report to report. 56 Standing Committee on Lawyers’ Professional Liability, Profile of Legal Malpractice
Claims, 2008-2011 (2012) [henceforth “SCLPL 2008-2011”]. 57 Baker and Swedloff, supra note 16. 58 We sought to locate reports from the remaining bar-related insurers but as best we can
tell none of the others publish reports with data about claims experience. 59 See https://www.mlmins.com/ [hereinafter MLMINS]; MLMINS writes insurance in
15 states, mostly in the Midwest. 60 Report for 2013 located at https://www.wilmic.com/data/AnnualReport.pdf (last
visited April 21, 2015) [hereinafter “WILMIC”]. 61 Claims figures located at http://www.lawyersmutualnc.com/annual-report/2013/year-
in-review/claims-charts, (last visited April 21, 2015) [hereinafter “LMICNC”]. 62 Report for 2013 located at
http://www.lmick.com/_resources/documents/financials/2013_annual_report.pdf (last visited April 21, 2015) [hereinafter “LMICK”].
63 Report for 2013 located at http://www.thebarplan.com/wp-content/uploads/The-Bar-Plan-2013-Annual-Report.pdf (last visited April 22, 2015) [hereinafter “BPMIC”]. As of 2013, BPMIC writes legal malpractice insurance in Missouri, Kansas, New Mexico, Indiana,

12 WHEN THE LAWYER SCREWS UP [29-Jun-15
Oregon State Bar Professional Liability Fund (OSBPLF) which is the provider of the mandatory malpractice insurance for all lawyers serving private clients in Oregon.64 Given the relatively small amount of change over time, we focus on the reports published for 2013 which is the most recent year for which reports are available from these companies; some reports cover just the most recent year, some show the last five years, and some show claims experience from the inception of the company.
Baker and Swedloff have compiled information from the reports of the Attorneys’ Liability Assurance Society (ALAS). While the information they were able to distill from the ALAS reports is limited, it does provide a sense of how claims brought against large firms differ from claims brought against the much larger number of lawyers in solo and small-firm practices. We draw on this information plus some of our own examination of materials published by ALAS.
We were also able to obtain some information from Aon. As part of its underwriting process Aon collects data on the claims experience of their clients and assists clients in managing and resolving claims that arise. One of the managing directors of the group working with clients handling claims prepared some statistical information concerning the claims experience of those clients; a set of Powerpoint slides summarizing that information was made available to us.65 We draw on some of the information in those slides in the discussion that follows.
C. Data reported to state insurance regulators
We found two states that require insurers to report claim-level information regarding some or all legal malpractice claims brought against lawyers and firms in their states that allowed access to some form of the claim-level data.
Since approximately 1988 legal malpractice insurance carriers writing policies in Missouri are required to report all claims to the Missouri Department of Insurance, Financial Institutions & Professional Regulation (DIFP). The Statistics Section of DIFP publishes a detailed report each year typically going back ten years.66 DIFP generously made the data available for
and Tennessee
64 Report for 2013 located at https://www.osbplf.org/assets/documents/annual_reports/2013%20Annual%20Report%20FINAL.pdf [hereinafter “OSBPLF”]
65Douglas Richmond, The Law Firm Liability Terrain and the Aon Claims Experience, prepared for the Law Firm General Counsel Roundtable, May 2015.
66 The reports carry the title “[Year] Missouri Legal Malpractice Insurance Report”; the most recent report can be accessed at http://insurance.mo.gov/reports/legmal/ (last visited April 23, 2015)

29-Jun-15] WHEN THE LAWYER SCREWS UP 13
analysis. One insurer, Bar Plan Mutual (BPMIC), is the dominant lawyers’ professional liability (LPL) insurer in Missouri, with a market share exceeding 70 percent in recent years. Typically only one or two other insurers have as much as 20 percent of the market.67 BPMIC is even more dominant with regard to the claims reported to DIFP. Over the history of the reporting requirement BPMIC claims comprise 79.4 percent of all claims; on a year-to-year basis, BPMIC’s share of claims has ranged from a low of 61.2 percent to a high of 93.2 percent.68
Since approximately 1981 Florida law has required Lawyers’ Professional Liability (LPL) insurers to report claim-level information to the Florida Office of Insurance Regulation (FLOIR). Through 1997 insurers had to report all claims regardless of whether a payment was made to the claimant; since sometime in 1998 insurers have been required to report only those claims that either involved a payment to the claimant or expenses of $5,000 or more. Late in 1994 FLOIR changed the reporting form adding information not included on the original reporting form. Examining the data for the early period it appears that there may have been some changes to the original form in the mid-1980s; prior to that time there is little or no information on the area of practice generating the claim. These various quirks place some limits on the analyses we can do.69
D. Trial outcome data
Our final data sources are two sets of data on the outcomes of legal malpractice cases that reached a verdict or judgment at trial. The National Center for State Courts (NCSC) conducted a series of studies—1996, 2001- and 2005—conducted on behalf of the U.S. Justice Department’s Bureau of Justice Statistics (BJS) which involved collecting data on civil verdicts in a sample of the 75 largest counties for the years 1996 (45 counties) and 2001 (46 counties); for 2005 the study was extended to include, in addition to a sample of 46 of the 75 largest counties, a sample of 110 less populous counties.70 Three studies include a total of 54,494 verdicts from jury or bench
67 2013 Missouri Report at 93; 2009 Missouri Report at 89. 68 Figures provided to Herbert Kritzer by Rachel Crowe (DIFP), April 29, 2015. Note
that the annual range figures omit 1987 when BPM was just getting started; that year BPM comprised only 37.6 percent of claims but the next year the percentage was up to 82.9 percent.
69 The dataset we obtained from FLOIR contained information on 9.651 claims; 51 of those claims had been resolved in the early months of 2015, and we have excluded them from our analyses.
70 Information study designs and selected results from these studies can be found in Carol J. DeFrances & Marika F.X. Litras, Civil Trial Cases and Verdicts in Large Counties, 1996, (1999) [available at ;Thomas H. Cohen, Contract Trials and Verdicts in Large Counties, 2001 (2005) [available at http://www.ojp.usdoj.gov/bjs/pub/pdf/ctvlc01.pdf];

14 WHEN THE LAWYER SCREWS UP [29-Jun-15
trials; 34,613 of these verdicts were from tort trials. The coding of case type allows us to zero in on legal malpractice trials, and we found a total of 156 legal malpractice trials across the three studies.71
The second data source is limited to verdicts in jury trials. The publisher of the (Illinois) Jury Verdict Reporter (IJVR) generously made available to us summaries of all verdicts in legal malpractice cases reported to IJVR between 1988 and 2014.72 This constituted a total of 103 verdicts.73 Working from the published reports we coded which side won, the area of practice producing the claim, and the amount of any award, both before and after any offset. As with the other sets of data we have used, we have adjusted all dollar figures to 2010 dollars.
We also distilled some information on trials from the FLOIR data discussed previously. While the post-1997 data only include claims that resulted in a payment to the claimant or at least $5,000 in claim expenses, we believe that virtually no legal malpractice claim could be tried with less than
Lynn Langton & Thomas H. Cohen, Civil Bench and Jury Trials in State Courts, 2005, No. NCJ 223851 (2008) [http://bjs.ojp.usdoj.gov/content/pub/pdf/tbjtsc05.pdf]..
71 A study limited to jury verdicts had previously been conducted covering verdicts from 1992; see Carol J. DeFrances, et al., Civil Jury Cases and Verdicts in Large Counties, (1995); the coding in that study lumped all professional malpractice cases other than medical malpractice into a single category.
72 This reporter, which is now published by the Law Bulletin Publishing Company (see https://www.lawbulletin.com/legal/jury-verdict, last visited May 2, 2015), started life in 1959 as the Cook County Jury Reporter (CCJRV). In 1973 the coverage of the publication was extended to the rest of Illinois; the coverage for downstate counties is likely to be less complete than for the counties around Chicago. Importantly, the coverage of bench trials is minimal (email from John Kirkton to Herbert Kritzer, May 8). Most of the trials reported in IJVR were jury trials; only 7 of the 103 cases involved bench trials. This reporter is the source for the earliest systematic studies of jury verdicts conducted by the RAND Institute of Civil Justice; see MARK A. PETERSON & GEORGE L. PRIEST, THE CIVIL JURY: TRENDS IN
TRIALS AND VERDICTS, COOK COUNTY, ILLINOIS, 1960-1979 (1982);Audrey Chin & Mark Peterson, Deep Pockets, Empty Pockets: Who Wins in Cook County Jury Trials, (1985); Audrey Chin & Mark A. Peterson, Fairness in Civil Jury Trials: Who Wins, Who Loses in Cook County, (1983); Erik Moller, Trends in Civil Jury Verdicts Since 1985, (1996); MARK
A. PETERSON, CIVIL JURIES IN THE 1980S: TRENDS IN JURY TRIALS AND VERDICTS IN
CALIFORNIA AND COOK COUNTY, ILLINOIS (1987);MICHAEL SHANLEY & MARK A. PETERSON, COMPARATIVE JUSTICE: CIVIL JURY VERDICTS IN SAN FRANCISCO AND COOK
COUNTIES, 1959-1980 (1983);Seth Seabury, et al., Forty Years of Civil Jury Verdicts, 1 J. EMPIRICAL LEGAL STUD. 1 (2004).
73 As a point of comparison, IJVR’s data base includes 3,802 verdicts in medical malpractice cases during the same period. Email from John Kirkton to Herbert Kritzer, February 11, 2015. The legal malpractice verdicts we received included the abuse of process case brought by Lexecon against the Milberg law firm and several of its former partners (e.g., William Lerach), plus one case that did not actually produce a verdict but settled after the jury deadlocked. We have not included those cases among the 103, and they are not included in the analysis that we present.

29-Jun-15] WHEN THE LAWYER SCREWS UP 15
$5,000 in defense costs. We found in the FLOIR a total of 190 legal malpractice claims between 1981 and 2010 that appear to have gone to trial. For purposes of comparisons of trial rates, we also draw upon statistical reports published by the Administrative Office of the Court in New Jersey which contain detailed figures on the incidence of trial for various types of cases, including a “professional malpractice” category that lumps all professional malpractice other than medical into a single category.74
IV. CLAIM RATES
In the ideal world we would have information on the incidence of legal malpractice and with that information we could examine the rate at which such incidents matured into claims. This has been done for hospital-based medical malpractice by reviewing samples of hospital records to identify the frequency of negligence occurring in that setting.75 Unfortunately, there is no practical way to review large numbers of files of legal matters, and even if it were possible, those files might not document or otherwise reveal many of the types of errors that would constitute legal malpractice. What is possible is to look at the rate of claims on a per capita basis, and that is what we do in this section.76
Information from several of the insurance company reports allow us to estimate claim rates. Two of the companies, LMICK and WILMIC, report frequency of claims per 100 lawyers insured; both provide figures for 2009 through 2013. WILMIC shows rates ranging from about 3.75 to 4.75 100 lawyers while for LMICK the corresponding rates range from 2.71 to 3.79 claims for 100 lawyers.77 The LMICK reports shows figures for “incidents,” “claims”, and “total” (i.e., the sum of incidents and claims); presumably incidents are situations reported to LMICK or inquiries received by LMICK that do not mature into an actual claim. A representative at WILMIC told the first author that the same practice is used by that company.78 Incidents that
74 The latest report posted on the Administrative Office of the Court website, is for 2014
and the earliest is for 2004; see http://www.judiciary.state.nj.us/quant/index.htm, last visited May 1, 2015.
75 See Baker, supra note 16, at 24. 76 Another approach, in theory, would be to try to measure the incidence of legal
malpractice claims against the number of legal events or transactions (e.g., number of personal injury claims, number of real estate transactions, number of divorces, number of wills written, number of estates probated, etc.); again, with a few possible exceptions, there is no practical way to do this because information on the base that would need to be used is not readily available.
77 WILMIC, supra note 60, at 14. LMICK, supra note 62 at 2. 78 Telephone conversation between Herbert Kritzer and Brian Anderson (Claims
Counsel at WILMIC), April 21, 2015.

16 WHEN THE LAWYER SCREWS UP [29-Jun-15
do not mature into claims at these companies do not get used in the calculation of claim rate.
The claims rates experienced by OSBPLF are much higher. The OSBPLF reports show the number of claims, and the director of OSBPLF kindly provided us with number of insureds for 2011, 2012, and 2013.79 Based on those figures, OSBPLF’s claim rate was about 12 per 100 insureds, three to four times higher than reported by either LMICK or WILMIC. We can only speculate as to why the claim rate is so much higher. The fact that all private practice lawyers have to be insured may encourage disgruntled clients to bring claims because clients may know that insurance is mandatory. In fact something on the order of half of the claims in Oregon are brought directly by claimants.80 It could also be that lawyers in the other states who are most likely to face malpractice claims do not seek coverage or may even be denied coverage.
We can also use the data reported to the insurance regulators to obtain estimates of claim rates per 100 private practice lawyers for certain years: 1985, 1991, and 1995 for Florida,81 and 1995, 2000, and 2005 for Missouri. For each year, we averaged the number of claims reported for two years prior, the exact year, and two years following. We then used the number of private practitioners as reported in the periodic Lawyer Statistical Report published by the American Bar Foundation to compute number of claims per 100 private practitioners. The three rates for Florida were 2.05, 1.12, and 1.05 for the three years, and 2.28, 2.34, and 2.08 for Missouri.
The ALAS reports provide a measure of the frequency of claims experienced by large firms, measured in terms of claims per 100 insured lawyers, is much lower than is true for the insurers reporting to the ABA and the insurers for which we obtained annual reports or derived from reports to state regulators. In fact, the claim rate is so much lower that ALAS reports it in terms of claims per 1,000 lawyers rather than per 100 lawyers. The claim rate for ALAS insureds peaked at about 10.5 claims per 1,000 lawyers in the early 1990s, and has been varying between about 6.5 and 8.5 per 1,000
79 Figures provided in an email to Herbert Kritzer from Carol Bernick, February 18,
2015. We should note here that, as is true at LMICK and WILMIC, OSBPLF distinguishes between claims and what OSBPLF incidents which OSBPLF labels “suspense files”; email from Carol Bernick to Herbert Kritzer, April 6, 2015.
80 Email from Carol Bernick to Herbert Kritzer, April 20, 2015; 411 of something around 850 claims in 2014 were pro se or pro per.
81 As explained supra note 69, the reporting requirements in Florida changed after 1997 such that only paid claims and unpaid claims involving at least $5,000 in expense are reported to the regulator; hence, while we have data on paid claims in Florida after that time, we do not have data to compute a claim rate.

29-Jun-15] WHEN THE LAWYER SCREWS UP 17
lawyers since about 2000.82 For the insurers we discussed above the claim rate per 1,000 insured lawyers ranged from about 25 to 120.
The information we have from Aon refers not to claims but to “notices.” This refers to having some notice that there is or might be a claim; the notice can come from the insured or from a potential claimant. The approximately 275 firms that insure through Aon clients have roughly 68,000.83 Between 2004 and 2013, Aon clients reported an average of 662 notices each year. Combining the estimate of the number of insured lawyers with the average number of notices produces an estimated yearly rate of 9.7 notices per 1,000 lawyers, a figure that is slightly larger for Aon than the numbers reported by ALAS, although the different probably reflects that Aon includes all notices while ALAS restricts its count to “real” claims.
The lower figures for the ALAS and Aon may be misleading because while each lawyer in a firm is covered by the firm’s liability policy, the claims against large firms are frequently, if not usually, against the firm rather than an individual lawyer as is the case with solo practitioners and likely to be the case in most claims against small firms where lawyers do not collaborate on most matters. In contrast, in the firms insured through ALAS and Aon there will normally be teams of lawyers working on a matter. If one could count all lawyers involved in a matter resulting in a claim, the claim rates for ALAS and Aon would probably be less different compared to the claim rates experienced by the insurers handling the lower end of the market. Ideally, one might want to have a measure of claim rate based on number of matters handled rather than number of lawyers; if such a measure were available, it might well be the case that large firms experienced more claims per 100 matters handled than do small firms and solo practitioners. Getting such a measure raises a range of issues, most prominently defining what exactly counts as a “matter” when there is ongoing representation.
V. SOURCES OF CLAIMS In this section we consider the areas of practice, law practice setting, and
characteristics of individual lawyers against whom claims are brought. A. Areas of practice producing claims, including possible change over time
The ABA’s SCLPL reports have employed a consistent categorization of areas of practice in reporting the areas that tend to produce claims. The Figure 1 visually displays the areas producing at least four percent of the claims in
82 Baker and Swedloff, supra note 16., at {Figure 6}. 83 Email to Herbert Kritzer from Douglas Richmond, June 26, 2015.

18 WHEN THE LAWYER SCREWS UP [29-Jun-15
at least one of the reporting periods.84 The figure shows that, with one exception, the top two areas of practice producing claims are real estate and family law; the one exception is the 1992-95 report for which our combined category of commercial transactions plus corporate/business organizations surpasses real estate. While there is variation from one report to another, the overall pattern is fairly consistent. Averaging the percentages across the six reports produces the following:
21.4% real estate 18.6% personal injury - plaintiff 11.7% commercial transactions plus corporate/business organization 9.9% family law 8.7% estates, trust and probate 8.5% collections and bankruptcy 4.5% personal injury – defense 4.4% criminal 12.5% all other areas of practice
84 We draw on the table prepared by Baker and Swedloff, supra note 16, in generating
this figure. We have collapsed the categories of “corporate/business organization” and “business transactions/commercial” into the category we have labeled “corporate/commercial.” The other areas of practice identified in the SCLPL reports are Labor Law; Worker's Compensation; Patent, Trademark, Copyright; Taxation; Civil Rights Discrimination; Immigration/Naturalization; Construction (Building Contracts); Local Government; Government Contracts/Claims; Securities (S.E.C.); Consumer Claims; Natural Resources; Environment Law; Admiralty; Antitrust; and International Law.

29-Jun-15] WHEN THE LAWYER SCREWS UP 19
Figure 1: Areas of Practice Generating Claims, SCLPL Reports
Turning to the reports produced by the NABRICO insurers, for four of the five companies that report information on area of practice the top areas of practice producing claims are the same as reported in the ABA’s composite studies: real estate, personal injury litigation (LMICNC lumps all litigation other than criminal and family law together), family law, trusts and estates (T&E), and bankruptcy and collections. For three of the four reports real estate and personal injury are the top two; for OSBPLF real estate drops to fourth place with personal injury and family law tied as the most frequent areas. A higher proportion of claims for the Oregon insurer involve business transactions/commercial law or criminal law than is true for the other three insurers. The higher proportion of business-related claims probably reflects the fact that all firms in Oregon insure through OSBPLF while the focus on solo and small firms for the other three insurers means that a smaller proportion of their insureds handle business transactions or commercial work. The proportion of criminal cases probably reflects the fact that many criminal defense lawyers in other states do not carry malpractice insurance, which in turn undoubtedly discourages lawyers from agreeing to represent former clients of criminal defense lawyers.
Using the data from Missouri’s DIFP, Figure 2 shows how the nature of the underlying legal area has varied over time among the most prominent areas for claims. Similar to what we did with the SCLPL data, in this figure
0%
20%
40%
60%
80%
100%
1983-85 1992-95 1996-99 2000-03 2004-07 2008-11
Source: Data compiled from SCLPL Reports by Baker and Swedloff
Real Estate Personal Injury - Plaintiff Personal Injury - Defense
Family Law Estate, Trust & Probate Collection & Bankruptcy
Commercial Trans. + Corporate Criminal Other

20 WHEN THE LAWYER SCREWS UP [29-Jun-15
we combine what DIFP labels “Corporate and Business Organizations” with the category “Business Transactions/Commercial Law.” The other categories shown in the figure are real estate, trusts & estates (T&E), family law, collections and bankruptcy, and an “other” category which combines a wide range of areas, none of which represents more than four percent of the cases in the dataset. There are some trends worth noting. First, plaintiffs’ personal injury has declined as a proportion of claims slightly in recent years, with collections and bankruptcy increasing. The latter is not surprising given the economic crisis of 2008-09. The last few years have also seen an increase in the percentage of real estate cases; again that is not surprising given the economic crisis, and it is interesting that the recent level for real estate is similar to the late 1980s when the S&L crisis occurred. There also a decline in T&E cases, perhaps due in part to the more limited inheritance tax now in operation.
Figure 2 Areas of Practice Producing Claims, 1988-2013, Missouri Data
BPMIC reports open claims rather claims received or claims closed and
their figures show a slightly different distribution of areas of practice involved in currently open claims as compared to the claims patterns of the other companies. The highest percentage of cases (19 percent) involve collections and bankruptcy followed by real estate and plaintiffs’ personal injury both at 15 percent. The next three areas are corporate and business organizations (13 percent), T&E (12 percent), and family (11 percent). It is
0%
20%
40%
60%
80%
100%
1990 1995 2000 2005 2010
Real Estate Trusts & Estates Family Law PI-Plaintiff
Collections/Bankruptcy BA/Corp & Commercial Other

29-Jun-15] WHEN THE LAWYER SCREWS UP 21
possible that this distribution reflects that BPMIC may have a larger proportion of lawyers in firms of the size that handle commercial matters—the 2013 report notes that “67% of Missouri lawyers choose The Bar Plan for Lawyers’ Professional Liability Insurance.”85
Given the difference in the types of firms ALAS and Aon work with, it is not surprising that the areas of practice producing claims for ALAS and Aon are very different than for the insurance claims coming to the NABRICO companies whose insureds are dominated by solo practitioners and small firms. The simple reason for this is that large corporate firms do not handle any, or significant numbers of, the kinds of matters that produce large percentages of claims against solo and small firms. The two large areas for claims against large firms as indicated by the ALAS reports and the Aon materials were litigation (presumably a combination of corporate litigation and defense of major product liability claims and major consumer claims) and corporate/transactional.
For ALAS litigation has constituted 39 percent of claims between its founding in November 2014, with the corporate/transactional accounting for 26 percent of claims. Real estate and trusts and estates each account for 7 percent of claims with 3-4 lesser percentages for other areas of practice, including intellectual property, bankruptcy, tax/ERISA and securities.86 While litigation comprised 39 percent of claims, it accounted for only 17 percent of ALAS’s accumulated loss payments.87 In contrast, corporate/transactional which comprised 29 percent of claims accounted for 41 percent of accumulated losses. The contribution of securities-related claims to accumulated losses was 11 percent compared to only 4 percent of claims. Each of the remaining categories accounts for 6 percent or less of the accumulated loss.88
For the firms insuring through Aon, between 2004 and 2013 litigation comprised 31.7 percent of notices while corporate/transactional accounted for 21.4 percent. Similar to ALAS’s experience, these reverse in terms of loss. For Aon’s clients, corporate/transactional accounted for 39.6 percent of the total loss, including amounts paid as part of self-insured retentions, while
85 BPMIC, supra note 63. The quote can be found on the second page of the report; the
statistics discussed above can be found on the sixth page (the pages of the report are unnumbered).
86 ALAS 2014 Annual Report, at 12; report found at http:///www.alas.com/public/AnnualReport 2014.pdf, last visited June 21, 2015)
87 For both ALAS and Aon the loss figures include both indemnity paid to the claimant and costs of defense; the loss figures are a given time also include actual expenditures and amounts held in reserve in connection with pending claims. One difference between ALAS and Aon is that ALAS does not include amounts covered by an insured’s self-insured retention (deductible) while Aon does.
88 Id.
22 WHEN THE LAWYER SCREWS UP [29-Jun-15
litigation accounted for 17.7 percent of losses. Real estate constituted 8.6 percent of notices and 8.6 of accumulated losses; securities issues were only 2.4 percent of notices but accounted for 6.1 percent of losses. It is important to note that the categories used by ALAS and Aon are not exactly the same, and some of the differences may reflect similarly sounding categories that are slightly different in actual content.
The differences in the claims/notices we see with ALAS and Aon compared to our other sources reflects the two hemispheres issue. While some of the other sources include the kinds of firms handled by ALAS and Aon, the bulk of the insureds covered by the vast majority of firms reporting claims to PLF (Oregon), FLOIR (Florida), and DIFP (Missouri) are geared more toward the personal services sector than the corporate sector. Hence it is not surprising that we find the claims reported by ALAS and Aon are predominantly corporate in nature with less than 10 percent dealing with family law or trusts & estates, and essentially no plaintiffs’ personal injury matters or criminal matters.
B. Size of firms/practices producing claims The SCLPL reports include information on the practice size from which
claims come. The last four reports used a common set of categories; the 1992-95 report collapsed solo practitioners with firms of two to five lawyers, and the 1983-85 report used a different set categories. Figure 2 shows the distribution of practice sizes producing claims for all but the 1983-85 report.89 The report shows clearly that solo practitioners and firms of less than 5 account for the majority of claims with the combined percentage ranging between 61 percent and 73 percent, with firms of 6 to 10 accounting for another 10 percent of the claims. Roughly equal numbers of claims come from solo practitioners and firms of two to five lawyers. Firms of 100 or more account for 8 to 11 percent of claims except in the 1999 study when they generated less than 3 percent. The variations from report to report do not suggest any kind of trend and most likely reflect differences in the variation in which insurers chose to provide data for a given report.
Clearly the bulk of the claims appear to come from solo and small firms. However, it is important to keep in perspective the distribution of practice settings for private practitioners. The American Bar Foundation published four editions of the Lawyer Statistical Report covering the profession in 1991, 1995, 2000, and 2005.90 According to those reports, solo practitioners comprised between 45 and 49 percent of lawyers in private practice; lawyers in firms of two to five were 14 to 15 percent of private practitioners and lawyers in firms of two to ten were 20 to 23 percent. Large firm lawyers,
89 The data Figure 2 come from the 2008-11 SCLPL report, at. 8. 90 Unfortunately, the Bar Foundation discontinued the statistical reports after 2005.

29-Jun-15] WHEN THE LAWYER SCREWS UP 23
those in firms of over 100 lawyers, comprised 12 to 15 percent of private practitioners. Comparing the claim sources to the distribution of practice settings, claims from large firms are only slightly under represented. The group that is most under represented is in fact solo practitioners while the most overrepresented group is small firms with two to ten lawyers, particularly the firms with two to five lawyers.
Also important is that the SCLPL figures are from insurers that voluntarily participate in the data collection many, probably most, of which focus specifically on solo and small firm practitioners. This means that larger firms may be underrepresented in the SCLPL figures. Because the Missouri Department of Insurance, Financial Institutions, and Professional Regulation requires all insurers writing legal malpractice policies in Missouri to report claims, their data avoids the problem of some insurers, particularly insurers of large firms, not being included.
The DIFP’s uses four categories of practice size: solo, 2-5, 6-30, and more than 30. Table 1 shows, among other things, the number and percentage of the claims reported to DIFP coming from each of those categories. Almost exactly two thirds (66.4 percent) of the claims come from practices with five or fewer lawyers, a figure that is consistent with the SCLPL figures. In contrast, substantially fewer claims from the largest firm category: just under five percent come from firms of more than 30 lawyers. According to various issues (1995, 2000, and 2005) of the Lawyer Statistical Report, the proportion of Missouri private practitioners in practices of five or fewer lawyers is somewhere between 51.5 and 56.9 percent. The DIFP data show that the largest share of claims, 40 percent, come from small firms with between two and five lawyers; lawyers working in these settings comprise 16 to 18 percent of private practitioners according to the Lawyer Statistical Reports. The large firm categories in those reports do not match the categories used by DIFP, but it is noteworthy that while those reports show between 15.3 and 21.5 percent of Missouri’s private practitioners in firms of more than 50 lawyers, only 4.9 percent of the legal malpractice claims come from firms of more than 30 lawyers. The other underrepresented group appears to be solo practitioners, who comprise between 32.7 and 40.9 percent of private practitioners in Missouri.

24 WHEN THE LAWYER SCREWS UP [29-Jun-15
Table 1 Relationship between Firm Size, Claims, and Claim Payments
Missouri Data
Both the SCLPL data and the DIFP data show that solo practitioners are
quite underrepresented as a source of legal malpractice claims. Exactly why this is the case is not clear. However, at least part of the underrepresentation might reflect that a disproportionate share of solo practitioners choose to forego LPL insurance, and hence would not appear in any reports provided by insurers. As noted in Part I of this paper, a survey in Texas found that almost two-thirds of solo practitioners in that state were uninsured.91
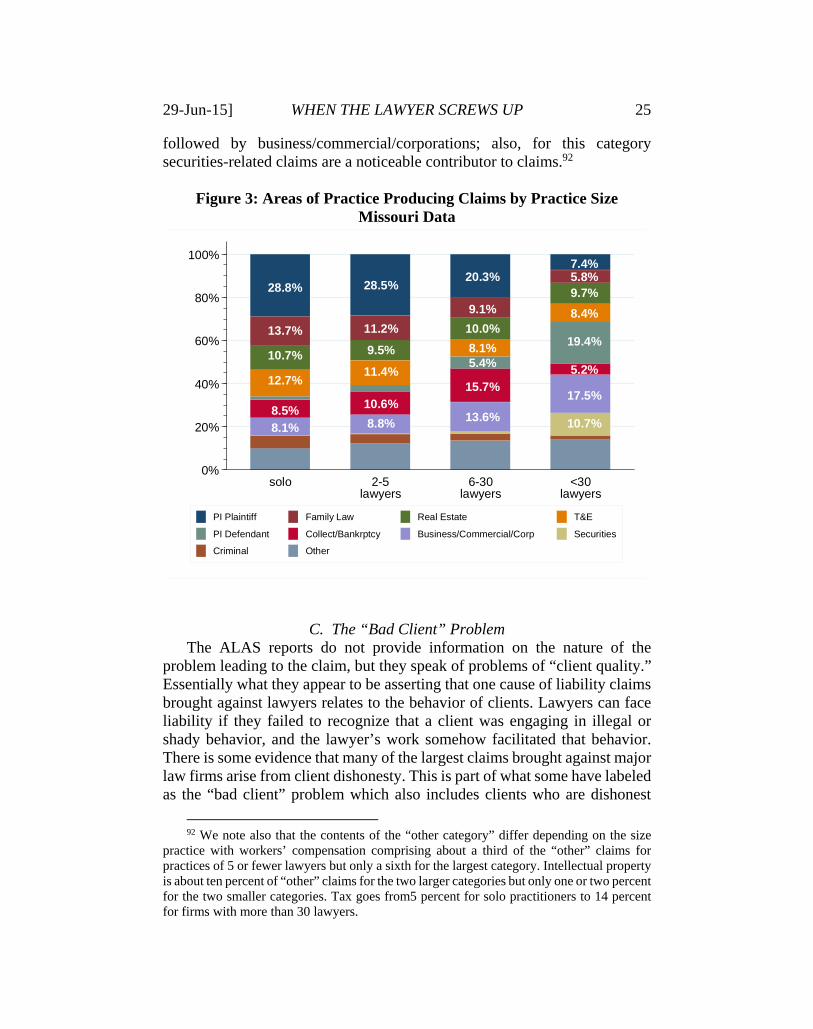
Not only are there differences in the claim rates depending on the size of practice, but there are also differences in the areas of practice producing claims. Figure 3 shows the area of practice producing claims for each size practice identified in the Missouri data. The patterns for solo and lawyers in firms of 2-5 are similar with plaintiffs’ personal injury producing the largest proportion of claims and family law the second largest (leaving aside the “other” category). In the 6-30 lawyer setting, plaintiffs’ personal injury is still the largest proportion of claims, but the second and third largest categories are collections/bankruptcy and business/commercial/corporations. For the category of the largest firms, greater than 30 lawyers, the differences are even greater: personal injury defense is the largest source of claims
91 One other possibility is that the method employed by the American Bar Foundation
to determine the practice size for each lawyer may count as solo practitioners a significant number of lawyers in small firms of two to five lawyers.
Firm Size% of
Claims % Paid n Mean Paid Median Paid nsolo 26.4 26.2 1,662 $52,964 $24,351 4262-5 40.0 26.5 2,516 $108,257 $33,651 6666-30 28.6 21.8 1,799 $188,300 $47,152 392>30 4.9 17.9 308 $670,249 $135,301 55All 100.0 24.7 6,285 $132,904 $34,376 1549
test statistic 22.31a 29.84b 55.97c
p-value <.001 <.001 <.001achi square (contingency table)bF statistic (oneway ANOVA); Kruskal Wallis Rank test, chi square=90.72, p<.001cchi square (k-sample equality of medians test)
All monetary values inflation adjusted to 2010 dollars.
29-Jun-15] WHEN THE LAWYER SCREWS UP 25
followed by business/commercial/corporations; also, for this category securities-related claims are a noticeable contributor to claims.92
Figure 3: Areas of Practice Producing Claims by Practice Size
Missouri Data
C. The “Bad Client” Problem The ALAS reports do not provide information on the nature of the
problem leading to the claim, but they speak of problems of “client quality.” Essentially what they appear to be asserting that one cause of liability claims brought against lawyers relates to the behavior of clients. Lawyers can face liability if they failed to recognize that a client was engaging in illegal or shady behavior, and the lawyer’s work somehow facilitated that behavior. There is some evidence that many of the largest claims brought against major law firms arise from client dishonesty. This is part of what some have labeled as the “bad client” problem which also includes clients who are dishonest
92 We note also that the contents of the “other category” differ depending on the size
practice with workers’ compensation comprising about a third of the “other” claims for practices of 5 or fewer lawyers but only a sixth for the largest category. Intellectual property is about ten percent of “other” claims for the two larger categories but only one or two percent for the two smaller categories. Tax goes from5 percent for solo practitioners to 14 percent for firms with more than 30 lawyers.
28.8% 28.5%20.3%
7.4%
13.7% 11.2%
9.1%
5.8%
10.7% 9.5%
10.0%
9.7%
12.7%11.4%
8.1%
8.4%
5.4%
19.4%
8.5% 10.6%
15.7%
5.2%
8.1% 8.8% 13.6%
17.5%
10.7%
0%
20%
40%
60%
80%
100%
solo 2-5lawyers
6-30lawyers
<30lawyers
PI Plaintiff Family Law Real Estate T&E
PI Defendant Collect/Bankrptcy Business/Commercial/Corp Securities
Criminal Other

26 WHEN THE LAWYER SCREWS UP [29-Jun-15
with their lawyers. Indeed some commentators have suggested that bad clients may be the “number one cause of legal malpractice actions.”93
Lawyers’ professional liability (LPL) insurance policies normally cover claims of this type in addition to more traditional types of negligence or contract claims. This means that some portion of the claims handled by insurers do not so much reflect traditional types of errors affecting clients (or intended beneficiaries such as heirs to an estate or beneficiaries to a trust) as claims by third parties that some failing by the lawyer allowed the lawyer’s client to engage in fraudulent activity. This is a particular problem for large firms that have found them facing liability in connection with corporate scandals such as Enron, WorldCom, and the S&L crisis of the 1980s. For 2011 ALAS incurred losses totaling $455 million; 7.3 percent was attributed solely to problems created by an “unworthy client” with another 36.5 percent attributable in part to an unworthy client.94
This is further illustrated by a short report by Douglas Richmond, a loss prevention specialist with Aon. Richmond looked at large, publicly reported verdicts and settlements in claims brought against lawyers or law firms from the mid-1980s through early 2015. He found 67 cases with payments or verdicts exceeding $20 million, with the largest verdict and largest settlement slightly over $100 million. He describes 41 of the 67 cases as being due entirely to “dishonest clients” with another four as partially resulting from “dishonest clients.”95 Richmond identified an additional 70 cases involving payments between $3 million and $20 million; 17 of these cases involved dishonest clients.96
D. Other Factors Influencing the Volume of Claims
The DIFP data from Missouri provide information on the number of years the insured had been in practice at the time of the alleged error; only three response alternatives were provide: under 4 years, 4 to 10 years and more than 10 years. The claims were heavily skewed toward the more than 10 years
93 Thomas L. Brown and Thomas P. Sukowicz, Attorney Liability Risk Management, in
ATTORNEYS’ LEGAL LIABILITY 16-9 (2014) [available at https://www.iicle.com/links/AttorneysLegalLiability12-Ch16.pdf, last visited April 23, 2015]
94 Daniel W. Smith and Robert L. Denby, Recent Trends in Lawyer Liability: An Examination of Significant Claims in Fiscal 2011, 23(2) ALAS LOSS PREVENTION J. 1, 11 (Summer 2012).
95 Richmond, supra note 65, slide 2. An earlier version of this can be found at The Law Firm Liability Terrain: Publicly Reported Settlements and Verdicts, AM. BAR ASS’N (Dec. 29, 2014), available at http://www.americanbar.org/content/dam/aba/administrative/tips/webinars/LawFirmLiabilityTerrainRichmond.authcheckdam.pdf, last visited June 28, 2015.
96 Id, at slide 3.

29-Jun-15] WHEN THE LAWYER SCREWS UP 27
category, with 87.5 percent of claims in that category, leaving 10.2 percent in the 4 to 10 year category and only 2.3 percent under four years.
The reports of Wisconsin Lawyers’ Mutual provide a more detailed breakdown of the proportion of claims by years in practice. From 1986 through 2013, that distribution is:97
11% 0-5 years 14% 6-10 years 14% 11-15 years 15% 16-20 years 14% 21-25 years 12% 26-30 years 20% 31 or more years
It is difficult to know how to interpret these figures in the absence of information on the distribution of years of experience, either among all private practitioners or among those covered by insurance. Fortunately, Minnesota Lawyers Mutual Insurance Company published some figures showing both the years of experience of all of its insureds and of the lawyers against whom claims were filed.98 Figure 4 shows these distributions. What the figure makes clear is that it is not the inexperienced lawyers who produce claims; rather it is lawyers who have been practicing 11 to 20 years who produce a disproportionate share of claims. The first SCLPL study, covering the early 1980s, did include some information on experience, and one source gave a minimal experience breakdown: 65.5 percent of claims involved lawyers with more than 10 years experience, 30.2 percent 4 to 10 years, and 4.3 percent 0 to 3 years;99 as a comparison the Lawyer Statistical Report for 1980 reported that 56.8 percent of private practitioners had been admitted before 1971,100 again suggesting that more experienced lawyers are overrepresented among those facing legal malpractice claims. An interesting question is why that is the case. It could be that this group of lawyers is the most overwhelmed by both the demands of their practice and outside demands such as those of family. It may be that this cohort of lawyers is most likely to be experiencing burnout and hence get sloppy in their work. It is
97 Wisconsin Lawyers Mutual Insurance Company Annual Report to Policyholders
2013, at 14. 98 Todd C. Scott, Who Has the Most Malpractice? Hint: It’s Not the New Lawyers, 29
(2) The View 1 (April 2013), accessible at https://www.mlmins.com/LibraryContent/April%202013%20Newsletter.pdf, last visited June 21, 2013.
99 William H. Gates, Lawyers' Malpractice: Some Recent Data About a Growing Problem, 37 MERCER L. REV. 559 (1986).
100 Barbara Curran et al., The Lawyer Statistical Report: A Statistical Profile of the U.S. Legal Profession in the 1980s (1985) 28.

28 WHEN THE LAWYER SCREWS UP [29-Jun-15
worth noting that some research on disciplinary proceedings also show that it is lawyers with some years of experience who are disproportionately likely to face disciplinary proceedings.101
Figure 4: Years of Experience for Insureds and Claim Targets
Minnesota
VI. FREQUENCY OF CLAIMS BECOMING LAWSUITS Some claims are abandoned after the claimant assesses the merits of a
claim, perhaps after some investigation by the insurer. Other claims are settled pre-suit if an insurer determines the insured was culpable and the
101 A study of disciplinary proceedings in California reported that “those disciplined are
disproportionately male, between the ages of 35-45, in practice just over tne years, and practicing in Los Angeles or Orange Counties,” Robert Fellmuth, Sixth Progress Report of the State Bar Discipline Monitor, 89-90 (1990). Another study reported that “a disproportionate number of disciplined attorneys have been in practice more than 25 years,” and that “disciplined attorneys on average are older than attorneys generally”:Patricia W. Hatamyar & Kevin M. Simmons, Are Women More Ethical Lawyers? An Empirical Study, 31 FLA. ST. U. L. REV. 785, 832 (2004). However, a study of disciplinary proceedings before one the provincial law societies in Canada found that the likelihood of disciplinary proceedings declined with experience; see Bruce L. Arnold & John Hagan, Careers of Misconduct: The Structure of Prosecution of Professional Deviance among Lawyers, 57 AMERICAN SOCIOLOGICAL REVIEW 771, 777 (1992).
9%
4%
26%24%
32%
39%
23% 22%
6%
9%
4%2%
0%
10%
20%
30%
40%
0-2 3-10 11-20 21-30 31-40 41 or more
Percentage of Lawyers Insured Percentage of Claims Received
Years of Experience

29-Jun-15] WHEN THE LAWYER SCREWS UP 29
claimant did incur a loss due to the lawyer’s negligence. Other claims get into suit, where they can be settled, dismissed on the defendant’s motion, or resolved at trial. In this section we briefly consider the likelihood of a case leading to a lawsuit being filed. An important caveat to keep in mind is that insurers may differ in what they count as a claim; for some a claim may be equated with opening a file which could occur either because the potential claimant contacted the insured or the insurer, with or without making a demand for compensation, or simply because an insured notified the insurer of an error that might lead to a claim or of some communication from a client suggesting the client believes there might be a claim.
Figure 5: Percentage of Claims in Suit, SCLPL Data
Figure 5 shows the percentage in-suit for each of the six SCLPL reports.
With one exception, between 20 and 30 percent of the claims reported to SCLPL were in-suit; the one exception is the 1992-95 report which showed 43.7 percent of claims in-suit. In contrast the most recent report of the Oregon Bar’s Professional Liability Fund showed only six percent of claims resulting in litigation; importantly, we were informed that PLF counts something as a claim only when a specific demand for money has been received from a
30.5%
43.7%
29.0%
23.8%
27.2%
20.4%
0%
10%
20%
30%
40%
In S
uit
1983-85 1992-95 1996-99 2000-03 2004-07 2008-11

30 WHEN THE LAWYER SCREWS UP [29-Jun-15
claimant.102 We can also derive estimates of the likelihood of a claim maturing into a
lawsuit using the data from the two insurance regulators. As previously noted, the Florida Office of Insurance Regulation stopped requiring reports of all claims after 1997, and consequently we can only use that data to get an estimate for 1981 thru 1997; just over half (50.6 percent) of the 5,593 claims reported to FLOIR that were closed during this period where in-suit. However, as shown in Figure 6, the fraction of closed claims (the solid line) that were in suit, varies substantially from year to year; the long-dashed line employs the LOWESS smoother,103 and suggests a tendency over time for an increasing proportion of cases getting into suit. Exactly what accounts for the year-to-year variation is not clear, although the cases-closed line, shown as the short-dashed line in Figure 5 suggests that it might be inversely correlated with the total number of claims closed; the correlation between the percent in suit and the number of claims is -.516 (p=.034).104
Figure 6: Percentage of Claims in Suit, Florida Data
Turning to the Missouri insurance data, one caveat is that the coding used 102 Email to Herbert Kritzer from Carolyn Bernick, April 6, 2015. 103 The particular smoother used is LOWESS; see William S. Cleveland, LOWESS: A
Program for Smoothing Scatterplots by Robust Locally Weighted Regression, 1 AM. STATISTICIAN 35 (1981).
104 No adjustments were made for serial correlation in computing this correlation.
200
220
240
260
280
300
Num
ber
of C
laim
s
40
50
60
70
Pe
rcen
t in
Su
it
1990 1995 2000 2005 2010 2015
Percent in Suit* Number of Claims Closed*Includes cases for which an arbitration hearing was demanded

29-Jun-15] WHEN THE LAWYER SCREWS UP 31
for disposition refers to “before filing suit or demanding hearing.” A hearing might occur if the retainer agreement contained an arbitration clause. Unfortunately, there is no way to distinguish between filing suit and seeking arbitration, and hence we will treat them here as both constituting “filing suit.” Over the period 1991 through 2013, a suit had been filed in 56.4 percent of claims reported to DIFP. There is even more year-to-year variation in the percentage of closed claims in which a suit had been filed than in the Florida data. Figure 7 shows the yearly variation. As with Figure 6, the long-dashed line employed the LOWESS smoother, but here what we see is an initial sharp drop followed by an increase in the percentage of closed claims in suit. What accounts for the variation overtime is not clear; here there is no evidence of a correlation, inverse or direct, with the number of claims (r=-.255,p=.240).
Figure 7: Percentage of Claims in Suit, Missouri Data
The variation in the proportion of legal malpractice claims becoming
lawsuits is striking, ranging from a low of 6 percent of claims made to the Oregon Bar’s Professional Liability Fund to over half of claims reported to the insurance regulators in Florida and Missouri. The aggregated figures in the SCLPL reports fall somewhere between these two extremes. Importantly, 70 percent or more of the claims in Missouri involve an insurer that also participates in the SCLPL data collection. This might lead one to wonder if some of the difference reflects what is being counted as a claim, and whether that differs between what gets reported to SCLPL and the state insurance
200
220
240
260
280
300
Num
ber
of C
laim
s
40
50
60
70
Pe
rcen
t in
Su
it
1990 1995 2000 2005 2010 2015
Percent in Suit* Number of Claims*Includes cases for which an arbitration hearing was demanded

32 WHEN THE LAWYER SCREWS UP [29-Jun-15
regulators. On the other hand, we were told that in Oregon, only situations where an actual claim is made gets counted as a claim, and there only seven percent of claims get into litigation (which we take to be the same as filing suit). The low proportion of suits among Oregon claims may indicate a very different philosophy of responding to claims, perhaps resulting from the mandatory nature of LPL insurance in Oregon and that all private practitioners must buy insurance through Professional Liability Fund.
VII. OUTCOME OF CLAIMS
In this section we turn to the outcome of claims. We consider three primary issues: the frequency of claim repair, the likelihood of a claim leading to payment, and the magnitude of the payments that are made. For the latter two questions we examine how outcomes vary along several key dimensions.
A. Frequency of Claim Repair Part of the larger research project from which this paper is drawn involved
interviews with lawyers who regularly handled legal malpractice cases plus representatives from several of the NABRICO insurers.105 One theme that came up in these interviews concerned what was termed “claim repair.” As explained in the introductory section, this refers to finding a way to fix or mitigate the problem that led to the claim. For example, during the first author’s study of contingency fee legal practice one of the firms where he observed was working with its LPL insurer to overcome the effect of having missed a filing deadline by one day due to a failure to put something into the mail.106 Ultimately, the firm was successful in arguing in an appeal of the dismissal of the case that the deadline should have been computed in a different way such that the filing was not, as a matter of law, late.
While we heard many references to claim repair in our interviews with defense lawyers and insurers, we found virtually no statistics on the frequency of claim repair. In fact, the only reports we found that specifically identified claim repair as a mode of case disposition were those published by the Oregon State Bar’s Professional Liability Fund. Those reports are based on a moving 10-year set of disposed claims. The most recent report, covering the decade ending December 31, 2013, showed that 19 percent of disposed
105 We report on the interview materials in another paper, Herbert M. Kritzer and Neil
Vidmar, “Handling Legal Malpractice Claims: Plaintiffs' Lawyers, Defense Lawyers, and Insurers,” paper prepared for presentation at the workshop on Consumer Redress When Lawyers Are Negligent, International Institute for the Sociology of Law, Oñati, Spain, July 9-10, 2015.
106 The study is reported in HERBERT M. KRITZER, RISKS, REPUTATIONS, AND REWARDS: CONTINGENCY FEE LEGAL PRACTICE IN THE UNITED STATES (2004)., although there is no discussion there of this incident.

29-Jun-15] WHEN THE LAWYER SCREWS UP 33
claims were closed after successful claim repaired. 107
B. Outcomes In this section we combine our consideration of whether any payment is
made to the claimant and the amount of those payments. As noted previously, we have endeavored to adjust all dollar amounts to 2010 dollars. As with the likelihood of a claim leading to a lawsuit, we see very substantial variation in the percentage of claims that result in payment; the variation in the amounts paid is somewhat less. 1. SCLPL Reports
Turning first to the SCLPL data. Figure 8 shows the variation from report to report in the percentage of claims where some payment was made to the claimant and our estimate of the median amount of those payments; because of the method we have used to estimate the medians,108 in this figure we show both the estimate in nominal dollars and in 2010 dollars. As the figure shows, there was considerable variation across the six reports. The percent paid peaked at 43.6 percent in the 1992-95 report, and then dropped steadily over the next three reports to 21.6 percent in the 2004-07 report before rebounding slightly to 27.6 percent in the most recent report. We cannot determine whether this variation reflects changes in the sources of the data, changes in the strength of the claims being brought, or changes in the willingness of insurers to settle claims.
107 OSBPLF, supra note 64 at 4. 108 We use the method for estimating medians from grouped data described by H.M.
BLALOCK, SOCIAL STATISTICS 63-66 (1979, Second Revised Edition). The SCLPL reports show payment amounts in a set of four categories: $1 to $10,000, $10,001 to $50,000, $50,001 to $100,000, and $100,001 or more; later reports break down the latter category further, but that does not affect our estimate of the median. However, the open-ended nature of the top category precludes us from estimating the mean payment for each report unless we were willing to make an assumption regarding the average within that open-ended category.

34 WHEN THE LAWYER SCREWS UP [29-Jun-15
Figure 8: Outcomes, SCLPL Reports
Turning to the median amounts paid, in nominal dollars there was a
steady rise over the first four reports; if one were to fit a straight line through those four and extend it to the 2008-11 report that last median would fall very close to the line. However, in the 2004-07 report there was a sharp jump in the median which had been running between $10,000 and $20,000 to about $30,000 before dropping back to $20,000 in the latest report. Looking at the inflation-adjusted figures (the short-dashed line), there is an initial drop followed by a more modest pattern of increase until the jump in the 2004-07 report. We do not have an explanation for that jump. We do note that the percentage of paid claims with payments exceeding $100,000 was fairly consistent, between 9.4 and 12.0 percent with the exception of the 2004-07 report when the percentage of payment amounts exceeding $100,000 jumped to 16.6 percent. Again, we do not have an explanation for why there would have been a jump in the 2004-07 period, although it may reflect variation in the companies participating in the report.
2. Missouri Department of Insurance, Financial Institutions & Professional Regulation (DIFP) While DIFP publishes annual reports summarizing patterns over the
previous 10 years, we report here our own analysis based on the data DIFP made available to us. Doing our own analysis allows us to adjust for inflation
$0
$10k
$20k
$30k
Me
dian
Pa
ymen
t
0%
10%
20%
30%
40%
Pe
rcen
t of C
laim
s w
ith P
aym
ents
1983-85 1992-95 1996-99 2000-03 2004-07 2008-11Report
Any Payment Median (nominal $) Median (2010 $)

29-Jun-15] WHEN THE LAWYER SCREWS UP 35
the amounts paid to claimants. The detail available in the DIFP data also allow us to look for systematic variation in the outcomes of the reported claims.
Figure 9 shows the percent of claims paid each year between 1988 and 2013 (thick line) and the median amount paid for paid claims (thin line); the broken dashed lines were produced with the LOWESS smoother. The percentage of claims paid shows a pattern of increase through the early 2000s and then levels off or slightly declines; note that there was a very sharp drop in the percent of claims that were paid in 2013; the drop-off was so sharp that we have not included it in the smoothed line because doing so has a large impact on the line. Exactly why there was such a drop-off in 2013 is not clear (and there is no explanation of it in either the DIFP report or the BPMIC report). Leaving aside 2013, the percentage of claims paid fluctuated between approximately 25 and 30 percent in recent years; there appears to have been substantially more variation in earlier years.
Figure 9
Percent Paid and Median Payment, 1988-2013, Missouri Data
The median payment, measured in constant 2010 dollars, has fluctuated
greatly from year to year. It fluctuated between about $35,000 and $40,000 between 1990 and 2007. It seemed to hit something of a trough in the 2000s but has been rising in the years since then. The smoothed line is consistent
$20k
$30k
$40k
$50k
$60k
Me
dian
Pa
ymen
t
10%
15%
20%
25%
30%
Pe
rcen
t Pai
d
1990 1995 2000 2005 2010 2015
Percent Paid Median Amount Paid
All monetary values inflation adjusted to 2010 dollars

36 WHEN THE LAWYER SCREWS UP [29-Jun-15
with this interpretation. What accounts for either the trough or the increase is unclear.
As the Table 1 above showed, the likelihood of a claim being paid decreased as the size of the firm increases. In contrast, the typical amount paid, measured both by the mean and by the median, increased with firm size. The biggest jump was in the mean amount paid by firms with more than 30 lawyers although, as the medians show, this reflects the skew in the payments by these firms. This is consistent with comments we heard from insurers to the effect that the likelihood of claims decreases as a firm size increases but the “severity” of the claims increase.109
There was little difference in the success of claims brought against lawyers with over 10 compared to those with 4 to 10 years of experience, 24.6 percent and 26.1 percent success respectively. However, for the lawyers with less than four years’ experience, the success of claims against them fell to 17.9 percent; contrasting this least experienced group to the two other groups produced a statistical test result that is on the margin of statistical significance.110 Why claims against young lawyers would be less successful is unclear, although it might be that the kinds of matters they handle tend to fall among the areas where claims tend to be less successful; we consider the relations between practice area and claim outcome below.
The form used to report claims to DIFP asks whether the claim arose in one of the insured’s normal areas of practice. One might hypothesize that the likelihood of a claim succeeding might be greater if it involved an area that was less familiar to the lawyer defendant. Only about 10 percent of claims involved a lawyer working outside of his or her usual areas of practice. About 27 percent of such claims resulted in payment compared to 25 percent of claims where the lawyer had been working in a usual area of practice, a difference for which chance variation cannot be ruled out.111
Another item on the form asks whether the claim arose after the lawyer attempted to collect a fee. This was the case for almost nine percent of the claims. Claims arising in this context were less successful, producing payments in only 16.5 percent of claims compared to 25.4 percent of claims when there was no apparent link to trying to collect a fee. This is a real difference that cannot be attributed to chance variation.112
Figure 10 shows the variation in whether a claimant recovered depending on the area of practice producing the claim. For more than half of the categories, claimants obtained a recovery in 20-25 percent of the cases. The
109 See Kritzer & Vidmar, supra note 105. 110 Chi square = 3.60, p=.058. 111 A chi square test produces a value of 1.47, far from meeting any criterion of statistical
significance. 112 Chi square = 21.38, p<.001.

29-Jun-15] WHEN THE LAWYER SCREWS UP 37
three areas that stand out are construction (contracts) with a success rate of almost 40 percent, plaintiffs’ personal injury, and workers’ compensation, with success in the latter two areas in the 30 to 35 percent range. At the bottom of the figure one finds criminal cases and cases involving issues with local government with success rates of less than 10 percent. Other areas with a success rate below 20 percent involved government contracts/claims, consumer cases, and civil rights/ discrimination cases.
Figure 10
Claim Success by Area of Practice Producing the Claim, Missouri Data
In 2010 dollars, the median indemnity payment in Missouri was $34,376
and the mean was $132,904. Amounts paid also vary substantially depending on area of practice generating the claim. Figure 11 shows separate dot plots for the mean and median amounts paid (all adjusted to 2010 dollars) for all areas of practice producing five or more paid claims. The dot plots are separate here because of the much greater range among the means; the mean for the small number of securities-related cases was so high compared to the other areas ($1.66 million) that we did not plot it. Criminal, workers’ compensation, collections/bankruptcy, family law, and cases arising from local government issues lie toward the bottom while more business-oriented areas—securities, business associations and corporations (“BA/Corp”), business transactions/commercial (“Bus/Trans/Commercial”), and intellectual property—lie toward the top of the distribution. Several areas—
5% 10% 15% 20% 25% 30% 35% 40%Percent Paid
Local GovCriminal
Civil Rights/DiscrimConsumer
Gov Contracts/ClaimsPI Defendant
Family LawSecurities
LaborBA/Corp
Real EstateCollections/Bankruptcy
ImmigrationBusTrans/Commercial
TaxIntellectual Property
Trusts &EstatesWorkers' Comp
PI PlaintiffConstruction

38 WHEN THE LAWYER SCREWS UP [29-Jun-15
labor, personal injury defense, and civil rights/discrimination—fall differently depending on whether one looks at the mean or the median.

29-Jun-15] WHEN THE LAWYER SCREWS UP 39
Figure 11 Mean and Median Amounts Paid by Area of Law, Missouri Data
$50k $100k $150k
Local GovCriminal
Collections/BankruptcyWorkers' Comp
Family LawReal Estate
PI PlaintiffTrusts &Estates
ConsumerPI Defendant
TaxConstruction
Civil Rights/DiscrimBA/Corp
Intellectual PropertyLabor
BusTrans/CommercialSecurities
Median Amount Paid
Securities-related claims omitted dueto high mean value ($1.66 million).
$100k $200k $300k $400k
CriminalWorkers' Comp
Collections/BankruptcyConsumer
Family LawLocal Gov
Trusts &EstatesPI Plaintiff
Civil Rights/DiscrimTax
LaborReal Estate
Intellectual PropertyConstruction
BusTrans/CommercialBA/Corp
PI Defendant
Mean Amount Paid
All values in 2010 inflation adjusted dollars.

40 WHEN THE LAWYER SCREWS UP [29-Jun-15
Figure 12 Variation in Payments by Area of Practice, Missouri Data
Figure 12 employs a “box-and-whisker” plot to compare the degree of variation in payments across areas of practice. The filled box shows the middle half of the data as bounded by the 25th and 75th percentiles, also known as the first and third quartiles; the distance between these two values—the length of the box, is the interquartile range which is one common measure of variation. The line inside the box represents the median value. The “whiskers” are the lines outside the box; they can extend to the highest and lowest values but not farther than 1.5 times the interquartile range below the first quartile or above the third quartile. The figure makes it clear that the amount of variation in payment differs depending upon which area of practice led to the claim, with greater variation tending to be found in business-related areas of practice and lower levels in areas geared more toward individuals. What is not shown in the figure is the large number of outliers which would be observations lying beyond the end of the whiskers.113 For example there are 64 outliers in plaintiffs’ personal injury, this reflects the large number of
113 The standard criterion used is that an outlier is any observation falling more than 1.5
times the difference between the first and third quartile either above the third quartile or below the first quartile; DAVID S. MOORE, GEORGE P. MCCABE, AND BRUCE A. CRAIG, INTRODUCTION TO THE PRACTICE OF STATISTICS 38-39 (6th ed. 2009).
$0 $100k $200k $300k $400k $500k $600kAmount Paid
CriminalCollections/Bankruptcy
Workers' CompFamily LawReal EstatePI Plaintiff
Trusts &EstatesPI Defendant
TaxConstruction
Civil Rights/DiscrimBA/Corp
Intellectual PropertyLabor
BusTrans/CommercialSecurities
All values adjusted to 2010 dollars.

29-Jun-15] WHEN THE LAWYER SCREWS UP 41
plaintiffs’ personal injury cases (545 out of 1,516 or 36 percent), and there are other areas where the outliers constitute a higher proportion of paid cases. For example, while the 64 outliers among cases arising from plaintiffs’ personal injury matters constitute 11.7 percent of those cases, among cases arising out of defendant’s personal injury 10 out of 46 paid cases (22.7 percent) are classified as outliers.

42 WHEN THE LAWYER SCREWS UP [29-Jun-15
Figure 13 Mean and Median Amounts Paid by Type of “Error”, Missouri Data
$10k $20k $30k $40k $50k $60k $70k
Mal prosecution/abuse of processClerical error
Lost file, document or evidenceFraud
Improper withdrawal from rep.Failure to calendar properly
Error in math calculationError in public record search
Failure to react to calendarFailure to know correct deadline
OtherFailure to file docs (no deadlin
Procrastination/lack of followupInadequate discovery of factsFailure communicating with C
Failure to know or apply lawDid not follow C's instructionsFailure re tax consequences
Planning or strategy errorConflict of interest
Violation of civil rights
Median Amount Paid
Actual mean for Fraud is $522k
$100k $200k $300k
Mal prosecution/abuse of processClerical error
Improper withdrawal from rep.Error in math calculation
Error in public record searchFailure to react to calendarFailure to calendar properly
Failure to file docs (no deadlinFailure to know correct deadline
Failure re tax consequencesDid not follow C's instructions
OtherProcrastination/lack of followup
Failure communicating with CInadequate discovery of facts
Violation of civil rightsPlanning or strategy error
Failure to know or apply lawLost file, document or evidence
Conflict of interestFraud
Mean Amount Paid
All values in 2010 inflation adjusted dollars
29-Jun-15] WHEN THE LAWYER SCREWS UP 43
As shown in Figure 13 amounts paid also vary substantially by the nature of the error. Conflict of interest stands out as at near the top both in terms of its mean and median, and would have the highest mean if not for the fact that one outlier fraud case (over $11.5 million) that pushes the mean for fraud to over half a million dollars. The apparent inconsistency between the mean and median for “lost file” reflects that there are only five paid cases involving this error, and one case produced a payment of $1.35 million; without that one case, the mean of the remaining four cases is about $21,000. Perhaps of more interest is the fact that malicious prosecution/abuse of process falls at the very bottom for both the mean and the median with “clerical error” just above.
One last item of information included on the reporting form is the nature of activity that the lawyer was engaged in that produced the alleged error. Four types of activities accounted for 58.7 percent of the claims:
27.3% Commencement of action or proceeding 10.9% Preparation or transmittal of documents other than pleadings 10.6% Activities after commencement but pretrial or pre-hearing 9.9% Settlement or negotiation
Another 14.4 percent fell into an unspecified “other” category with the remaining activities accounting for from less than 10 percent of claims to almost 8 percent of claims. Figure 14 shows how the success of claims varied depending on the activity alleged to lead to the error. As the figure shows, activities related to the pretrial/pre-hearing stage of contentious matters are most likely to lead to successful claims, between about 27 and 30 percent successful. Trial, appeal, or other post-trial activities are less likely to be successful, between 15 and 18 percent successful. Settlement and negotiation fall between at about 22 percent successful. The least likely claim to be successful is one arising from a referral or recommendation of another lawyer or other professional which were successful only about 14 percent of the time. The variation between the nature of the activity leading to a claim and claim success cannot be attributed to chance variation.114
114 Chi square=81.20, p<.001 (df=14).

44 WHEN THE LAWYER SCREWS UP [29-Jun-15
Figure 14 Claim Success by Activity Producing the Claim, Missouri Data
3. Florida Office of Insurance Regulation (FLOIR) As discussed previously, through 1997 insurers had to report all claims
regardless of whether a payment was made to the claimant to FLOIR, but since sometime in 1998 insurers have been required to report only those claims that either involved a payment to the claimant or expenses of $5,000 or more. This limits our ability to look at the outcome of claims to the period when all claims had to be reported.
The Florida data have 44 distinct codes for area of practice. Some of these are not so much area of practice as they are stage of case processing: “appellate,” “Trial-Injury/Damage,” “Trial-Civil,” “Trial-Criminal.” We have collapsed the 44 codes into 18 categories plus “other.” This was most problematic regarding the “Trial-Injury/Damage” category because ideally we would want to combine that category with a combination of plaintiffs’ personal injury and defense personal injury but there was no way to determine which side the lawyer defendant represented; consequently we combined this category with “Trial-Civil” and labeled is “Civil Trial (inc. PI).” There were only seven “Trial-Criminal” cases and we combined those with other criminal cases in which we also included the “Juvenile” category. We combined
15% 20% 25% 30%Percent Paid
Referral to another prof./lawyer
Post trial or hearing
Appeal activities
Other
Trial or hearing
Title opinion
Other written opinion
Settlement and negotiation
Consultation or advice
Activity after commencing action
Related to nonadvers. proceeding
Tax reporting or payment
Investigation, nonlitigation
Related to nonpleading documents
Commencement of action

29-Jun-15] WHEN THE LAWYER SCREWS UP 45
“Banking,” “Corporate,” and “Commercial Civil Litigation” into a category we label “Corp/Commercial/Banking.” Finally we combined two administrative law categories, “Communication (FCC),” “Public Utilities,” “Constitutional,” “Immigration,” and “Social Security” into a general category of government-related cases (“Gov-related”). We use our collapsed categories to explore the success of claims, both in terms of any payment (limited to 1987-1997) and the typical amounts of payment.
Figure 15 shows the likelihood of a claimant receiving payment depending on the area of practice during the period for which the Florida data include information on both area of practice and claim success. Similar to the Missouri data, the types of claims with the highest likelihood of success were plaintiffs’ personal injury and construction with criminal matters toward the bottom. Real estate came in third. If we split both distributions more or less in half, both sources have PI-plaintiff, trusts and estates (T&E), real estate, corporate/commercial, and tax in the top half with criminal, PI-defense, and government-related in the lower half. It is important to keep in mind that the categories are only approximately comparable across the two sets of data.
Figure 15 Claim Success by Area of Practice, Florida Data, 1987-1997
10% 20% 30% 40% 50%Percent Paid
Labor/EmploymentCriminal
Gov-relatedIntellectual Property
Family LawWorkers' Comp
General PracticePI-Defendant
OtherSecurities
Trusts & EstatesBankruptcy/Collections
Civil Trial (inc. PI)Corp/Commercial/Banking
Civil RightsTax
Real EstatePI-Plaintiff
Construction

46 WHEN THE LAWYER SCREWS UP [29-Jun-15
Figure 16 The Relationship of Claim Success and Filing a Lawsuit, Florida Data,
1987-2014
As one might predict, the likelihood of success was greater for those cases
that get in suit, in part because claims are more likely to be abandoned prior to filing suit. For the period 1981-97 57.1 percent of Florida claims in which a suit was filed produced some recovery for the claimant, compared to 42.9 percent of cases that did not get so far as a suit being filed.115 In Figure 16 we track the success of claims over time. The only information for the full period, 1981-2014, is the probability that a successful claim will have gotten into suit. The thick solid line tracks this, and shows that there has been a trend of an increasing percentage of successful claims involving a law suit. A simple linear regression confirms the pattern of increase.116 For the period during which we have data for all claims, the thick dashed line in Figure 16 shows that the percentage of cases getting into suit increased more or less in parallel with the percentage of successful claims in suit.117 The thin lines represent the percentage of claims in suit that are successful (solid line) and the percent of claims not in suit that are successful (dashed lien); there is no apparent
115 Chi square=139.80, p<.001. 116 The probability that a successful claim will be suit increases about a half (0.54) a
percentage point per year; R2=.489; note that we have not adjusted for serial correlation. 117 The probability that a claim will be suit increases 0.73 percentage points per year;
R2=.253.
10%
20%
3%
40%
50%
60%
70%
80%
1980 1985 1990 1995 2000 2005 2010 2015
% of claims in suit % of paid claims in suit% of claims in suit successful % of claims not in suit successful
Short dashed lises used LOWESS smoother

29-Jun-15] WHEN THE LAWYER SCREWS UP 47
trend for claims not in suit but there is a trend of increasing success for claims in suit.118 Unfortunately, the fact that Florida limited data collection for unsuccessful claims after 1997 to those with at least $5,000 in expenditures leaves us no way of knowing whether the likelihood of success for claims in suit has continued to increase.
For the Florida paid cases we have information on the limits of the insurance policy. For the early data we have a figure for the “primary policy limits of the insured law firm”; for the later data we have information on the “insured per claim limit” and the “insured aggregate limit.” Almost all claims (97.9 percent) were resolved for less than the policy limits. About one and a half percent (1.4 percent) were resolved for the exact policy limits and the remaining cases—a total of 29 out of 4,602 paid claims for which we have information on the policy limits—for more than the policy limits. Exactly what accounts for the over-limits payments in Florida is unclear.119
Turning to actual amounts paid using the Florida data, we again adjusted all figures to 2010 dollars. The overall median payment is $29,903 and the mean payment is $90,964.120 Figure 17 shows annual values for the mean and median amounts paid to claimants. The top part of the figure shows the mean and medians on a common scale. There is a clear and strong upward pattern apparent for the mean but what appears to be a much weaker upward pattern for the median. However, as the bottom part of the figure makes clear once we graph the median and median on scales consistent with their individual levels, the pattern of relative increase for the mean and medians are very similar as indicated by the smoothed, dashed lines. The mean increased more sharply in the first five or so years shown in the figure, but since then the mean and median lines run very much in parallel showing a gradual increase over time. On average the median is increasing about $978 per year while the mean is increasing about $3,341 per year.121
118 The probability that a claim in suit will be successful increases 0.57 percentage points
per year; R2=.331. 119 One insurer told us that his company had encountered having to pay an over-limits
amount in Alaska where there is a two-way fee shifting rule; in such cases the insurer had to pay an additional amount to cover the fee shift to the plaintiff’s lawyer.
120 It is worth noting that in 15.6 percent of paid cases, the entire payment was covered by the insureds’ deductible.
121 These annual increase figures were estimated using a simply linear regression. The regression fits were similar for the median (R2=.554) and the mean (R2=.611).

48 WHEN THE LAWYER SCREWS UP [29-Jun-15
Figure 17 Median and Mean Amounts Paid, Florida Data, 1981-2014
$50k
$10k
$15k
$20k
$25k
Jun
k
$50k
$100k
$150k
$200kM
ed
ian
or
Me
an
Pa
yme
nt
1980 1985 1990 1995 2000 2005 2010 2015
$20k
$30k
$40k
$50k
$60k
$70k
Me
dia
n P
aym
en
t
$50k
$100k
$150k
$200k
Me
an
Pa
yme
nt
1980 1985 1990 1995 2000 2005 2010 2015
Median Amount Paid Mean Amount Paid
All monetary values inflation adjusted to 2010 dollarsDashed lines use LOWESS smoother

29-Jun-15] WHEN THE LAWYER SCREWS UP 49
Figure 18 Mean and Median Amounts Paid by Area of Law
Florida Data, 1981-2014
$20k $400k $60k $80k
CriminalBankruptcy/Collections
Family LawWorkers' Comp
Civil RightsGeneral Practice
ConstructionTrusts & Estates
PI-DefendantReal Estate
Labor/EmploymentCorp/Commercial/Banking
Gov. RelatedPI-Plaintiff
Contract-OtherCivil Trial (inc. PI)
SecuritiesOther
Intellectual PropertyTax
Median Amount Paid
$50k $100k $150k $200k
CriminalBankruptcy/Collections
Civil RightsWorkers' CompContract-Other
General PracticeFamily Law
Labor/EmploymentConstruction
PI-PlaintiffReal Estate
Trusts & EstatesGov. Related
Civil Trial (inc. PI)PI-Defendant
Corp/Commercial/BankingTax
OtherSecurities
Intellectual Property
Mean Amount Paid
All values in 2010 inflation adjusted dollars

50 WHEN THE LAWYER SCREWS UP [29-Jun-15
Figure 18 shows variation in the mean and median amounts paid by area of practice. As was true in the Missouri data, securities and IP are at or near the top and criminal, workers’ compensation, and bankruptcy/collections are at or near the bottom. The typical recovery, measured in terms of medians, is three to four times greater for the areas at the top of the distribution compared to those at the bottom of the distribution.
Figure 19 again uses a box-and-whisker plot to show the amount of variation with each area of law. Not surprisingly, the areas with the highest typical amounts paid are also the areas where there is the most variation as measured by the interquartile range which is represented by the width of the box shown in the figure.
Figure 19 Variation in Payments by Area of Practice, Florida Data. 1981-2014
$0 $100k $200k $300k $400k $500k $600kAmount Paid
CriminalBankruptcy/Collections
Family LawWorkers' Comp
Civil RightsGeneral Practice
ConstructionTrusts & Estates
PI-DefendantReal Estate
Labor/EmploymentCorp/Commercial/Banking
Gov. RelatedPI-Plaintiff
Contract-OtherCivil Trial (inc. PI)
SecuritiesOther
Intellectual PropertyTax
Actual outlier limit for Intellectual Property is $1.21 million.All values adjusted to 2010 dollars.

29-Jun-15] WHEN THE LAWYER SCREWS UP 51
4. ALAS
In principal the data collected by DFIP and FLOIR include claims against very large firms as well as against lawyers in small firms or practicing solo. However, it would be is worthwhile to describe what we can of the outcomes of claims brought against large firms. The information reported by ALAS can give some idea about order of magnitude, but it does not provide clear cut information on outcomes. The problems are two-fold. First, the ALAS reports give the number of what ALAS had classified as “real claims” which excludes claims deemed to be without merit. Second, ALAS does not report the number of claims closed with payment. Third, the figures that are given are as aggregations since the founding of ALAS rather than for a given year, and no adjustments are made for inflation. Fourth, the figures given are for “gross incurred loss” which includes both actual payments and amounts reserved for paying claims currently pending, including payments made by reinsurers plus any defense expenditures. Fifth, ALAS reports “gross incurred loss per claim” for different areas of practice but this is computed by dividing the total gross incurred loss by the number of (real) claims including those (real) claims closed without payment. Sixth, it is unclear whether the gross loss incurred includes any self-insured retention paid by the insured, although most likely it does not. With those caveats, there are still some insights to be gained by looking at what ALAS reports if one is willing to make some assumptions which we make clear below.
The 2014 ALAS Annual Report shows the average per (real) claim “gross incurred loss” to be $409,200.122 If one assumes that half of (real) claims incur at least some loss, the average loss per paid claim is over $800,000. If one further takes into account the self-insured retention paid by the insured which over the years has averaged over half a million dollars, that would put the average incurred loss at well over $1 million. For purposes of comparison, we computed the equivalent figures for Florida and Missouri. The mean gross loss in Missouri was $49,870 and for Florida $52,926; both of these figures include both claims resulting in some loss and those with no loss (i.e., neither payment nor expenditures on defense).123 Thus, the typical loss involving ALAS as the insurer is an order of magnitude greater than what we found in our two state-level sources of data.
122 ALAS 2014 Annual Report, 12 123 Limiting the computation to claims with at least some gross loss, the means are
$98,344 and $90,964 for Missouri and Florida respectively. For Florida, we have restricted the computation to the years when all claims had to be reported to FLOIR.
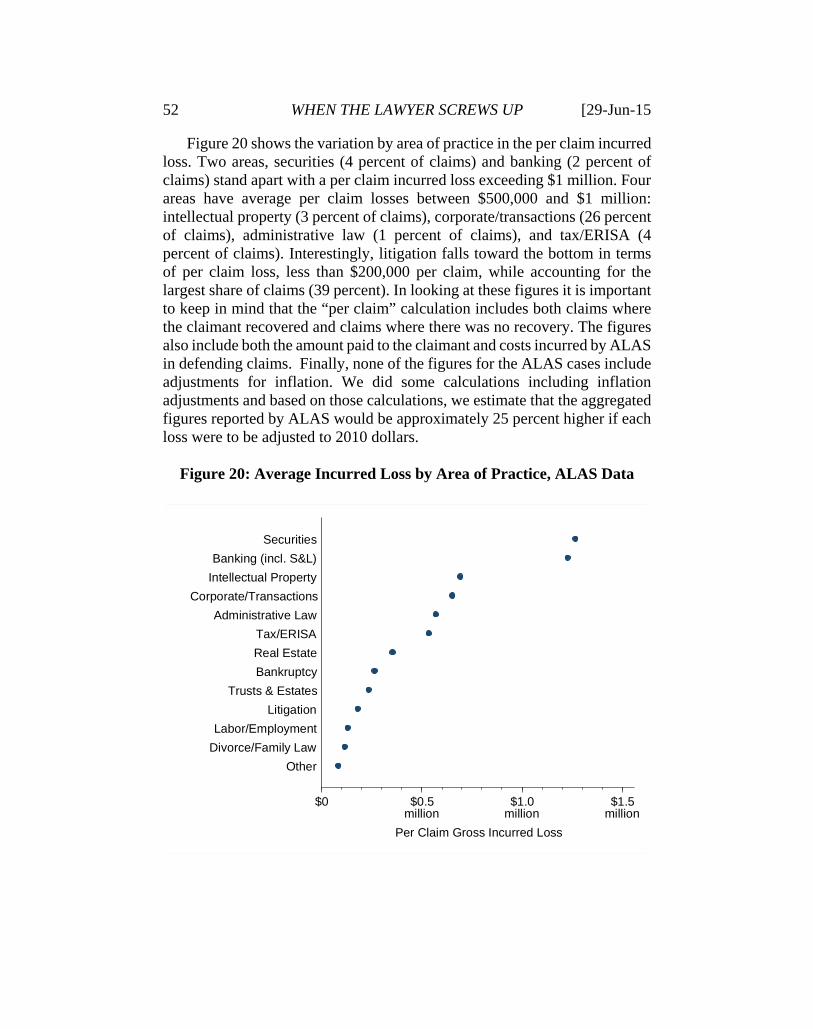
52 WHEN THE LAWYER SCREWS UP [29-Jun-15
Figure 20 shows the variation by area of practice in the per claim incurred loss. Two areas, securities (4 percent of claims) and banking (2 percent of claims) stand apart with a per claim incurred loss exceeding $1 million. Four areas have average per claim losses between $500,000 and $1 million: intellectual property (3 percent of claims), corporate/transactions (26 percent of claims), administrative law (1 percent of claims), and tax/ERISA (4 percent of claims). Interestingly, litigation falls toward the bottom in terms of per claim loss, less than $200,000 per claim, while accounting for the largest share of claims (39 percent). In looking at these figures it is important to keep in mind that the “per claim” calculation includes both claims where the claimant recovered and claims where there was no recovery. The figures also include both the amount paid to the claimant and costs incurred by ALAS in defending claims. Finally, none of the figures for the ALAS cases include adjustments for inflation. We did some calculations including inflation adjustments and based on those calculations, we estimate that the aggregated figures reported by ALAS would be approximately 25 percent higher if each loss were to be adjusted to 2010 dollars.
Figure 20: Average Incurred Loss by Area of Practice, ALAS Data
$0 $0.5million
$1.0million
$1.5million
Per Claim Gross Incurred Loss
Other
Divorce/Family Law
Labor/Employment
Litigation
Trusts & Estates
Bankruptcy
Real Estate
Tax/ERISA
Administrative Law
Corporate/Transactions
Intellectual Property
Banking (incl. S&L)
Securities

29-Jun-15] WHEN THE LAWYER SCREWS UP 53
5. Aon As with ALAS the information we have regarding Aon claims does not
allow us to separate out payment to claimants from expenditures on defense. Also, similar to ALAS the loss amounts Aon reports includes both actual losses and amounts reserved in connection with pending claims; this means that the figures slightly understate the amounts of loss associated with closed claims but unlike ALAS the Aon amounts include the amounts paid by the clients’ self-insured retentions. Also unlike ALAS, we do have information on the number of claims with a recorded loss which allows us to compute a mean loss for only those claims, and Aon reports the median loss for claims with some loss, so we have that information as well. Lastly, the figures we have are in nominal dollars rather than inflation-adjusted dollars, but that is less of an issue here because the information we have is limited to a ten-year period, 2004-2013.124
In our earlier discussion of the areas of practice producing claims for firms insured through Aon, we collapsed some of the categories of try to make the them more comparable to the categories reported by ALAS. Here we do not do that because the information we obtained includes medians for each of the categories used by Aon, and there is no way to obtain medians from the collapsed categories. Also, in Figure 21, which shows mean and median gross loss amounts by area of practice, we omit any category with less than 10 claims that incurred loss.
The amounts shown for the average loss in Figure 21 tend to be higher that what is shown in Figure 20 for ALAS. However, that almost certainly reflects that the averages for Aon clients excludes claims (notices) in which no loss was incurred while the ALAS means are computed across all claims labeled as “real claims” by ALAS. The top category in terms of both mean and median is governmental affairs/lobbying, a category in listed by ALAS. Leaving that aside, there are some similarities in the ordering: securities and corporate/transactional are toward the top for both Aon and ALAS. Banking is the second highest mean for ALAS and the second highest median for Aon, but in terms of its mean, banking falls below a number of areas in the Aon claims. Intellectual property (IP) is toward the top for ALAS but in the middle of the pack for Aon. Litigation is in the ALAS figures falls toward the bottom but for Aon some litigation (IP) is higher and some is lower (personal injury, presumably defense).
124 If the loss amounts for each of these years were equal, the inflation adjustment to
2010 dollars would only be +2.9 percent.

54 WHEN THE LAWYER SCREWS UP [29-Jun-15
Figure 21: Mean and Median Incurred Loss by Area of Practice Aon Claims, 2004-2013
$0 $0.5million
$1.0million
$1.5million
Median Gross Incurred Loss
Litigation (Personal Injury) Family Law
Litigation (Commercial)Administrative Law
Employment & Labor Health Care
Bond Trusts & Estates
Intellectual Property Real Estate
Litigation (IP) Bankruptcy
Employee Benefits & ERISA Corporate/Transactional
Securities Tax
Banking Governmental Affairs/Lobbying
$0 $1million
$2million
$3million
$4million
Mean Gross Incurred Loss
Litigation (Personal Injury) Family Law
Bond Health Care
Employment & Labor Bankruptcy
Litigation (Commercial)Intellectual Property
Real Estate Trusts & Estates
Litigation (IP) Banking
Administrative Law Corporate/Transactional
Tax Employee Benefits & ERISA
Securities Governmental Affairs/Lobbying
All values based on nominal dollars

29-Jun-15] WHEN THE LAWYER SCREWS UP 55
6. Summary In this section we have shown that there is substantial variation in
outcomes, both in terms of whether any payment or loss is incurred and in terms of the amounts of those payments or losses. The key areas of variation are along three dimensions: area of practice, type of error, and size of practice. The first of these is correlated with the other two. Large firms tend to practice in areas where, when an error occurs, the damages are larger than in other areas. While we do not have any information on the size of the transaction or severity of physical injury involved in the cases, it seems safe to say that larger firms take on matters with greater amounts at stake, both in contentious matters and in transactional matters. In an earlier section we showed that the areas of practice producing claims varied substantially depending on the size of the firm, with larger firms more involved in commercial and corporate matters including securities and intellectual property, and these matters tend to involve substantial sums of money producing significant indemnity payments where errors occur.
VIII. LEGAL MALPRACTICE TRIALS A. Incidence of Trial
Very few legal malpractice claims make it to a trial and verdict. Getting precise figures on the likelihood of a legal malpractice claims reaching verdict at a trial is very difficult. The ABA reports provide figures on the number of claims resulting in payment after a judgment for the plaintiff. These percentages range from 0.70 percent to 2.42 percent; aggregated across all of the reports, 1.33 percent of claims resulted in payment for the plaintiff after a judgment.125 If one assumes that plaintiffs and defendants each win about half the trials, a pattern that is consistent with two of the other sources we discuss below, then one would estimate that about 3 percent of claims result in verdicts. This is consistent with figures reported by the Oregon Professional Liability Fund showing that 3 percent of the claims it closed between January 1, 2004 and December 31, 2013 produced judgments for the plaintiff (1 percent) or the defendant (2 percent).126
The Florida Office of Insurance Regulation codes disposition in a way that allows for a crude estimate of the occurrence of trials.127 However,
125 Profile of Legal Malpractice Claims, 2008-2011, 10 (2012); Profile of Legal
Malpractice Claims 2000-2003, 8 (2005). The percentages varied from report to report, from a low of 0.26 percent in 1992-95 to 2.42 percent in 2000-03.
126 OSBPLF 2013, supra note 64, at 4. 127 The nature of the disposition codes used by Missouri Department of Insurance,
Financial Institutions & Professional Regulation (DIFP) does not identify which cases were

56 WHEN THE LAWYER SCREWS UP [29-Jun-15
because FLOIR stopped requiring reports of all claims after 1997 and the reporting form changed after 1993, we can only use the FLOIR data to get estimates for 1981 to 1993. Out of 5,716 claims—just over half of which (2,846) were in suit—reported to FLOIR for that period, only 85 are recorded as either “judgment” or “judgment on appeal” with another 24 recorded as “directed verdict” and 166 as “summary judgment”; some of the “judgment on appeal” claims may have been appeals from summary judgment but there is no way to determine whether this is the case.128 Ignoring this latter issue, at most trials appear to have resolved 109 claims or 1.9 percent all claims and 3.8 percent of claims that were in suit.
ALAS reports the outcomes of cases reaching verdict at trial. Through November 30, 2015, 228 cases had reached verdict, although seven of those settled before entry of judgment. During this same period ALAS had handled or was in the process of handling 14,312 “real” claims (i.e., claims ALAS had determined had at least minimal merit).129 ALAS does not report the number of claims pending, but in recent years between 400 and 500 new claims were reported to ALAS. If one assumes that the average claim takes two years to resolve, this would mean perhaps 400 to 500 claims would be pending at any one time. Using 500 as the number of pending claims as of November 30, 2015 leaves 13,912 closed claims. Based on this figure 1.6 percent of real claims against ALAS’s insureds reach a verdict at trial.
Overall we estimate that between 2 and 3 percent of legal malpractice claims lead to trial verdicts. Is this figure high or low? Getting figures on the rate by which claims are resolved by trial is difficult because typically there is no information on the number of claims. Still, for Florida, we can estimate the percentage of legal malpractice claims resolved by trial to the percentage of medical malpractice claims that lead to trial verdicts. Using data from the Florida Office of Insurance Regulation concerning 21,114 medical malpractice claims closed between 1976 and 1987 5.0 percent were closed after trial.130
Looking at trial rates as a percentage of cases in suit is easier although we could find no location that separated out legal malpractice. The National Center for State Courts shared with us figures on the percentage of professional malpractice cases for 13 states, including legal, medical and other types of professional malpractice, reaching trial in 2012.131 Overall
tried. DIFP’s reporting form combines trials and hearings, which would include summary judgment hearings or hearings regarding other dispositive motions.
128 In only 15 of the 109 cases did the claim indicate that the plaintiff had obtained some recovery.
129 ALAS 2014 Annual Report, at. 11-12. 130 Authors’ analysis of Florida data; excluding directed verdicts the percentage would
be 4.0 percent. 131 Data provided by Nicole Waters, email attachment to Herbert Kritzer, May 5, 2015.

29-Jun-15] WHEN THE LAWYER SCREWS UP 57
across the 13 states 6.3 percent of malpractice dispositions came at or after trial; interestingly, Florida had the lowest trial rate at 3.6 percent. The Administrative Office of the Court in New Jersey publishes detailed figures on the incidence of trial for various types of cases, including a “professional malpractice” category that lumps all professional malpractice other than medical into a single category. Table 2 shows the percentage of suits terminated by trial for a number of categories for two fiscal years, 2004 and 2014.132 If roughly the same percentage of legal malpractice lawsuits get to trial in New Jersey as in Florida, it is clear that such cases would not stand out regarding the likelihood of getting to trial, although they would certainly be substantially less likely to get to trial than medical malpractice lawsuits in New Jersey.
Table 2
Trial Rates for Various Types of Cases, New Jersey
Importantly, as explained previously, both the NCSC and New Jersey
figures reflect only claims that led to a lawsuit being filed; we have no information on the number of claims resolved prior to a lawsuit being filed. This means that those figures overstate the percentage of claims getting to trial.133 However, based on these comparisons, legal malpractice claims that
The states included are Florida, Kansas, Michigan, Minnesota, Missouri, New Jersey, New York, Ohio, Tennessee, Texas, Utah, Washington, and Wisconsin.
132 These two years are the first and the most recent years posted on the Administrative Office of the Court webside, http://www.judiciary.state.nj.us/quant/index.htm, last visited May 1, 2015.
133 In fact, the federal figures overstates for a second reason: the federal statistics refer to cases that start trial, and do not discount for cases that are settled during trial. Specifically what is reported is the “procedural progress of a case at termination”; see Herbert M. Kritzer, The Trials and Tribulations of Counting Trials, 63 DEPAUL L. REV. 415, 421 (2013).
FY2004 FY2014Auto Personal Injury 2.1% 3.0%Product Liability (non-asbestos) 3.1% 1.4%Medical Malpractice 8.3% 9.2%Civil Rights 3.3% 2.0%[unspecified] Personal Injury 1.7% 1.5%Complex Commercial 1.8% 1.8%Tort Other 2.1% 1.9%Professional Malpractice 2.7% 2.1%
Source: http://www.judiciary.state.nj.us/quant/index.htm

58 WHEN THE LAWYER SCREWS UP [29-Jun-15
reach suit do not stand out as either overly likely or overly unlikely to be terminated after a trial verdict has been rendered.
B. Outcomes of Legal Malpractice Trials
A prominent theory about the outcome of civil trials is that about half the time the plaintiff should win and about half the time the defendant should win because the cases that are end up getting to trial are those where the outcome is most uncertain.134 One area that stands out prominently as deviating from what has been called the 50-percent rule135 is medical malpractice where studies have consistently shown plaintiff win rates on the order of 20 to 30 percent.136 What is the pattern for legal malpractice trials? We have four
134 See George L. Priest & Benjamin Klein, The Selection of Disputes for Litigation, 13
J. LEGAL STUD. 1 (1984). A body of research has grown up in responses to Priest and Klein’s at least some of which points out that there is very substantial variation in the outcome of trials depending on the kind of case involved Donald Wittman, Is the Selection of Cases for Trial Biased? 14 see id. at 185 (1985);Donald Wittman, Dispute Resolution, Bargaining, and the Selection of Cases for Trial: A Study of the Generation of Biased and Unbiased Data, 17 J. LEGAL STUD. 313 (1988);Luke Froeb, The Adverse Selection of Cases for Trial, 13 INTERNATIONAL REVIEW OF LAW & ECONOMICS 317 (1993);Joni Hersch, Demand for a Jury Trial and the Selection of Cases for Trial, 35 J. LEGAL STUD. 119 (2005);Keith N. Hylton & Haizhen Lin, Trial Selection Theory and Evidence: A Review, in ENCYCLOPEDIA OF LAW
AND ECONOMICS [VOLUME 10]: PROCEDURAL LAW AND ECONOMICS (Chris Sanchirico ed. 2009);Robert E. Thomas, The Trial Selection Hypothesis without the 50 Percent Rule: Some Experimental Evidence, 24 J. LEGAL STUD. 209 (1995);Joel Waldfogel, The Selection Hypothesis and the Relationship Between Trial and Plaintiff Victory, 103 JOURNAL OF
POLITICAL ECONOMY 229 (1995). One issue here is that for some types of cases that get to trial the issue is not one of liability but of damages, either whether there are specific kinds of damages or over the proper amount of damages; a good example of the latter is rear-end collision cases—see Samuel R. Gross & Kent D. Syverud, Getting to No: A Study of Settlement Negotiations and the Selection of Cases for Trial, 90 MICH. L. REV. 319 (1991).
135 Daniel Kessler, et al., Explaining Deviations from the Fifty-Percent Rule: A Multimodal Approach to the Selection of Cases for Litigation, 25 J. LEGAL STUD. 233 (1996).
136 See Neil Vidmar, Are Juries Competent to Decide Liability in Tort Cases Involving Scientific/Medical Inssues? Some Data from Medical Malpractice, 43 EMORY L.J. 885, 894 (1994).. National studies covering trials in 2001 and 2005 found that plaintiffs prevailed in 27.1 percent of trials in 2001 Thomas H. Cohen, Medical Malpractice Trials and Verdicts in Large Counties, 2001 (2004) [available at http://bjs.ojp.usdoj.gov/content/pub/pdf/mmtvlc01.pdf]. and 22.7 percent in 2005 Thomas H. Cohen, Tort Bench and Jury Trials in State Courts, 2005, (2009). An interesting question is why the win rate is so low. There are at least three possible explanations, all probably partial explanations at best. First, a significant number of medical malpractice cases are handled by plaintiffs’ lawyers lacking adequate experience or expertise to handle such cases effectively Stephen Daniels, et al., Why Kill All the Lawyers? Repeat Players and Strategic Advantage in Medical Malpractice Claims Table 1 (1992).; David A. Hyman et al., Plaintiff-Side Representation in Medical Malpractice, Part 1: Market Structure and the Wages of Risk, (June 9, 2015) 5, available at http://ssrn.com/abstract=2465098 (last visited June 23, 2015). A second explanation is that jurors are biased toward physician defendants; one mock jury

29-Jun-15] WHEN THE LAWYER SCREWS UP 59
sources that allow us to look at this question, along with the question of the amount of damages that are awarded.
1. Florida Office of Insurance Regulation
The FLOIR data we used previously provides indicators of whether a claim went to trial. While the post-1997 data only include claims that resulted in a payment to the claimant or at least $5,000 in claim expenses, we believe that virtually no legal malpractice claim could be tried with less than $5,000 in defense costs. We find a total of 190 legal malpractice claims between 1981 and 2010 that appear to have gone to trial; plaintiffs prevailed in only 39 (20.5 percent) of these trials.137 Using amounts paid adjusted to 2010 dollars and omitting nine cases that settled post-verdict,138 the verdicts ranged from $3,345 ($2,000 unadjusted) to over $4.4 million ($3.5 million unadjusted). The mean and medians are $484,486 and $181,623 with the first and third quartiles at $23,368 and $401,224.
2. Bureau of Justice Statistics Civil Verdict Studies
Our second source of jury verdict data is the set of studies conducted on behalf of the U.S. Justice Department’s Bureau of Justice Statistics (BJS) by the National Center for State Courts (NCSC). Three BJS/NCSC studies include a total of 54,494 verdicts from jury or bench trials; 34,613 of these verdicts were from tort trials. The coding of case type allows us to zero in on legal malpractice trials.139 Table 3 displays a range of statistics for the professional malpractice cases included in the three BJS/NCSC studies
study using a hypothetical case medical malpractice case designed to involve negligence found that less than half of the mock jurors found the physician negligent; see Christopher T. Robertson & David V. Yokum, The Effect of Blinded Experts on Juror Verdicts, 9 J. EMPIRICAL LEGAL STUD. 765, 777 (2012). A third explanation is that many medical malpractice cases involve multiple defendants (e.g., surgeon, anesthesiologist, hospital); in a fraction of those cases the some of those defendants settle—probably those with the weaker defense, and the case goes to trial against the remaining defendants—probably those with the stronger defense, see with the weaker defenses settle leaving only those defendants against whom the claim of negligence is weakest to get to trial, see NEIL VIDMAR, MEDICAL
MALPRACTICE AND THE AMERICAN JURY: CONFRONTING THE MYTHS ABOUT JURY
INCOMPETENCE, DEEP POCKETS, AND OUTRAGEOUS DAMAGE AWARDS 33 (1995). 137 There is a statistically significant difference in the likelihood of a plaintiff victory
depending on whether the claim was reported in the early version of the reporting form or on the later form which came into use around 1995: 14 percent for the early form and 30 percent for the later form (chi square=7.17, p=.007). We do not know whether this reflected genuine change in the pattern of trial outcomes or differences in how the two versions of the reporting form were completed.
138 The figures reported to FLOIR by the insurers are the amounts ultimately paid not the amount of the original verdict award.
139 A study limited to jury verdicts had previously been conducted covering verdicts from 1992; see .; the coding in that study lumped all professional malpractice cases other

60 WHEN THE LAWYER SCREWS UP [29-Jun-15
Table 3
Trial Outcomes, 1996, 2001, 2005, BJS/NCSC Studies
The studies include data on a total of 156 trials involving claims of professional malpractice by lawyers. In comparison the data include 1,908 cases of professional malpractice by physicians, 136 by dentists, and 150 by “other” professionals.140 Perhaps most striking is the fact that large percentage of legal malpractice trials that were conducted without a jury: 38.5 percent. In contrast only 2.0 percent of physician malpractice trials were bench trials.
The plaintiff prevailed in 48.7 percent of cases involving lawyer defendants, compared to 23.2 percent involving physicians, 27.9 percent involving dentists, and 38.9 percent involving other professionals.141 In looking at the size of awards, we limit our consideration to those cases where
than medical malpractice into a single category.
140 In the 2005 study the codes separated out “hospital” (n=38) and “other health” malpractice (n=33); lumping these with the 2005 “physician” malpractice cases reduces the plaintiff success rate for this category from 23.2 percent to 22.8 percent.
141 The large proportion of legal malpractice trials heard without a jury raise the question of whether plaintiffs in such trials do better in a jury trial or a bench trial. Leaving aside two cases resolved by a directed verdict, plaintiffs won 53 percent of cases tried to juries compared to 43 percent tried to the bench; however, the difference is not sufficient to rule out random variable as an explanation for the difference (chi square = 1.42, p = .233).
Total Number
Percent Bench Trials
Percent Plaintiff Verdicts
Percent of Awards
Exceeding $ 1 Million
(nominal)
Percent of Awards
Exceeding $ 1 Million (2010$)
Lawyers 156 38.5 48.7 15.5 15.5Physicians 1,908 2.0 23.2 37.3 41.3Dentists 136 5.9 27.9 5.1 7.7Other 150 12.0 38.8 18.3 21.7
Mean (2010$)
Median (2010$)
Standard Deviation
1st Quartile (2010$)
3rd Quartile (2010$)
Lawyers $1,192,028 $108,328 $4,478,354 $27,800 $455,457Physicians $2,401,400 $695,000 $5,304,435 $245,398 $2,154,250Dentists $166,920 $102,518 $235,620 $26,979 $228,655Other $5,301,904 $274,775 $5,301,904 $76,938 $881,582

29-Jun-15] WHEN THE LAWYER SCREWS UP 61
the plaintiff prevailed.142 The median award (2010 dollars) in legal malpractice trials is a bit over $100,000 compared to almost $700,000 for awards against physicians;143 the median award against dentists is slightly lower than that against lawyers. As one would expect the means tend to be much higher, although this is not true for awards for dental malpractice. The two quartiles give a sense of variation. In absolute terms, the difference between the quartiles is greatest for physician malpractice. However, the relative variation for legal malpractice is greater than any of the other categories using two different measures: The ratio third to first quartile is 16.38 for legal malpractice compared to 8.78 for physician malpractice, 8.5 for dentist malpractice, or 11.48 for other types of professional malpractice; the relative interquartile range, computed is the difference between the first and third quartiles divided by the median, is 3.95 for legal malpractice, 2.75 for physician malpractice, 1.97 for dental and 2.93 for other. Nominal awards exceeding $1 million occurred in only 15.5 percent of cases of legal malpractice cases compared to 37.3 percent of physician malpractice; the comparable numbers for dental malpractice and other professionals are 5.1 percent and 18.3 percent respectively.144
The fact that almost half of legal malpractice trials in the BJS/NCSC studies did not employ a jury raises the question of whether the choice of between a jury trial and a bench trial was associated with any difference in the outcome, either who won or the amount of damages awarded when the plaintiff won. Note that we speak here of association rather than causation because we do not have information on factors influencing the decision by both parties to forego a jury trial. Plaintiffs were about 10 percentage points more likely to win with a jury (53 percent) than before a judge (43 percent), but the small sample size was such that we cannot reach the conclusion that this difference is more than what reasonably could be produced by a random process.145However, we can conclude that there are differences not attributable to random variation in the amounts awarded when the plaintiff prevailed. With a jury the median award was $194,878 compared to
142 There are a small number of cases involving a counter-suit by the defendant, typically
for fees; we exclude cases where the defendant won an award. 143 The awards in legal malpractice trials tried to juries tend to be greater than when tried
to judges. The median in jury trials is $656,238 compared to a median of $32,249 in bench trials (Kruskal-Wallis test chi square=8.902, df=1, p=.0028); 39 percent of the awards in jury trials exceed $1 million compared to only 8 percent in bench trials (chi square=4.240, p=.039). However, we do not know whether this reflects differences in the cases that go to jury rather than bench trials or differences in the decisions of jurors compared to those of judges.
144 Adjusting all awards to 2010 dollars, the four percentages are 15.5, 41.3, 7.7, and 21.7 for lawyers, physicians, dentists, and other respectively.
145 Chi square=1.32, p=.232.

62 WHEN THE LAWYER SCREWS UP [29-Jun-15
$39,249;146 22 percent (11 of 50) of the jury awards exceeded $1 million compared to only 4 percent (1 of 26) of the bench awards.147 Comparing these results to medical malpractice trials, where only two percent of trials were without a jury, we find that plaintiffs were more likely to win before a judge than with a jury (38 percent versus 23 percent),148 but the median award of juries was higher than the median award of judges ($695,000 versus $347,380).149
Very few of the plaintiffs who prevailed in professional malpractice cases were awarded punitive damages. Nonetheless, such awards were most likely in legal malpractice cases where such awards were made in 3.1 percent cases won by plaintiffs. For the other types of professional malpractice punitive awards were made in 0.4 percent of physician malpractice cases, 0.7 percent of dentist malpractice, and 2.0 percent of other professional malpractice. The number of cases is too small (5 lawyer, 8 physician, 1 dentist, and 3 other) to compute any meaningful statistics, but it is perhaps worth noting that the largest punitive damage award against a lawyer was $15 million ($16.8 million when adjusted to 2010 dollars) compared to $3 million ($3.48 in 2010 dollars) against a physician. However, we also note that the second largest award against a lawyer was only $75,000 ($104,250 in 2010 dollars) while the second largest punitive damage award against a physician was $2.5 million ($3.35 million in 2010 dollars).
The BJS/NCSC data include information on the type of parties involved in the case. For our purposes there are four relevant categories: individuals, insurance companies, hospitals and clinics, and other businesses; we combined the three latter categories as under the label “business.” The data provide information on how many of each party type are included among the plaintiffs.150 This means that we can have only individuals, only businesses, or a combination of the two as the plaintiffs in a case. However, when there are both business and individuals as plaintiffs, it may be that the business is really an extension of one or more individuals.
For example, one of the cases coded as both business and individual was a lawsuit filed by Scotty Pippen (a prominent teammate of Michael Jordan during the glory days of the Chicago Bulls) and Air Pip, Inc., the latter being a corporation which Pippen formed in connection with the purchase of a partial interest in a Gulfstream II jet airplane. While technically this case
146 Kruskal-Wallis test chi square=8.092 (df=1), p=.0028. 147 Chi square=4.24, p=.039. 148 Chi square=5.131, p=.024. 149 Kruskal-Wallis test chi square=6.153 (df=1), p=.0131; 38 percent of the jury awards
exceeded $1 million compared to no million dollar awards by judges (chi square-9.017, p=.003).
150 Similar information is provided for defendants, but that information is not relevant for our purposes.

29-Jun-15] WHEN THE LAWYER SCREWS UP 63
involved both an individual and the corporation, the latter was simply and extension of the former that had been created to hold certain assets. While the BJS data do not include case identifiers such as docket numbers and case names, we were able to match information regarding 10 of the 12 cases through online searches of dockets and similar materials; nine of the ten cases were effectively brought by individuals only and one was essentially brought by a business. It is possible that many of the cases coded only as having businesses as the plaintiff actually involved personal corporations similar to Air Pip, Inc.; however, we have not sought to track down information about those cases and we will treat them as businesses. After making adjustments based on the information we found on the 10 cases, we have 127 (81.4 percent) cases involving only individual plaintiffs, 27 (17.3 percent) involving only business plaintiffs, and 2 (1.3 percent) for which we could not locate information to clarify the nature of the plaintiff.
Table 4 provides information on the outcomes of legal malpractice trials controlling for type of plaintiff omitting the two cases for which we could not determine whether they were individual or business cases. As the table shows there is little difference in the likelihood of a plaintiffs’ verdict between individual and business plaintiffs.151 The percentage of plaintiffs receiving awards of $1 million or more is essentially the same for the two types of plaintiffs. However, interestingly, the median award for successfully individual plaintiffs is substantially greater ($141,050) than is the median award for successful business plaintiffs ($18,754).152 As we will show in our discussion of our next source of verdict data, the patterns in that set of data regarding type of plaintiff is quite different.
Table 4
Trial Outcomes by Type of Plaintiff, BJS/NCSC Studies
3. Illinois Jury Verdict Reporter The publisher of the (Illinois) Jury Verdict Reporter (IJVR) generously
made available to us summaries of all verdicts in legal malpractice cases
151 Chi square = 0.24 (df=1), p=.626. 152 This difference borders on achieving statistical significance, Kruskal-Wallace test,
chi square = 3.42 (df=1), p=.0643.
n
nplaintiff verdicts
% Plaintiff Verdict
% Million or more
Median Award
(2010$)Individual(s) 127 63 50 16 $141,050Business(es) 27 12 44 17 $18,754
64 WHEN THE LAWYER SCREWS UP [29-Jun-15
reported to IJVR between 1988 and 2014.153 This constituted a total of 103 verdicts, which can be compared to 3,802 verdicts in medical malpractice cases.154 Regrettably we do not have data to compare the legal malpractice verdicts to other kinds of professional malpractice in the IJVR database. Working from the reports obtained we coded which side won, the area of practice producing the claim, and the amount of any award, both before and after any offset. As with the other sets of data we have used, we adjusted all dollar figures to 2010 dollars.
Plaintiffs obtained favorable verdicts in 58 (56 percent) cases. Individuals were the plaintiffs in 67 (65 percent) of cases; businesses, including banks and insurance companies, were the plaintiffs in the remaining cases.155 Individual plaintiffs won 54 percent of their cases while businesses won 61 percent; however this difference is fairly likely to represent nothing more than random variation given the small number of observations.156
The awards in the Illinois cases were higher than we found in either the BJS/NCSC or the Florida data. The median award (2010 dollars) was $477,650 (mean $2,049,915); the first and third quartiles were $132,390 and $2,462,000. The medians differed sharply between cases brought by individuals (median award $229,877 in 2010 dollars) compared to $1,399,585 when the plaintiff was a business—the reverse of the pattern in
153 This reporter, which is now published by the Law Bulletin Publishing Company (see
https://www.lawbulletin.com/legal/jury-verdict, last visited May 2, 2015), started life in 1959 as the Cook County Jury Reporter (CCJRV). In 1973 the coverage of the publication was extended to the rest of Illinois; the coverage for downstate counties is likely to be less complete than for the counties around Chicago. Importantly, the coverage of bench trials is minimal (email from John Kirkton to Herbert Kritzer, May 8). Most of the trials reported in IJVR were jury trials; only 7 of the 103 cases involved bench trials. This reporter is the source for the earliest systematic studies of jury verdicts conducted by the RAND Institute of Civil Justice; see Mark A. Peterson & George L. Priest, The Civil Jury: Trends in Trials and Verdicts, Cook County, Illinois, 1960-1979 (1982); Audrey Chin & Mark Peterson, Deep Pockets, Empty Pockets: Who Wins in Cook County Jury Trials (1985); Audrey Chin & Mark A. Peterson, Fairness in Civil Jury Trials: Who Wins, Who Loses in Cook County (1983); Erik Moller, Trends in Civil Jury Verdicts Since 1985 (1996); Mark A. Peterson, Civil Juries in the 1980s: Trends in Jury Trials and Verdicts in California and Cook County, Illinois (1987); Michael Shanley & Mark A. Peterson, Comparative Justice: Civil Jury Verdicts in San Francisco and Cook Counties, 1959-1980 (1983); and Seth Seabury, et al., Forty Years of Civil Jury Verdicts, 1 J. EMPIRICAL LEGAL STUD. 1 (2004).
154 Email from John Kirkton to Herbert Kritzer, February 11, 2015. The verdicts we received included the abuse of process case brought by Lexecon against the Milberg law firm and several of its former partners (e.g., William Lerach), plus one case that did not actually produce a verdict but settled after the jury deadlocked. We have not included those cases among the 103, and they are not included in the analysis that we present.
155 We include among the 67 cases coded as individuals two cases that we actually coded as both individual and business because those were cases involving individually-owned businesses.
156 Chi square=0.52, p=.472.

29-Jun-15] WHEN THE LAWYER SCREWS UP 65
the BJS/NCSC data.157 Awards of one million dollars (2010 dollars) or more were made in 36 percent of cases won by plaintiffs.158 Half of the awards obtained by business plaintiffs exceeded $1 million compared to about a quarter for individual plaintiffs.159
Table 5 shows a range of statistics controlling for area of practice. The areas of practice that stand out in the Illinois verdicts are corporate/commercial (16.5 percent), family (10.7 percent), real estate (16.5 percent), plaintiffs’ personal injury (19.4 percent). As one might expect, the pattern differs depending on whether the plaintiff is an individual or business. For individuals the most prominent areas of practice are family (16.4 percent), plaintiffs’ tort cases (16.5 percent), and interestingly corporate/commercial (11.9 percent); what’s missing here is real estate which comprise only 7.5 percent of malpractice trials with individuals as plaintiffs. On the business side the largest proportion of trials involves real estate (33.3 percent) followed by corporate/commercial (25.0 percent).160 No other area of law comprises more than 7.5 percent, either overall or within either category of plaintiff. There were substantial differences in the likelihood of a plaintiffs’ verdict in these four areas, which were the only areas that had more than 10 cases, with plaintiffs’ verdicts most likely in real estate cases (71 percent), followed by plaintiffs’ tort cases (65 percent), corporate/commercial (35 percent), with family way down at 18 percent. The only two areas with more than 10 plaintiffs’ verdicts are real estate and plaintiffs’ tort, and the awards in 83 percent of the former and 77 percent of the latter exceeded $1 million.
157 The difference in awards to individuals and businesses is statistically significant
according to both a Wilcoxon test (z=2.147, p=.0318) and a medians test (chi square = 4.49, p=.030).
158 The percentage drops slightly to 33 percent in terms of nominal dollars. 159 The 50 percent holds for business plaintiffs regardless if one looks at 2010 or nominal
dollars. For individuals the figures are 22 percent for nominal dollars and 28 percent for inflation-adjusted 2010 dollars. This difference is statistically significant for nominal dollars (chi square = 4.78, p=.029) but significant only under a one-tailed hypothesis for inflation-adjusted dollars (chi square = 2.92. p=.088).
160 Tort defense comprised 11 percent of business cases, but that was only a total of 4 cases.

66 WHEN THE LAWYER SCREWS UP [29-Jun-15
Table 5 Area of Practice Errors, Illinois Verdict Data
Because we were working from case summaries provided by IJVR, we
were able to capture the nature of the error that was claimed in the case. We initially recorded a brief description and then went back and grouped the errors into six categories plus an “other or unclear” category.161 Table 6 provides a summary of what we found related to the nature of the defendant’s alleged malpractice.162 As the table shows, the most common alleged error (excluding the Other/Unclear category) concerned inaction or nonappearance followed by a missed deadline. Individual plaintiffs were most likely in cases
161 Originally we had a separate category for client communication issues but only four
cases fell into that category and consequently we lumped that in with the “other or unclear” category. Appendix 2 includes our brief extract describing the errors in the 21 cases coded “other or unclear”
162 We also crosstabulated area of practice with alleged error. This produces a table with 140 cells, across which are spread the 103 trials; a majority of cells are zero and only one stands out: the alleged error in 10 of the 20 cases brought by plaintiffs alleging a malpractice in a tort-related action involved deadline issues.
AreaOfLawNumber of Cases
Percent of Cases in Area of Practice
Number with
Individuals as
Plaintiffs
Percent of Cases
with Individual Plaintiffs*
Number of
Plaintiffs' Verdicts
Percent Plaintiffs' Verdicts*
Number of
Awards $1 Million or More
Bankruptcy 7 7% 5 71% 3 43%Civil Rights/Discrimination 3 3% 3 3Construction 1 1% 1 1Contract 2 2% 0 2Corporate/Commercial 17 17% 8 47% 6 35%Criminal 1 1% 1 0Employment 2 2% 2 0Family 11 11% 11 100% 2 18%Gov 1 1% 0 1Intellectual Property 2 2% 0 0Immigration 2 2% 2 1Legal Malpractice 1 1% 1 1Trusts & Estates 2 2% 2 0Real Estate 17 17% 5 29% 12 71% 10Securities 3 3% 2 3Tort-Defendant 4 4% 0 4Tort-Plaintiff 20 19% 19 95% 13 65% 10Other Litigation 1 1% 0 1Workers' Comp/Disability 3 3% 3 3Other 3 3% 2 2Total 103 100% 67 65% 58 56%
*Note: Percentages computed only if based on 5 or more cases.

29-Jun-15] WHEN THE LAWYER SCREWS UP 67
alleging missed deadlines followed by Inaction/Nonappearance. There is substantial variation in the likelihood of plaintiffs verdicts, with those being most likely when the defendant was alleged to have missed a deadline (81 percent) followed by conflict of interest/fiduciary duty (73 percent). Plaintiffs verdicts were least likely in areas when the defendant might be able to defend on the basis of the alleged error representing a matter of professional judgment that turned out to be wrong, bad advice (31 percent plaintiffs’ verdicts) and investigation/discovery (27 percent plaintiffs’ verdicts). The number of plaintiffs’ verdicts associated with each error is small; only two types of errors have more than 10 plaintiffs’ verdicts: missed deadlines and inaction/nonappearance. As shown in Table 6, for both of those two errors a large proportion of awards exceeded $1 million.
Table 6
Alleged Errors, Illinois Verdict Data
4. ALAS Verdicts Finally, what about the outcomes of trials involving law firms insured by
ALAS?163 Recall that over the history of ALAS (through November 30, 2014) only 228 cases had reached a trial verdict. Of those, 162 (70.1 percent) resulted in a finding of no liability, and another 10 resulted in a damage award lower than the final settlement demand. Of the 66 producing a verdict in favor of the plaintiff, 18 were reversed on appeal or by post-trial motion (in another two cases, an appeal was still pending). Looking at this figures from the plaintiff’s perspective, plaintiffs won a favorable verdict in 29.9 percent of trials, but in the end prevailed in only 21.1 percent of the cases tried after taking into account the result of appeals and post-trial motions.
163 No information is available on the outcomes of trials and the amounts of award in
claims against law firms that insure through ALAS.
Number of Trials
Percent of Each Type of Error
Number with
Individual as
Plaintiffs
Number with
Plaintiff Verdicts
Percent Plaintiff Verdicts
Number of Awards > $1 Million
Bad advice 13 13% 7 4 31% 1Conflict of interest/Fiduciary duty. 11 11% 5 8 73% 3Missed deadline 16 16% 14 13 81% 11Document/drafting error 11 11% 7 5 45% 3Inaction/Nonapperance 20 19% 16 13 65% 12Investigation/Discovery 11 11% 6 3 27% 2Other/Unclear 21 20% 12 12 57% 7Total 103 100% 67 58 56% 39

68 WHEN THE LAWYER SCREWS UP [29-Jun-15
Unfortunately, we are unable to extend our analysis of verdicts in ALAS cases to a consideration of the amounts awarded at trial because that information is not available.
5. Trials: Summary
We looked at two questions regarding trials: their frequency and their outcomes. Regarding frequency our findings are reasonably consistent across data sources: about 2 to 3 percent of legal malpractice claims reach a trial verdict. The likelihood of a legal malpractice claim reaching trial is not greatly different from most other areas of tort law. A legal malpractice claim may be more likely to reach trial than the most routine tort claim, those that arise for traffic accidents, but it does appear to be lower than the likelihood of a medical malpractice claim reaching trial.
However, as is true with much of the rest of our analysis, there are inconsistencies in our findings regarding trial outcomes. In two of our data sources, we find that plaintiffs and defendants are about equally likely to prevail. For our other two data sources, plaintiffs obtain favorable verdicts in roughly a quarter of the cases that get to trial. We are not sure exactly what to make of this inconsistency. It may reflect differences in the norms affecting decisions to take cases to trial, norms that are local in nature (Florida versus Illinois) or norms that reflect practices of particular insurers.
As for the amounts awarded at trial, we also see some differences among our data sources. The medians we found in the Florida data and in the BJS/NCSC data are roughly comparable; in contrast, the median verdict in the Illinois data is substantially higher. This may reflect either general tendencies of Illinois, particularly Cook County, juries Again, some of this may be due to the tendencies of juries in different locations. It may also be that cases in areas with substantial numbers of large corporations tend to be different than in other areas or nationwide.
CONCLUSION: WHAT DOES THIS PORTRAIT TELL US?
As one would expect, there is a lot of variation in the characteristics of legal malpractice cases. We would argue that the variation in this area of professional negligence is substantially greater than in the most visible area, medical negligence. The dimensions characterizing lawyers’ malpractice are more extensive than those characterizing medical malpractice, and the issues that arise differ in important ways depending on those dimensions.
In the introductory section we foreshadowed our findings by pointing to what Heinz and Laumann labeled the “two hemispheres” of the bar.164 Our analysis shows that there is what could be labeled the “two hemispheres of
164 Heinz and Laumann, supra note 6.

29-Jun-15] WHEN THE LAWYER SCREWS UP 69
legal malpractice.” The frequency of malpractice claims, the areas of practice producing malpractice claims, the kinds of errors asserted in malpractice claims, the amounts at stake in the claims, and the ultimate amounts paid out to resolve the claims all differ depending on whether one is looking at the kinds of legal practices that serve primarily individuals and their small businesses or those that serve large corporations. Fundamentally, this reflects the differences in the kinds of legal work done on behalf of individuals compared to the work done for corporations.
Corporate firms do appear to face fewer claims, at least as measured on a “per lawyer” basis, and it is likely that this is because those firms try to build in checks of various types to catch errors before those errors cause harm. However, even as they may be able to limit the frequency of the claims they face, when they do have a claim it is likely to much more severe in terms of the potential loss involved. For the largest firms these losses can be many times what one sees as the largest losses in medical malpractice. The magnitude of these risks are such that single insurers are unwilling to underwrite insurance policies covering those risks. For the largest firms this means arranging what Baker and Swedloff describe as a tower with multiple layers, and multiple insurers sharing the risk at layer. That is, the first $50 million might be insured by insurers A to E, each taking on $10 million of the risk, the next $50 million by F to J with each again taking on $10 million, and so on. Once a claim reaches a particular layer in the tower, the insurers at the lawyer pay equal amounts up until the limit of that layer is reached, and then the coverage moves on to the next layer.165
A key element in the difference between the two hemispheres is the ability of clients to obtain redress when an error has caused some loss. First, it is likely that corporate clients are less likely to face a loss caused by their law firms. But just as important is that when a loss does occur, corporations know that their firms have insurance that can be used to provide compensation for the loss. In contrast the lawyers used by individuals and/or small businesses have a significant likelihood of not being insured—except in the state of Oregon—and lawyers experienced in prosecuting legal malpractice cases seldom will take on a case if the lawyer defendant is uninsured.166 Moreover, a large proportion of the losses experienced by individuals or small businesses, while significant in terms of the resources of the potential claimant, are relatively small in relation to the costs of prosecuting a legal malpractice claim; this further limits the willingness of knowledgeable lawyers to take on a claim.
165 Baker and Swedloff, supra note 16, at 10-13. Baker and Swedloff point out that things
a somewhat different for firms insured through ALAS because ALAS itself will cover a loss up to $75 million
166 See Kritzer and Vidmar, supra note 105.

70 WHEN THE LAWYER SCREWS UP [29-Jun-15
Thus, there is a real dilemma for clients forming the personal services sector of the legal market. They both face a greater likelihood of a lawyer making a costly error and they face greater limitations in securing the kind of assistance needed to prosecute a claim against the negligent lawyer. This is an access to justice problem, as well as a potential image problem for the legal profession. There are partial solutions, but the likelihood that many of those solutions will be implemented is small.167
* * *
167 We consider many of these possible solutions in the book currently in preparation,
WHEN THE LAWYER SCREWS UP: ACCESS TO JUSTICE FOR VICTIMS OF LEGAL MALPRACTICE.

29-Jun-15] WHEN THE LAWYER SCREWS UP 71
APPENDIX 1: LEGAL MALPRACTICE INSURANCE REQUIREMENTS BY STATE
State Lawyer must report legal malpractice insurance status with annual registration?
Lawyer must inform client in retainer agreement if they have malpractice insurance?
Does a lawyer LLP, an LLC, or an SC have to have liability insurance for the entity?
Alabama No No No Alaska No Yes, Rule 1.4 requires
lawyers must inform clients if they do not have malpractice insurance of at least $100,000 per claim and $300,000 annual aggregate.
No
Arizona Yes, Supreme Court Rule 32(c). Can search if attorney has liability insurance on State Bar website. Effective January 1, 2007.
No No
Arkansas No No, on January 21, 2006 the House of Delegates of the Arkansas Bar Association voted not to adopt a disclosure rule.
No
California No Yes, Rule 3-410 Disclosure of Professional Liability Insurance, requires that the member inform the client in writing that they do not have professional liability insurance.
Yes, Cal. Commercial Code § 16956(a)(2) requires at least 1 million dollars in insurance coverage for lawyer partnerships.
Colorado Yes, amended C.R.C.P. 227. Can search if attorney has liability insurance on Supreme Court website (note about it here). Effective Jan. 1, 2009.
No No
Connecticut No No, at its February 23, 2009 meeting, the Connecticut Superior Court Rules Committee voted unanimously to deny a proposal to adopt an insurance disclosure rule.
No
Delaware Yes, beginning with 2009 registration form (although may have be discontinued later, unclear). See form here. Insurance status not searchable on website.
No Yes, Delaware Supreme Court Rule 67, “coverage in an amount for each claim, in excess of any deductible or retention amount, of at least the greater of (x) $1,000,000 or (y) the product obtained by multiplying $100,000 by

72 WHEN THE LAWYER SCREWS UP [29-Jun-15
State Lawyer must report legal malpractice insurance status with annual registration?
Lawyer must inform client in retainer agreement if they have malpractice insurance?
Does a lawyer LLP, an LLC, or an SC have to have liability insurance for the entity?
the number of attorneys.”
DC No No No
Florida No No No, looks like requirement was eliminated in 1999.
Georgia No No No Hawaii Yes, Rule of the Hawaii
Supreme Court (RSCH) 17(d)(1)(C). Insurance status not searchable on website.
No No
Idaho Yes, Idaho Bar Commission Rule 302(a)(5). Insurance status not searchable on website, but can call the state bar. Effective October 1, 2006.
No No
Illinois Yes, Amended Illinois Supreme Court Rule 756(e). Can search if attorney has liability insurance on Illinois Attorney Registration and Disciplinary Commission website. Rule effective 2005.
No Yes, Supreme Court Rules 722 requires insurance. Policies shall have a minimum amount of insurance of $100,000 per claim and $250,000 annual aggregate, times the number of lawyers in the firm at the beginning of the annual policy period
Indiana No No, voted down in 2003. No Iowa No No No Kansas Yes, Kansas Supreme
Court Rule 208A. Effective Sept. 6, 2005. Insurance status not searchable on state bar website.
No No
Kentucky No No, on or about November 14, 2006 the KY Sup. Ct. declined to adopt a disclosure rule.
No
Louisiana No No No Maine Yes, see FY2015 form
here from the Maine Board of Overseers of the Bar. Insurance status not searchable on website.
No No
Maryland No No No Massachusetts Yes, Supreme Judicial
Court Rule 4:02(2A). Can search if attorney has liability insurance on Mass. Board of Bar
No, proposal apparently defeated in 2014.
Yes, Supreme Judicial Court Rule 3:06: Use of Limited Liability Entities, amount set by “Designated Amount.”

29-Jun-15] WHEN THE LAWYER SCREWS UP 73
State Lawyer must report legal malpractice insurance status with annual registration?
Lawyer must inform client in retainer agreement if they have malpractice insurance?
Does a lawyer LLP, an LLC, or an SC have to have liability insurance for the entity?
Overseers website. Effective Sept. 1, 2006.
Unclear how much required actually.
Michigan Yes, Administrative Order No. 2003-5, Aug. 6, 2003. Insurance status not searchable on website.
No No
Minnesota Yes, Rule 6 of the Rules of the Supreme Court on Lawyer Registration. Effective Oct. 1, 2006. Can search if attorney has liability insurance on Minnesota Judicial Branch website.
No No
Mississippi No No No Missouri No No No Montana No No No Nebraska Yes, Supreme Court
Rule § 3-803(A)(6) requires annual disclosure. Insurance status not searchable on state bar or supreme court website.
No Yes, Supreme Court Rule § 3-201(C)(7)(b)(iv) requires lawyers organized in a partnership corporation to have at least $250,000 in compensation.
Nevada Yes, Amended Supreme Court Rule 79(2)(c) (also Rule 1.4(c)(1)(vii)), if lawyer engaged in the “private practice of law.” Can search if attorney has liability insurance on state bar website.
Yes-ish, Rule 7.4(d)(2)(iii) requires lawyers who communicate that they are “specialists or experts” in their field to carry a minimum of $500,000 in professional liability insurance (added 2006).
No
New Hampshire
No Yes, New Hampshire Rules of Professional Conduct, Rule 1.19. (Disclosure of Information to the Client). Insurance of at least 100,000 per occurrence and $300,000 in the aggregate.
No
New Jersey No No Yes, Supreme Court Rule 1:21-1B requires at least $100,000 multiplied by the number of attorneys employed by the limited liability company. Maximum not required to exceed $5 million.

74 WHEN THE LAWYER SCREWS UP [29-Jun-15
State Lawyer must report legal malpractice insurance status with annual registration?
Lawyer must inform client in retainer agreement if they have malpractice insurance?
Does a lawyer LLP, an LLC, or an SC have to have liability insurance for the entity?
New Mexico No Yes, Rule 16-104 Rules of Professional Conduct. Insurance of at least 100,000 per occurrence and $300,000 in the aggregate.
No
New York No No, NYCLA Opinion No. 734 explicitly states no duty under New York bar rules.
No
North Carolina No, repealed in 2010. No No North Dakota Yes, Amended Rule
1.15(j) of the North Dakota Rules of Professional Conduct. Insurance status not searchable on website, but “information shall be disclosed to the public upon request.”
No No
Ohio No Yes, Ohio Rules of Professional Conduct, Rule 1.4(c) requires that the member inform the client in writing that they do not have professional liability insurance for at least $100,000 or $300,000 in aggregate.
No
Oklahoma No No No Oregon No Yes, must carry it in the
amount of $300,000 per claim and $300,000 aggregate insurance coverage through the Oregon Professional Liability Fund per ORS 9.080(2)(a).
No
Pennsylvania No Yes, Rule 1.4(c) shall inform a new client in writing if the lawyer does not have professional liability insurance of at least $100,000 per occurrence and $300,000 in the aggregate per year, available here. Effective 2006.
No
Rhode Island Yes, Rule 1(b) of Article IV "Periodic Registration of Attorneys". (Effective April
No Yes, Lawyer LLCs must have insurance per Art. II, Rule 10(c). Amount required unclear.

29-Jun-15] WHEN THE LAWYER SCREWS UP 75
State Lawyer must report legal malpractice insurance status with annual registration?
Lawyer must inform client in retainer agreement if they have malpractice insurance?
Does a lawyer LLP, an LLC, or an SC have to have liability insurance for the entity?
15, 2007). Insurance status not searchable on website.
South Carolina No No Yes, LLCs in South Carolina must all carry liability insurance (at least $100,000) per SC Stat. § 33-41-1130.
South Dakota Unclear Yes, South Dakota Model Rules Of Professional Conduct, Rule 1.4(c)
No
Tennessee No No No Texas No, by letter dated April
14, 2010 to the President of the State Bar of Texas, the Supreme Court of Texas declined to adopt an insurance disclosure rule.
No No, LLC liability insurance amount eliminated in 2012. Article here.
Utah No No No Vermont No No, on December 28,
2006 the Civil Rules Committee proposed that the Vermont Supreme Court adopt a rule. Court declined.
No
Virginia Yes, Organization and Government of the Virginia State Bar, Rules of the Supreme Court of Virginia Part 6, § IV, Paragraph 18 requires lawyers to certify whether they have insurance. Insurance status searchable on specially-created website. Attorneys may only be required to have insurance if they are found in violation of a rule of professional conduct. Paragraph 13.4 regarding malpractice insurance requirements in Va. Code Section 54.1-3935(D)
No No
Washington Yes, see here “Professional Liability Insurance Policies” (Rule 26 of the Admission to Practice Rules (APR)). Can
No No

76 WHEN THE LAWYER SCREWS UP [29-Jun-15
State Lawyer must report legal malpractice insurance status with annual registration?
Lawyer must inform client in retainer agreement if they have malpractice insurance?
Does a lawyer LLP, an LLC, or an SC have to have liability insurance for the entity?
search if attorney has liability insurance on State Bar website.
West Virginia Yes, State Bar By-Laws – Article III(A) – Financial Responsibility Disclosure. Can search if attorney has liability insurance on State Bar website.
No No
Wisconsin No No Yes, SCR 20:5.7(bm) sets forth a sliding scale of law-firm minimum-insurance requirements, based on the number of attorneys in the firm up to $10 million in coverage.
Wyoming No No No
APPENDIX 2: “OTHER” ERRORS, ILLINOIS VERDICT DATA
Altered fee agreement Breach of contract Error in handling transaction Error in property division Failure to communicate settlement offer Failure to inform Failure to properly defend Failure to properly inform client of options Failure to secure funds Improper defense Improper distribution of proceeds Improper filing of case Inadequate defense Inadequate representation Mishandled defense of trademark lawsuit Misinformed client on appeal rights & charged excessive fees Negligent representation Unclear Unprepared for trial Withdrew and asked that case be dismissed with prejudice rather than without
prejudice