Embed Size (px)
Citation preview

When Is Microcredit Unsuitable?Guidelines Using Primary Evidence from
Low-Income Households in India
Vaishnavi Prathap and Rachit Khaitan
WORKING PAPEROCTOBER 2016

First published in IFF Working Paper Series (No. WP-2016-01).
IFMR Finance Foundation acknowledges generous support from CGAP Customers at the Center Financial Inclusion Research Fund and Dutch Development Bank’s (FMO) Capacity Development Program. The year-long fieldwork cited in this research was implemented by Abacus Research at IMRB International. The authors gratefully acknowledge the exceptional contributions of Arivazhagan Thirugnanam, Jawahar John, G. Krishnamoorthy, Monisha Balaraman, A. G. Shanmugam, Thilakar Pichaikannu, and the staff of IFMR Finance Foundation, without whom this research would not have been possible.
AbstractRapid expansion in the microfinance sector has been credited with advancing financial inclusion in India, even as much of this growth has focused exclusively on simple group loans and credit-linked insurance. Both central bank regulations and self-regulations address the risk of over-indebtedness often associated with rapid credit expansion through the implementation of lending caps and mandatory credit reporting, while recent regulatory developments emphasize the need for lending institutions to detect and prevent mis-sale. This paper addresses what might constitute a loan mis-sale and seeks to inform the use of suitability guidelines for lending to low-income households by microfinance institutions (MFIs), self-help groups (SHGs), and various banks.
We reviewed a diverse body of evidence on microfinance and address specific evidence gaps with a year-long financial diaries survey of 400 active borrowers in rural southern India. We found that certain features of borrowers’ cash flows as they relate to lending practices and the nature of market sector development greatly influenced how credit was used and whether it resulted in borrower distress. We observed high levels of over-indebtedness (21 percent sample households), financial distress, and debt-dependence in the sample.
Critical fault lines in credit bureau reports may cause even fully compliant lenders to mis-sell to at least 33 percent of MFI clients in the sample. To ensure responsible sale, there is an urgent need to integrate credit information about all institutional lending into a single report, and once this is done, the data suggest that it would no longer be appropriate to apply over-indebtedness regulations in their current form. Doing so could prove too restrictive for 20 percent or more borrowers, and may greatly limit the ability of formal finance to serve clients’ needs. The focus must shift away from limiting consumer choice and instead toward building institutions’ ability to use integrated credit information and conduct independent assessments of borrowers’ repayment capacity. Specifically, suitable lending to low-income households will require lenders to review all outstanding debt, assess income, and respond to critical vulnerabilities, including unusual income flows and uninsured cashflow risk.
However, successful implementation of suitability in lending depends on expanding commensurate access to savings, insurance, and investment markets. Given the lack of market-based incentives to implement suitability and regulatory barriers to multi-product origination, we conclude with recommendations for regulators, financial institutions, and future research.
WORKING PAPER

WHEN IS MICROCREDIT UNSUITABLE?
Table of Contents1. Introduction
2. Context
2.1. MFI growth and regulation in India
2.2. Literature review
3. Data
3.1. Sampling
3.2. Sample characteristics
3.3. Use of financial services
4. Results
4.1. Formality, flexibility, and loan use
4.2. Measuring debt affordability
4.3. Indicators of repayment difficulty
4.4. Intra-year volatility and debt affordability
4.5. Inadequacies in credit reports
5. Implications
5.1. Urgent need for credit bureau integration
5.2. Implementing suitability at point of sale
5.3. Delinquency management and access to recourse
5.4. Balanced market development and comprehensive financial services
References
.................................................................................................................................................. 1
......................................................................................................................................................... 2
............................................................................................ 2
.......................................................................................................................... 4
.............................................................................................................................................................. 6
....................................................................................................................................... 6
................................................................................................................. 6
................................................................................................................ 10
.......................................................................................................................................................... 13
................................................................................................ 13
........................................................................................................ 15
................................................................................................ 17
................................................................................. 20
..................................................................................................... 21
.................................................................................................................................................. 24
................................................................................. 25
.................................................................................... 25
............................................................... 25
............................... 26
................................................................................................................................................... 27
iii

WORKING PAPER

WHEN IS MICROCREDIT UNSUITABLE?
The reach of formal credit in India remains low, and rural consumer lending is dominated by group-based products. Self-help groups (SHGs) are promoted by nongovernment organizations (NGOs), government-initiated or bank-initiated programs, and linked to a bank that delivers savings and credit while joint-liability borrowing groups are mostly organized through the regulated channel of microfinance institutions (MFIs) incorporated either as nonbanking financial companies (NBFCs) or otherwise. While both types of group-based programs target similar clients and are often classified together as microcredit, they differ in service delivery and governance. Particularly, joint-liability group (JLG) lending has come to be associated with specialized financial institutions that offer only financial services to clients,1 and embedded within a commercial framework emphasizing financial viability and sustainable profitability (Mahajan and Navin 2013, Rhyne and Otero 1994, Weber 2001).
The size of the Indian microloan market was estimated at Rs. 1.4 trillion by March 2016, of which banks contributed less than 10 percent and MFIs and SHGs contributed the rest, in near equal shares (Gada, Nijjar, Agarwal, and Jhunjhunwala 2016). JLG loans alone were available in 566 of 676 Indian districts (84 percent), while in 430 districts (64 percent), five or more providers registered presence (Sriram 2015). The growth in microfinance has been credited with advancing financial inclusion, even though much of this growth has focused exclusively on simple loans and credit-linked insurance.2
Alongside the national imperative for financial inclusion, there is also a marked requirement for financial service providers (FSPs) to institutionalize mechanisms for responsible delivery of services to poor and vulnerable customers (Sahasranaman, George, Rajendran, and Prasad 2014). Acknowledging the limitations of relying merely on disclosures and ex-post redressal mechanisms, specific requirements to prevent unsuitable sales have now begun to be embedded into Indian regulation (George 2014). This research seeks to inform the development of suitability guidelines for lending to low-income households, including lending through MFIs, SHGs, and various banks. We reviewed diverse evidence on the uses and impacts of microcredit in the financial lives of low-income clients worldwide and found that borrower outcomes were heterogeneous and that negative outcomes were correlated with not only borrowers’ own characteristics but also lender practices and other market factors. Seeking to generate evidence from the Indian context, we conducted a year-long panel study of 400 rural households in southern India, almost all of whom were active borrowers (nearly half were MFI borrowers) in a competitive lending market. Following Schicks (2013), we applied a customer protection lens to indebtedness and found that borrowers in the sample were vulnerable to experiencing significant debt-related financial distress as a result of unaffordable levels or otherwise unsuitable features of their outstanding debt. Further, market-prevalent lending practices seemed to underestimate or entirely disregard borrower distress, while inadequacies in credit reports form critical fault lines that cause even compliant lenders to mis-sell unsuitable loans to clients. While certain parts of the analysis focus exclusively on MFI practices, the data suggest that these experiences were not unique to NBFC-MFIs. Given a competitive (and occasionally saturated) landscape with multiple access points for consumers, features such as fragmented credit bureaus and differential regulation for banks and NBFCs emerge as systemic threats to customer protection.
To learn more about the specific use of credit suitability assessments at point of sale, we outlined three minimum components of such as assessment—all lenders should ensure that loan amounts disbursed are both appropriate and affordable for every borrower and verify that individual payments are reasonably affordable given their cashflows. Lenders must also evaluate the risk of selling standardized products to
1. Introduction
1
1. Most MFIs in India are barred from accepting savings deposits, unless linked to or acting on behalf of a bank. Thus, microfinance outreach often also means an exclusive focus on credit and credit-linked life insurance.
2. Credit-linked insurance is valid only for the tenure of the loan and greatly undervalues insurable risk by capping sum assured at value of the loan.

2.1. MFI growth and regulation in IndiaAnalyzing the rapid expansion of JLG lending since 2012, sector reports caution that, while there has been moderate growth in client outreach, this has been far outpaced by the growth in business per client—between 2012 and 2015 alone, the average loan outstanding per client and branch had nearly doubled (Figure 1). The same report also warns that Tamil Nadu and Karnataka were not only among the fastest-growing markets, but also reported the highest incidence of noncompliant credit bureau inquiries. By a directive issued to NBFC-MFIs, the Reserve Bank of India (RBI) required all MFI lenders to compulsorily verify all loan applications against a credit bureau and that no loan should be made to an applicant already borrowing from two NBFC-MFIs or holding a total indebtedness of Rs. 1 lakh (we later discuss the antecedents and critique of this regulation). Credit bureaus record all inquiries made on loan applications and tag as noncompliant those inquiries that would subsequently lead to a loan rejection (i.e., when a high incidence of noncompliant inquiries might be a sign of aggressive loan seeking by clients or adverse marketing and group formation practices by lenders).
2. Context
borrowers who have unique liquidity or flexibility constraints, and make reasonable efforts to minimize risk. Most importantly, lenders must adequately provide for borrowers’ income volatility and uninsured cashflow risk. To do so, lenders will require sufficient frontline capacity to conduct borrower assessments and access to complete and comprehensive credit reports. Finally, we identified critical gaps in supporting infrastructure, market development, regulation, and compliance, all of which have proven essential to a suitability regime and successful customer protection.
2
WORKING PAPER
Figure 1. Patterns in the growth of NBFC-MFI lending
Source: Inclusive India Finance Report, 2015

3
3. The SROs are Microfinance Institutions Network (MFIN) and Sa-Dhan—The Association of Community Development Finance Institutions.
4. This limit was initially set at Rs. 15,000, but was revised to Rs. 30,000 in November 2015.
These caps and other restrictions on NBFC-MFIs are rooted in the Malegam committee’s recommendations (RBI 2011) that first conceived the NBFC-MFI structure as governed by a set of central regulations that could curb aggressive lending and collection practices, while also freeing MFIs from the domain of state government regulations on moneylending. Also following from this committee’s recommendations, two self-regulatory industry associations (SROs) were approved in 20143 and were tasked with formulating and administering a Code of Conduct for all member MFIs, including adequate practices to ensure borrower protection.
Both central bank and self-regulations place great emphasis on fair and responsible lending practices, including explicit measures to arrest borrower over-indebtedness. The RBI’s Fair Practices Code includes guidelines on mandatory disclosures, noncoercive collection, and grievance redressal (RBI 2015a), while the lending directive to NBFC-MFIs (RBI 2015b) requires adherence to borrower-level indebtedness limits (where total borrower indebtedness may not exceed Rs. 1 lakh or to no more than two NBFC-MFI lenders at a time). It further specifies restrictions on loans’ ticket size (no more than Rs. 60,000 in the first cycle), tenure (no less than 24 months for loans greater than Rs. 30,000),4 interest rate (no higher than a specified margin over average cost of funds). The SROs’ joint Code of Conduct requires compliance with the RBI directive but also goes further to list, as MFIs’ commitment to customers, “We, as part of the Microfinance Industry promise the customers that we will […] conduct proper due diligence to assess the need and repayment capacity of customer before making a loan and must only make loans commensurate with the client’s ability to repay” (MFIN 2015).
However, specific inadequacies in design of or compliance with the current customer protection regime may result in negative outcomes. First, the specification of lending limits could lead NBFC-MFIs to “lend to the limit” as a practice and disregard borrower heterogeneity, rely excessively on credit bureau reports, and fail to assess debt affordability in more meaningful ways (Gada, Nijjar, Agarwal, and Jhunjhunwala 2016). Second, both central bank and self-regulations apply only to NBFC-MFIs while at least four other types of institutions serve low-income clients (Sriram 2015)—universal and small finance banks are governed by RBI but through a different set of regulations than NBFC-MFIs, while cooperatives, SHG promoting organizations, nonprofits, and NGOs delivering financial services may be regulated by state governments, or not at all. There are also concerns that certain aspects of RBI regulations treat banks and nonbanks differently, including those that govern the terms of lending to low-income clients and even in markets where both sets of entities are active (Jariwala and Mehta 2015). The Draft Micro Finance Institutions (Development and Regulation) Bill of 2012 sought, unsuccessfully, to usher in uniform activity-based regulation; the onus of ensuring harmonized regulation in microfinance remains with RBI.
Third, even where the language of regulation is clear, inadequacies in credit reporting practices and bureau infrastructure may limit institutions’ ability to conduct comprehensive assessments (Jariwala and Mehta 2015, Khaitan 2015, Mathews 2016). Jariwala and Mehta (2015) estimate that microfinance credit bureaus do not capture as much as 47 percent of total microfinance debt (including loans made by business correspondents of banks, SHGs, small MFIs, and NGOs).
Nevertheless, reports confirm overall satisfactory compliance with the rules, and the success of efforts to organize commercial microfinance and curb reckless lending. This period has also seen NBFC-MFIs establish tremendous formalization and strong internal capacity (several applied for and successfully received banking licenses in 2015). These internal developments will also prove critical for their successful adoption of suitable practices toward better customer protection.
WHEN IS MICROCREDIT UNSUITABLE?

WORKING PAPER
4
2.2. Literature reviewThe discussion of mis-selling in financial services in India has been limited and has been largely focused on the practices of universal banks (Das 2013, Halan and Sane 2016, Mowl and Boudot 2014, RBI 2016). Related discussions in microfinance, while yet to explore mis-sale, document variations in organization structures, delivery channels, lending practices, and of course, the nature of regulation. A recent wave of rigorously collected and systematically synthesized evidence also confirmed significant heterogeneity in microborrower outcomes—certain client types benefitted greatly from their small loans (Angelucci, Karlan, and Zinman 2013; Karlan, Knight, and Udry 2012; Banerjee, Breza, Duflo, and Kinnan 2014) while others presumably did not, and these effects mostly cancelled each other out (Banerjee, Karlan, and Zinman 2015; Kaboski, Buera, and Shin 2016). Factors such as borrowers’ entrepreneurial character, risk tolerance, and patience as well as loan use, having prior credit experience, and overall community characteristics have been shown to mediate the ultimate impact of microcredit access on borrowers.
Randomized evaluations did not explicitly seek to identify which customers experienced the most harm from microfinance, although this is perhaps the most critical evidence required from a customer protection perspective. For example, respondents receiving more access to credit in Hyderabad, India, reported on average that they were more worried and less happy (Banerjee, Breza, Duflo, and Kinnan 2014), although it is unclear whether objective measures of indebtedness were correlated with reported distress. The reverse was observed in some other study environments, and the underlying factors driving heterogeneous qualitative experiences with microloans are yet to be rigorously understood.
The risk of borrower over-indebtedness is among the biggest threats to customer protection in microfinance. The consequences of over-indebtedness for borrowers can be severe, but will likely differ depending on the extent of over-indebtedness and the strategies adopted to manage this debt. Transitional over-indebtedness may be characterized by levels of debt that are high relative to income, but not overwhelmingly so; borrowers might be able to use various strategies to stabilize and reduce total debt over the medium term (Guérin, Roesch, Venkatasubramanian, and Kumar 2013) without significantly eroding their asset holdings. However, borrowers carrying persistently higher levels of debt (such as when the repayments due are equal to income, or higher) were observed juggling various sources of funds to maintain their creditworthiness, and were also likely to experience significant asset erosion (Grammling 2009, Guérin, Roesch, Venkatasubramanian, and Kumar 2013), pauperization, or extreme dependence on support from social networks.
Often, low-income households themselves may be aware of the implications of positive coping strategies versus negative, undesirable strategies, but their ability to choose to adopt strategies might be limited in an underdeveloped financial market and also determined by factors such as timeliness and reliability of formal services or the opportunity costs of doing so (Gash and Gray 2016). Often, opportunity costs may include more than transaction costs—for example, low-income households in Kenya held 70-90 percent of their savings in illiquid “committed” savings products with presumable economic and psychological costs attached to premature withdrawal (Zollmann 2015). Other results from recent financial diaries mark the emergence of critical issues in customer protection for the poor over and above longstanding concerns to improve access. Both Meka and Grider (2016) and Stuart (2015) highlight a subset of low-income clients who accessed and actively used formal credit, but often without fully understanding implicit costs and at risk of debt entrapment in an environment without sufficient safeguards.
Schicks and Rosenberg (2011) reviewed six field studies from saturated markets and reported that anywhere between 12 percent and 85 percent of the study populations were classified as over-indebted. Definitions of over-indebtedness were also as widely varied: they could be the outcomes of debt (delinquency or

WHEN IS MICROCREDIT UNSUITABLE?
5
5. A center is a slum or hamlet within which multiple JLGs are aggregated for operational ease. All groups in a center usually have meetings at the same time, at a central location, and receive loans in roughly the same cycle. A center leader is assigned to aid coordination between the MFI and borrowers. However, it may be unrealistic to expect that borrowers may be willing to be jointly liable for all in their center, rather than just the members of their group. The level of information asymmetry and social differences at the center level may be much higher than with smaller groups.
default, although these are typically lagging indicators), borrowers’ financial characteristics (number of loans, debt-service ratio and debt-asset leverage ratio), or the nature of sacrifices made by borrowers to meet repayments. Schicks (2013) develops a unique, exhaustive, and multi-dimensional classification for definitions of over-indebtedness along several dimensions and argues that the “problem indicators” that lenders may care about from a risk management and self-preservation perspective may not adequately measure the harms from which customers should be protected. Many studies seem to agree that to understand debt-related distress research, the focus must shift from impacts created after the loan to the process of making repayments during the loan (Dattasharma, Kamath, and Ramanathan 2016; Field, Pande, Papp, and Park 2012; Schicks 2013; Venkata, Yamini, and Krishna 2010).
Factors other than total level of debt or the debt-income ratio may also mediate whether borrowers experience distress. Venkata, Yamini, and Krishna (2010) document that microcredit borrowers attributed financial stress they experienced during the loan tenure to seasonality-related income volatility, life-cycle events, and related expense volatility and the additional burden of repayment in the event of delinquency by others in their group. Field, Pande, Papp, and Park (2012) found that clients with a monthly repayment schedule scored 45 percent lower on a Financial Stress Index than clients with repayments due every week. Further, they observed that this differential was particularly large toward the end of the loan (correlated with a large differential in the average incomes earned by the two subgroups), demonstrating how microcredit’s features hold the potential to both induce and mitigate financial stress.
Deep qualitative research has highlighted systematic lending practices that place tremendous stress on borrowers to hide delinquencies and make timely repayments at any cost. Even by the design of dynamic incentives, individual borrowers have explicit incentives to “manage away” temporary liquidity mismatches in favor of a clean repayment record. Also, by design, JLG members are expected to help each other make timely repayments either through internal lending or through coercion. Interviews with microfinance borrowers have confirmed that these terms of microfinance borrowing are well understood (Tiwari, Khandelwal, and Ramji 2008). However, when these norms for borrowers are not matched by norms for responsible lending and borrowers hold unsustainable debt, the brute application of coercive collection and public shaming (Karim 2011; Mowl 2016) may make it nearly impossible for borrowers to admit repayment difficulties and seek renegotiation. MFIs have institutionalized practices that simply do not allow delinquencies to occur—some expanding the scope of joint liability to the center5 level (Nandhi 2015) and some even recovering losses from their own frontline staff who are unable to collect timely repayments. Such practices, in addition to placing a great deal of stress on delinquent borrowers, also create distortions in the integrity of the repayment record itself and all centralized credit information.

WORKING PAPER
6
3. Data
6. In comparison, the same data source cites an average loan balance for all Tamil Nadu at Rs. 10,126 and all India at Rs. 10,258.
7. The minimum living standard was estimated as the 10th percentile of the monthly per capita expenditure (MPCE) reported for Tamilnadu, around Rs. 979 monthly per capita (NSSO 2011).
The primary data collection for this study was conducted between February 2015 and May 2016 in Krishnagiri district, Tamil Nadu, located in adjunction with two other southern Indian states—Andhra Pradesh and Karnataka. The reach of institutional lending is higher in Krishnagiri when compared to all-India rural outreach. In 2012, the estimated incidence of rural institutional indebtedness in Krishnagiri was 29 percent of households (vs. 22 percent all-India), and the median institutional debt outstanding per borrowing household was Rs. 34,606 (vs. Rs. 18,488 all-India), according to authors’ estimates from NSSO’S All India Debt and Investment Survey 2012-2013. In 2013, Krishnagiri ranked among the top 100 Indian districts in formal financial development, while Tamil Nadu itself consistently ranked among the very best performing states (CRISIL 2015). The MIX Finclusion database consistently ranked Krishnagiri district as well-served, with a total gross loan portfolio of Rs. 58.84 crores and an average loan outstanding of Rs. 19,5426 in June 2015 (MIX 2016).
3.1. SamplingRural households from Krishnagiri were recruited into the study by a stratified random sampling protocol. Census villages were first surveyed for active JLG borrowing, and 18 villages were chosen. All member households of randomly selected JLGs were included in the sample; an equal number of non-MFI households from each village was also included. For example, if we sampled two JLGs of five members each, we also randomly sampled 10 households from the same village who did not borrow from MFIs, but likely borrowed from a variety of other sources, including banks, SHGs, and moneylenders. Thus oversampling JLG borrowers overestimates the incidence of microfinance indebtedness in the sample, but permitted a detailed investigation on the borrowing behavior of similar households within a small sample.
We conducted detailed monthly interviews with 400 panel households for a year, surveying in detail their socioeconomic characteristics, cashflows, access to finance, and financial behavior.
3.2. Sample characteristicsThe largest proportion of sample households reported their primary income source as casual wage labor (46 percent), while 41 percent of households cited the same as a nonprimary income source (see Figure 2). Thirty-two percent of households reported self-employment as a primary income source, and 33 percent reported this as a nonprimary income source. Only 66 percent of households had any salaried/regular wage source of income, and for only 20 percent of households was this regular wage also their primary income.
Total income for the household typically came from two or more sources, and median household monthly income was Rs. 12,773 or Rs. 2,770 per capita (Rs. 1,757 for the poorest 40 percent of households in the sample). We plot the distribution of per capita household incomes and expenses (counting both adults and children) in Figure 3, against a reference line representing per capita expenses required to preserve a minimum living standard.7 We found that only 4 percent of households’ average income was too low to support the minimum living standard for all household members, whereas nearly 21 percent of households’ actual consumption was below the minimum standard, suggesting that at least 17 percent of sample households may have needed to allocate resources away from essential consumption to meet other obligations.

WHEN IS MICROCREDIT UNSUITABLE?
Figure 2. Occupational distribution of sample households
7
Figure 3. Distribution of per-capita income and expenses
Amount (in Rs.)
Den
sity
0 5000 10000 15000
0.0
002
.000
4.0
006

WORKING PAPER
Sample Poorest 40% Middle 40% Richest 20%
Median CV Median CV Median CV Median CV
Income 12,773 0.48 9,323 0.50 13,936 0.45 22,603 0.50
Expenses
Food 2,987 0.45 2,442 0.46 3,122 0.45 3,541 0.45
Medical 423 1.64 322 1.59 409 1.72 764 1.59
Celebrations 1,212 1.51 909 1.58 1,308 1.48 1,514 1.47
Other nonfood 3,043 0.76 2,412 0.80 3,301 0.74 4,410 0.76
Surplus 4,286 0.98 2,662 0.99 5,206 1.02 9,195 0.92
8
Table 1 shows the average expenditure and monthly variation in expenditure by category. Food expenditure is, on average, just as volatile as income, with a co-efficient of variation around 0.48, which translates to average monthly swings of +/- 45 percent. For example, if the average household’s total earnings was Rs. 12,000 this month, they might be anywhere between Rs. 6,240 and Rs. 17,760 in the next month. Nonfood essential expenditures and monthly expenditures on medical treatment and various celebrations were more volatile, but higher volatility in the latter two is also linked to their infrequent incidence. Even relatively well-off households in the sample (monthly per capita incomes around Rs. 6,050 or higher) report the same average cashflow volatility as the poorest, suggesting that income uncertainty is a near-universal experience for low-income households.
In our monthly surveys, we asked sample households if they experienced any major or unplanned events or expenses since the last visit—we included this set of questions to understand whether some of the causes of cashflow volatility were predictable to households. Nearly all households reported that in the past year they indeed experienced shocks, but some of these were perhaps predictable (in incidence, if not amount). For example, the most common “shocks” reported were birthdays, religious ceremonies, and social events; illness or injury to a household member; and travel for personal reasons or seeking work. In total, each of these events came with significant financial costs (Figure 4) and occasionally, loss of working days (Figure 5).
Table 1. Level and volatility of household cashflows

WHEN IS MICROCREDIT UNSUITABLE?
9
Figure 5. Opportunity costs of major events or shocks
Figure 4. Financial costs of major events or shocks
(Thousands)

WORKING PAPER
10
3.3. UseoffinancialservicesSample households reported moderate access and varied uses of financial services. Every household reported that at least one member held a bank account, while 69 percent households were enrolled in the state government’s health insurance scheme8 and 22 percent held purchased insurance cover (for life, health, personal accident, or vehicle). During the study’s year-long observation, we noted one successful life insurance payout of Rs. 15 lakhs, one unsuccessful claim (a widow was unable to locate the policy document upon her husband’s death, and the claim was rejected), and a few health insurance claims but, unfortunately, detailed data on insurance were not recorded.
On savings, we observe a clear trend of households earmarking accounts to certain types of use. While all households held an account at a bank, its’ use was mostly transactional—wages or payments were received into the account and withdrawn, but seldom did users make deposits, and account balances were kept low. Instead, households made larger deposits into SHG savings (often held as collateral against SHG borrowing) and chit funds, among other formal accounts. These avenues were preferred to accumulate larger sums, and withdrawals were rare, even under financial distress. This behavior is not unusual among low-income households (Zollmann 2015) and might also be further influenced by specific features of product design that encouraged or enforced commitment and illiquidity.
Table 2. Savings and insurance use
8. This scheme was launched in 2011 and provides cashless hospitalization up to Rs. 1-1.5 lakh and other benefits such as diagnostic tests and follow-up treatments for eligible families whose annual income is less than Rs. 72,000 (GOTN 2011).
Bank SHG Other Formal% of households
Any household member holds an account 100% 78% 37%
Median savings balance (in Rs.) 2,583 11,700 22,750
At least one transaction in the past year
Received a payment (government-to-person or person-to-person) 84% 0% 0%
Made a deposit 56% 77% 34%
Made a withdrawal 81% 4% 6%
Sample households also reported high incidence of institutional debt, and loans from MFIs and SHGs were frequently reported as were loans received through domestic banks. Sample estimates of indebtedness are, however, not representative, since we over-sampled microfinance borrowers. In terms of informal borrowing, loans from friends or other nonkin social connections were more common than loans from relatives. The incidence of nongroup borrowing did not significantly differ between the JLG and non-JLG samples.
In total, the recorded contract features and repayments were more than 1,700 formal and informal loans. Across the sample, borrowers reported that the largest loans they received were from banks and bank-linked SHGs (Rs. 50,000 and Rs. 30,000, respectively). The median loan received from an MFI was Rs. 22,000.

WHEN IS MICROCREDIT UNSUITABLE?
11
Table 3. Credit use
9. A jewel loan is a loan against collateral and is typically marketed as providing short-term liquidity relief and is widely offered at both rural and urban bank branches. Several features explain the popularity of the product—many low-income households own gold jewelry—interest rates are much lower than other institutional loans, and the loan often requires only one lump-sum payment within a year to redeem the jewelry, or alternatively, a settlement of the interest to-date wherein the loan is “rolled-over” or simply renewed, both of which are very attractive options to borrowers who might not have imminent income flows to commence regular repayment.
Sample Poorest* 40% Middle 40% Richest 20%Informal % of households with at least one outstanding loan
Kin 34% 38% 36% 23%
Nonkin 63% 69% 65% 44%
Institutional
Bank 37% 41% 32% 38%
Cooperative society/ bank 14% 17% 11% 14%
MFI 52% 50% 47% 65%
SHG 39% 49% 32% 35%
Other 25% 32% 20% 21%
Cross-borrowing
Both informal and institutional 64% 70% 62% 54%
More than one institutional type 55% 64% 47% 54%
* Wealth quintiles were estimated from household per capita income, and the cut-offs were Rs. 2500 (P40) and Rs. 4570 (P80), respectively.
More than half of the sample borrowed from multiple formal institutions, while for the subset of MFI borrowers, the extent of cross-borrowing was as high as 72–36 percent; MFI borrowers also had a loan outstanding from banks, 47 percent from a bank-linked SHG, and 15 percent from cooperatives. Recall that credit information for each institutional type is mostly held separately.
MFI and SHG loans were unsecured, while approximately half of the loans from banks and cooperatives were secured either by gold jewelry, cooperative shares, or other documents, including property titles. Most informal loans were unsecured, but not necessarily interest-free.
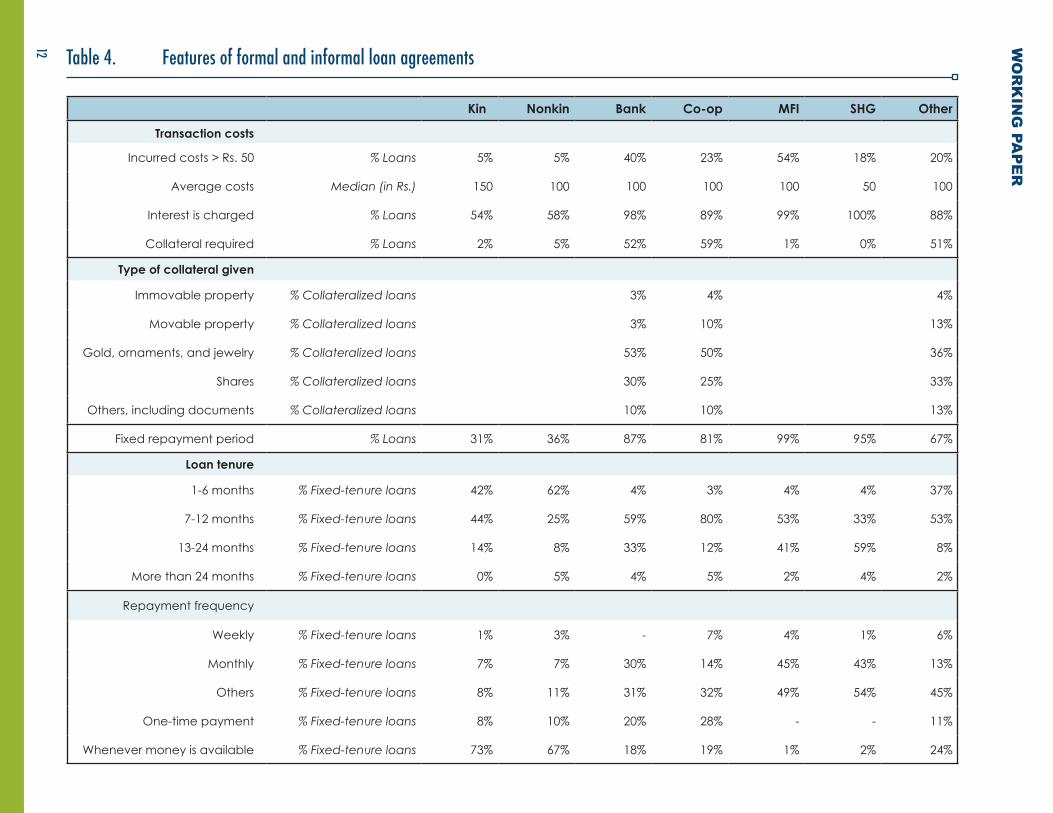
There were three types of repayment structures: fixed tenure and regular repayment schedules; fixed tenure and “bullet” repayment schedules (where both interest and principal are paid one time at the end of the contract, or a moderate rate of interest alone is serviced through frequent payments but principal is paid down at the end of the contract); and flexible repayment schedules where either tenure or payment frequency or both were left unspecified. Purely flexible payment schedules were largely limited to informal lending, whereas bullet repayments and the flexibility to pay anytime within a fixed period was available through the widespread success of the jewel loan product.9
WO
RK
ING
PAP
ER
12 Table 4. Features of formal and informal loan agreements
Kin Nonkin Bank Co-op MFI SHG Other
Transaction costs
Incurred costs > Rs. 50 % Loans 5% 5% 40% 23% 54% 18% 20%
Average costs Median (in Rs.) 150 100 100 100 100 50 100
Interest is charged % Loans 54% 58% 98% 89% 99% 100% 88%
Collateral required % Loans 2% 5% 52% 59% 1% 0% 51%
Type of collateral given
Immovable property % Collateralized loans 3% 4% 4%
Movable property % Collateralized loans 3% 10% 13%
Gold, ornaments, and jewelry % Collateralized loans 53% 50% 36%
Shares % Collateralized loans 30% 25% 33%
Others, including documents % Collateralized loans 10% 10% 13%
Fixed repayment period % Loans 31% 36% 87% 81% 99% 95% 67%
Loan tenure
1-6 months % Fixed-tenure loans 42% 62% 4% 3% 4% 4% 37%
7-12 months % Fixed-tenure loans 44% 25% 59% 80% 53% 33% 53%
13-24 months % Fixed-tenure loans 14% 8% 33% 12% 41% 59% 8%
More than 24 months % Fixed-tenure loans 0% 5% 4% 5% 2% 4% 2%
Repayment frequency
Weekly % Fixed-tenure loans 1% 3% - 7% 4% 1% 6%
Monthly % Fixed-tenure loans 7% 7% 30% 14% 45% 43% 13%
Others % Fixed-tenure loans 8% 11% 31% 32% 49% 54% 45%
One-time payment % Fixed-tenure loans 8% 10% 20% 28% - - 11%
Whenever money is available % Fixed-tenure loans 73% 67% 18% 19% 1% 2% 24%

WHEN IS MICROCREDIT UNSUITABLE?
13
This section presents the analysis in five parts. First we examine a variety of uses for credit during the year-long observation of borrowers and found that borrowing for consumption smoothing and repayment smoothing dominated all formal and informal borrowing in this sample. In the second and third parts we classify borrowers by the affordability of their institutional loans and test for systematic correlations among borrower characteristics, debt affordability, and debt management strategies. Across the board, we found that all borrowers had a higher level of inter-year volatility and loan delinquency and a lower willingness or ability to withdraw financial assets than expected. Borrowers with highest levels of unaffordable debt were also the most likely to sacrifice essential expenditure, have a lower living standard, and be highly debt-dependent. We hypothesize that this is possible for sample households because of multiple access points and certain weaknesses’ in lenders’ due diligence process. In the fourth part, we examine the specific effects of income volatility to find that having an unsteady income was just as likely to cause distress as almost not having an income surplus at all. Together with the previous results we found that patterns in borrowers’ cashflows hold important information about how they might experience repayment and financial distress.
We found that more MFI clients reported unaffordable levels of debt and sought to understand if patterns of unaffordability were in some way correlated with MFIs’ due diligence or other features.
In the fifth part of the analysis we simulate the functioning of credit bureaus using data from the survey and found that in the presence of multiple borrowing and a fragmented bureau system, lenders will unknowingly over-estimate borrower eligibility. We return estimates similar to Jariwala and Mehta (2015) although ours are not nationally representative. We also present evidence that a segment of MFI clients experiencing upward income mobility will find the lending caps set by current regulation restrictive unless they are also able to access other means of credit. We highlight this as concern for improved regulatory design, even as we otherwise recommend the harmonization of customer protection regulation across banks and nonbanks.
4.1. Formality,flexibility,andloanuseA review of loan features in Table 4 reveals varying degrees of repayment flexibility in loan contracts. In terms of loan use, we found across the board that the top reported uses in the sample were to meet repayment or expense obligations, including human capital investments. Of the remaining loans, more borrowers used institutional loans for expenses or investments in agriculture, business, or property, while informal loans were more often used to finance social events and health expenses. However, we found no lender preference when loans were used to meet consumption expenses or repay old debt. Of those who borrowed from institutions to meet consumption expenses, significantly more borrowers reported that they often used rather inflexible, short-term institutional loans to do so. Borrowers also reported using inflexible loans to finance business expenditure (both institutional and informal loans) and for expenses incurred during social events.
On the other hand, flexibility in repayment was available to borrowers in two forms—as the ability to make a one-time payment, or to pay whenever money was available (often available only from an informal lender). Borrowers used flexible loans for a variety of purposes, but significantly more only when borrowing to pay for health expenses. Here, as well, there was no lender preference when the loan was used to make repayments on older loans.
4. Results

WORKING PAPER
14
Figure 7. Repayment flexibility and loan use— Informal loans
Figure 6. Repayment flexibility and loan use— Institutional loans
WHEN IS MICROCREDIT UNSUITABLE?
All loans Institutional loans
Monthly income less minimum living expenses (in Rs.) Monthly income less minimum living expenses (in Rs.)
Mon
thly
repa
ymen
t obl
igat
ions
(in
Rs.)
Mon
thly
repa
ymen
t obl
igat
ions
(in
Rs.)
0 20000 40000 60000 0 20000 40000 60000
050
000
1000
0015
0000
050
000
1000
0015
0000
15
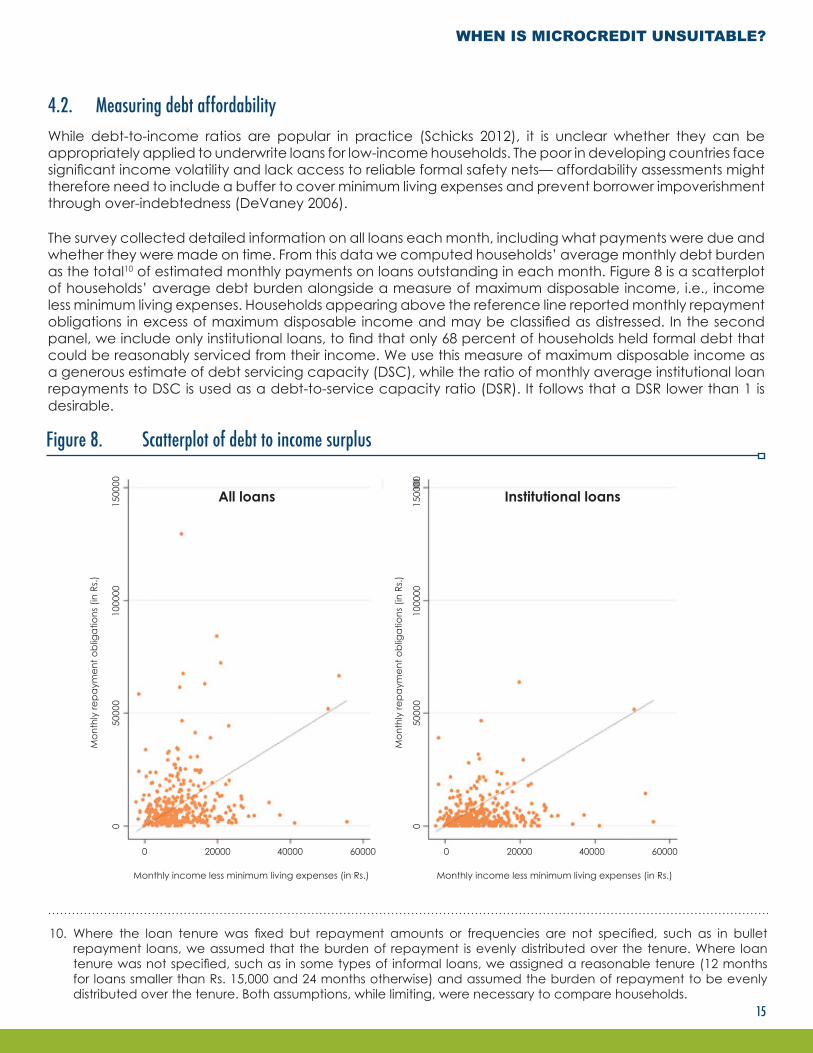
4.2. Measuring debt affordabilityWhile debt-to-income ratios are popular in practice (Schicks 2012), it is unclear whether they can be appropriately applied to underwrite loans for low-income households. The poor in developing countries face significant income volatility and lack access to reliable formal safety nets— affordability assessments might therefore need to include a buffer to cover minimum living expenses and prevent borrower impoverishment through over-indebtedness (DeVaney 2006).
The survey collected detailed information on all loans each month, including what payments were due and whether they were made on time. From this data we computed households’ average monthly debt burden as the total10 of estimated monthly payments on loans outstanding in each month. Figure 8 is a scatterplot of households’ average debt burden alongside a measure of maximum disposable income, i.e., income less minimum living expenses. Households appearing above the reference line reported monthly repayment obligations in excess of maximum disposable income and may be classified as distressed. In the second panel, we include only institutional loans, to find that only 68 percent of households held formal debt that could be reasonably serviced from their income. We use this measure of maximum disposable income as a generous estimate of debt servicing capacity (DSC), while the ratio of monthly average institutional loan repayments to DSC is used as a debt-to-service capacity ratio (DSR). It follows that a DSR lower than 1 is desirable.
10. Where the loan tenure was fixed but repayment amounts or frequencies are not specified, such as in bullet repayment loans, we assumed that the burden of repayment is evenly distributed over the tenure. Where loan tenure was not specified, such as in some types of informal loans, we assigned a reasonable tenure (12 months for loans smaller than Rs. 15,000 and 24 months otherwise) and assumed the burden of repayment to be evenly distributed over the tenure. Both assumptions, while limiting, were necessary to compare households.
Figure 8. Scatterplot of debt to income surplus

WORKING PAPER
16
Comparing the two panels in Figure 8, it is evident that considering only institutional loans underestimates overall household debt burden for the whole sample and likely misclassifies some households as “healthy” when in fact they might be distressed by high informal debt. However, our analysis of affordability remains limited to institutional loans as a reflection of what data might be available from a comprehensive credit report, with the caveat that all lending institutions are expected to reasonably assess borrowers’ outstanding debt, whether or not directly available from a credit bureau.
Table 5. Distribution of sample households by the affordability of institutional debt
For 68 percent of sample households, overall monthly repayment obligations on institutional loans were within 80 percent of their DSC, suggesting that these borrowers should have been able to make loan repayments on time and also incur additional expenditures above the minimum living standard. Note that even households with a comfortable DSR status carry moderate to high levels of flexible debt—to pay down those loans borrowers will need to save-up lump sums or mobilize funds from other sources when those payments are due.
For yet another 10 percent households, their monthly repayment obligations appeared to deplete their DSC, leaving little excess (or a small deficit) to manage any expenses above an absolute minimum that may arise during these loans (such as higher school fees, travel, celebrations, or ceremonies). Should these borrowers face a health shock or an adverse event, or if one of their informal creditors asks to be repaid, or even if they wish to raise their standard of living, they might struggle to find the necessary resources while also making timely loan repayments.
The DSR of remaining households (21 percent of the sample), seems to indicate that they might experience significant financial distress during the loan tenure, for as long as current institutional loans remain outstanding and income sources remain unchanged. These households also carried high levels of informal debt (nearly thrice as much as borrowers with surplus repayment capacity) and were likely to struggle to raise resources for regular repayments and to save ahead for bullet repayments.
For a small number of these households, it appeared that they were in overall income deficit, regardless of their debt level. They did have income sources but none was regular, and this created extremely volatile and infrequent monthly surpluses. Earlier we had discussed income and surplus volatility as a monthly phenomenon. Here, we observe that, for 2 percent of indebted households in the sample, much of this volatility was persistent for a large part of the year we observed them, if not longer.
Borrowers in each of the four categories reported varying socioeconomic characteristics and financial behavior. For example, borrowers with surplus repayment capacity earned higher incomes on average, while borrowers with deficit repayment capacities earned the lowest incomes and spent significantly lower amounts on food and nonfood essentials every month.
Category Description % households
Surplus DSC Monthly debt obligations up to 0.8 times surplus 68
Borderline DSC Monthly debt obligations 0.8-1.2 times surplus 10
Deficit DSC Monthly debt obligations greater than 1.2 times surplus 19
Deficit Income Income lesser than minimum expenses 2

WHEN IS MICROCREDIT UNSUITABLE?
17
Table 6. Income and expenses by debt affordability
4.3. IndicatorsofrepaymentdifficultyDuring the year-long survey of borrowers, we observed their borrowing and repayment behavior regularly and in detail. For the more than 1,700 loans that we tracked during this period, we asked what payments were due, and when these payments fell due, we observed whether and how they were made. It should be noted that repayment data were self-reported by respondents and triangulated to ensure that all inflows and outflows were accounted for, but subjective measures were harder to verify.11 Nevertheless, self-reported delinquency remains a primary indicator of repayment difficulties in our analysis. In addition, we also measure and estimate a variety of simultaneous savings, withdrawals, and borrowing that act to stretch household budgets in times of need: an excessive reliance on “negative” coping mechanisms to avoid delinquency also count as indicators of repayment difficulties.
We use estimates for the group of borrowers with surplus repayment capacity to represent a sort of baseline, and compare whether incidents of adverse coping are more frequent for borrowers who appear to be in financial distress due to unaffordable debt vs. borrowers with affordable debt. Accordingly, the tests of significance for estimates in Column 1 test whether the estimate is significantly different from zero, while the tests for columns 2-4 test for difference from the corresponding column 1 estimate.
We found that the “baseline” level of delinquency for low-income borrowers was around 3-4 percent for institutional loans and up to 6 percentage points higher for informal loans. We also found that, among groups of borrowers with lower repayment capacity, significantly more households reported delinquency. Estimates of delinquency on microfinance loans in the sample (unsecured loans) were around 15 percent, but there is little public information available to benchmark these estimates against.
11. Borrowers were inconsistent in whether small delays in payments (say, within two days) counted as on-time payments. For this reason, our estimates of delinquency on institutional loans may not match administrative estimates of MFIs or banks. For informal and flexible loans, we found borrowers to be even less consistent in reporting delinquency status—on a flexible loan from a friend, borrowers may initially report that they could make repayments anytime for up to a year, yet they also consistently reported in monthly follow-ups through this tenure that they were behind on their repayments and thus, delinquent. It is likely that flexible creditors employ frequent reminders to stress to the borrower the outstanding obligation to repay, which also shows up as self-reports of delinquency.
(1)Surplus DSC
(2)Borderline DSC
(3)Deficit DSC
(4)Deficit Income
Amount in Rs.
Income 13693a 11506 8545b 4994b
Expenses
Food 2727a 2366b 2122b 1893b
Medical 898a 752 722 1160
Celebrations 1580a 1128 1323 572
Other nonfood 3429a 2923 2686b 2865
a. Null hypothesis of equality with zero rejected at 5%b. Null hypothesis of equality with corresponding column 1 estimate rejected at 5%

WORKING PAPER
18
We also found evidence that measures of loan delinquency may underestimate underlying financial distress. Borrowers with borderline or deficit repayment capacity reported that nearly 40 percent of them received support from their social networks to get by, and notwithstanding, nearly 50 percent persisted below an objective minimum living standard (defined in Footnote 7), while only 10-15 percent reported delinquency. The incidence of these coping mechanisms was also significantly higher than corresponding estimates for borrowers with surplus repayment capacity. In contrast, behaviors such as asset withdrawals or sales did not significantly vary with the level of debt-related distress, although even at the baseline, 37 percent of low-income borrowers reported withdrawals from savings accounts during the study’s observation. Recall that 84 percent of sample households received government transfers or wages into bank accounts, and frequent withdrawals may be necessary to receive payments, thus explaining the high incidence of net withdrawals for the comparison group.
Many borrower households reported continuously borrowing from multiple sources through the study’s observation and, as expected by definition, borrowers with unaffordable debt also reported higher and more frequent borrowing. We do not consider borrowing in itself to be an indicator of distress—it has been well documented that credit is a valuable financial tool to finance lumpy expenditures and enable
Table 7. Methods of coping with financial distress, by debt affordability
(1)Surplus DSC
(2)Borderline DSC
(3)Deficit DSC
(4)Deficit Income
Delinquency or delayed payments % households, at least once in the last year
Institutional and secured loans 3.2a 10.5 11.4b 14.2
Institutional and unsecured loans 3.6a 15.7b 14.2b 0.0
Informal and with interest loans 9.6a 23.6b 14.2 28.5
Informal and interest-free loans 9.2a 10.5 10.0 28.5
New borrowing
Institutional and secured 14.0a 34.2b 40.0b 28.5
Institutional and unsecured 52.8a 84.2b 78.5b 85.7
Informal and with interest 33.2a 44.7 58.5b 71.4b
Informal and interest-free 34.0a 52.6b 55.7b 85.7b
Other mechanismsConsumption below minimum
living standard 24.4a 47.3b 51.4b 57.1
Received net transfers from social networks 20.4a 36.8b 44.2b 85.7b
Net withdrawals from financial assets 37.6a 26.3 40.0 42.8
Sale of livestock 9.2a 7.8 15.7 14.2
Sale of land 0.4a 2.6 1.4 0.0
a. Null hypothesis of equality with zero rejected at 5%b. Null hypothesis of equality with corresponding column 1 estimate rejected at 5%

WHEN IS MICROCREDIT UNSUITABLE?
19
investments in business or human capital that would otherwise not be possible for low-income households. However, we do record the multiple uses of each loan, and by tracking the uses of loans as they are borrowed and spent instead of relying on longer-term recall, we are able to construct a reasonably reliable picture of loan use (see Section 4.1). Here, we found that borrowers with low or deficit repayment capacity reported a much greater incidence of using new loans to repay old ones (15 percent, 31 percent, and 28 percent, respectively, in comparison to 5 percent among borrowers with surplus capacity) and consistently so across a variety of loan sources—smaller informal loans helped to manage monthly repayments, while larger institutional loans may be used to make a large one-time payment or to settle multiple debts incurred over time in one go.
We found a similar reliance on new borrowing to meet household expenses and that this behavior is consistent with borrowers trying to stretch household resources and budgets when under distress—new loans served to expand available resources, allowing borrowers to spend more than they could otherwise afford in that time period, and allocate resources toward both household expenses and repayments, among other things. However, if distressed borrowers were to resort to new borrowing at every instance of need and if such credit were always available, it’s easy to imagine how borrowers with low or uncertain incomes might quickly rack up multiple, unaffordable loans.
Table 8. Loan use as an indicator of financial distress, by debt affordability
a. Null hypothesis of equality with zero rejected at 5%b. Null hypothesis of equality with corresponding column 1 estimate rejected at 5%
(1)Surplus DSC
(2)Borderline DSC
(3)Deficit DSC
(4)Deficit Income
Institutional and secured % households, at least once in the last year
Repay old debts 5.2a 15.70b 31.4b 28.5b
Consumption 6.4a 15.07 20.0b 14.2
Health 2.8a 7.80 4.2 14.2
Institutional and unsecured
Repay old debts 18.4a 42.1b 60.0b 71.4b
Consumption 32.0a 55.2b 52.8b 57.1
Health 7.2a 13.1 10.0 28.5b
Informal and with interest
Repay old debts 9.2a 21.0 32.8b 28.5
Consumption 16.0a 26.3 31.4b 57.1b
Health 8.0a 5.2 14.2 42.8b
Informal and interest-free
Repay old debts 9.2a 23.6b 22.8b 42.8b
Consumption 17.2a 23.6 22.8 28.5
Health 12.0a 7.8 25.7b 42.8b

WORKING PAPER
Figure 9. Implications of incomplete savings
20
The estimates in this paper are not intended to evoke a causal relationship between credit access and harmful financial behaviors, in either direction. However, we present evidence to suggest the coincidence of debt-induced distress and certain financial behaviors and coping mechanisms that might prove self-defeating in the medium term. Even while abstaining from a causal interpretation, the observation that borrowers with deficit repayment capacity were also the types of borrowers who rely heavily on new borrowing to smooth financial difficulties has critical implications. First, the absence of liquid savings that households are able and willing to draw on under distress is stark. Second, a cycle of debt dependence is evident for some low-income borrowers, amid weak mechanisms for recourse. Third, the evidence suggests that some of the loans observed in this study were mis-sold, i.e., they were lent to borrowers who did not have the reasonable means to afford repayments. The ambit of this type of mis-sale is not small—in this sample, 21 percent households were carrying unaffordable loans made by regulated institutions, many of whom already had specific measures in place purported to prevent exactly this outcome.
4.4. Intra-year volatility and debt affordabilityThe analysis thus far treated the group of borrowers with surplus repayment capacity as a comparison group, and as one that was not expected to face debt-related financial distress. Repayment capacity, in turn, was estimated from average monthly incomes and initially specified loan terms. However, the incomes for most low-income borrowers in our sample were not earned in a uniform stream (see Table 1) and, therefore, even among households with an overall surplus repayment capacity, some may experience temporary but significant resource constraints. These types of resource constraints may not affect the repayment of flexible loans but rather, have implications only for loans with fixed and regular repayment schedules.
When an affordability assessment inputs annual income or average monthly income, it implicitly assumes that households have the perfect ability to invest surpluses and tide over deficits in the short-term. In the absence of a perfect liquid savings mechanism, households’ minimum assured income may emerge as critical determinant of repayment capacity. Figure 9 illustrates, using data from a sample household with mean income of Rs. 6,427, but recorded income lower than the mean for six months of the year. The

WHEN IS MICROCREDIT UNSUITABLE?
21
12. In this example, we redefined repayment capacity to consider only payments that were due on fixed and regular schedule, ignoring loans with flexible repayment schedules. Flexible loans impose no burden on borrowers to make payments every month, although it is true that weak savings practice may also impact borrowers’ ability to save-up surpluses to make occasional repayments.
13. Because repayment capacity is defined here as income minus minimum living expenses, it ignores the effect of shocks on borrowers’ repayment capacity. If one were to account for borrowers’ vulnerability to shocks and the inadequacy of liquid savings to independently manage adverse events, one would likely find many more borrowers facing occasional unaffordability.
14. Cross-borrowing represents the practice of borrowing from different institutional banks (say from MFIs but also from banks, or from banks but also from moneylenders) and differs slightly from multiple borrowing in that a borrower with multiple loans but all from the same institutional type does not engage in cross-borrowing. The distinction between the two is salient only when institutional types differ in, say, lending practices or regulation.
coefficient of variation in income was 0.29, while standard deviation was Rs. 1,845. One way to estimate the steady component of household cashflows might be to deduct downward volatility from the average (which works out to Rs. 4,581), but a more appropriate method in practice might be to understand underlying income sources and opportunities directly from the customer. In this example, we considered the crude estimate of Rs. 4,581 to represent the steady component of household’s income, and went on to measure whether repayment obligations were affordable in every month or occasionally unaffordable.12
At the extreme, it may be deemed irresponsible for lenders to count the full extent of occasional upward income swings, particularly when borrowers do not have the necessary means to invest and protect surpluses for later use. In this situation, lending may eventually be further constrained by that portion of income that is assured each month, unless the design of repayment schedules accounts for the variability in income.
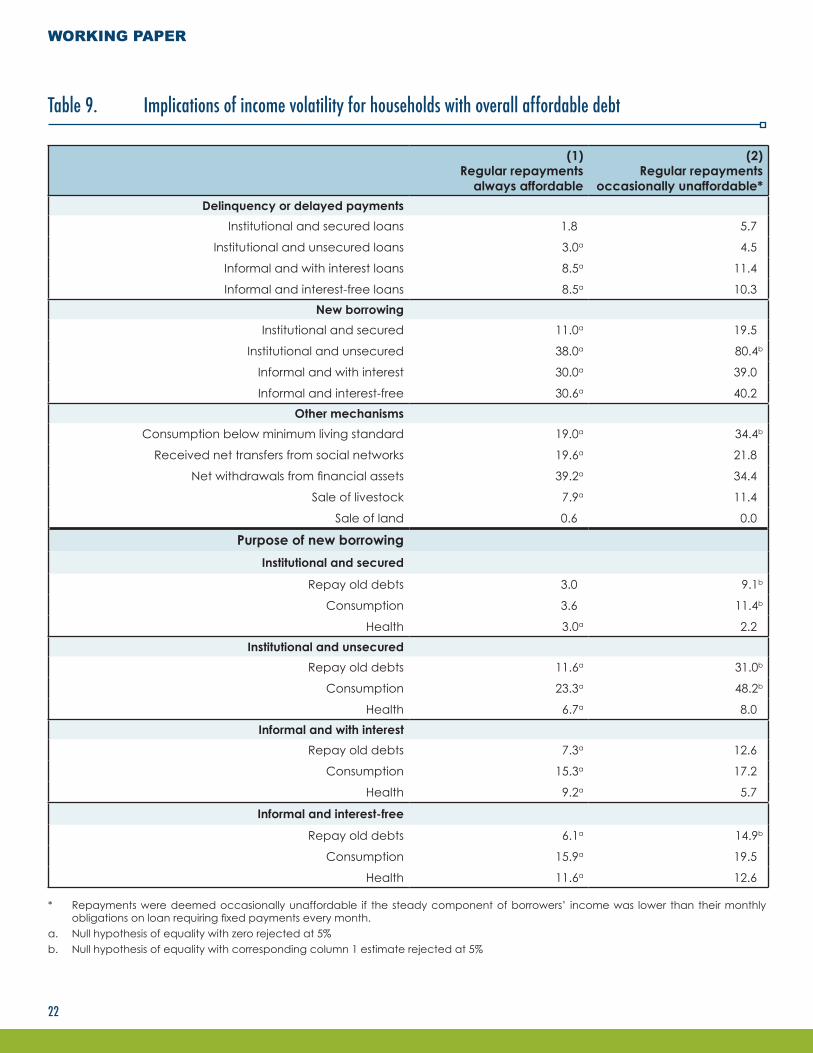
Even within the group of borrowers who had surplus repayment capacity over the year, borrowers who experienced significant volatility in their repayment capacity13 during the year reported a lower overall living standard and a higher dependence on new loans to make repayments. Notably, we found them no more likely to use savings accounts or social transfers to manage volatility (Table 9).
The point estimates for this subset were found similar to those for the borderline repayment capacity group, indicating that attention to intra-tenure volatility may play as significant a role in mitigating financial distress as overall affordability. Products and markets that fail to address income volatility may leave even relatively well-off borrowers just as vulnerable as more indebted counterparts, wiping out potential gains to borrowers from moderate income mobility or even responsible borrowing.
4.5. Inadequacies in credit reportsIn Section 3.3 we discussed the extent of cross-borrowing14 among sample households and the average size and features of loans from different sources. In this section we study the implications of cross-borrowing for loan-making protocols and the infrastructure required to support prudent decisions in this regard. Note that research has shown and regulators have acknowledged that multiple borrowing within certain limits is not harmful, and in general, wider access, consumer choice, and competitive markets are desirable features of a healthy financial system. However, specific inadequacies in credit reporting coupled with absence of independent underwriting and the presence of multiple borrowing creates a fault line that, unless appropriately remedied, causes lenders to significantly underestimate portfolio credit risk.
WORKING PAPER
22
Table 9. Implications of income volatility for households with overall affordable debt
* Repayments were deemed occasionally unaffordable if the steady component of borrowers’ income was lower than their monthly obligations on loan requiring fixed payments every month.
a. Null hypothesis of equality with zero rejected at 5%b. Null hypothesis of equality with corresponding column 1 estimate rejected at 5%
(1)Regular repayments
always affordable
(2)Regular repayments
occasionally unaffordable*Delinquency or delayed payments
Institutional and secured loans 1.8 5.7
Institutional and unsecured loans 3.0a 4.5
Informal and with interest loans 8.5a 11.4
Informal and interest-free loans 8.5a 10.3New borrowing
Institutional and secured 11.0a 19.5
Institutional and unsecured 38.0a 80.4b
Informal and with interest 30.0a 39.0
Informal and interest-free 30.6a 40.2Other mechanisms
Consumption below minimum living standard 19.0a 34.4b
Received net transfers from social networks 19.6a 21.8
Net withdrawals from financial assets 39.2a 34.4
Sale of livestock 7.9a 11.4
Sale of land 0.6 0.0
Purpose of new borrowingInstitutional and secured
Repay old debts 3.0 9.1b
Consumption 3.6 11.4b
Health 3.0a 2.2Institutional and unsecured
Repay old debts 11.6a 31.0b
Consumption 23.3a 48.2b
Health 6.7a 8.0Informal and with interest
Repay old debts 7.3a 12.6
Consumption 15.3a 17.2
Health 9.2a 5.7
Informal and interest-free
Repay old debts 6.1a 14.9b
Consumption 15.9a 19.5
Health 11.6a 12.6

WHEN IS MICROCREDIT UNSUITABLE?
23
In this section, we consider all institutional loans reported by MFI borrowers—in addition to JLG loans from more than seven MFIs serving the region, loans from commercial banks, rural banks, cooperatives, bank-linked SHGs, and chit funds were reported. Following Jariwala and Mehta (2015), we assumed that all loans from MFIs would have been captured in the “MFI-only bureau,”15 while loans from commercial banks and rural banks were recorded in banks’ “retail bureau.” SHGs and cooperatives’ loans remain unreported to either bureau.
Seventy-four percent of MFI borrowers in our sample were also borrowing from at least one other institutional type in the same year (and one or more loans within each type). For these borrowers, we simulated from survey data what information might be recorded in each bureau, and found that even if, in compliance with regulation, lenders institutionalized a process wherein every applicant’s outstanding debt was collected by the MFI bureau, and the loan was made only if the bureau returned a number of loans or a total outstanding lower than allowed, this process would likely underestimate borrower indebtedness and leave lenders exposed to immeasurable risk. In this sample, using only the MFI bureau on average missed 42 percent of sample households’ total institutional debt, and the differences at the household level were both large and statistically significant in paired t-tests. Jariwala and Mehta (2015) used aggregate industry estimates for all-India but also returned similar results (47 percent). Further, because the MFI-only bureau consistently underestimated debt for all cross-borrowers, we found that using only this bureau to qualify MFI clients would have led to 33 percent of clients being wrongly classified as eligible for a new loan, even while they had other active loans in excess of limits permissible by regulation. A prudent lender would therefore need to collect and verify detailed loan information directly from clients or consolidate reports from every bureau, unless the consolidated reports themselves were made available by bureaus at a reasonable price.
15. In practice, however, there are two MFI bureaus, and anecdotal evidence indicates that reports from both do not always match in certain regions, or specifically for certain MFIs that may not uniformly report to both.
Table 10. Estimates from survey data on level of debt recorded in the MFI bureau
Monthly repayments (in Rs.) Median
MFI-only bureau 1,972
All loans 4,835
Table 11. Misclassification of debt affordability based on definition and data source
Type of misclassification % MFI clients in sample
False positives
Compliant as per MFI-only bureau, but not including all formal loans 33
Compliant as per MFI-only bureau, but not as per debt servicing capacity 21
Compliant as per combined bureau data, but not as per debt servicing capacity 6False negatives
Informal and interest-free 40.2

WORKING PAPER
24
Even where credit information was complete, measures of affordability based on total outstanding debt (such as the regulation currently imposes) may be at odds with measures that incorporate debt, income, and the quality of the repayment experience. To understand the extent of misclassification by using different measures, we compared borrower classification by the debt service capacity approach against classification along the lines of total debt outstanding as prescribed in RBI regulation (estimated from total institutional debt reported in the survey).16 Assuming perfect reporting and bureau integration, we found that 27 percent of MFI clients were misclassified—only 6 percent were at risk to be tagged eligible to receive debt that they would eventually find unaffordable, but nearly 21 percent of MFI borrowers were tagged ineligible to receive higher debt commensurate to their repayment capacity and the regulatory threshold was found restrictive.
This paper outlines the determinants of suitability in lending to low-income households—at the very least, this requires a comprehensive view of the level and features of outstanding debt and a reasonable assessment of borrowers’ ability to make repayments from their income. There is an urgent need to deliver comprehensive credit information to lenders and for lenders to integrate such information into loan-making decisions. However, alongside a comprehensive credit reports, lenders will also need to consider borrowers’ ability to make repayments given not only their income but also cashflow volatility and uninsured risk.
Measuring income and features of cashflow are challenging and it is even more so when incomes are largely informal. Traditional group lending has not required lenders to develop this capacity, instead the underwriting function is delegated to groups of clients themselves. However, this subjects the function to bias and capture and has thus far proven ineffective from a customer protection perspective—as evidenced by high levels of overall unaffordability in this sample, among others. More research and technical innovation is required to develop reliable income assessments for the lending toolkit, and such assessments should replace, at least in part, lenders’ dependence on peer-affirmation and (the absence of) negative credit information as the go-to measure of repayment capacity. This is also in line with recommendations for sustainable microfinance from a long-term risk management perspective (Firth 2014).
Specifically on regulation, the evidence suggests that high misclassification of borrowers might occur from lending caps, even under perfect compliance. In an evolving marketplace with multiple access points and a wider choice set beyond standard microcredit, absolute caps on lending will prove both impractical and ineffective. Instead, we recommend a focus on strengthening lenders’ ability to implement suitability requirements at the point of sale, and to respond responsibly to indicators of repayment distress during the loan tenure.
Finally, the successful implementation of suitability in lending depends quite critically on commensurate developments in savings, insurance, and investment markets. A coordinated effort to improve low-income households’ access to high-quality insurance and savings products is essential, in the absence of which all lending-focused financial inclusion efforts will remain hugely inadequate.
Specific recommendations on all the above follow.
5. Implications
16. NBFC-MFI lending regulations restrict total borrower indebtedness to Rs. 1 lakh. Assuming 22 percent APR and a full tenure of 24 months for all outstanding debt, this works out to essentially cap monthly MFI repayments at Rs. 5188, which we loosely interpret to mean a healthy level of microfinance debt in the eyes of the regulator. In Table 11, we tag all households with monthly repayment obligations higher than Rs. 5188 as noncompliant.

WHEN IS MICROCREDIT UNSUITABLE?
25
5.1. Urgent need for credit bureau integrationA well-functioning and comprehensive credit information system can prevent mis-sale, improve compliance with suitability requirements, and greatly reduce the costs of compliance for lenders. RBI has acknowledged the need for a comprehensive microfinance bureau with specific directives to integrate data from SHG lending. Yet, prominent channels such as banking correspondents are cooperative banks are yet to be brought into the fold and the cleave between MFI-only and retail bureaus requires urgent consolidation.
As lenders build internal capacity to use comprehensive credit reports, they might also depend on bureaus to provide additional data points. Aside from the total number of loans and amounts outstanding, features of individual loans such as their tenure and repayment schedule may also be required to understand repayment burden and how new loans might be made suitable.
5.2. Implementing suitability at point of saleImplementing meaningful assessments at the point of sale are a critical ex-ante measure to mitigate financial distress for low-income borrowers. All lenders should ensure that loan amounts disbursed are both appropriate and affordable for every borrower, additionally verifying that individual payments are reasonably affordable given their cashflows. In the sample studied, one in every five households was carrying a debt burden higher than it could reasonably afford, and many more held loans that were agnostic to their income volatility, creating stressful periods of transient unaffordability.
Lenders must also evaluate the harm of selling standardized products to those borrowers with unique liquidity or flexibility constraints and take reasonable efforts to minimize harm. Most importantly, lenders must adequately provision for borrowers’ income volatility and uninsured cashflow risk. To do so, lenders will require sufficient frontline and technical capacity to conduct borrower assessments as well as access to complete and comprehensive credit reports.
A clear regulatory directive to every lender to implement suitability assessments is essential, given the lack of other market-based incentives for lenders to do so. Such assessments should also eventually replace lending caps and other restrictions on consumer choice in the current regulatory framework.
Our results also suggest that loans that fail to address income volatility may leave even relatively well-off borrowers just as vulnerable as their more indebted counterparts, wiping out potential gains from income mobility and even judicious borrowing. While efforts to foster innovation in product and process design toward customer-centric solutions may not be required to prevent mis-sale, they will prove essential for financial inclusion to lead to improvements in customer well-being.
5.3. Delinquency management and access to recourseEven beyond reasonable debt affordability assessments at the point of sale, timely monitoring and appropriate handling of delinquency as ex-post measures will be critical to mitigate unforeseen customer financial distress.
A large and growing body of evidence documents the vulnerability of low-income households to high-income volatility and frequent shocks of varying magnitude, which could greatly affect their ability to make timely repayments on volatility-agnostic debt. There is thus an urgent need for financial services providers to institute fair practices for managing unforeseen borrower delinquency to ease temporary financial distress.

WORKING PAPER
26
Timely debt counseling, contract renegotiation, and frequent monitoring of at-risk borrowers could mitigate the escalation of distress. A systematic assessment of delinquency management practices in microlending could be very insightful in this regard.
The advent of a new bankruptcy framework in India will allow insolvent borrowers to file for personal bankruptcy and avail a “fresh start” that would entail discharging borrowers from qualifying debts and accord an opportunity to start financially afresh. This is an important development in light of our findings that new borrowing is a go-to coping mechanism in environments where there is ready access to credit. The provisions for both personal bankruptcy and a fresh start in the Insolvency and Bankruptcy Code (2016) must be well understood by lenders and consumer advocates and implementation must receive high priority among financial inclusion efforts.
5.4. BalancedmarketdevelopmentandcomprehensivefinancialservicesOur results show that market-prevalent savings products are not used for savings-led smoothing and that even households with surplus income were needlessly dependent on expensive credit to manage liquidity and shocks. Such strategies could be influenced by market development in India, where there has been a disjointed trend in the expansion of financial services in India with access to credit having risen rapidly, while reliable savings, adequate insurance, pensions, and investments lag.
Commensurate access to adequate risk protection is essential—most of the products distributed through MFIs are available only for borrowers, capped at loan value, and valid only for the loan tenure. Coordinated regulatory action is required to enable multi-product originators, while lenders, in particular, should be encouraged to enter into partnerships that make a comprehensive suite of high-quality financial services available to low-income borrowers. Implementing suitability or, indeed, applying any restrictions in lending in the absence of reliable and adequate access to savings and insurance might eventually act to greatly limit the benefits of financial inclusion.

WHEN IS MICROCREDIT UNSUITABLE?
27
References
Angelucci, Manuela, Dean Karlan, and Jonathan Zinman. 2013. “Win Some Lose Some? Evidence from a Randomized Microcredit Program Placement Experiment by Compartamos Banco.” Technical Report. Cambridge, Mass.: National Bureau of Economic Research.
Banerjee, Abhijit, Dean Karlan, and Jonathan Zinman. 2015. “Six Randomized Evaluations Of Microcredit: Introduction and Further Steps.” American Economic Journal: Applied Economics (7): 1-21.
Banerjee, Abhijit, Emily Breza, Esther Duflo, and Cynthia Kinnan. 2015. “Do Credit Constraints Limit Entrepreneruship? Heterogeneity in the Returns to Microfinance.” Evanston, USA: Department of Economics Northwestern University.
http://faculty.wcas.northwestern.edu/~cgk281/credit_entrepreneurship.pdf
CRISIL. 2015. “CRISIL Inclusix Volume 3.” Technical Report. India: CRISIL. https://www.crisil.com/about-crisil/crisil-inclusix-report.html.
Das, Ashish. 2013. “Banks Violating Prevention of Money-Laundering Act for Excluding the Excluded.” Technical Report. Bombay: Indian Institute of Technology. http://www.math.iitb.ac.in/ ashish/workshop/SmallAccountReport_2013.1.pdf.
Dattasharma, Abhi, Rajalaxmi Kamath, and Smita Ramanathan. 2016. “The Burden of Microfinance Debt: Lessons from the Ramanagaram Financial Diaries.” Development and Change (47): 130-56.
DeVaney, Patricia Lee. 2006. “Bringing Pro-Consumer Ideals to the Client: A Consumer Protection Guide for Financial Institutions Serving the Poor.” Washington, D.C.: Accion.
Field, Erica, Rohini Pande, John Papp, and Y. Jeanette Park. 2012. “Repayment Flexibility Can Reduce Financial Stress: A Randomized Control Trial with Microfinance Clients in India.” PloS one (Public Library of Science) (7): e45679.
Firth, Barry. 2014. “Over-Indebtedness: A risk management approach.” Technical Report. London, United Kingdom: VisionFund International for Microfinance CEO Working Group.
http://microfinanceceoworkinggroup.org/wp-content/uploads/2014/05/Over-Indebtedness-A-Risk-Management-Approach.pdf
Gada, Kalpesh, Supreeta Nijjar, Remika Agarwal, and Abhijeet Jhunjhunwala. 2016. “Indian Micro Finance.” Review and Industry Outlook. Gurgaon, India: ICRA Research Services.
Gash, Megan, and Bobbi Gray. 2016. “The Role of Financial Services in Building Household Resilience in Burkina Faso.” Working Paper. Washington, D.C.: CGAP. http://www.cgap.org/sites/default/files/Role%20of%20FS%20Burkina%20Faso.pdf.
George, Deepti. 2014. “Suitability Becomes a Customer Right.” Blog Post. 4 December. http://www.ifmr.co.in/blog/2014/12/04/suitability-becomes-a-customer-right/.
GOTN (Government of Tamil Nadu). 2011. Chief Minister’s Comprehensive Health Insurance Scheme. Chennai, India: GOTN. http://www.cmchistn.com/features.php.
Grammling, Mattias. 2009. “Cross-Borrowing and Over-Indebtedness in Ghana: Empirical Evidence from Microfinance Clientele and Small Enterprises.” Technical draft for discussion. Frankfurt: ProCredit Holding Frankfurt am Main.

WORKING PAPER
28
Guérin, Isabelle, Marc Roesch, G. Venkatasubramanian, and S. Kumar. 2013. “Microfinance, Debt and Over-Indebtedness. Juggling with Money.” In Solene Morvant-Roux Isabelle Guérin and Magdalena Villareal, eds. The social Meaning of Over-Indebtedness and creditworthiness in the Context of Poor Rural South Indian Households (Tamil Nadu). Londres: Routledge, pp. 125-50.
Halan, Monika, and Renuka Sane. 2016. “Misled and Mis-sold: Financial Misbehaviour in Retail Banks?” NSE-IFMR Finance Foundation Financial Deepening and Household Finance Research Initiative.
Jariwala, Parag, and Vikesh Mehta. 2015. “India Microfinance.” Sector Report. India: Religaire Institutional Research.
Kaboski, Joseph P., Francisco J. Buera, and Yongseok Shin. 2016. “Taking Stock of the Evidence on Micro-Financial Interventions.” In The Economics of Asset Accumulation and Poverty Traps. Chicago: University of Chicago Press.
Karim, Lamia. 2011. “Microfinance and Its Discontents. Women in Debt in Bangladesh.” In Lamia Karim, ed. The Everyday Mediations of Microfinance. Minneapolis, Minn.: University of Minnesota Press, 65-94.
Karlan, Dean, Ryan Knight, and Christopher Udry. 2012. “Hoping to Win, Expected to Lose: Theory and Lessons on Micro Enterprise Development.” Technical Report. Cambridge, Mass.: National Bureau of Economic Research.
Khaitan, Rachit. 2015. “Customer Protection through MFI Self-Regulation in India.” Blog Post, 23 December. http://www.ifmr.co.in/blog/2015/12/23/customer-protection-through-mfi-self-regulation-in-india/.
Mahajan, Vijay, and T. Navin. 2013. “Microfinance: From the Fire to the Frying Pan?” In Vijay Mahajan and Bikram Duggal, eds. Microfinance in India: Growth, Crisis and the Future. Seattle, Wash.: Amazon Group, 237-53.
Mathews, Titus. 2016. “The Fault Lines in the Microfinance Industry.” www. thewire.in. http://thewire.in/26562/fault-lines-microfinance-industry/.
Meka, Sushmita, and Justin Grider. 2016. “Credit to Bridge Expenses in Mexico Financial Diaries Households.” Technical Report. Somerville, Mass.: Bankable Frontier Associates.
MFIN (MIcrofinance Institutions Network). 2015. “Code of Conduct for the Microfinance Industry.” Policy Document. Hyderabad: MFIN and Sa-Dhan. http://mfinindia.org/wp-content/uploads/2015/12/2nd-Edition-of-the-MFIN-CoC.pdf.
MIX. 2016. MIX Finclusion Lab’s Microfinance Geographical Index. http://finclusionlab.org/country/India/analytics?title=MFI-Details.
Mowl, Amy. 2016. “The Technology of Lending. Informal credit contracts.” unpublished. http://foundation.ifmr.co.in/the-technology-of-lending-informal-credit-contracts/.
Mowl, Amy, and Camille Boudot. 2014. “Barriers to Basic Banking: Results from an Audit Study in South India.” NSE—IFMR Financial Inclusion Research Initiative.
Nandhi, Mani Arul. 2015. “Repayment Performance and Costs of Defaults in Group Lending Programme—A Case Study in.” The Microfinance Review (VII): 169-185.
RBI (Reserve Bank of India). 2016. “Customer Service in Banks: Caveat Venditor.” Mumbai: RBI. https://rbi.org.in/Scripts/BS_SpeechesView.aspx?ID=1005.
———. 2015a. “Master Circular - Fair Practices Code.” Policy Document. Mumbai: RBI. https://rbidocs.rbi.org.in/rdocs/notification/PDFs/16FP32A7AC9FAE2345ADB0DEDE037F08BA93.PDF.

WHEN IS MICROCREDIT UNSUITABLE?
29
———. 2015b. “Revision to Directions to NBFC-MFIs.” Policy Document. Mumbai: RBI. https://rbi.org.in/scripts/NotificationUser.aspx?Mode=0&Id=10144.
———. 2011. “Report of the Sub-Committee of the Central Board of Directors of Reserve Bank of India to Study Issues and Concerns in the MFI Sector.” Technical Report. Mumbai: RBI.
Rhyne, Elisabeth, and Maria Otero. 1994. “The New World of Microenterprise Finance. Building Healthy Financial Institutions for the Poor.” In Maria Otero and Elisabeth Rhyne, eds. Financial Services for Microenterprises: Principles and Institutions. Kumarian Press, 11-26.
Sahasranaman, Anand, Deepti George, Darshana Rajendran, and Vishnu Prasad. 2014. “A New Framework for Financial Consumer Protection in India.” Position Paper. IFMR Finance Foundation.
Schicks, Jessica. 2013. “The Definition and Causes of Microfinance Over-Indebtedness: A Customer Protection Point of View.” Oxford Development Studies (Taylor & Francis) 41: S95-S116.
———. 2012. “The Sacrifices of MicroborrMicro in Ghana—A Customer Protection Perspective To Measuring Over-Indebtedness.” Working Paper. Brussels: Centre Emile Bernheim.
Schicks, Jessica, and Richard Rosenberg. 2011. “Too Much Microcredit? A Survey of the Evidence on Over-Indebtedness.” Occasional Paper. Washington, D.C.: CGAP. https://www.cgap.org/publications/too-much-microcredit-survey-evidence-over-indebtedness.
Sriram, M. S. 2015. Inclusive Finance India Report 2015. SAGE Impact.
Stuart, Guy. 2015. “Myanmar Financial Diaries.” Washington, D.C.: Microfinance Opportunities. https://www.microfinanceopportunities.org/3-approach/looking-for-something/how/financial-diaries/.
Tiwari, Akhand, Anvesha Khandelwal, and Minakshi Ramji. 2008. “How Do Microfinance Clients Understand their Loans?” Working Paper. Centre for Micro Finance, IFMR.
Venkata, N. A., V. Yamini, and Suresh K. Krishna. 2010. “Diagnosing Financial Stress in Group Methodology.” Note.
Weber, Heloise. 2001. “The Imposition of a Global Development Architecture: The Example of Microcredit.” Working Paper. United Kingdom: Centre for the Study of Globalisation and Regionalisation.
Zollmann, Julie. 2015. “Kenya Financial Diaries.” Report. Kenya: FSD Kenya.

Advancing financial inclusion to improve the lives of the poor
1825 I Street NW, 7th FloorWashington, DC 20006
www.cgap.org
Correspondence: Lisa Stahl ( [email protected] )Cover Photo: Sudipto Rana, 2014 CGAP Photo Contest