Embed Size (px)
Citation preview

Presented By:John Covey, PE, CFMAmec Foster Wheeler
Project Partners:Oklahoma City (Client)
Meshek & Associates (PM)Utley & Associates
Lemke SurveyingE7 - ASFPM - 2016
When 2D Meets Urban Flood Risk Assessments

Overivew
Project Description
Summary & Objectives
Project Methodology
SWMM Methods Overview
Hydrology
Hydraulics 1D & 2D
Project Data Collection
Project Parameter Details
Results
Flood Risk
Capital Improvements
Lessons Learned
Questions / Discussion

Project Description Summary
To analyze approx. 3.4 sq miles of downtown Oklahoma City.
Objectives
Identify the System
Simulate Urban System Response
Identify & Map Urban Flood Risk Areas
Develop Alternatives & Solutions

Project Description Define the Problem
Past Urban Street Flooding
Challenging Terrain Interconnected sub-
surface & 2D surface
Usability into the future Promote continued
resiliency and planning.
Holistic watershed solution

Project Methods Model Options
PCSWMM 1D/2D
EPA-SWMM
XPSWMM 1D/2D
Bentley SewerGEMS
Innovyze Infoworks ICM
Etc…

Project Methods SWMM Methods Overview
Hydrology - Runoff Block Methods
Infiltration - SCS Curve Number, Green Ampt, etc
Standard Design (SCS Type II Rainfall), User defined, etc

Project Methods SWMM Methods Overview
Hydraulics – 1D Full Saint Venant’s Equation

Project Methods Hydraulics – 1D St. Venant Equation Assumptions
Flow is one-dimensional
Hydrostatic pressure prevails and vertical accelerations are negligible
Streamline curvature is small.
Bottom slope of the channel is small.
Manning’s equation is used to describe resistance effects
The fluid is incompressible
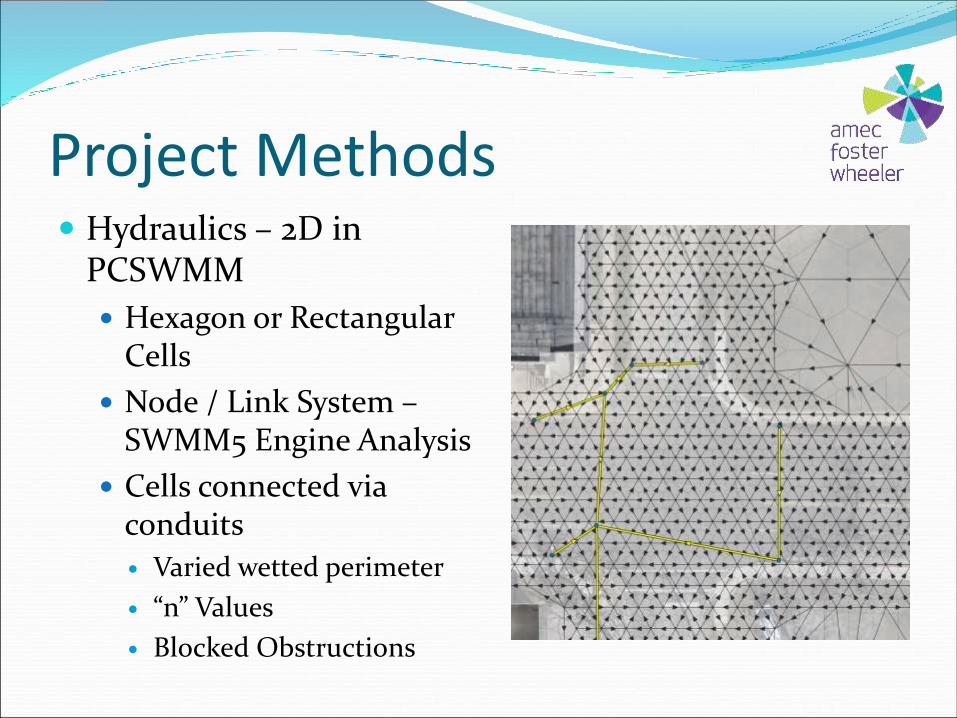
Project Methods Hydraulics – 2D in
PCSWMM
Hexagon or Rectangular Cells
Node / Link System –SWMM5 Engine Analysis
Cells connected via conduits
Varied wetted perimeter
“n” Values
Blocked Obstructions

Project Methods Data Collection
1-foot Lidar
3-inch Aerial Photography
Building footprints
Field Investigation / Measurements Geometry
Connectivity
Quality

Project Methods - Aerial

Project Methods - Topo

Project Methods - Topo

Project Methods – 3D

Project Methods - Rainfall

Project Methods – Historical Rainfall

Model Specifics The Model
>800 Subbasins
Avg. 2.5 acres
>3500 Manholes & Inlets
>3800 1D Stormwater Conduits (88 miles)
2 Historical Events
Precipitation Depth Calibrated NEXRAD

Model Specifics 2D area limited to
Area of Interest and true 2-D flow. Street conveyance comprised of 1D linear flow left as 1D.

Model Specifics Focused 2D Area
1.2 sq miles
>140,000 2D Cells
10ft – 50ft
Varying “n” Values
Blocked Obstructions
Inlet Capacity controls flow into 1D conduits

Results - Depth

Results Model Runtime – 24
hours (24 hr simulation period)
422 Structures impacted by 100yr Floodplain
224 Structures impacted by 10yr Floodplain

Results Capacity
Approx. 30-40% of the system has less than 5yr capacity.
Approx. 60-70% of the system has less than 10yr capacity.

Flood Risk Flood Duration
Duration of facility/structure exposure to flood waters increases potential damage and potential for flood-proofing failures.
Flood proofing response time.
Depth / Water Surface Elevation
Significant factor in determination of damage and risk.
Velocity
As velocity and flood depths increase so does the pressure and force on structures and flood protection.
Products of Depth & Velocity
Intensity (ie Depth * Velocity)
Force (ie Depth * Velocity2)
Water Quality
Flood waters are typically “dirty” with chemicals, waste water, pesticides, oils, debris.
It is easy with 2D.

Risk – Depth & Velocity Damage/Risk Assessment & Requirements
FEMA Damage & BCA
NRCS
APWA
Human Instability & Flood Protection Studies

Risk – Water Surface

Risk – Depth Grid

Risk - Velocity

Risk – Velocity Grid

Risk – Depth * Velocity

Risk – Depth * Velocity2
Capital Improvements Alternatives
Model runtime to significant for proper alternative development.
Developed a 1D surface / subsurface model using 2D model results
1D model runtime reduced to 45 min
4 primary problem areas were focused on.
Focus areas result of significant capacity issues and recent flooding from several events.

Capital Improvements Problem Areas

Capital ImprovementsProblem Area 1

Capital ImprovementsProblem Area 2

Capital ImprovementsProblem Area 3

Capital ImprovementsProblem Area 4

Capital Improvements 2 to 3 alternatives were developed for each problem
area.
Alternatives included increasing pipe size, adding upstream storage, and added inlet capacity
Alternatives resulted in up to 20% removal from 100yr floodplain
Alternative results in up to 30% removal from 10yr floodplain
FEMA Benefit-Cost Analysis was performed

Capital Improvements
Example Comparison of Existing 100yr and Alternative 100yr Floodplains

Lessons Learned 2D model provided effective way to identify flood risk.
2D model very sensitive to inlet capacity location and connectivity.
Alternative development not reasonable using only 2D model given magnitude and runtime.
Given project schedule demands it required the development and use of an adequate 1D model.
Our imagination – the only limitation on how we communicate flood risk.