Embed Size (px)
Citation preview

Wheat Value Chain: Bihar Justin Paulsen, Kathryn Bergh, Alexander Chew,
EPAR Brief No. 202 Mary Kay Gugerty, & C. Leigh Anderson
Prepared for the Agricultural Policy Team of the Bill & Melinda Gates Foundation
Professor Leigh Anderson, Principal Investigator Associate Professor Mary Kay Gugerty, Principal Investigator July 23, 2012
EPAR’s innovative student-faculty team model is the first University of Washington partnership to provide rigorous, applied research and analysis to the Bill and
Melinda Gates Foundation. Established in 2008, the EPAR model has since been emulated by other UW Schools and programs to further support the foundation
and enhance student learning.
NOTE: The findings and conclusions contained within this material are those of the authors and do not necessarily reflect positions or policies of the Bill &
Melinda Gates Foundation.
EVANS SCHOOL POLICY ANALYSIS AND RESEARCH (E PAR) | 1
Bihar Wheat Value Chain Highlights
This brief provides a general overview of the wheat market in Bihar. The first section describes trends in wheat production
and consumption over the past twenty years and summarizes recent trade policy related to wheat. After a brief discussion
of the types and nutritional content of wheat, the third section describes the wheat value chain in Bihar, beginning with
seed development and ending with marketing. Finally, we highlight a few trends in Bihar wheat markets.
Key Takeaways
The quantity of wheat production in Bihar has exceeded rice production over the past four years
In the last two decades, wheat consumption has grown significantly among both urban and rural populations
The Indian government lifted the ban on wheat exports in September 2011
Wheat is a good source of protein, but nutritional content is highly variable
Climate change and deteriorating land quality may threaten agricultural production in Bihar in the long-term
The below figure summarizes key findings along the different stages of the wheat value chain in Bihar.
Pre-Production Production Post Production Sales
Inputs
•76% of wheat is cultivated under IV seeds; low relative to other high producing states in India
•Irrigation is widely available but the dominant tubewell irrigation run by diesel engines is expensive
Credit
•Credit supply is meeting less than 3% of estimated demand
Production
•Wheat production occurs throughout Bihar though greatest in the western half of the state
•The estimated yield gap in recent years is 44%
Procurement, Storage, and
Transportation
•An estimated 20-25% of wheat goes to markets
•Available storage is well below requirements
•Only around 30% of villages are connected by roads and only seasonally
Processing and Milling
•About 12% of markets have the facilities for activities such as sorting, grading, or packaging
•Two types of milling are important in Bihar, more traditional chakkis and more modern roller mills
Market
•Markets are difficult to access for many rural farmers, thus itinerant local traders are the primary agent in wheat sales
•The gap between retail prices and farm prices have increased over the past decade

EVANS SCHOOL POLICY ANALYSIS AND RESEARCH (EPAR) |
2
Key Statistics about Wheat in Bihara
Production
Bihar is the 6th largest wheat producer among all states in India, and accounts for around 5% of all of India’s wheat
production.1 Production in Bihar is higher than the median level of state production (1,740,000 MT in 2009/10), but is only
about 1/6 of the amount produced in Uttar Pradesh, the highest-producing state, and about 1/3 of Punjab production,
which is the second highest producer. Over the past 20 years, wheat production in Bihar has been somewhat erratic. Area
harvested has remained fairly constant, but production has fluctuated more dramatically, especially in the last decade;
production fell significantly during the first half of the 2000s but has sharply increased since the 2005/06 season with
increased yields (see Figure 1). This heightened production coincides with wheat’s increasing importance in relation to
other cereals within Bihar.
Figure 1: Area Harvested and Production of Wheat in Bihar
Source: Government of Bihar, Department of Agriculture (http://krishi.bih.nic.in/Statistics.html)
Despite these increases, yields in Bihar have been well below other wheat-producing states over the past decade, and are
generally about half of those in Haryana, Punjab, and Uttar Pradesh.2 As Figure 2 indicates, these different state yields all
followed a similar trend of declining yields through the first half of the decade, reaching mid-decade lows, then returning
to levels similar to 2000 in the latter half of the decade, though Haryana and Uttar Pradesh 2010-2011 yields exceeded
those of a decade earlier.
a The Indian government is the source for the majority of the data in this brief since data at the sub-national level is not available from external sources such as the FAO.
0
1,000,000
2,000,000
3,000,000
4,000,000
5,000,000
6,000,000
Area, ha Production, MT

EVANS SCHOOL POLICY ANALYSIS AND RESEARCH (EPAR) |
3
Figure 2: Wheat Yields of Bihar and Top Three Wheat-Producing States
Source: Indian Ministry of Agriculture (reported in Commission for Agricultural Costs and Prices, 2011)
Note: 2010/2011 yields are advance estimates.
Wheat production has become increasingly important in Bihar relative to other cereal crops. Whereas rice production
exceeded wheat production by an average of 725,000 MT in the early 90s, wheat production over the last four years has
exceeded rice by 579,000 MT on average (see Figure 3). This production trend is likely tied to the declining area harvested
of rice, accompanied by small increases in the area harvested of wheat (see Figure 4). Farmers may be shifting away from
rice cultivation because it has larger fluctuations in productivity; according to the USDA FAS (2012), this is because a
greater proportion of rice is not irrigated (42% nationally).
Figure 3: Wheat Production in Comparison to Other Cereals in Bihar
Source: Government of Bihar, Department of Agriculture (http://krishi.bih.nic.in/Statistics.html)
Note: USDA FAS estimates are reported on the marketing year basis.
0
0.5
1
1.5
2
2.5
3
3.5
4
4.5
5
MT
/Ha Bihar
Haryana
Punjab
Uttar Pradesh
0
1,000,000
2,000,000
3,000,000
4,000,000
5,000,000
6,000,000
MT
Rice
Wheat
Maize

EVANS SCHOOL POLICY ANALYSIS AND RESEARCH (EPAR) |
4
Figure 4: Area Cultivated of Wheat, Rice, and Maize in Bihar
Source: Government of Bihar, Department of Agriculture (http://krishi.bih.nic.in/Statistics.html)
Consumption
Wheat consumption has increased among both the rural and urban population of Bihar since 1993/94, but the trend has
been different across those groups (see Table 1).3 Urban consumption increased sharply in the mid-late 1990s with smaller
reductions since then, whereas rural consumption decreased slightly in the mid-late 1990s but then had large increases in
the next decade. Overall, Bihar’s urban population increased per capita monthly consumption of wheat by almost 0.30 kg
from 1993 to 2010, while the rural population increased monthly consumption by almost 0.25 kg. At the same time, the
proportion of households reporting wheat consumption in the past month has increased to over 95% from around 83% for
both populations. Wheat products have increased in consumption as well; in 2009-10, 27% of the urban population
consumed bakery bread in the past month, compared to 16% in 2004-2005.4
Table 1: Per Capita Wheat Consumption and Proportion of Households Consuming Wheat among Urban and Rural Bihar
Populations
1993-1994 1999-2000 2004-2005 2009-2010
Per Capita Urban Consumption (kg/month)
5.44 5.88 5.82 5.73
Urban Consumption (% of Households)
83.7% 87.2% 95.8% 92.9%
Per Capita Rural Consumption (kg/month)
5.23 5.21 5.39 5.47
Rural Consumption (% of Households)
82% 83% 95.1% 96%
Sources: National Sample Survey Organisation (NSSO), 1997; NSSO, 2001; NSSO, 2007; NSSO, 2012
Note: Estimates for proportion of households consuming wheat do not include households that consumed wheat from the public distribution
system (P.D.S.), but did not consume wheat from other sources. However, the number of households reporting consumption of P.D.S.
wheat was low, so this is not expected to cause a significant bias in the estimates.
Trade
From 2007 to 2011, the same period during which Bihar wheat production was rising, India imposed an export ban on
wheat. The ban was lifted on September 9, 2011 because national stocks exceeded storage capacity, and exports are
expected to come exclusively from government stocks.5 Nationally, exports have been limited due to uncompetitive prices
and problems with quality.6 However, if the export ban remains lifted, at higher international prices exports from Bihar
would be profitable.7
At the regional level, Bihar remains a net importer of wheat with inflows of 757,000 MT and 868,000 MT in 2009-10 and
2010-11 respectively, largely from Punjab, Haryana, and West Bengal states.8,9
0
500,000
1,000,000
1,500,000
2,000,000
2,500,000
3,000,000
3,500,000
4,000,000
2006-07 2007-08 2008-09 2009-10 2010-11
Ha Rice
Wheat
Maize

EVANS SCHOOL POLICY ANALYSIS AND RESEARCH (EPAR) |
5
Types and Nutritional Content of Wheat
Bread Wheat is the Predominant Type of Wheat Grown
There are three major types of wheat: bread, durum, and emmer.10,11 Bread wheat (Triticum aestivum) is commonly used
in leavened and unleavened breads, noodles, cookies, and cakes. Durum wheat (Triticum turgidum durum) is more common
in semolina and pasta. Due to its smaller size and weight, bread wheat can be broken into a finer flour and has a softer
texture, making it popular in agro-industries.12 Emmer wheat is the wild progenitor of the domesticated durum and bread
wheat varieties.13 While all three types are grown in India, bread wheat accounts for the majority of production in Bihar.14
Wheat is a Good Source of Protein and Other Nutrients, but Nutritional Content is Highly Variable
Table 2 shows how the nutritional composition of wheat compares to other cereals. Whole wheat has the highest protein
level and contains more iron, riboflavin, and niacin than rice or maize. Table 2 also demonstrates the negative relationship
between nutrient content and the degree of milling, with less processed cereals retaining more nutrients. White wheat
flour does not contain most of the germ and outer layers that contain some of the protein and the majority of B vitamins
and other nutrients.15 The degree of wheat processing also has a significantly negative effect on antioxidant content and
bioavailability; consumption of whole-grain wheat has been associated with a reduced risk for several chronic diseases due
to those antioxidant properties and insoluble fiber content.16
Table 2: Nutritional Composition of Wheat Relative to Selected Cereals (per 100 grams)
Food Energy (kcal)
Protein (g)
Fat (g)
Calcium (mg)
Iron (mg)
Thiamine (mg)
Riboflavin (mg)
Niacin (mg)
Wheat, whole 323 12.6 1.8 36 4.0 0.30 0.07 5.0
Wheat flour, white 341 9.4 1.3 15 1.5 0.10 0.03 0.7
Maize flour, whole 353 9.3 3.8 10 2.5 0.30 0.10 1.8
Maize flour, refined 368 9.4 1.0 3 1.3 0.26 0.08 0.1
Rice, brown 362 7.9 2.7 33 1.8 0.41 0.04 4.3
Sorghum* 337 10.6 3.2 26 4.3 0.36 0.15 3.8
Millet, pearl 363 11.8 4.8 42 11.0 0.38 0.21 2.8
Sources: Latham, 1997; EPAR, 2010; White and Broadley, 2009
*Reported values are the average of estimates from two or more sources.
In addition to the degree of processing, several other factors contribute to the high variability of nutritional content across
different types and strains of wheat. Varieties of emmer wheat generally have higher grain mineral concentrations than
durum or bread varieties (see Table 3).
Table 3: Variability Across Nutritional Composition of Different Types and Varieties of Wheat (per 100 grams)
Type Number of
Varieties Included Protein (g) Iron (mg) Zinc (mg)
Bread 197 n/a 2.4-5.7 1.4-5.3
Durum 2 in both wet and dry conditions
(N=4) 14.9-18.4 2.9-4.7 4.9-5.6
Emmer 22 in both wet and dry conditions
(N=44) 16.4-38.2 4.8-8.8 6.9-13.9
Sources: White and Broadley, 2009; Peleg et. al, 2008
The adoption of modern, higher-yielding varieties and/or agronomic practices may also reduce the nutritional content of
wheat.17 In both bread and durum wheat varieties, a negative relationship has been observed between nutritional content
and grain yields, although the strength of the relationship has depended greatly on environmental factors such as water
availability. Nutritional quality is also affected by the micronutrient quality of the soil.18 Finally, tradeoffs can exist
between nutritional content and consumer desirability in the absence of strong nutrition education programs. For example,
white wheat flour is often preferred by consumers; increasing beta-carotene levels through fortification can turn white
varieties to a yellow-orange color, which may lower consumer uptake of the fortified wheat.19

EVANS SCHOOL POLICY ANALYSIS AND RESEARCH (EPAR) |
6
Ongoing research is being conducted to increase the nutritional content of wheat, along with other cereals. CIMMYT (2011)
is working in India and Pakistan to explore and identify new traits of nutritional significance, develop low-cost phenotypic
and genetic screening for those traits, breed crops with higher protein and micronutrient quantity and quality, and promote
biofortified wheat through the HarvestPlus program. The wheat component of the HarvestPlus program is focused on
increasing its iron and zinc content, and is targeting areas with high per capita wheat consumption levels.20 Other
nutritional qualities of wheat are also being studied as potential targets, including increased levels of bran, soluble and
insoluble fiber, and high-amylose starch. In addition to biofortification efforts, the bioavailability of iron from wheat can be
improved through the adoption of processing techniques such as removal of the phytate-rich hull or by combining wheat
with foods containing ascorbic acid.21
Closer Examination of the Wheat Value Chain in Bihar
Bihar is located in the northeastern part of India. This section summarizes information about wheat production in this state
along the steps of the value chain.
Seed Development
Agricultural research is limited in Bihar. While the state is the home of the Rajendra Agricultural University, most recent
estimates indicate that only 0.2% of state GDP is devoted to agricultural research (as opposed to the 0.4% average across
other Indian states). Of this allotment, an estimated 95% is allocated to salaries, 5% to establishment expenses, and nothing
for operational expenses.22
At the national level, the Indian Council of Agricultural Research (ICAR) institutes and other state agricultural universities
(SAUs) rely primarily on traditional breeding methods to develop improved wheat varieties.23 However, new varieties have
not been widely disseminated throughout the country due to limited seed multiplication, distribution, and extension
facilities. About 75% of state seed production comes from outside of Bihar, and only 27% of the seed that is used in Bihar
meets certified wheat seed requirements.24 A survey of Bihar farmers conducted in 2002-2005 suggested that the largest
constraint to wheat cultivation was the limited availability of quality seeds.25
Credit
Formal sources of credit for agriculture are generally considered inadequate. In a 2008 study, the need for credit was
estimated to be over Rs. 113 billion, with banks only allocating Rs. 3 billion towards agricultural credit in that year.26 Local
primary agricultural credit societies have done little to alleviate credit constraints; as of March 2010, their outstanding
loans totaled only Rs. 1.71 billion.27 Most credit institutions are wary of the high loan servicing costs resulting from limited
volumes, a lack of reliable information, the high costs of information on demand and supply, and high supervision costs
associated with farmers.28 Thus, farmers often seek credit from informal operations, including some that charge extremely
high interest rates.29
Production
Rice-wheat cropping, in which rice and wheat are grown during different temporal periods of the growing season30, is the
most common cropping system in Bihar31. Wheat production occurs exclusively in the Rabi seasonb, with sowing occurring
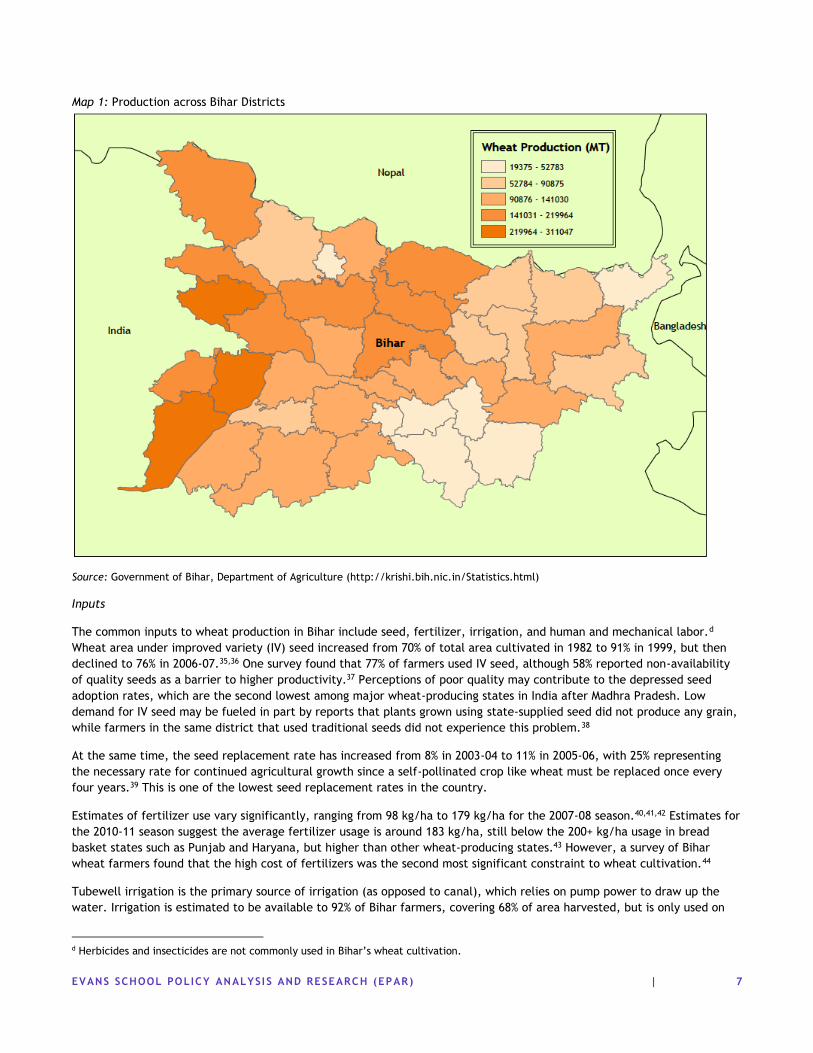
between mid-November to late December and harvesting taking place between mid-March to the end of April.32 As Map 1
indicates, wheat production is prevalent everywhere except for the southeastern districts and is particularly heavy in the
districts along the western border. Smallholder farmers in Bihar represent 93% of all farming households, but represent only
65% of total land area under cultivation33. The average rural farm size in Bihar was only 0.75 ha in a 1995/96 Agricultural
Censusc, which was significantly lower than the national average of 1.41 ha.34
b Refers to a crop sown in winter and harvested in summer c According to Fujita (2012), the 1995/96 census provides the most recent data for describing the agrarian structure in Bihar.
EVANS SCHOOL POLICY ANALYSIS AND RESEARCH (EPAR) |
7
Map 1: Production across Bihar Districts
Source: Government of Bihar, Department of Agriculture (http://krishi.bih.nic.in/Statistics.html)
Inputs
The common inputs to wheat production in Bihar include seed, fertilizer, irrigation, and human and mechanical labor.d
Wheat area under improved variety (IV) seed increased from 70% of total area cultivated in 1982 to 91% in 1999, but then
declined to 76% in 2006-07.35,36 One survey found that 77% of farmers used IV seed, although 58% reported non-availability
of quality seeds as a barrier to higher productivity.37 Perceptions of poor quality may contribute to the depressed seed
adoption rates, which are the second lowest among major wheat-producing states in India after Madhra Pradesh. Low
demand for IV seed may be fueled in part by reports that plants grown using state-supplied seed did not produce any grain,
while farmers in the same district that used traditional seeds did not experience this problem.38
At the same time, the seed replacement rate has increased from 8% in 2003-04 to 11% in 2005-06, with 25% representing
the necessary rate for continued agricultural growth since a self-pollinated crop like wheat must be replaced once every
four years.39 This is one of the lowest seed replacement rates in the country.
Estimates of fertilizer use vary significantly, ranging from 98 kg/ha to 179 kg/ha for the 2007-08 season.40,41,42 Estimates for
the 2010-11 season suggest the average fertilizer usage is around 183 kg/ha, still below the 200+ kg/ha usage in bread
basket states such as Punjab and Haryana, but higher than other wheat-producing states.43 However, a survey of Bihar
wheat farmers found that the high cost of fertilizers was the second most significant constraint to wheat cultivation.44
Tubewell irrigation is the primary source of irrigation (as opposed to canal), which relies on pump power to draw up the
water. Irrigation is estimated to be available to 92% of Bihar farmers, covering 68% of area harvested, but is only used on
d Herbicides and insecticides are not commonly used in Bihar’s wheat cultivation.

EVANS SCHOOL POLICY ANALYSIS AND RESEARCH (EPAR) |
8
about 57% of the area.45 This differential can be attributed
to the high price of diesel fuel, which has increased almost
50% over the past five years and is required for tubewell
irrigation.46,47,48 Thus, despite the widespread use of
irrigation, drought is still a significant problem in Bihar.
Combined, flooding and drought affect between a quarter
and a third of farms in Bihar’s high wheat-producing
districts.49
As Figure 5 suggests, labor costs account for the largest
share of the cost of production. Agricultural wages have
increased almost 20% per annum for the last three
years.50,e Additionally, Bihar has one of the lowest levels of
mechanization among Indian states, with about 5 tractors
per 1000 ha (compared to over 56 tractors per 1000 ha in
Punjab).51
Yield Gap
Wheat yield gaps in Bihar, defined as the difference
between actual and potential yields, are significant.
Average wheat yields in Bihar are 2.19 MT/ha, whereas experimental
yields on research farms and frontline demonstrations have reached 4.5-5.5 MT/ha.52,53 A number of studies shed light on
potential causes of these low yields. Timing of sowing made a significant difference in yields: farmers who delayed sowing
their wheat until December had yields 50% lower than those who sowed in November.54 Limited availability of small
duration rice and wheat varieties is a key factor in late sowing.55 Another factor is imbalanced soil nutrients. Soils in Bihar
are increasingly low in potassium, and while fertilizer use has increased overall, it is heavily skewed toward nitrogen-based
fertilizers. One study in 2005 found the use of Potash increased yields by 1.2 t/ha.56 A 2011 survey of 60 wheat
farmers in Bihar suggested the following as the most significant constraints to productivity: limited availability of IV
seeds, high cost of fertilizers, and lack of market facilities.57 Other factors cited include lack of mechanization,
frequent droughts and/or floods, and wheat diseases such as foliar blight disease.58
Land Tenancy
In a report on agrarian land reform in Bihar released in 2010, the Department of Agriculture reported that as many as 50%
of agricultural households in some areas of Bihar leased land in the year 2000. Households with smaller landholdings were
far more likely to lease than farmers with larger landholdings. Land tenancy arrangements have forced some farmers to
cultivate multiple plots that are not spatially connected. Lack of formal regulatory structure for tenancy means that poor
farmers face greater uncertainty and risk in crop cultivation. Both of these factors discourage efficient land management
and investment in land improvement measures. The report suggests that legalizing and regulating tenancy, encouraging
contract farming, buying available land for redistribution and provision of credit for land purchase all might help alleviate
the issues associated with land tenancy.59
Environmental Considerations
Wheat production in Biharf has contributed to a number of environmental and natural resource management problems that
lower agricultural productivity and threaten long-term regional food security. These problems include physical and
chemical deterioration of soil, leaching of agrochemicals into water, overuse of soil and groundwater resources, and
greenhouse gas emissions.60,61,62 Zero tillage production systems have been shown to mitigate some of the environmental
impact of wheat production in the state and have also been found to increase wheat yields compared to conventional
tillage systems in Bihar and other areas in Northeastern India and Bangladesh.63,64
e Suggested causes include an employment guarantee law and increased construction that makes laborers increasingly scarce. f Research is primarily at the level of the Indo-Gangetic Plains, which stretches across Northern India, bounded by Pakistan Punjab in the
west and Bengal and Bangladesh in the east.
31%
4%
22%
13%
13%
17%Human Labor
Animal Labor
Machine Labor
Seed
Fertilizers
Irrigation
Figure 5: Cost of Wheat Production per Hectare
* Source: Commission for Agricultural Costs and Prices, 2011

EVANS SCHOOL POLICY ANALYSIS AND RESEARCH (EPAR) |
9
Climate change will affect global wheat production by changing temperatures and rates of precipitation. Several studies
have predicted that South Asia will be one of the areas where agricultural yields will be most adversely affected by global
warming.65,66 A study on wheat production in Northern India and Bangladesh predicted that rising temperatures would
reduce the amount of “ideally suited” wheat acreage by 51% in the year 2050.g,67
Upcoming EPAR briefs will discuss the environmental implications of wheat production in greater depth.
Gender in South Asian Rice Production
Although we are not aware of any studies discussing division of labor by gender in wheat production in Bihar, a number of
studies have discussed the role of women in rice production in neighboring areas in South Asia. Pandey et al (2010) reported
that the female labor contribution to agricultural production has increased in South Asia over the past thirty years, but
there was substantial variation across regions. In Bangladesh, 80% of the labor was carried out by men and 20% by women.
In the Indian states of Orissa, Western Bengal, and Uttar Pradesh, division of labor in rice production between males and
females was 61% to 39%, 72% to 28%, and 26% to 74% respectively. If the division of labor in Bihar is similar to that of Uttar
Pradesh, rates of female participation in agriculture are likely to be high.
In a more detailed gender analysis of rice production of two farming villages in Uttar Pradesh (the state just to the west of
Bihar), Paris et al (1996) found that women did the majority of transplanting, weeding, harvesting, and threshing labor in
rice production. Men did the majority of labor for land preparation, seeding, irrigation, and application of fertilizer. A
review on the role of women in agriculture by Halim and Mahbubul-Alam (1995) found a similar division of labor for areas of
Indonesia and Philippines.
Transportation and Storage
Transportation in Bihar is severely limited. The length of surface roads per square kilometer in Bihar is well below the
national average.68 More significantly, only about 30% of villages are connected by roads; however, they are so poorly
maintained that these connections are only seasonal.69 Thus, transportation costs consume a large portion of value chain
margins.70
g The paper defines ideally suited wheat environments to be irrigated, low rainfall, relatively cool environments with high yield potential.
In 2008, the Department of Agriculture in Bihar released a” Roadmap for Agricultural Development” for the period
of 2008-2012 designed to address constraints to agricultural productivity growth in Bihar. While information on
implementation and impact of the program is limited, it identified the following constraints to increased cereal
production in Bihar and recommended a number of solutions. The Department of Agriculture recently released a
new “Roadmap” for 2012-2017.
Production Constraint Proposed Policy Solution
Access to improved seeds Subsidized seed program to facilitate development of local seeds supplies
Insects, pests and disease Training farmers in in Integrated Pest Management (ISM) practices coupled with the establishment of Plant Protection Centers to distribute subsidized bio-pesticides.
Poor soil quality Chemical fertilizer use coupled with periodic use of organic “bio-fertilizers” to replenish soil nutrients
* Source: Bihar Department of Agriculture, “Roadmap for Agricultural Development. Available at krishi.bih.nic.in/pdf/Road_Map_Eng/Agriculture_Eng.pdf

EVANS SCHOOL POLICY ANALYSIS AND RESEARCH (EPAR) |
10
Storage facilities are also insufficient. Estimates of total storage space range from 1,200,000 MT to 1,340,000 MT, whereas
authorities estimate a need of at least 2,500,000 MT. There are only about 120-130 rural godowns or warehouses available
to serve over 1,700 markets, suggesting the limited options available to farmers to dispose of their surplus grains.71 Fewer
than 19% of the markets are wholesale assembling markets. On average, one market, of any type, accounts for about 52
square kilometers.72 The state government is moving to address this shortage by construction 423 godowns, increasing
storage space by 284,000 MT.73
Procurement
About 25% of produced grain reached the market in 2011,an increase from 10% in 2001.74,75 This low proportion may be a
product of, among other things, poor transportation options or limited marketing. The national government plays a
relatively small role in the wheat market in Bihar compared to other states; in the 2011-12 season, only about 10% of Bihar
production was procured by the central government, the second lowest proportion across all of the states that sold any
wheat to the state or central government.76,h Those who do sell to the central government complain of delayed payments.77
Thus, most farmers are forced to sell at less than remunerative prices to local itinerant traders.78
Wheat straw and other residues provide additional value to farmers as fodder for livestock, an important industry in Bihar
as it is the fourth largest producer of meat in India. Wheat and rice straw provide 92% of the dry fodder consumed by
livestock in Bihar, and there is room in the market for increased production as current levels only meet 82% of demand.
Generally, farmers sell their straw to truckers or traders immediately after harvest to avoid spoilage. These traders then
transport the fodder to fodder-deficit districts, generally in the north. A 2012 study by Singh et al. suggests that collecting
and storing the fodder represent significant opportunities for increasing the amount of fodder procured, transported, and
sold.79
Marketing
Wholesale and retail data from Patna (Bihar’s capital) and an annual farm harvest price aggregate for all of Bihar show that
the gap between the farm harvest price and the retail price has increased from about Rs. 2/kg in 2000 to almost Rs. 4/kg in
2012 (see Figure 6). Bihar prices are generally higher than those of other states, which hurts domestic competitiveness.80
Figure 6: Bihar Farm, Wholesale, and Retail Wheat Price
Source: FAO GIEWS Price Tool; Directorate of Economics and Statistics, 2010
h The Indian government procures different crops including wheat to provide a secure market to farmers at predetermined prices that will ensure farmers are remunerated above the cost of production.
0
2
4
6
8
10
12
14
16
Jan-0
0
Sep-0
0
May-0
1
Jan-0
2
Sep-0
2
May-0
3
Jan-0
4
Sep-0
4
May-0
5
Jan-0
6
Sep-0
6
May-0
7
Jan-0
8
Sep-0
8
May-0
9
Jan-1
0
Sep-1
0
May-1
1
Jan-1
2
Rs.
/kg
India - Patna - Wheat - Retail(Indian Rupee/Kg)
India - Patna - Wheat -Wholesale (Indian Rupee/Kg)
Bihar - Farm Harvest Price

EVANS SCHOOL POLICY ANALYSIS AND RESEARCH (EPAR) |
11
Processing and Milling
Processing wheat in Bihar includes, to differing degrees, packing and bagging, sorting and grading, weighing, and
transporting. The initial processes are generally taken on by the producer, whereas the latter processes are taken on by
traders, wholesalers, or retailers. However, only 12% of rural markets have the appropriate facilities for the more involved
activities like sorting, grading, and weighing.81
Milling occurs in two different forms, roller mills, and chakkis. The chakkis are the traditional wheat millers, producing
‘chakki atta’ (flour) through a process similar to a stone grinder. On the individual level, ‘chakki atta’ is preferred for its
texture and taste. The roller mills are more modern and produce more refined, sifted flour.82 The milling sector is mostly
small-scale and highly fragmented.83 In Bihar, there are numerous local chakkis where families can take small increments of
wheat to be ground. Construction of larger roller mills had remained stagnant over most of the last 20 years before a state
government subsidy of 30% of investment costs led to the doubling of mill construction.84,85,86 This construction also
coincided with increased consumption of biscuits, cakes, and other goods demanding flour. Value addition processes such as
fortification to improve shelf life and add nutrients are rare.87
Important Trends in Wheat
Increasing Consumption of Wheat-Based Productsi
Consumption of wheat-based products such as biscuits or bakery products has increased across the population of Bihar over
the past 20 years. Whereas in 1993 only about 29% of rural households and 50% of urban households in Bihar consumed
biscuits on a monthly basis, that proportion increased to over 70% for both rural and urban households. By 2009, 1% and 4%
of rural households consumed cakes or bakery bread respectively on a monthly basis, up from 0% and 2% just five years
earlier. Frequency of bakery bread consumption has fallen among urban households from 16% of households in 2005 to 13%
in 2009. Cake and pastry consumption has increased from >1% of urban households to over 2% in the past five years.
Potential Substitution of Maize for Wheat Production
Bihar has the highest maize yields in India,88,89 and reports suggest that maize may become an increasingly attractive crop
for producers.90,91 Nationally, demand for corn has increased in the animal feed sector and industrial use sectors.92
However, there is no strong evidence that maize is currently displacing wheat production; as was shown in Figure 4, wheat
area cultivated has risen at a faster rate than maize area cultivated in the past five years.
India’s Demand is Expected to Outpace Supply
Over the next twenty years, Indian demand for wheat is projected to exceed domestic supply, with the gap between supply
and demand becoming more pronounced toward 2030.j India is expected to be one of the highest wheat demanding and
supplying nations in the world, second only to China. EPAR Brief No. 199 discusses these national trends in more detail.
Please direct comments or questions about this research to Leigh Anderson and Mary Kay Gugerty, at [email protected].
i Taken from author’s analysis of data from the past four National Sample Survey Organisation’s Household Consumption Reports. j These estimates are based on the IFPRI IMPACT model, which examines future scenarios for global food supply, demand, trade, prices, and food security for 30 commodities. It is specified as a set of 115 country-level supply and demand equations where each country model is linked to the rest of the world through trade. FAO data from the year 2000 is the input data for the projection model. More information on model methodology is available at http://www.ifpri.org/book-751/ourwork/program/impact-model

EVANS SCHOOL POLICY ANALYSIS AND RESEARCH (EPAR) |
12
Appendix 1: Wheat in Orissa
Wheat production in Orissa is minimal and has generally decreased over the past 15 years. Production ranges from below
20,000 MT to over 40,000 MT on an area between 13,000 and 24,000 ha (see Figure 7). For comparison, Bihar produced
between 3.5 and 5.5 million MT of wheat on around 2 million ha of land during the same period. Wheat area cultivated in
Orissa has fallen 5,000 ha from 1992 to 2008, while production has fallen 14,000 MT. Yields have been low and decreasing
throughout the period, ranging from 1.25 MT/ha to 1.75 MT/ha. Rice production accounts for around 90% of grain
production in Orissa.
Figure 7: Wheat Production in Orissa
Source: Government of Orissa, 2011
Wheat consumption in Orissa is also relatively minor, accounting for 4% of per capita cereal consumption (see Figure 8).93
While wheat consumption was higher in 2008 than in 1993, consumption has fallen in both urban and rural populations over
the past few years. Compared to the national average, Orissa consumes considerably less wheat than most parts of India.
Based on the minor significance of wheat in Orissa, our analysis does not proceed to describe the wheat value chain in
Orissa.
Figure 8: Wheat Consumption in Orissa
Source: Government of Orissa, 2011
0
5,000
10,000
15,000
20,000
25,000
30,000
35,000
40,000
45,000
Area, Ha
Production, MT
0
1
2
3
4
5
6
Month
ly k
g p
er
capit
a
Orissa Rural Wheat Consumption
All-India Rural WheatConsumption
Orissa Urban Wheat Consumption
All-India Urban WheatConsumption

EVANS SCHOOL POLICY ANALYSIS AND RESEARCH (EPAR) |
13
List of References
Bhotika, A. (2011). Regulations on a flour milling industry in India. Retrieved from http://ssrn.com/abstract=1962734
Bihar Department of Agriculture. (2011a). SeedNet India portal. Retrieved from http://krishi.bih.nic.in/Seed.html
Bihar Department of Agriculture. (2011b). Fertilizer. Retrieved from http://krishi.bih.nic.in/fertilizer.html
Bihar Department of Agriculture. (n.d.). Agriculture. Retrieved on July 27, 2012 from,
http://krishi.bih.nic.in/defolt1.html
Bihar Department of Agriculture. (2010). Chapter IV:Reforming the Agrarian Sector. In Toward Accelerated Agricultural
Development in Bihar (pp. 1-7). Retrieved from http://krishi.bih.nic.in/steering_group.html
Bouis, H. E., Chassy, B. M., & Ochanda, J. O. (2003). Genetically modified food crops and their contribution to human nutrition and food quality. Trends in Food Science & Technology, 14(5-8), 191-209. doi:10.1016/S0924-2244(03)00073-6
CIMMYT. (2011). WHEAT - Global alliance for improving food security and the livelihoods of the resource-poor in the developing world.
Centre for Environment Education. (2005). Environmental assessment and environmental management framework for the Bihar Rural Livelihoods Project.
Commission for Agricultural Costs and Prices. (2011). Price policy for rabi crops: The marketing season 2012-2013. Retrieved from http://cacp.dacnet.nic.in/RPP/Rabi_Report_2011-12-Vol1.pdf
Dasgupta, P., & Smita, S. (2010). Indian agriculture scenarios and food security in the context of climate change: A review. Retrieved from http://mpra.ub.uni-muenchen.de/24067/
Davidsson, L. (2003). Dietary factors influencing trace element homeostasis: Approaches to improve iron bioavailability from complementary foods. American Society for Nutritional Sciences, 1560S-1562S.
Department of Food and Public Distribution. (2012). Annual Report 2010-11. Retrieved from http://dfpd.nic.in/fcamin/sites/default/files/userfiles/annual201011.pdf
Dixon, J., Braun, H.-J., Kosina, P., & Crouch, J. (Eds.). (2009). Wheat Facts and Futures 2009. Mexico, D.F.: CIMMYT.
EPAR. (2009). Brief No. 36 - Gender and Cropping: Wheat in Sub-Saharan Africa. Retrieved from http://evans.washington.edu/files/Evans UW_Request 36_Gender and Cropping_Wheat in SSA_05-18-2009 _0.pdf
EPAR. (2010). Brief No. 114 - Crops & climate change: Wheat.
Ethiopia Commodity Exchange. (n.d.). Wheat. Commodities. Retrieved from http://www.ecx.com.et/commodities.aspx
Food Corporation of India. (2012). Agency wise procurement of wheat during last five years. Retrieved from http://fciweb.nic.in/procurements/view/13
Fujita, K. (2012). Development strategy in Bihar through revitalizing the agricultural sector: A preliminary analysis. Retrieved from http://www.ide.go.jp/English/Publish/Download/Dp/332.html
Government of Bihar. (2012). Economic Survey 2011-12. Retrieved from http://finance.bih.nic.in/Budget/Economic-Survey-2012-En.pdf
EVANS SCHOOL POLICY ANALYSIS AND RESEARCH (EPAR) |
14
Government of Orissa. (2011). Economic Survey 2010-11. Retrieved from http://www.odisha.gov.in/p&c/Download/Economic_Survey_2010_11.pdf
Grace, P., Harrington, L., Jain, M., & Robertson, G. P. (2003). Long-term sustainability of the tropical and sub-tropical rice-wheat system: An environmental perspective. Improving the productivity and sustainability of rice-wheat systems: Issues and impacts.
Gupta, R., Hobbs, P., Ladha, J. K., & Prabhakar, S. V. R. . (2002). Resource conserving technologies: Transforming the rice-wheat systems of the Indo-Gangetic Plains.
Gupta, R. K., Laxmi, V., & Erenstein, O. (2007). Impact of zero tillage in India’s rice-wheat systems. CIMMYT.
Gupta, R., & Seth, A. (2007). A review of resource conserving technologies for sustainable management of the rice–wheat cropping systems of the Indo-Gangetic plains (IGP). Crop Protection, 26(3), 436-447. Retrieved from http://www.sciencedirect.com.offcampus.lib.washington.edu/science/article/pii/S0261219406002675
Halim, A., & Mahbubul Alam, A. B. M. (1995a). Women in the Homestead: The South Asian Perspective. Women in Agriculture: Perspective, Issues and Experiences (pp. 180-195). M.D. Publications Pvt. Ltd. Retrieved from http://books.google.com/books?id=CVl4qb4JgGEC&pgis=1
Halim, A., & Mahbubul Alam, A. B. M. (1995b). Women in the Homestead: The South Asian Perspective. Women in Agriculture: Perspective, Issues and Experiences (pp. 180-195). M.D. Publications Pvt. Ltd. Retrieved from http://books.google.com/books?id=CVl4qb4JgGEC&pgis=1
IRRI. (2009). Revitalizing the rice-wheat cropping systems of the Indo-Gangetic plains: Adaptation and adoption of resource conserving technologies in India, Bangladesh and Nepal. Retrieved from http://pdf.usaid.gov/pdf_docs/PDACP630.pdf
Infrastructure Leasing & Financial Services. (2008). Food processing in Bihar: The road ahead. Retrieved from http://industries.bih.nic.in/Acts/AD-01-24-04-2007.pdf
Janaiah, A., & Hossain, M. (n.d.). Farm-level sustainability of intensive rice-wheat system: Socioeconomic and policy perspectives. Retrieved from http://www.knowledgebank.irri.org/ckb/PDFs/croppingsystem/socioeconomic/farm-level sustainability of intensive rice-wheat system - socioeconomic and policy perspectives.pdf
Kumbhare, N. V., & Singh, K. (2011). Adoption behaviour and constraints in wheat and paddy production technologies. Indian Res. J. Ext. Edu., 11(3), 41-44.
Ladha, J. K., Fischer, K. S., Hossain, M., Hobbs, P. R., & Hardy, B. (Eds.). (2000). Improving productivity and sustainibility of rice-wheat systems of the Indo-Gangetic Plains. IRRI. Retrieved from http://dspace.irri.org:8080/dspace/bitstream/10269/158/1/discussion paper 40.pdf
Ladhaa, J. K., Dawe, D., Pathak, H., Padre, A. ., Yadav, R. ., Singh, B., Singh, Y., et al. (n.d.). How extensive are yield declines in long-term rice–wheat experiments in Asia? Retrieved July 12, 2012, from http://www.sciencedirect.com.offcampus.lib.washington.edu/science/article/pii/S0378429002002198
Latham, M. C. (1997). Human nutrition in the developing world. Rome: FAO.
Lobell, D. B., Burke, M. B., Tebaldi, C., Mastrandrea, M. D., Falcon, W. P., & Naylor, R. L. (2008). Prioritizing climate change adaptation needs for food security in 2030. Science, 319, 607-10. American Association for the Advancement of Science.
MCX. (2009). Wheat. Retrieved from http://pulsesindia.in/flashnews/26-5-09/Wheat Presentation.pdf
Mall, R. K., Singh, R., Gupta, A., Srinivasan, G., & Rathore, L. S. (2006). Impact of climate change on Indian agriculture: A review. Climatic Change, 78(2-4), 445-478.

EVANS SCHOOL POLICY ANALYSIS AND RESEARCH (EPAR) |
15
McKee, D. (2012). Lifting the screen on Indian milling. World Grain, (April). Retrieved from http://www.davidmckee.org/wp-content/uploads/2012/04/IndiaWheatWGarticlepdf2012.pdf
Ministry of Food Processing Industries. (1994). Food grain milling industries. Retrieved from http://mofpi.nic.in/ContentPage.aspx?CategoryId=423
Ministry of Statistics and Program Implementation. (2010). Manual on agricultural prices and marketing.
Moore, J., & Hao, J. (2012). Antioxidant and health promoting properties of wheat. In L. Yu, R. Tsao, & F. Shahidi (Eds.), Cereals and pulses: Nutraceutical properties and health benefits (pp. 272-313). Hoboken: Wiley-Blackwell.
National Food Security Mission. (2011). Crop calendar of NFSM crops. Retrieved from http://nfsm.gov.in/nfsmmis/RPT/CalenderReport.aspx
National Multicommodity Exchange of India (NMCE). (n.d.). Report on wheat. Retrieved from http://www.nmce.com/files/study/wheat.pdf
National Sample Survey Organisation. (1997). Consumption of some important commodities in India. Retrieved from http://mospi.nic.in/rept _ pubn/404_final.pdf
National Sample Survey Organisation. (2001). Consumption of some important commodities in India 1999-2000 (Vol. 474). Retrieved from http://mospi.nic.in/rept _ pubn/461_final.pdf
National Sample Survey Organisation. (2007). Household consumption of various goods and services in India, 2004-05. Retrieved from http://mospi.nic.in/rept _ pubn/509_P2_final.pdf
National Sample Survey Organisation. (2012). Household consumption of various goods and services in India. Retrieved from http://mospi.nic.in/mospi_new/upload/nss_report_541.pdf
Nelson, G. C., Rosegrant, M. W., Koo, J., Robertson, R., Sulser, T., Zhu, T., Ringler, C., et al. (2009). Climate change: Impact on agriculture and costs of adaptation. doi:10.2499/0896295354
Office of the Director of Census Operations. (2011). Census of India: Provisional population totals. Retrieved from http://munger.bih.nic.in/Data/ppt2011-report1-Bihar.pdf
Ortiz, R., Sayre, K. D., Govaertsa, B., Guptaa, R., Subbarao, G. V., Ban, * T., Hodson, D., et al. (2006). Climate change: Can wheat beat the heat? Agriculture, Ecosystems & Environment, 126(1-2), 46-58. Retrieved from http://www.sciencedirect.com.offcampus.lib.washington.edu/science/article/pii/S0167880908000194
O’Brien, K., Leichenko, R., Kelkar, U., Venema, H., Aandahl, G., Tompkins, H., Javed, A., et al. (2004). Mapping vulnerability to multiple stressors: Climate change and globalization in India. Global Environmental Change, 14(4), 303-313.
Pandey, S., Byerlee, D., Dawe, D., Dobermann, A., Mohanty, S., Rozelle, S., & Hardy, B. (2010a). Rice in the Global Economy: Strategic Research and Policy Issues for Food Security (Vol. 2, p. 477). Int. Rice Res. Inst. Retrieved from http://books.google.com/books?hl=en&lr=&id=OsvC2vEqkG8C&pgis=1
Pandey, S., Byerlee, D., Dawe, D., Dobermann, A., Mohanty, S., Rozelle, S., & Hardy, B. (2010b). Rice in the global economy: Strategic research and policy issues for food security (Vol. 2, p. 477). Int. Rice Res. Inst. Retrieved from http://books.google.com/books?hl=en&lr=&id=OsvC2vEqkG8C&pgis=1
Paris, T., Singh, A., Hossain, M., & Luis, J. (2000a). Using gender analysis in characterizing and understanding farm-household systems in rainfed lowland rice environments. Characterizing and Understanding Rainfed Environments (p. 488). Int. Rice Res. Inst. Retrieved from http://books.google.com/books?hl=en&lr=&id=PtsQWJ9aiigC&pgis=1

EVANS SCHOOL POLICY ANALYSIS AND RESEARCH (EPAR) |
16
Paris, T., Singh, A., Hossain, M., & Luis, J. (2000b). Using gender analysis in characterizing and understanding farm-household systems in rainfed lowland rice environments. Characterizing and Understanding Rainfed Environments (p. 488). Int. Rice Res. Inst. Retrieved from http://books.google.com/books?hl=en&lr=&id=PtsQWJ9aiigC&pgis=1
Paris, Thelma, Singh, A., & Hussein, M. (1996a). Social consequences of stressed environments. Physiology of Stress Tolerance In Rice (p. 239). Int. Rice Res. Inst. Retrieved from http://books.google.com/books?id=YzTOV0yhUI8C&pgis=1
Paris, Thelma, Singh, A., & Hussein, M. (1996b). Social consequences of stressed environments. Physiology of Stress Tolerance In Rice (p. 239). Int. Rice Res. Inst. Retrieved from http://books.google.com/books?id=YzTOV0yhUI8C&pgis=1
Peleg, Z., Saranga, Y., Yazici, A., Fahima, T., Ozturk, L., & Cakmak, I. (2008). Grain zinc, iron and protein concentrations and zinc-efficiency in wild emmer wheat under contrasting irrigation regimes. Plant Soil, 306, 57-67. doi:10.1007/s11104-007-9417-z
Prasad, J. (2007). Bihar: Dynamics of Development (p. 254). Mittal Publications. Retrieved from http://books.google.com/books?id=GFvvUjIruyIC&pgis=1
Rahman, S., & Routray, J. K. (1998). Technological Change and Women’s Participation in Crop Production in Bangladesh. Gender, Technology and Development, 2(2), 243-267. Retrieved from http://gtd.sagepub.com/cgi/content/abstract/2/2/243
Rahman, Sanzidur. (2000). Women’s employment in Bangladesh agriculture: composition, determinants and scope. Journal of Rural Studies, 16(4), 497-507. Retrieved from http://dx.doi.org/10.1016/S0743-0167(00)00006-1
Rahman, Sanzidur. (2010). Women’s Labour Contribution to Productivity and Efficiency in Agriculture: Empirical Evidence From Bangladesh. Journal of Agricultural Economics, 61(2), 318-342. Retrieved from http://doi.wiley.com/10.1111/j.1477-9552.2010.00243.x
Roy, R. (2012, May 12). India may export wheat from government stocks. Wall Street Journal.
Samanta, R. K. (1995). Women in Agriculture: Perspective, Issues and Experiences (p. 218). M.D. Publications Pvt. Ltd. Retrieved from http://books.google.com/books?id=CVl4qb4JgGEC&pgis=1
Singh, K. M., Singh, R. K. P., Jha, A. K., Singh, D. K., & Singh, V. K. (2012). A study of fodder value chain in Bihar (India). Retrieved from http://ssrn.com/abstract=2030610
Singh, V. P. (1996). Physiology of Stress Tolerance In Rice (p. 239). Int. Rice Res. Inst. Retrieved from http://books.google.com/books?id=YzTOV0yhUI8C&pgis=1
Special Task Force on Bihar. (2008). Bihar’s agriculture development: Opportunities & challenges. Retrieved from http://planningcommission.nic.in/aboutus/taskforce/tsk_adoc.pdf
Timsina, J., & Connor, D. J. (2001). Productivity and management of rice–wheat cropping systems: issues and challenges. Field Crops Research, 69(2), 93–132.
Tuong, T. P. (2000). Characterizing and understanding rainfed environments. IRRI. Retrieved from http://books.google.com/books?hl=en&lr=&id=PtsQWJ9aiigC&pgis=1
USDA Foreign Agricultural Service. (2012). India grain and feed annual report. Retrieved from http://gain.fas.usda.gov/Recent GAIN Publications/Grain and Feed Annual_New Delhi_India_2-23-2012.pdf
White, P. J., & Broadley, M. R. (2009). Biofortification of crops with seven mineral elements often lacking in human diets. The New Phytologist, 182(1), 49-84. doi:10.1111/j.1469-8137.2008.02738.x
EVANS SCHOOL POLICY ANALYSIS AND RESEARCH (EPAR) |
17
World Bank. (2007). Bihar agriculture: Building on emerging models of “success.” Retrieved from http://www-wds.worldbank.org/external/default/WDSContentServer/WDSP/IB/2007/06/22/000310607_20070622133057/Rendered/PDF/363250IN0white1ort0P09076101PUBLIC1.pdf
1 Commission for Agricultural Costs and Prices, 2011 2 USDA Foreign Agricultural Service, 2012 3 Office of the Director of Census Operations, 2011 4 National Sample Survey Organisation, 2007 5 Roy, 2012 6 USDA Foreign Agricultural Service, 2012 7 Commission for Agricultural Costs and Prices, 2011 8 Department of Food and Public Distribution, 2012 9 MCX, 2009 10 Dixon et al., 2009 11 Peleg et al., 2008 12 Ethiopia Commodity Exchange, 2009 13 Peleg et al., 2008 14 NMCE, n.d. 15 Latham, 1997 16 Moore and Hao, 2012 17 White and Broadley, 2009, p. 57 18 Peleg et al., 2008, p. 58 19 Bouis et al., 2003, p. 57 20 Dixon et al., 2009, p. 31 21 Davidsson, 2003 22 Special Task Force on Bihar, 2008 23 USDA Foreign Agricultural Service, 2012 24 Bihar Department of Agriculture, 2011a 25 Kumbhare and Singh, 2011 26 Special Task Force on Bihar, 2008 27 Government of Bihar, 2012 28 Infrastructure Leasing & Financial Services, 2008 29 Special Task Force on Bihar, 2008 30 Timsina&Connor, 2001 31 Bihar Department of Agriculture, n.d. 32 National Food Security Mission, 2011 33 Bihar Department of Agriculture, 2010 34 World Bank, 2007 35 Special Task Force on Bihar, 2008, p. 34 36 Commission for Agricultural Costs and Prices, 2011, p. 15 37 Kumbhare and Singh, 2011 38 “Grain pain for wheat farmers”, 2011 39 Bihar Department of Agriculture, 2011 40 Special Task Force on Bihar, 2008 41 Department of Agriculture-Bihar, 2011 42 Commission for Agricultural Costs and Prices, 2011, pp. 14-15 43 Bihar Department of Agriculture, 2011 44 Special Task Force on Bihar, 2008 45 Janaiah and Hossain, n.d. 46 Commission for Agricultural Costs and Prices, 2011, pp. 62-63 47 Fujita, 2012 48 Commission for Agricultural Costs and Prices, 2011 49 Special Task Force on Bihar, 2008 50 Commission for Agricultural Costs and Prices, 2011, pp. 60-61 51 Special Task Force on Bihar, 2008 52 Special Task Force on Bihar, 2008 53 Centre for Environment Education, 2005 54 Centre for Environment Education. 2005 55 Special Task Force on Bihar, 2008

EVANS SCHOOL POLICY ANALYSIS AND RESEARCH (EPAR) |
18
56 Centre for Environment Education, 2005 57 Kumbhare and Singh, 2011 58 Special Task Force on Bihar, 2008 59 Department of Agriculture-Bihar, 2010 60 Guptaa and Seth, 2007 61 Gupta et al., 2002 62 Grace et al., 2003 63 IRRI, 2009 64 Gupta, Laxmi, & Erenstein, 2007 65 Nelson et al., 2009 66 Lobell et al., 2008 67 O’Brien et al., 2004 68 Infrastructure Leasing & Financial Services, 2008, p. 26 69 Special Task Force on Bihar, 2008 70 World Bank, 2007 71 Infrastructure Leasing & Financial Services, 2008 72 Ministry of Statistics and Programme Implementation, 2010 73 Government of Bihar, 2012 74 Commission for Agricultural Costs and Prices, 2011, pp. 16-17 75 World Bank, 2007 76 Food Corporation of India, 2012 77 Commission for Agricultural Costs and Prices, 2011 78 Special Task Force on Bihar, 2008 79 Singh et al., 2012 80 World Bank, 2007 81 Infrastructure Leasing & Financial Services, 2008 82 McKee, 2012 83 Bhotika, 2011 84 Ministry of Food Processing Industries, 1994 85 Infrastructure Leasing & Financial Services, 2008 86 McKee, 2012 87 Bhotika, 2011 88 World Bank, 2007 89 Infrastructure Leasing & Financial Services, 2008 90 Infrastructure Leasing & Financial Services, 2008, p. 47 91 Commission for Agricultural Costs and Prices, 2011 92 USDA Foreign Agricultural Service, 2012 93 Government of Orissa, 2011, p. 21


![The Bihar Shops & Establishments Act, 1953]udyog.bihar.gov.in/All_in_one_doc_file/Bihar-Shops-and... · 2016-03-05 · The Bihar Shops & Establishments Act, 1953]1 [ BIHAR ACT VIII](https://img.dokumen.tips/doc/110x75/5ea4b0985663d337125d6142/the-bihar-shops-establishments-act-1953udyogbihargovinallinonedocfilebihar-shops-and.jpg)