Embed Size (px)
Citation preview

2017 NMHC Annual MeetingJanuary 24-26, 2017
What’s the Next Generation of Innovation for Multifamily?

WHAT’S THE NEXT GENERATION OF INNOVATION FOR MULTIFAMILY?
Brenna WalravenCorporate Sustainability Strategies, Inc.
Lou SchotskyEquity Residential
Drew TorbinBlack Bear Energy
Kevin VerdiNational Real Estate Advisors

2017 NMHC Annual MeetingJanuary 24-26, 2017
Equity ResidentialSustainability Innovations

EQUITY RESIDENTIAL PORTFOLIO 2016
Note: As of 6/30/16.
(1) Includes Los Angeles, San Diego and Orange County.
Represents percentage of Stabilized NOI.
93 Properties22,407 Units42% NOI - Mid/Highrise58% NOI - Garden
54 Properties12,756 Units49% NOI - Mid/Highrise51% NOI - Garden
37 Properties7,096 Units78% NOI - Mid/Highrise22% NOI - Garden
30 Properties7,588 Units81% NOI - Mid/Highrise19% NOI - Garden
40 Properties10,632 Units95% NOI - Mid/Highrise5% NOI - Garden
47 Properties15,637 Units90% NOI - Mid/Highrise10% NOI - Garden
San Francisco
Southern California (1) Washington, D.C.
New York
Seattle Boston8%
20%
25%
17%
19%
11%

HIGHER WALKSCORES INDICATE LOWER NECESITY TO DRIVE

CLEAN ENERGY POWERS THE EQUITY PORTFOLIOCreates Desireable Economic and Environmental Returns
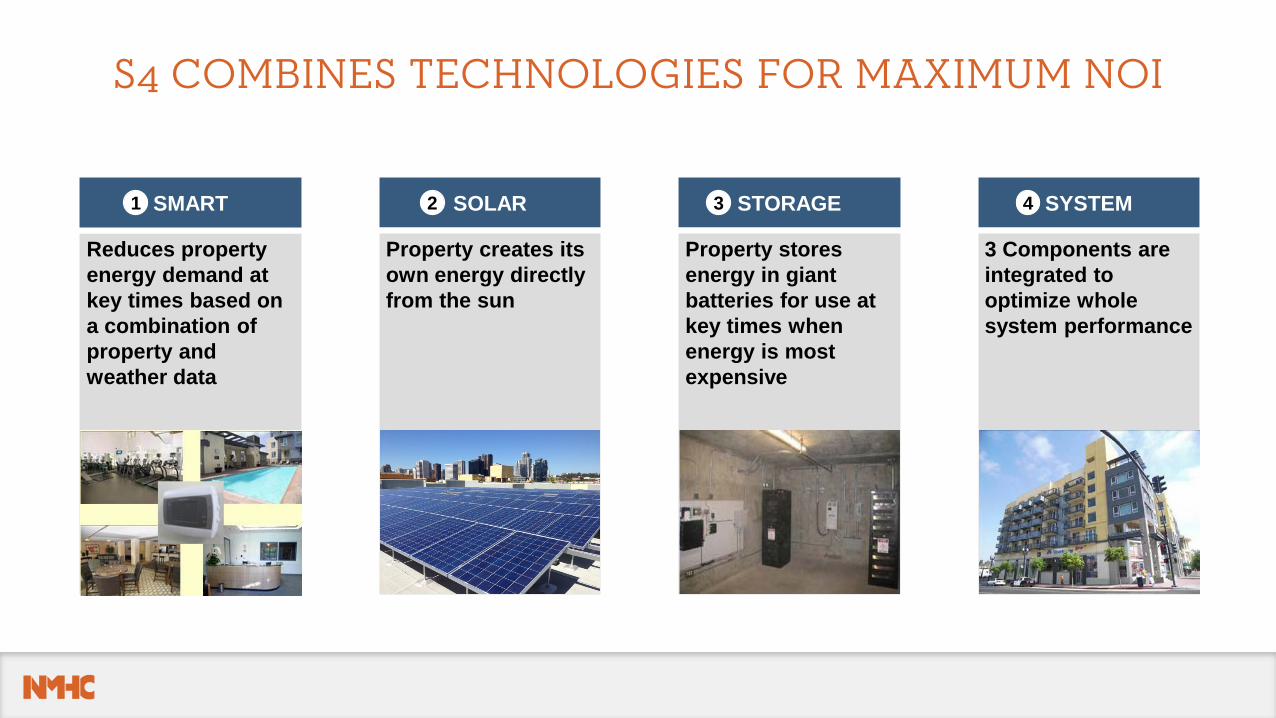
S4 COMBINES TECHNOLOGIES FOR MAXIMUM NOI
SOLAR
Property creates its own energy directly from the sun
2 STORAGE
Property stores energy in giant batteries for use at key times when energy is most expensive
3
Reduces property energy demand at key times based on a combination of property and weather data
SMART1 SYSTEM
3 Components are integrated to optimize whole system performance
4

26 SITES POWERED BY COGENERATIONOnsite Combined Heat and Electricity Generation

LIGHTING PROJECTS CREATE VARIETY OF BENEFITS
Before After

2017 NMHC Annual MeetingJanuary 24-26, 2017
Innovation and ESG

NATIONAL’S PROFILE• Headquartered in Washington, D.C.
• An SEC registered investment advisor2
• Net assets under management: $2.7 billion / 58 investments3
• Specializes in executing build-to-core strategies, including through an open-end, core-plus fund
• Invests in most major real estate sectors—mixed-use, apartments, office, retail, industrial, hotels and data centers
• Focuses investments on leading U.S. urban markets
• 50 employees—with offices in Chicago, Dallas, Los Angeles, Philadelphia, and Phoenix
• Wholly owned by a subsidiary of the National Electrical Benefit Fund, a major U.S. pension fund with more than $12.9 billion total net assets
• Since January 1, 2000, in the aggregate, all assets managed by the professionals at National1 have generated an average annual gross return of 10.27% 4,10
11
As of 9/30/20161,2,3. Please refer to “Company End Notes” page of this presentation.4. National has operated as an investment advisor since January 2010. In addition, National’s key managing members generally worked together at National’s predecessor firm, NEBF Real Estate from 2000 through 2010. This performance measurement uses the annualized time-weighted methodology. The return is a gross return as a fee structure was not in place for NEBF Real Estate from 1/1/2000 through 1/1/2010. 10. Please refer to “Performance End Notes” page of this presentation.

NATIONAL’S HISTORY
12
2000
National establishes a commingled open-end
vehicle for pension fund investors, the INDURE
Build-to-Core Fund.
National’s INDURE Build-to-Core open-end fund grows to $2.1 billion net assets under management with 60 investors.3
National formalizes its development activities and launches National Real Estate Development.
NEBF forms investment team to invest in real estate projects for multi-billion dollar pension fund.
As of 9/30/20163. Please refer to “Company End Notes” page of this presentation.
2016
2013
2010
NEBF establishes National Real Estate Advisors as a subsidiary to manage real estate investments for other institutional investors—public funds, endowments and foundations.

URBAN MARKET FOCUS
13
As of 9/30/20161. The market value of National Managed real estate investments is not inclusive of Fund-level cash and other net assets.Note: Based on the Top 10 Metropolitan Statistical Areas (MSA’s) represented by NPI investments. MSA’s are defined by the U.S. Office of Management and Budget.
83% of National’s portfolio (by
market value1) is located in primary
urban markets.
These markets tend to have similar characteristics:
High levels of intellectual capital
Population growth
Job growth and job stability
Strong transportation networks
Supply constraints
High barriers to entry for developers
Seattle
San Francisco
Los Angeles
Houston
Chicago
Washington, D.C.
New York
Boston
National invests in leading U.S. urban markets with barriers to entry, diversified economies, mass transportation networks and high levels of intellectual capital.
Portland
Philadelphia
Denver

COMMITMENT TO ESG BEST PRACTICESESG policies at National help buttress investment performance and produce competitive returns over time.
ENVIRONMENTAL
Sustainable development and management practices lead to more efficient operations and healthier building environments for tenants.
National demonstrates strong year-over-year improvement against its peers, earning Green Stars from the GRESB benchmarks for 2015 and 2016.
Produces good jobs for workers and good work for contractors through our responsible contractor policy.
More than 34 million well-paying, labor-hours created since 2000.1*
Recognized by Pensions & Investments as one of the “Best Places to Work” in Money Management. (2014, 2016)
Seeking to maintain the highest fiduciary standards in dealing with all aspects of our business.
Adopting programs and strategies aimed at advancing ESG measures and engaging stakeholders in a collaborative manner.
SOCIAL GOVERNANCE
As of 9/30/20161. Please refer to “Company End Notes” page of this presentation.*National calculates labor-hours internally using assumed labor rates and percentages based on hard cost information generally provided by partners, borrowers or general contractors.
5

Leased over 300K sf in first 24 months at rates +/- 10% over neighboring properties during heavy construction
THE BLOCLOS ANGELES, CALIFORNIA
6
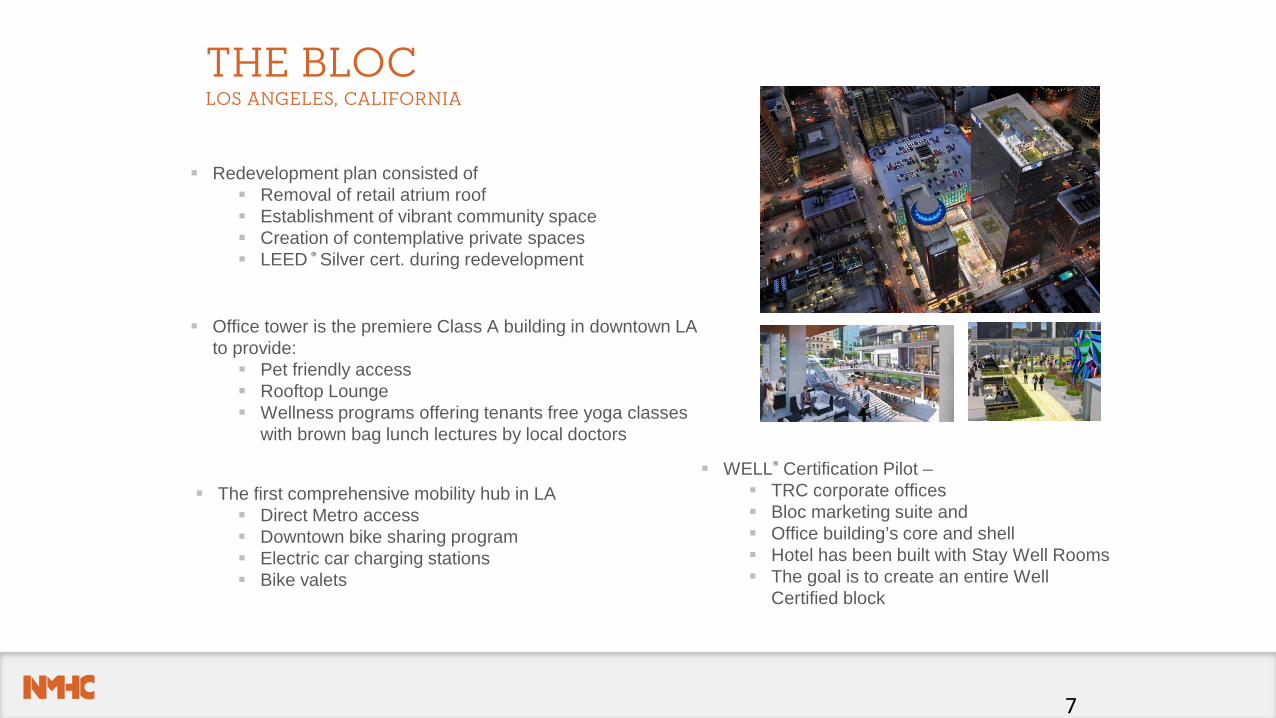
Redevelopment plan consisted of Removal of retail atrium roof Establishment of vibrant community space Creation of contemplative private spaces LEED ® Silver cert. during redevelopment
Office tower is the premiere Class A building in downtown LA to provide: Pet friendly access Rooftop Lounge Wellness programs offering tenants free yoga classes
with brown bag lunch lectures by local doctors
WELL® Certification Pilot – TRC corporate offices Bloc marketing suite and Office building’s core and shell Hotel has been built with Stay Well Rooms The goal is to create an entire Well
Certified block
The first comprehensive mobility hub in LA Direct Metro access Downtown bike sharing program Electric car charging stations Bike valets
THE BLOCLOS ANGELES, CALIFORNIA
7

EAST MARKETPHILADELPHIA, PA
17
KEY STATS
Property Type: Mixed-UseTotal Estimated Project Cost: $620,000,000
Square Feet/Units: 773,000 SF (current construction & existing buildings)
Status: Development
Note: All figures as of 9/30/2016

ONE CONGRESSBOSTON, MA
18
KEY STATS
Property Type: Mixed-UseTotal Estimated Project Cost: $2,000,000,000
Square Feet/Units: Approved for 2,300,000 SF
Status: Operating / Pre-developmentNote: All figures as of 9/30/2016

JOURNAL SQUAREDJERSEY CITY, NJ
KEY STATS
Property Type: ApartmentTotal Estimated Project Cost Phase I: $284,514,636
Total Estimated Project Cost Phase II: $429,624,000
Total Estimated Project Cost Phase III: $425,440,000
Total Estimated Project Cost: $1,139,578,636
Square Feet/Units: 538 units (1st phase) / 1,843 units (total estimated)
Status: Development / Pre-development Note: All figures as of 9/30/2016
10

Natural Gas Power Plant
Indoor Vertical Greenhouse
Data Center
Philadelphia Navy Yard Project
11

Data Center
CO2Heating CoolingElectricity46% 47%
Philadelphia Navy Yard Project
12

Indoor Vertical Farming
• Lowered CO2 cost through recycled exhaust gas
• Optimized growing conditions in a lab-like environment:
• 30 harvests per year vs. 2-3 in the field
• No seasonality or weather risk
• Uses 95% less water• 50% less fertilizers• zero pesticides, herbicides
& fungicides• Lower transportation costs &
pollution• Creating local jobs

A Data Center• Developed and operated by
Sabey• Utilizes the cheap power from
our on-site natural gas engine• The natural gas combustion
exhaust heat is converted to cooling and used for the Data Center heat load
• Use the local energy grid for back-up power
Philadelphia Navy Yard Project

2017 NMHC Annual MeetingJanuary 24-26, 2017
What’s the Next Generation of Innovation for Multifamily?

A NEW RELATIONSHIP WITH ELECTRICITY
Utility Driven (late 1800s – present)
Customer Driven (early 2000s – present)
CustomerDistributionTransmissionGeneration
Generation Transmission Distribution Rate Payer
www.blackbearenergy.com

OUR FOCUS
www.blackbearenergy.com
25+ CLIENTS 2.5B+ SQFT
4 TECHNOLOGY VERTICALS
SOLAR ENERGY STORAGE
LED FUEL CELL
1x RFP PER WEEK
www.blackbearenergy.com
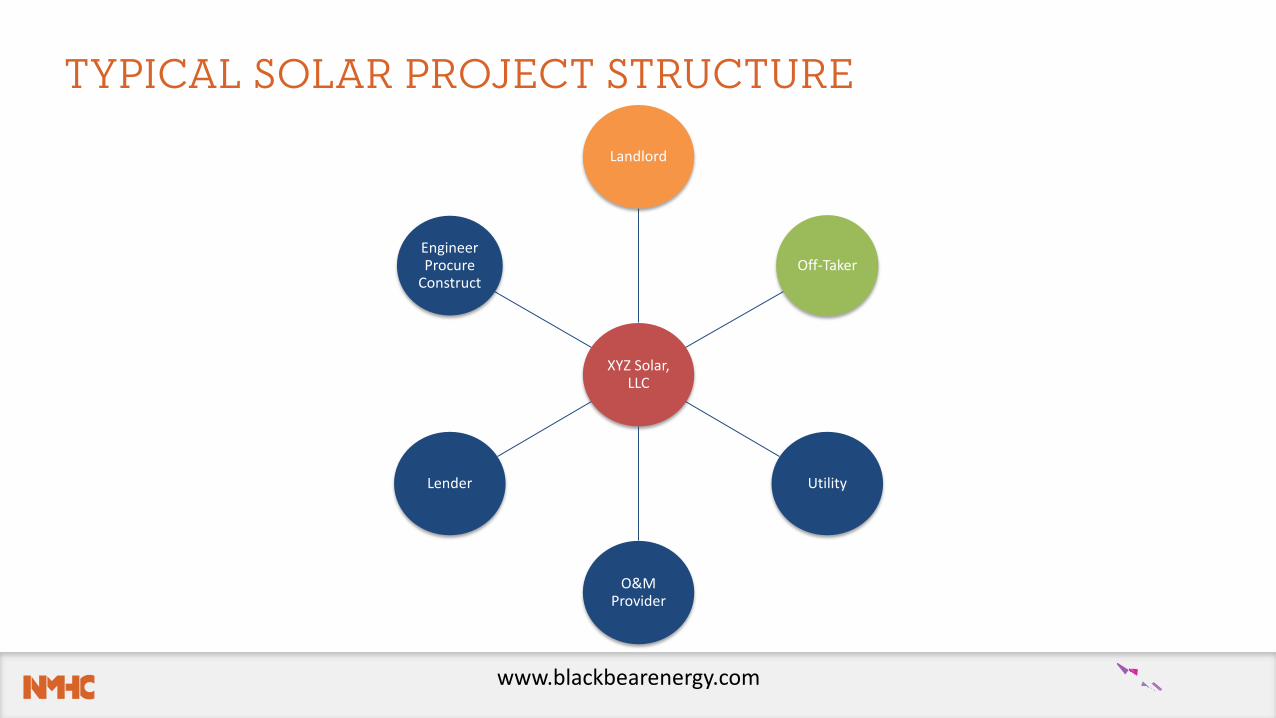
XYZ Solar, LLC
Landlord
Off-Taker
Utility
O&M Provider
Lender
Engineer Procure
Construct
TYPICAL SOLAR PROJECT STRUCTURE

www.blackbearenergy.com
LBA REALTY / STEM CASE STUDY – PARK PLACEEnergy storage system targeting the reduction of peak demand
1.30MW / 2.52 MWh total system size
Installed at 2 locations on Park Place site
Annual Numbers:$91,552 estimated savings$68,664 guaranteed savings$22,888 payment
Provider is STEM (www.STEM.com)
STEM builds, owns & operates the energy storage system
Commercial operation Q4-2016
0
100
0:00 4:00 8:00 12:00 16:00 20:00 24:00
Demand Charge w/ storage
Demand Charge w/o storage
kW
kWh
Demand chargesbased on highest 15-minute peak each month
Energy chargesBased on total amount of energy used

CONTACT INFORMATION
www.blackbearenergy.com
Drew TorbinChief Executive OfficerBlack Bear Energy Inc.1216 Pearl StreetBoulder, CO 80302+1 303 330 7432 (m)[email protected]