Embed Size (px)
Citation preview

What’s a “Good Test?”• Reliability– temporal stability– form equivalency– Internal consistency– rater agreement
• Validity– The test measures what it purports to measure
• Other considerations– Administration, scoring, interpretation

Common usage
• “My boyfriend is reliable. Whenever I need him, he is always there.”– It means that he is trustworthy and dependable.
• “My Toyota is very reliable. I have been driving the vehicle for 8 years and so far no major repair is needed.”– It means it is durable and robust.
• In psychometrics, the meaning of “reliability” is different.

New trend: Reliability and precision
• When a test is said to be reliable, it means that it can yield results that are consistent and stable. But it can be consistently wrong!
• If my scale is not calibrated, everyday it under-reports my weight by 10 pounds (I want this scale). The scale is reliable, but it is imprecise. Two raters may agree with each other, but both can be wrong.
• 2014 Standards for Educational and Psychology Testing (AERA, APA, & NCME): shifted focus from reliability alone to reliability and precision together.

Temporal stability
• This type of reliability utilizes the same form of a test on two or more separate occasions to the same group of examinees (Test-retest).
• On many occasions this approach is not practical because the behaviors of the examinees could be affected by repeated measurements. For example, the examinees might be adaptive to the test format and thus tend to score higher in later tests.
Temporal stability• Test-retest reliability (TRR) is not the same as repeated
measures (RM) that you learned in 362 Research Methods.
• In RM the subjects might be exposed to some treatment. You look for the treatment effect manifested by the test scores and thus you expect changes across time. If the scores are unstable (e.g. Test 5 scores are significantly higher than Test 1 scores), it is good!
• In TRR you look for reliability expressed by temporal stability. If the test scores vary across time, it is bad!
Temporal stability• Test-retest reliability is arguably the most
important concept because all forms of reliability share a common theme: are the data reproducible?
• For more information, please read (optional): Yu, C. H. (2005). Test-retest reliability. In K. Kempf-Leonard (Ed.), Encyclopedia of social measurement, Vol. 3 (pp. 777-784). San Diego, CA: Academic Press.
SD and variance in JMP:
• If the measurement results from the instrument do not vary much, we expect a lower variation.
• The quickest and easiest way (not the best way) to check variability is standard deviation (SD) statistics.
• You can do it in JMP, SPSS, or Excel.• In Excel you can use the function =stdev.s
Application of inter-rater reliability in real life
• The Internet connection at your home is slow. You used www.toast.net to test the download speed to verify that it is really slow. You called the Internet provider and they tested the speed using http://www.speakeasy.net/speedtest/. They insisted that there is nothing wrong at their end. You suspect whether their speed test is reliable or not. What can you do?

In-class activity• Go to www.toast.net• Choose Internet speed test.• Choose F-16 Jets for Test Type and Earthlink
for Web Host. Press Run Test• Repeat the same test three to four times.

In-class activity• Go to
http://www.speakeasy.net/speedtest/
• Select Los Angeles, CA as your location
• Write down the downloaded speed.• Repeat the same test four to five
times.• Compute the SD for both. Which test
has a bigger variability or lower test-retest reliability?

Form equivalence
• This approach requires two different test forms based on the same content (Alternate form).
• It is common to use different versions (forms) to preempt cheating (e.g. students in the morning session “share” the questions with their friends in the evening session) or pattern recognition due to item exposure (e.g. the testees anticipate what will be on the tests based on the past exam patterns).
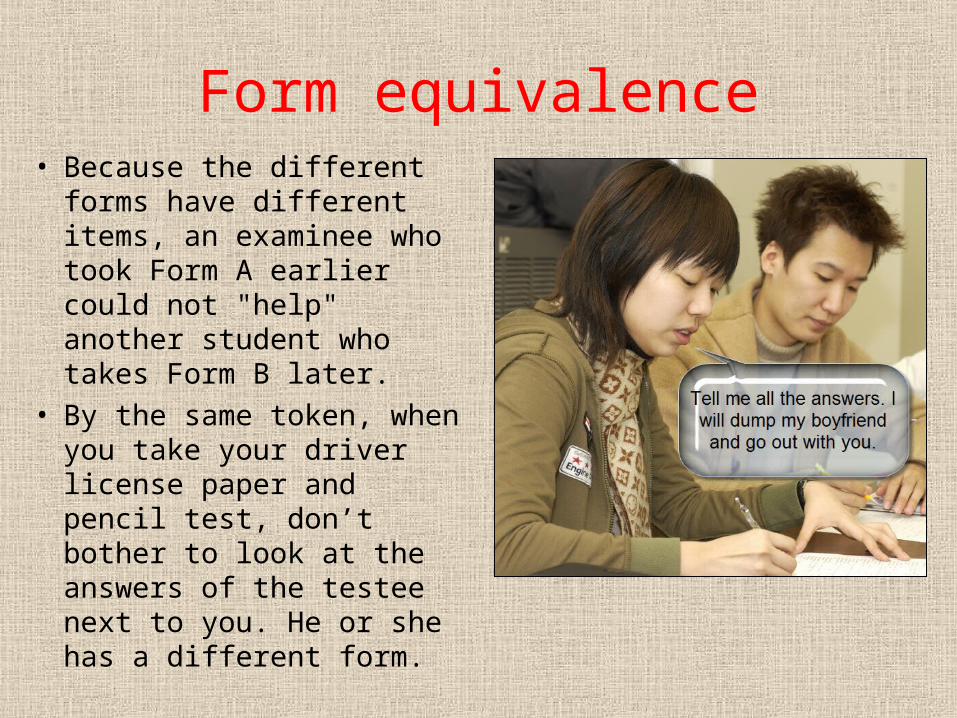
Form equivalence• Because the different forms
have different items, an examinee who took Form A earlier could not "help" another student who takes Form B later.
• By the same token, when you take your driver license paper and pencil test, don’t bother to look at the answers of the testee next to you. He or she has a different form.

Form equivalence
• But how can we know the two forms are equivalent? If one version is easier than the others, it will be unfair to some students.
• The technique to equate two or more forms of the same test is called test equating.
• For more information, please read (optional): Yu, C. H., & Osborn-Popp, S. (2005). Test equating by common items and common subjects: Concepts and applications. Practical Assessment Research and Evaluation, 10. Retrieved from http://pareonline.net/pdf/v10n4.pdf

Cronbach Alpha: Internal consistency
• The key is "internal”: The response patterns of all items should be similar (consistent).
• Cronbach Alpha can be used for both binary (1 or 0) and widely-spread (e.g. 1- 10) data.
• Efficient: It takes one test only while test-retest requires two or more and alternate form needs two or more versions.

What is Cronbach Coefficient Alpha?
• The theory behind it is that the observed score is equal to the true score plus the measurement error (Y = T + E).
• For example, I know 80% of the materials but my score is 85% because of lucky guessing. In this case, my observed score is 85 while my true score is 80. The additional five points are due to the measurement error.
What is Cronbach Coefficient Alpha?
• A reliable test should minimize the measurement error so that the error is not highly correlated with the true score.
• On the other hand, the relationship between true score and observed score should be strong. Cronbach Alpha examines this relationship.

What is Cronbach Coefficient Alpha?
• Two types of Cronbach Alpha:– Raw: based on item
correlation– Standardized: based on
item covariance matrix• What is covariance?– One variable: one
distribution, one variance– Two variables: co-variance
(Mexican hat)
Always check the data accuracy!
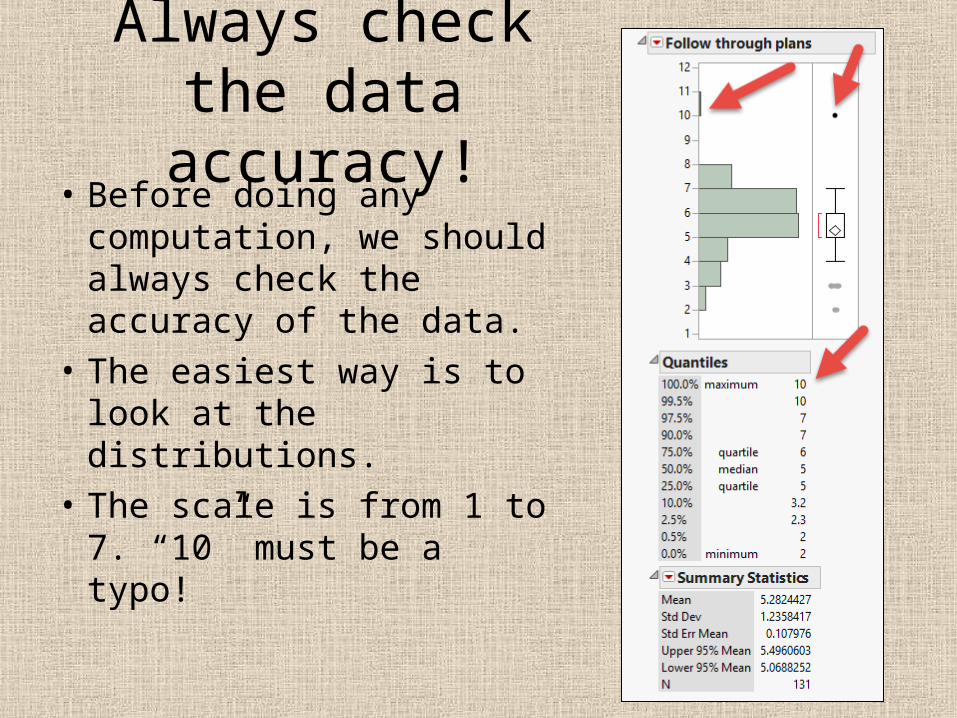
• Before doing any computation, we should always check the accuracy of the data.
• The easiest way is to look at the distributions.
• The scale is from 1 to 7. “10” must be a typo!

Entire set• Cronbach Alpha is about the
entire scale. • There is NO alpha for a single
item.• The number next to each item
tells you: if this column is excluded (excluded Col), how would the alpha be changed?
• This scale is OK, but not great (Cronbach alpha = .7726; .7821)

Remove the bad apple (item)!

Remedies• You need to remove
the item “Handle many things” to make the alpha better.
• Reporting standardized alpha (based on covariance) makes it a bit better.
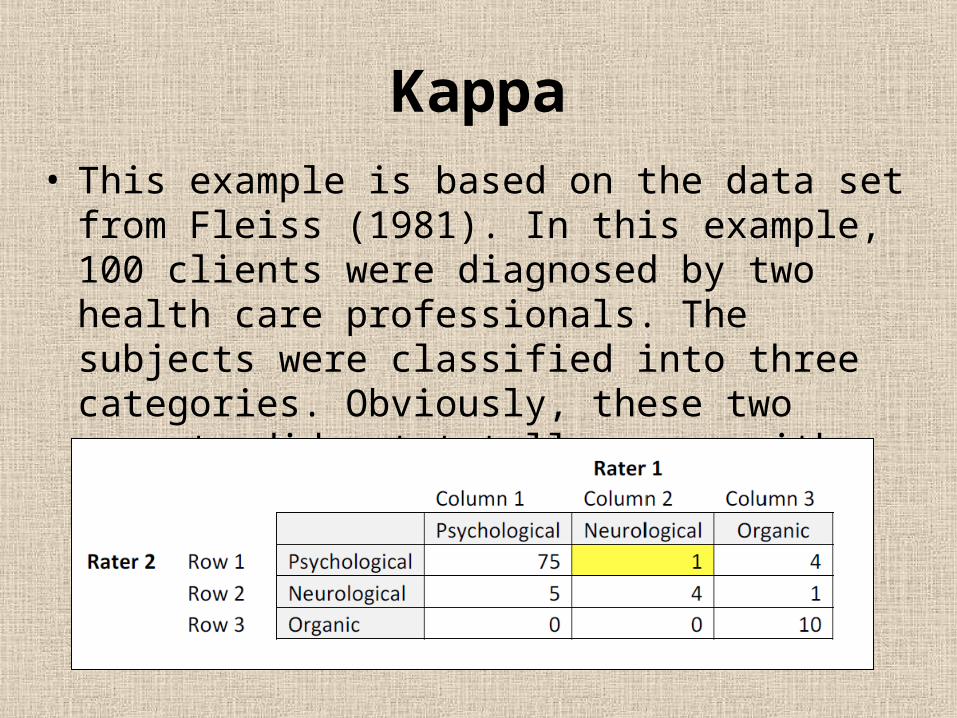
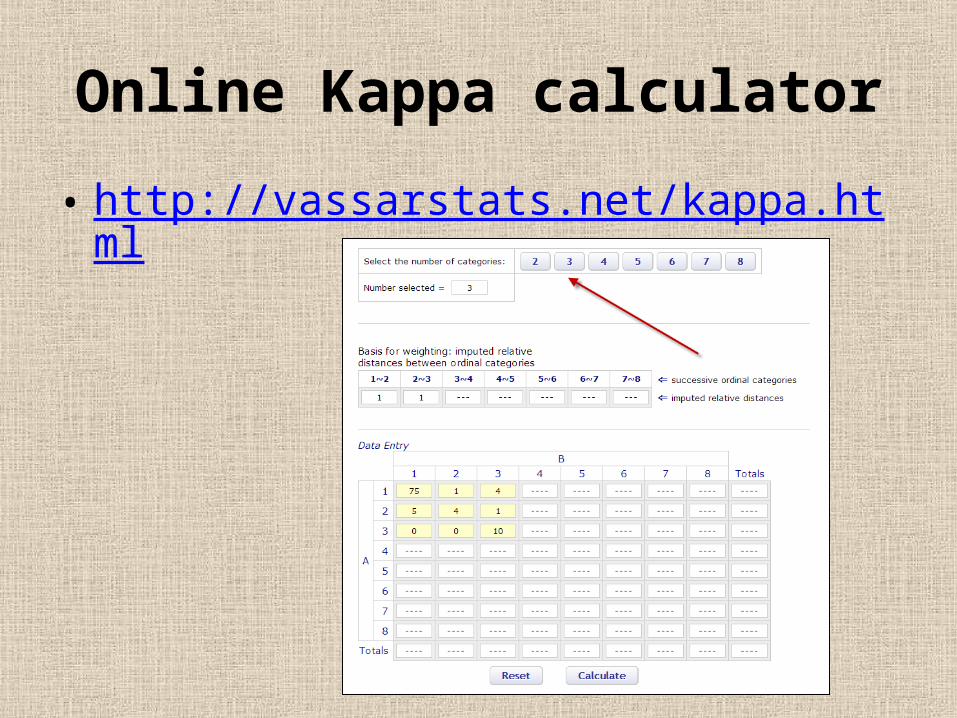
Kappa• This example is based on the data set from Fleiss
(1981). In this example, 100 clients were diagnosed by two health care professionals. The subjects were classified into three categories. Obviously, these two experts did not totally agree with each other.

Kappa output
• If you do not assign weights to different categories, the user can simply report the unweighted Kappa.
• Standard error: you want an unbiased estimator, but there are always bias and errors.
• .95 Confidence interval (the possible range in the population)

JMP
• A photo contest is flooded by many entries. In response to this, the contest organizer hired two photographers (Ansel Adams Junior and Chong Ho Yu) to conduct the first round of screening.


In-class activity
• Pair with a classmate. It is an honor that both of you are hired by National Geographic to serve on a panel.
• Look at twenty photos on the screen. Each of you can give either “I” (in) or “O” (out) to each entry.
• Enter the data in JMP. Make sure that the variable is nominal.• Use Fit Y by X to run a Chi-square analysis. It doesn‘t matter
which rater is X and which one is Y.• Compute the Kappa coefficient by choosing Agreement
Statistics. Do you and your peer tend to agree with each other?

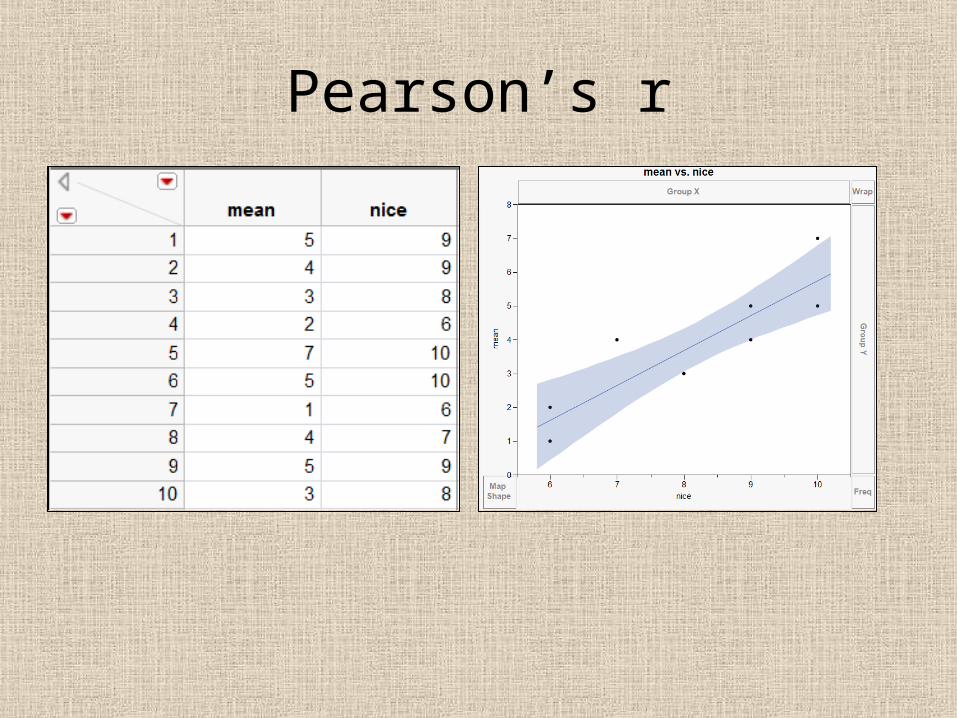
Pearson’s r• After the first screening, now the two judges
assign a score between 1 and 10 to each photo, where 1 is the worst and 10 is the best.
• These are Continuous scale data. Use Pearson’s r, of course.
• Sometimes the coefficient alone might be misleading. If I tell you that the Pearson’s r of Rater A’s scores and Rater B’s scores is .8797, what will be your natural response?

Pearson’s r• You may say, “Wow! High coefficient! The two
raters tend to ‘agree’ with each other. We can trust the panel.”
• You may even go further to say, “If the two raters ‘agree’ with each other, using two raters are redundant. To make it cost-effective, we should hire one of them only.”
Pearson’s r

No variance• Pearson’s r is based on continuous scaled-data. If
the data are ordinal (e.g. Likert scale), it should be widely spread (1-10).
• However, in many contests the participants are the best of the best. The scores may concentrate on the high end (e.g. 8, 9, 10 on a 10-point scale) and thus the distribution is skew. When you look at the scatterplot, the data points do not scatter at all.
• No variance nothing you can do; little variance not much you can do

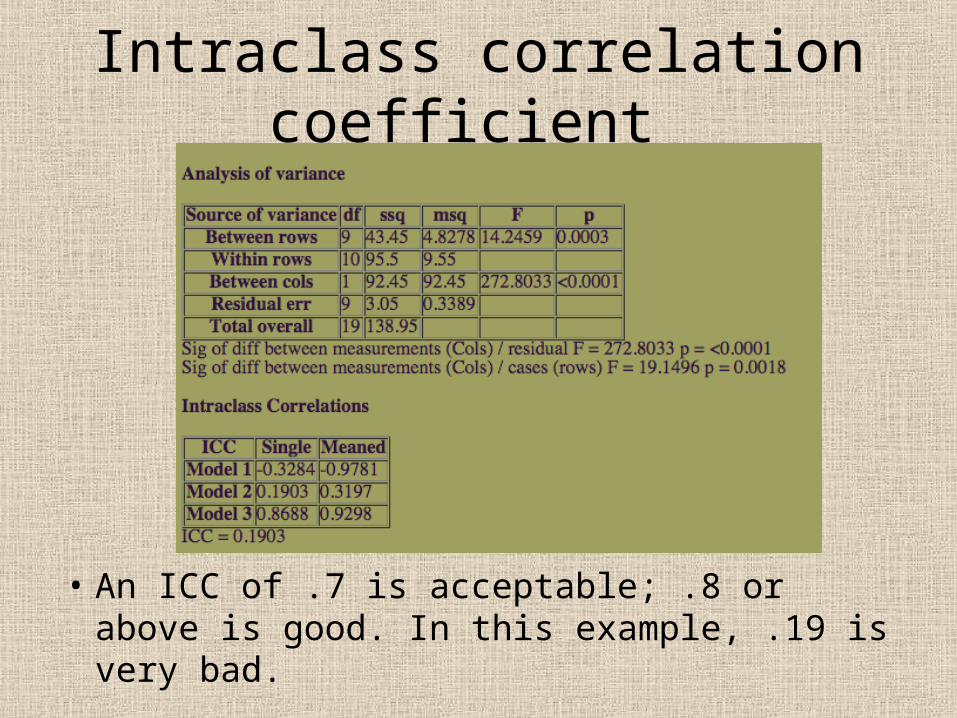
Intraclass correlation coefficient • One way to overcome the limitation of
Pearson’s r is Intraclass correlation coefficient (ICC).
• You can compute ICC using JMP, SPSS, or an online calculator: https://www.statstodo.com/ICC_Pgm.php
• The easiest way is the online calculator.• Another advantage of ICC is: it can handle
more than two judges or raters!
Intraclass correlation coefficient
• An ICC of .7 is acceptable; .8 or above is good. In this example, .19 is very bad.