Embed Size (px)
Citation preview

What’s New

What's New in GRAITEC Advance PowerPack 2020
3
Table of contents
WORKTRACKER………………………………………………………… ...................................... 4 File configuration ................................................................................................................................... 5
Global configuration ........................................................................................................................... 6 Files .................................................................................................................................................... 6 Projects .............................................................................................................................................. 6 User interface ..................................................................................................................................... 7
Synchronization ..................................................................................................................................... 7 Server type ......................................................................................................................................... 8 Test Connection ................................................................................................................................. 9
Report .................................................................................................................................................... 9 Excel file ........................................................................................................................................... 10 Results per project ........................................................................................................................... 11
Results per project ............................................................................................................................... 13 Per project ........................................................................................................................................ 13 For user per project .......................................................................................................................... 14
Results per file ..................................................................................................................................... 15 Per file .............................................................................................................................................. 15 For project per file ............................................................................................................................ 16 For user per file ................................................................................................................................ 17
Results per user................................................................................................................................... 18 Per user ............................................................................................................................................ 18 For project per user .......................................................................................................................... 19 For file per user ................................................................................................................................ 20
Sessions .............................................................................................................................................. 21 Events .................................................................................................................................................. 21
BIM CONNECT IMPROVEMENTS ........................................................................................ 22 Import of theoretical reinforcement ...................................................................................................... 22 Import and export torsors and of groups of walls ................................................................................ 22

What's New in GRAITEC Advance PowerPack 2020
4
WORKTRACKER GRAITEC PowerPack for Revit® 2020 presents “Work Tracker”, a new powerful feature which enables users to have better control while working in Revit®. This tool allows the registering of time spent by users while working on individual Revit files.
The main window can be divided into two parts, which are shown below:
• control panel • results browser
Figure 1 - Work Tracker main window
The control panel manages different Work Tracker options. The results browser, on the other hand, shows the different results. Each functionality will be detailed further in this document.
The Work Tracker uses events to control the user’s actions in the project. These events can be:
• Every action that is done or undone on a document (actions that are visible in Revit Undo menu); • Switching active view; • Opening/saving/closing document; • Synchronizing local files with central files.
Each event has an associated date and time, what allows for tracking of the data associated to them.

What's New in GRAITEC Advance PowerPack 2020
5
File configuration
The time between two consecutive events is considered as working time if it is less than Max idle time. This parameter is set for each Revit file individually and can be set at any point in time.
Figure 2 - Definition of maximum idle time
The notion of working time is important to the concepts of session and events. A session is defined as a group of events, in which the time between each consecutive event is smaller than Max idle time. This tool demands the assignment of a unique project to the file. The projects can be created in the Global Configuration window, which is detailed later in this document.
Figure 3 - Project assignment
Finally, the user can choose the period in which he wants the events to be stored in the local disc. Since a user can generate up to about 28 800 events per day and thus generate heavy files, there’s the possibility to keep only the newest events on the local disc. The most important database is called Main, where the rest of the data is stored.
Figure 4 – Store events on local disc

What's New in GRAITEC Advance PowerPack 2020
6
Global configuration
In Global configuration window a User can:
• Manage all tracked Revit files, without opening them; • Manage all defined projects; • Adjust user interface; • Set up synchronization.
Files
A user can edit each file individually (file configuration).
Figure 5 – Control panel – Global configuration – Files
Projects
A project is an optional and abstract unit that allows you to group Revit files and to see aggregated statistics for them. Every file can be associated with only one project.
Figure 6 - Control panel - Global configuration – Projects
Figure 7 - Control panel - Global configuration – Projects – Add new project

What's New in GRAITEC Advance PowerPack 2020
7
User interface
This functionality defines the format of time display.
Figure 8 - Control panel - Global configuration - User interface
Synchronization
The Work Tracker data synchronization is independent of the Revit model synchronization and needs to be set up individually in order to work. Furthermore, a user needs to keep a valid connection (in Work Tracker) to the database (SQLite or SQL), in order to see other user data.
In this window, it is necessary to define the server type and the synchronization frequency.
Figure 9 - Control panel - Global configuration – Synchronization

What's New in GRAITEC Advance PowerPack 2020
8
There are two types of synchronization available:
• Automatic
If the user wants the synchronization to be automatic, it is possible to choose an automatic synchronization frequency. This background synchronization is easily done and does not interfere with working with a model in Revit. If network errors occur and cause the automatic synchronization process to fail, the following synchronization will start from the point where synchronization was interrupted previously.
• Manual
For manual synchronizations, it is necessary to define “Never” in the Synchronization Frequency Tab and then synchronize directly in the main window. This tool allows the user to manually synchronize the project, whenever he wants. The database source must be defined previously.
Server type
The synchronization can be done with the SQLite Database file, or SQL Server, which can be selected in the Server type tab.
• SQLite
SQL Lite is a database file, so in order to make the synchronization work, it is necessary to create a shared location on the network storage where all users have access to read and write..
If an SQLite database file already exists, the user can upload it using Button 1, as shown below in the picture. Otherwise, if the SQLite database file does not exist, it is possible to use Button 2 to create it on the network storage.
Figure 10 - Control panel - Global configuration – Synchronization

What's New in GRAITEC Advance PowerPack 2020
9
• SQLServer
In this scenario, the user must have a working instance of SQL Server. The database is created automatically by Work Tracker on the server. Therefore, it is important that the user is assigned permission to create SQL objects on the server.
Figure 10 - Control panel - Global configuration – Synchronization
Test Connection
After filling all the necessary information to establish a connection, it is important to Test if the connection is working. If the connection is not valid, synchronization will fail.
Figure 11 - Control panel - Global configuration – Synchronization
Report
The data visible in the tables can be exported to an Excel file (.xlsx). Microsoft Excel does not have to be installed for this tool to work.
It is possible to choose the content of the tables reported, as well as the location of the file.

What's New in GRAITEC Advance PowerPack 2020
10
Figure12 - Report window
The file generated by Work Tracker looks like the Figure shown below.
Figure 13 - Report - Results per project - Excel file

What's New in GRAITEC Advance PowerPack 2020
11
Results per project
The results of the events’ tracking can be displayed in many ways: per project, per user and per file.
Figure 14 – Results browser
The timespan of events can be selected according to the options below. The user can also directly choose the dates concerned.
Figure 15 – The options to select the timespan of events
The graphics are shown in the form of histograms, such as per the example below.
Figure 16 – The graphics in the form of histograms
What's New in GRAITEC Advance PowerPack 2020
12
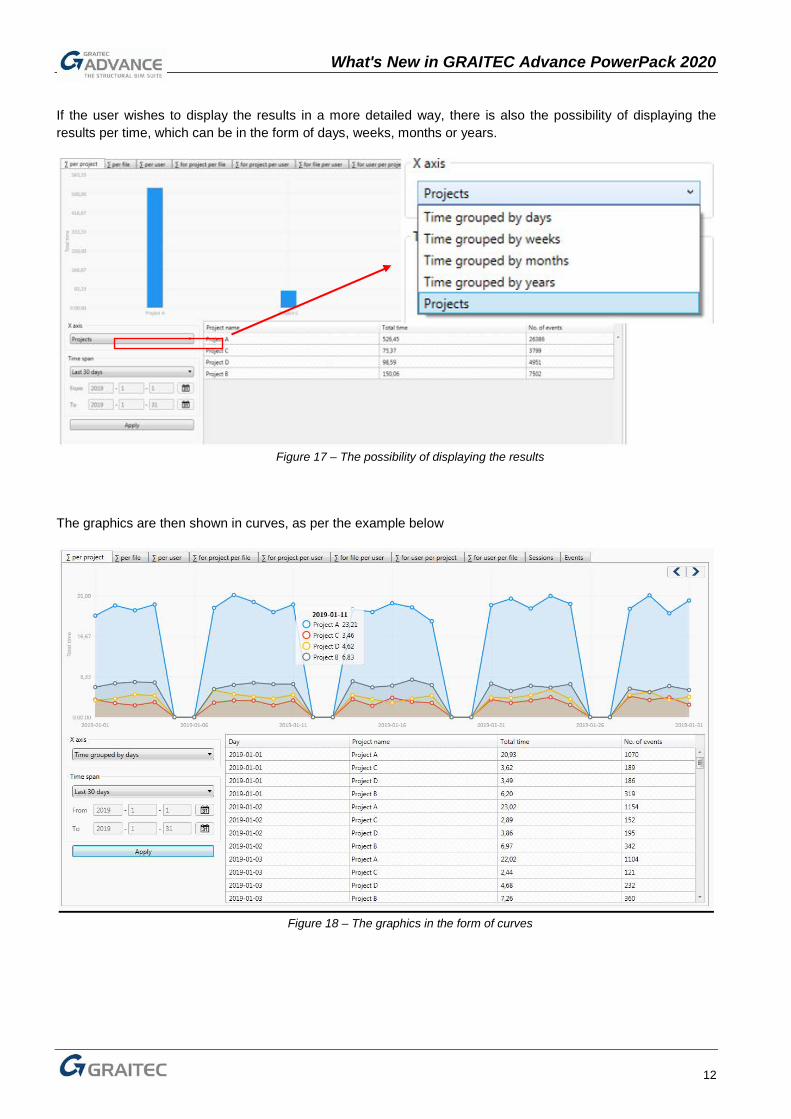
If the user wishes to display the results in a more detailed way, there is also the possibility of displaying the results per time, which can be in the form of days, weeks, months or years.
Figure 17 – The possibility of displaying the results
The graphics are then shown in curves, as per the example below
Figure 18 – The graphics in the form of curves

What's New in GRAITEC Advance PowerPack 2020
13
Results per project
Per project
This view shows aggregated time for every project in the selected Time span.
Figure 19 – Main view the graphics per project
This view shows in detail the allocated time for every project in the selected Time span, based on different criteria (e.g. time grouped by days).
Figure 20 – Main view the graphics per project
What's New in GRAITEC Advance PowerPack 2020
14
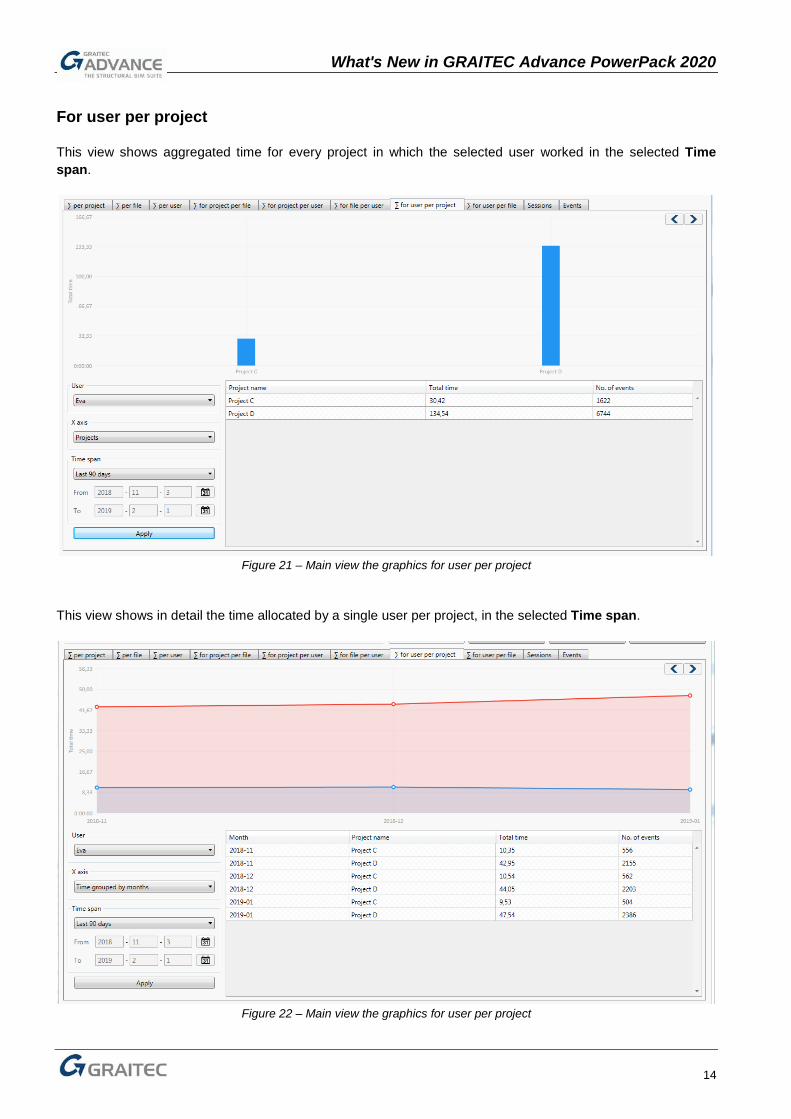
For user per project
This view shows aggregated time for every project in which the selected user worked in the selected Time span.
Figure 21 – Main view the graphics for user per project
This view shows in detail the time allocated by a single user per project, in the selected Time span.
Figure 22 – Main view the graphics for user per project
What's New in GRAITEC Advance PowerPack 2020
15
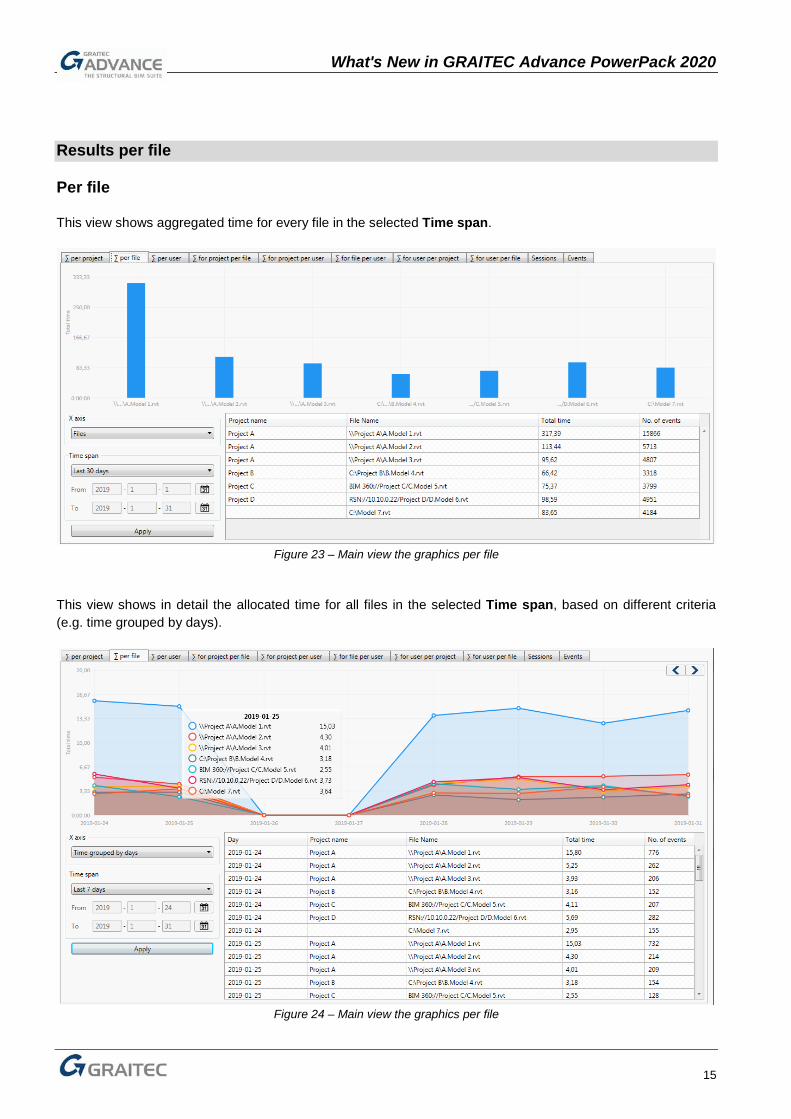
Results per file
Per file
This view shows aggregated time for every file in the selected Time span.
Figure 23 – Main view the graphics per file
This view shows in detail the allocated time for all files in the selected Time span, based on different criteria (e.g. time grouped by days).
Figure 24 – Main view the graphics per file

What's New in GRAITEC Advance PowerPack 2020
16
For project per file
This view shows aggregated time for every file comprised in the selected project, in the selected Time span.
Figure 25 – Main view the graphics for project per file
This view shows in detail the allocated time for every file comprised in the selected project, in the selected Time span.
Figure 26 – Main view - the graphics for project per file

What's New in GRAITEC Advance PowerPack 2020
17
For user per file
This view shows aggregated time for every file within a project, on which the selected user worked in the selected Time Span.
Figure 27 – Main view - the graphics for user per file
This view shows in detail the time allocated by a single user for every file within a project, in the selected Time span.
Figure 28 – Main view the graphics for user per file

What's New in GRAITEC Advance PowerPack 2020
18
Results per user
Per user
This view shows aggregated time for every user in the selected Timespan.
Figure 29 – Main view the graphics per user
This view shows in detail the allocated time per user, in the selected Timespan.
Figure 30 – Main view the graphics per user

What's New in GRAITEC Advance PowerPack 2020
19
For project per user
This view shows aggregated time for all users involved in a certain project, in the selected Timespan.
Figure 31 – Main view the graphics for project per user
This view shows in detail the total time spent by all users involved in a certain project, in the selected Timespan.
Figure 32 – Main view the graphics for project per user
What's New in GRAITEC Advance PowerPack 2020
20
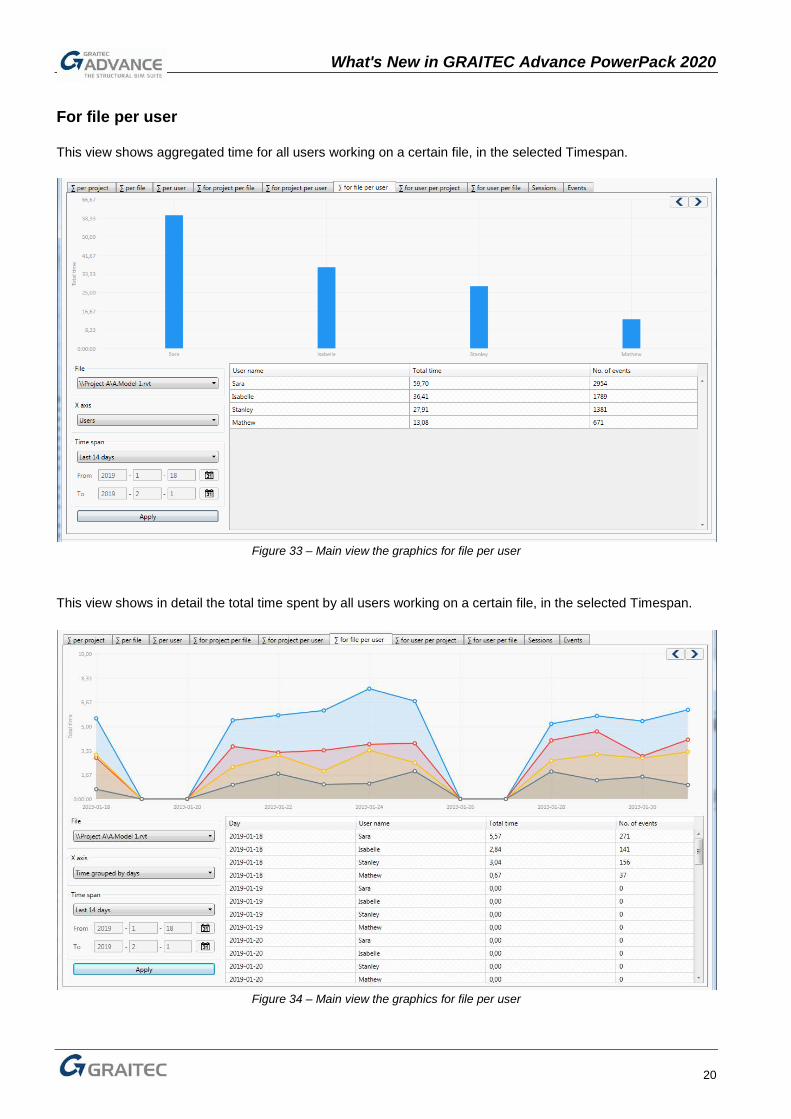
For file per user
This view shows aggregated time for all users working on a certain file, in the selected Timespan.
Figure 33 – Main view the graphics for file per user
This view shows in detail the total time spent by all users working on a certain file, in the selected Timespan.
Figure 34 – Main view the graphics for file per user
What's New in GRAITEC Advance PowerPack 2020
21
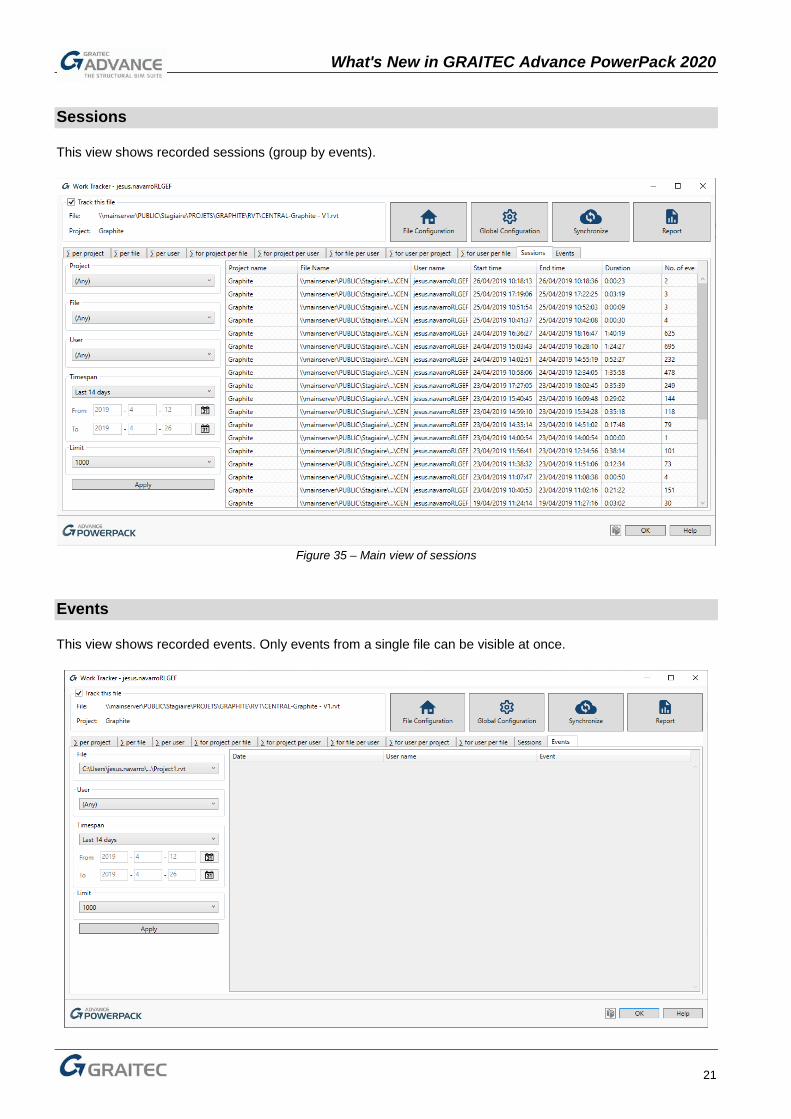
Sessions
This view shows recorded sessions (group by events).
Figure 35 – Main view of sessions
Events
This view shows recorded events. Only events from a single file can be visible at once.

What's New in GRAITEC Advance PowerPack 2020
22
BIM CONNECT IMPROVEMENTS Import of theoretical reinforcement
BIM Connect is now able to import a results package for theoretical reinforcement coming from a FEM package for surface elements. So, these results are available for slabs and floors.
The results are stored in a package and visible in the Result manager from Revit.
Results are available for BIM Designers through the Import Analysis results dialog.
Import and export resultant forces and of groups of walls
The BIM connect is now able to embed resultant forces values (top and bottom) for shear walls and groups of shear walls.