Embed Size (px)
Citation preview

FEATURE
What to expect when you’re expecting … a recession
Daniel Bachman
2
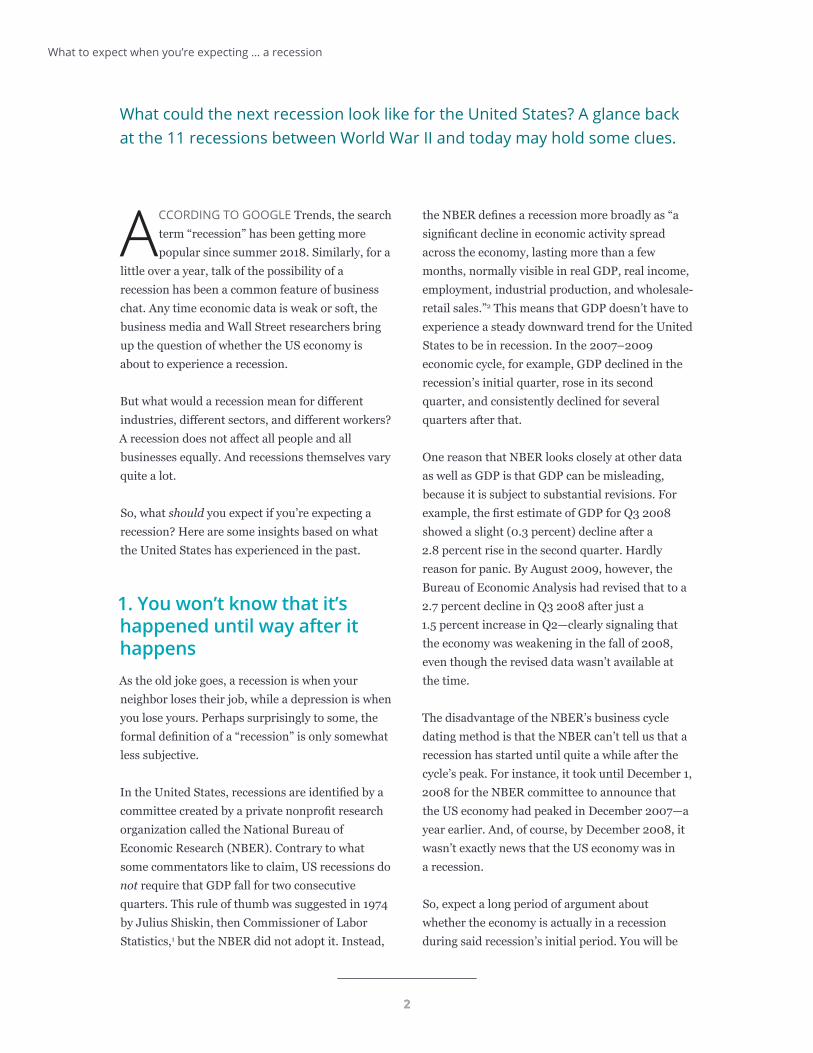
ACCORDING TO GOOGLE Trends, the search term “recession” has been getting more popular since summer 2018. Similarly, for a
little over a year, talk of the possibility of a recession has been a common feature of business chat. Any time economic data is weak or soft, the business media and Wall Street researchers bring up the question of whether the US economy is about to experience a recession.
But what would a recession mean for different industries, different sectors, and different workers? A recession does not affect all people and all businesses equally. And recessions themselves vary quite a lot.
So, what should you expect if you’re expecting a recession? Here are some insights based on what the United States has experienced in the past.
1. You won’t know that it’s happened until way after it happensAs the old joke goes, a recession is when your neighbor loses their job, while a depression is when you lose yours. Perhaps surprisingly to some, the formal definition of a “recession” is only somewhat less subjective.
In the United States, recessions are identified by a committee created by a private nonprofit research organization called the National Bureau of Economic Research (NBER). Contrary to what some commentators like to claim, US recessions do not require that GDP fall for two consecutive quarters. This rule of thumb was suggested in 1974 by Julius Shiskin, then Commissioner of Labor Statistics,1 but the NBER did not adopt it. Instead,
the NBER defines a recession more broadly as “a significant decline in economic activity spread across the economy, lasting more than a few months, normally visible in real GDP, real income, employment, industrial production, and wholesale-retail sales.”2 This means that GDP doesn’t have to experience a steady downward trend for the United States to be in recession. In the 2007–2009 economic cycle, for example, GDP declined in the recession’s initial quarter, rose in its second quarter, and consistently declined for several quarters after that.
One reason that NBER looks closely at other data as well as GDP is that GDP can be misleading, because it is subject to substantial revisions. For example, the first estimate of GDP for Q3 2008 showed a slight (0.3 percent) decline after a 2.8 percent rise in the second quarter. Hardly reason for panic. By August 2009, however, the Bureau of Economic Analysis had revised that to a 2.7 percent decline in Q3 2008 after just a 1.5 percent increase in Q2—clearly signaling that the economy was weakening in the fall of 2008, even though the revised data wasn’t available at the time.
The disadvantage of the NBER’s business cycle dating method is that the NBER can’t tell us that a recession has started until quite a while after the cycle’s peak. For instance, it took until December 1, 2008 for the NBER committee to announce that the US economy had peaked in December 2007—a year earlier. And, of course, by December 2008, it wasn’t exactly news that the US economy was in a recession.
So, expect a long period of argument about whether the economy is actually in a recession during said recession’s initial period. You will be
What could the next recession look like for the United States? A glance back at the 11 recessions between World War II and today may hold some clues.
What to expect when you’re expecting … a recession
2

3
FIGURE 1
US business cycles last an average of about 11 months
0
2
4
6
8
10
12
14
16
18
20
1980 1957 1990 2001 1953 1960 1948 1969 1973 1981 2007
Postwar US business cycles, in months
68 8 8
10 1011 11
16 16
18
Average: 11 months
Source: National Bureau of Economic Research via Haver Analytics.
Deloitte Insights | deloitte.com/insights
hard-pressed to know that the recession has started. But take what comfort you can from the fact that the distinguished NBER economists who will eventually make the call are in the same position.
2. The recession, when it comes, will probably last about a yearPost–World War II, the United States’ economic cycles, from the peak (the month when activity reaches its highest level and begins to fall) to the trough (when activity stops falling and expansion starts again), have averaged about 11 months in length. This average figure masks variation, of course: The 1980 recession lasted only six months, while the 2007–2009 recession went on for 18 months before the economy finally started expanding again. The length of the next recession will depend greatly on what causes it and how policymakers respond; based on what we have seen
in the past, it is very unlikely to be shorter than six months or longer than two years (figure 1).
3. In an average recession, GDP falls by about 2 percent
Whether or not the decline occurs in two consecutive quarters, GDP invariably falls substantially during a recession. Figure 2 shows the decline in GDP associated with each of the United States’ post–World War II recessions—even if the timing of the decline doesn’t exactly line up with the NBER’s reference period. In all of these recessions except one, the 2001 recession, GDP fell by at least 1 percent; the average decline works out to about 2.1 percent. That said, recessions vary a great deal. The most recent recession saw the largest drop in GDP; at 4 percent, this decline was almost twice the average. The short but sharp 1957 recession also saw a dramatic 3.6 percent drop in GDP.
What to expect when you’re expecting … a recession
3

4
FIGURE 2
GDP has declined by an average of about 2 percent across all postwar recessions
–4.5%
–4.0%
–3.5%
–3.0%
–2.5%
–2.0%
–1.5%
–1.0%
–0.5%
0.0%Q4 1948 Q2 1953 Q3 1957 Q2 1960 Q4 1969 Q4 1973 Q1 1980 Q3 1981 Q3 1990 Q1 2001 Q4 2007
GDP declines in post–World War II US recessions, percent
–1.5
–2.5
–3.6
–1.3–1.1
–2.6
–1.4
–0.4
–4.0
–2.3 –2.2
Average: -2.1 percent
Source: US Bureau of Economic Analysis via Haver Analytics.
Deloitte Insights | deloitte.com/insights
What to expect when you’re expecting … a recession
4

5
4. Goods sectors, especially durable goods, will experience the greatest impactA drop in GDP is not felt evenly across industries and consumers. Some GDP spending categories are more sensitive to a downturn than others (figure 3).
Residential investment is the most cyclical spending category, and has, in fact, led the downturn in many recessions. Exports, consumer durables, and business investment also fall substantially during a recession. It’s not hard to see
why: These are precisely the types of expenditures that businesses and consumers can delay if money is tight.
One caveat to the numbers shown in figure 3 is that while the average decline in federal purchases of goods and services during recessions looks fairly dramatic, only three of the last 11 recessions actually saw declines (albeit very large ones) in this area. In all three cases, cuts in defense spending accounted for the majority of the decline: in 1948 after World War II, in 1953 after the end of the Korean conflict, and in 1969 during the US
FIGURE 3
The goods sector will likely suffer the greatest impact from the next recession
Average maximum decline in main GDP expenditure categories across all post–World War II recessions, percent
Source: US Bureau of Labor Statistics via Haver Analytics.
Deloitte Insights | deloitte.com/insights
–22.6%
–13.5%
–9.2%
–9.2%
–9.2%
–9.2%
–2.1%
–1.3%
–1.2%
–25.0%–20.0%–15.0%–10.0%-5.0%0.0%
Residential investment
Exports
Consumer durable goods
Imports
Nonresidential investment
Federal spending
GDP
Consumer nondurable goods
State and local spending
Consumer services–0.4%
What to expect when you’re expecting … a recession
5

6
disengagement and drawdown of troops from Vietnam. This goes to show that postwar periods can be perilous for the economy, as it takes time for other spending to replace defense production. However, federal purchases have not declined during a recession since 1980, reflecting perhaps the differing nature of more recent wars.
Not surprisingly, spending on consumer nondurables and services tends to drop quite a bit less than GDP. That’s because consumers can’t put off food or housing services purchases as easily as they can put off purchases of cars or furniture.
5. A few million people will lose their jobs
The 2007–2009 recession saw US employment decline by almost 8 million, or 5.7 percent, from peak employment. In the 2001 recession—which was relatively mild—employment declined by more than 2 million, or just 1.6 percent, from peak employment. That’s a fairly large variation, especially for people whose jobs are at stake.
As employment drops, the unemployment rate will correspondingly rise. On average, the unemployment rate has risen 2.7 percentage points over the course of postwar US recessions. This suggests that an average recession today, given the United States’ 3.5 percent unemployment rate as of September 2019, would see unemployment eventually rise to about 6 percent.
6. Less-educated workers will suffer more than more highly educated workersAs figure 5 shows, more highly educated workers have lower unemployment rates than their less-educated colleagues at all points in the business cycle. But beyond that, less-educated workers are disproportionately more likely to become unemployed during a recession. In the most recent recession, for instance, the unemployment rate for those with less than a high school education jumped from a low of 5.8 percent about a year before the recession to a high of 15.8 percent—an increase of 10 percentage points. In contrast, the unemployment rate for workers who had
FIGURE 4
Recessions since World War II have had varying effects on employment
US employment decreases in post–World War II recessions as a percentage of peak employment
–6%
–5%
–4%
–3%
–2%
–1%
0%
Q4 1948 Q2 1953 Q3 1957 Q2 1960 Q4 1969 Q4 1973 Q1 1980 Q3 1981 Q3 1990 Q4 2007Q1 2001
–3.6
–2.6
–3.6
–1.4–0.7
–2.0
–0.2
–2.8
–1.3
Source: US Bureau of Labor Statistics via Haver Analytics.
Deloitte Insights | deloitte.com/insights
–1.6
–5.7
What to expect when you’re expecting … a recession
6

7
completed college rose from a low of 1.8 percent to a high of 5 percent over the same period, an increase of only 3.2 percentage points.
7. Some industries will be hit very hard by the recession. Other industries will hardly feel it
Whether you feel the recession—as a worker or as a business—depends on what you do. Some industries feel recessions strongly, while others hardly notice.
Figure 6 shows the average decline in US employment by industry during postwar recessions (when declines in employment occurred). However, the figure understates the potential impact of the average recession on mining, since two recessions
saw continued increases in mining employment right through the downtown. These were the recessions of 1973–1975, when high oil prices encouraged domestic exploration, drilling, and production, and 2007–2009, which coincided with the beginning of the tight oil/fracking boom. The lesson is that a recession’s impact on any particular industry may depend a great deal on the recession’s specific causes.
It’s not surprising that mining, manufacturing, and construction are very cyclical. But federal government employment also shows surprising sensitivity to the business cycle. Cause and effect may be confused here, particularly since the federal government’s average employment decline over the last 11 recessions is inflated by the very large employment decreases associated with the defense drawdowns in 1948 and 1953. However, every recession except for the 1973–1975 recession saw a decline in federal employment, with the most
FIGURE 5
Less-educated workers are more likely to become unemployed during recessions Recession Less than high school High school diploma Less than bachelor's Bachelor's and higher
Source: US Bureau of Labor Statistics via Haver Analytics. Deloitte Insights | deloitte.com/insights
0
5
10
15
Jan 92
Jan 93
Jan 94
Jan 95
Jan 96
Jan 97
Jan 98
Jan 99
Jan 00
Jan 01
Jan 02
Jan 03
Jan 04
Jan 05
Jan 06
Jan 07
Jan 08
Jan 09
Jan 10
Jan 11
Jan 12
Jan 13
Jan 14
Jan 15
Jan 16
Jan 17
Jan 18
Jan 19
Unemployment by education attainment, percent
What to expect when you’re expecting … a recession
7

8
recent two recessions witnessing federal employment decreases of just under 4 percent each time.
The “safest” industry to be in during a recession is therefore not the government. Rather, the most
“recession-proof” jobs appear to be in private education and health services (EHS). EHS employment has not decreased during a recession since 1970. In fact, EHS employment declined in
just three of the United States’ 11 postwar recessions, and even in those three, the declines were small. The industry’s performance in the 2007–2009 recession was particularly impressive, considering that every other industry except mining experienced sizable employment decreases.3 During that recession, service industries such as information (down 12.9 percent), professional services (down 9 percent), and leisure and hospitality (down 4.3 percent) were hit hard,
FIGURE 6
Education and health services appears to offer the most job security in a recession
Source: US Bureau of Labor Statistics via Haver Analytics. Deloitte Insights | deloitte.com/insights
13%
11%
10%
6%
6%
3%
3%
2%
2%
1%
1%
1%
1%
0% 2% 4% 6% 8% 10% 12% 14%
Mining and logging
Manufacturing
Construction
Information services
Federal government
Trade, transportation, and utilities
Financial activities
Professional and business services
Local government
Leisure and hospitality
State government
Other services
Education and health services
Average employment declines by industry in recessions since World War II, percent decline from maximum at cycle peak
What to expect when you’re expecting … a recession

9
but EHS—dominated by health care—created jobs almost every month.4 Granted, a large portion of the health care industry’s revenue comes from federal government programs—which typically continue through recessions—but notably, the large drop in overall employment (and, therefore, private health insurance coverage) did not affect the sector more strongly.
8. Corporate profits will swing much more than total labor compensation paymentsWith millions more people out of work during the next recession, total wages paid out will also decrease. However, the impact on corporate profits will likely be much larger. As figure 7 shows, corporate profits fall much more than wages do, percentagewise, during recessions. The average maximum four-quarter decline in corporate profits is almost 20 percent, while it’s just 1.9 percent for wages.
These large decreases in profits (and their typically fast recovery) explains why the stock market is so
attuned to the possibility of a recession; when it comes, shareholders can expect a roller-coaster ride. The bad news, of course, is the big hit to profits. The good news (for corporations) is that recoveries always follow recessions, and profits will jump when the recovery comes.
9. The trade balance will probably improve as demand for imports fallsDon’t count on it, though. As figure 8 shows, while most recessions are accompanied by an increase in the trade surplus (or decrease in the deficit), the magnitude varies wildly—from relatively small (a 0.4 percentage point of GDP in 1973 and 2001) to large (2.4 percentage points in 2007 and 1.5 percentage points during the relatively mild 1980 recession). And sometimes the trade balance worsens, as it did in 1957 and 1981.
The main reason that the trade balance usually improves during a recession is because US imports are very sensitive to consumption. Simple statistical analysis suggests that, on average,
FIGURE 7
Corporate profits decrease much more, percentage-wise, than wages during a recession Recession Corporate profits Labor compensation
Source: US Bureau of Labor Statistics via Haver Analytics. Deloitte Insights | deloitte.com/insights
–40%–30%–20%–10%
0%10%20%30%40%50%60%
Q1 1948
Q1 1952
Q1 1956
Q1 1960
Q1 964
Q1 1968
Q1 1972
1Q1 976
Q1 1980
Q1 1984
Q1 1988
Q1 1992
Q1 1996
Q1 2000
2Q1 2004
Q1 2008
Q1 2012
Q1 2016
Changes in US corporate profits and labor compensation, year-over-year percent change
What to expect when you’re expecting … a recession

10
import volume is likely to fall about twice as much as domestic demand.5 Imports are, after all, heavily oriented toward goods—in particular, durable and capital goods. These are precisely the categories that are most sensitive to the business cycle. The caveat here, however, is that export volume may fall by more than import volume if US trading partners are suffering as well.
What happens to the trade balance will also depend on the exchange rate. The 2007 recession, for example, saw significant dollar appreciation as global investors bought relatively safe US assets, which hit US exports quite hard. Similar rushes to invest in the United States did not occur in other recessions, leaving the trade balance relatively unaffected.
This is one reason why economists don’t use the state of the current account as a measure of the US economy’s health. It’s precisely when the US economy is sick that the current account deficit improves!
10. Productivity will fall during the recession, then soar during early recovery—maybeGrowth in output per hour—labor productivity—drops dramatically when recessions happen. Sometimes, it even falls for a significant period, as it did in the oil-shock recessions of the 1970s and early 1980s (figure 9). However, it remains to be seen whether this will be the case in the next recession. Historically, many economists assumed that slowing (or negative) productivity growth reflected businesses’ desire to keep workers on the payroll to avoid the cost of rehiring and training workers during the recovery.6 But while firms were more willing to do this in the 1970s, perhaps because managers misread the depth of the recessions, businesses today are more “nimble” and more ready to lay workers off. If employers react quickly to a recession with widespread layoffs, productivity growth, which is already currently low compared to the postwar average, may not fall that
FIGURE 8
The US trade balance has improved in most of the postwar recessions
Source: US Bureau of Labor Statistics via Haver Analytics. Deloitte Insights | deloitte.com/insights
Change in net export share of GDP, peak to trough, percentage points
0.41%
–0.76%
0.45%
–0.02%
0.41%
1.48%
–0.64%
0.47% 0.39%
2.43%
–1.0%
–0.5%
0.0%
0.5%
1.0%
1.5%
2.0%
2.5%
3.0%
1954 1957 1960 1969 1973 1980 1981 1991 2001 2007
What to expect when you’re expecting … a recession

11
much. But if so, productivity will also pick up to a lesser degree once the recovery starts.
11. Don’t count on financial markets to behave in a systematic wayEverybody expects the stock market to go down when a recession occurs. That’s a reasonable expectation—but it’s not the whole story. Figure 10 shows that in three of the past eight recessions, the stock market completely recovered to prerecession levels within 12 months. Further, the market showed only a slight decline in two more of those recessions.
This suggests that, if you are able to guess when the business cycle peaks, you shouldn’t automatically sell. There are times when that would be wise—and times when it would be foolish.
Of course, a stock market correction is inevitable sooner or later. But sometimes, it occurs before the recession—and sometimes, it seems to be delayed.
FIGURE 9
Productivity falls during recessions, and rebounds with recovery Recession Productivity
Source: US Bureau of Labor Statistics via Haver Analytics. Deloitte Insights | deloitte.com/insights
Real output per hour, US business sector, year-over-year percent change
–4%
–2%
0%
2%
4%
6%
8%
10%
Q1 1950Q1 1955
Q1 1960Q1 1965
Q1 1970Q1 1975
Q1 1980Q1 1985
Q1 1990Q1 1995
Q1 2000Q1 2005
Q1 2010Q1 2015
What to expect when you’re expecting … a recession

12
How the financial markets behave will depend very greatly on the recession’s particular causes. Different recessions are caused by different sequences of events—and no two recessions are exactly alike.
12. Three types of shocks underlie all postwar US recessions to dateModern business cycle theory hypothesizes that recessions are the result of “shocks”—unforeseen changes in economic conditions that lead economic actors to suddenly cut spending.7 But it turns out that, at least in the post–World War II United States, recessions have been caused by just three types of shocks: economic policy mistakes, especially before the 1970s; oil shocks; and financial bubbles, particularly in the last two recessions (figure 11).
Policy mistakes have become less important in recent times. In fact, the most recent recession that could be definitely ascribed to the US Federal Reserve overtightening was in 1969. The tightening in 1981 was deliberate: The then–Fed chair Paul Volcker judged that a recession was required to tame accelerating inflation. And while some analysts are willing to blame the Fed for more recent recessions, the typical narratives attribute them to private financial problems. The most recent two recessions, in particular, are remarkable for having clearly originated in private sector financial bubbles. It may be worth remembering that, before World War II, such bubbles were the main cause of almost all recessions. If the current trend continues, we may go “back to the future” when it comes to what triggers a recession.
The past few years have been a “Goldilocks” period for the US economy. Low unemployment rates coupled with low inflation have given policymakers the best combination they could hope for. But another recession will happen. There’s a lot we
FIGURE 10
The stock market may go down in a recession, but it typically recovers quickly
Changes in S&P 500 Composite Index, percent change, 12 months after peak
Source: US Bureau of Labor Statistics via Haver Analytics.
Deloitte Insights | deloitte.com/insights
–41%
–3%
–15%
20%
–30%
–1%
18%
–6%
–50%
–40%
–30%
–20%
–10%
0%
10%
20%
30%
20072001199019811980197319691960Average
6%
What to expect when you’re expecting … a recession

13
FIGURE 11
All postwar US recessions can be attributed to three root causes
Source: David Glasner and Thomas F. Cooley, Business cycles and depressions: An encyclopedia (New York: Garland Publishing Company, 1997).
Deloitte Insights | deloitte.com/insights
Cause of recession
November 1948
July 1953
August 1957
April 1960
December 1969
November 1973
January 1980
July 1981
July 1990
March 2001
December 2007
• Tight monetary policy
• Tight monetary policy
• Defense drawdown after Korea
• Tight monetary and fiscal policy
• Tight monetary and fiscal policy
• Tight monetary policy
• First oil shock
• Second oil shock
• Tight monetary policy
• Tight monetary policy
• Iraqi invasion of Kuwait and oil price hike
• Savings and loan crisis
• Tight monetary policy
• Tech bubble burst
• Housing bubble burst
Peak
don’t know about that future recession. We don’t know when it will happen. We don’t know what will cause it. But we do have some idea of what it will look like because the past does provide a guide.
Knowing what to expect when the economy enters a downturn can help businesses make intelligent decisions about how to respond to, and how to survive, the next recession.
What to expect when you’re expecting … a recession
14
1. Julius Shiskin, “The changing business cycle,” New York Times, December 1, 1974.
2. National Bureau of Economic Research, “US business cycle expansion and contractions,” accessed October 25, 2019.
3. Mining accounts for about half of a percent of all nonfarm employment. Its overall impact on employment during the downturn was trivial. In contrast, education and health services accounted for about 16 percent of all nonfarm employment, so the sector’s insensitivity to the business cycle played an important role in cushioning the impact on workers.
4. There were very slight declines—less than 0.1 percent—in March and April of 2009.
5. Specifically, a regression of imports on domestic final sales (in logs) yields an elasticity of about 1.9—suggesting that a 1 percent decline in domestic demand has translated into about a 2 percent decline in imports, on average.
6. Jeff E. Biddle, “Retrospectives: The cyclical behavior of labor productivity and the emergence of the labor hoarding concept,” Journal of Economic Perspectives 28, no. 2 (2014): 197–211.
7. For more information, see: Thorsten Drautzburg (Federal Reserve Bank of Philadelphia), “Why are recessions so hard to predict? Random shocks and business cycles,” Economic Insights 4, no. 1 (2019): 1–8; Tara M. Sinclair, “Continuities and discontinuities in economic forecasting,” Working Papers 2019-003 (George Washington University, Department of Economics, Research Program on Forecasting, August 2019).
Endnotes
What to expect when you’re expecting … a recession
14

15
Daniel Bachman | [email protected]
Daniel Bachman is a senior manager with Deloitte Services LP, in charge of US economic forecasting for Deloitte’s Eminence and Strategy functions, and an experienced US and international macroeconomic forecaster and modeler. He came to Deloitte from IHS Economics, where he was in charge of IHS’s Center for Forecasting and Modeling. Prior to that, he worked as a forecaster and economic analyst at the US Commerce Department.
About the author
Contact usOur insights can help you take advantage of change. If you’re looking for fresh ideas to address your challenges, we should talk.
Industry leadership
Daniel BachmanSenior manager | Deloitte Services LP+1 202 306 5576 | [email protected]
What to expect when you’re expecting … a recession
15

About Deloitte Insights
Deloitte Insights publishes original articles, reports and periodicals that provide insights for businesses, the public sector and NGOs. Our goal is to draw upon research and experience from throughout our professional services organization, and that of coauthors in academia and business, to advance the conversation on a broad spectrum of topics of interest to executives and government leaders.
Deloitte Insights is an imprint of Deloitte Development LLC.
About this publication
This publication contains general information only, and none of Deloitte Touche Tohmatsu Limited, its member firms, or its and their affiliates are, by means of this publication, rendering accounting, business, financial, investment, legal, tax, or other professional advice or services. This publication is not a substitute for such professional advice or services, nor should it be used as a basis for any decision or action that may affect your finances or your business. Before making any decision or taking any action that may affect your finances or your business, you should consult a qualified professional adviser.
None of Deloitte Touche Tohmatsu Limited, its member firms, or its and their respective affiliates shall be responsible for any loss whatsoever sustained by any person who relies on this publication.
About Deloitte
Deloitte refers to one or more of Deloitte Touche Tohmatsu Limited, a UK private company limited by guarantee (“DTTL”), its network of member firms, and their related entities. DTTL and each of its member firms are legally separate and independent entities. DTTL (also referred to as “Deloitte Global”) does not provide services to clients. In the United States, Deloitte refers to one or more of the US member firms of DTTL, their related entities that operate using the “Deloitte” name in the United States and their respective affiliates. Certain services may not be available to attest clients under the rules and regulations of public accounting. Please see www.deloitte.com/about to learn more about our global network of member firms.
Copyright © 2019 Deloitte Development LLC. All rights reserved. Member of Deloitte Touche Tohmatsu Limited
Deloitte Insights contributorsEditorial: Junko Kaji, Anya Tharakan George, Rupesh Bhat, Preetha Devan, and Aparna PrustyCreative: Adamya Manshiva, Tushar Barman, and Kevin WeierPromotion: Nikita GariaCover artwork: Rocco Baviera
Sign up for Deloitte Insights updates at www.deloitte.com/insights.
Follow @DeloitteInsight