Embed Size (px)
Citation preview

Institut de Recerca en Economia Aplicada Regional i Pública Document de Treball 2017/13 1/27 pág.
Research Institute of Applied Economics Working Paper 2017/07 1/27 pág.
“What really matters is the economic performance: Positioning tourist destinations by means of perceptual maps”
Oscar Claveria

2
4
WEBSITE: www.ub.edu/irea/ • CONTACT: [email protected]
The Research Institute of Applied Economics (IREA) in Barcelona was founded in 2005, as a research
institute in applied economics. Three consolidated research groups make up the institute: AQR, RISK
and GiM, and a large number of members are involved in the Institute. IREA focuses on four priority
lines of investigation: (i) the quantitative study of regional and urban economic activity and analysis of
regional and local economic policies, (ii) study of public economic activity in markets, particularly in the
fields of empirical evaluation of privatization, the regulation and competition in the markets of public
services using state of industrial economy, (iii) risk analysis in finance and insurance, and (iv) the
development of micro and macro econometrics applied for the analysis of economic activity, particularly
for quantitative evaluation of public policies.
IREA Working Papers often represent preliminary work and are circulated to encourage discussion.
Citation of such a paper should account for its provisional character. For that reason, IREA Working
Papers may not be reproduced or distributed without the written consent of the author. A revised version
may be available directly from the author.
Any opinions expressed here are those of the author(s) and not those of IREA. Research published in
this series may include views on policy, but the institute itself takes no institutional policy positions.

3
Abstract
The present study aims to cluster the world's main tourist destinations
according to the growth of the economic performance of the tourist activity
and of the tourist and economic development experienced during the last
decade. With this objective, we combine the information from a set of tourist
and economic indicators for the main 45 tourist destinations over the period
between 2000 and 2010. Destinations are ranked with respect to their
average growth rate over the sample period. By assigning a numerical value
to each country corresponding to its position, all the information is
summarised into two components (“economic performance of tourist activity”
and “tourist and economic development”) via multivariate techniques for
dimensionality reduction: multidimensional scaling (MDS) and categorical
principal components analysis (CATPCA). By means of perceptual maps, we
find that destinations can be clustered into four different groups. The first
one, dominated by Western and Northern Europe markets, contains some of
the top destinations (France, Spain and the United States). A second one,
with a predominance of Mediterranean destinations (Cyprus, Greece, Italy
and Israel), obtains high scores in both dimensions. In the third one, we find
Cambodia and China, alongside Egypt and Turkey. Finally, a fourth group
dominated by Eastern Europe destinations (Bulgaria, Croatia and Latvia)
with low scores in both dimensions.
JEL classification: A12, C38, F43, M31, Z3, Z32
Keywords: Tourist destinations; Positioning; Perceptual maps; Multidimensional Scaling (MDS);
Categorical Principal Components Analysis (CATPCA).
Oscar Claveria: Department of Econometrics, Statistics and Applied Economics. University of Barcelona, Diagonal 690, 08034 Barcelona, Spain. E-mail: [email protected] Acknowledgements
We wish to thank Laura Muñoz and Jacinta García at the World Tourism Organization (UNWTO)
for providing us with the data used in this study. This paper has been partially financed by the
project ECO2016-75805-R of the Spanish Ministry of Economy and Competitiveness.
1. Introduction
Tourism is one of the fastest-growing economic sectors in the world, and it has turned
into a key driver of socio-economic development. Travel and passenger transport
represents 30% of the world’s exports of services. The number of international tourist
arrivals (overnight visitors) in 2015 increased by 4.6% to reach a total of 1186 million
worldwide (UNWTO, 2016). While other commodity prices showed decreasing prices,
international tourism receipts increased by 4.4% in real terms in 2015 (UNWTO, 2016).
Accordingly, tourist destinations have to make major efforts to develop and manage their
brand within an increasingly competitive market (Mariani et al., 2014; Wang & Pizam,
2011).
Countries worldwide are opening up to tourism. Consequently, emerging destinations
are playing an increasingly important role in this competitive environment. According to
the UNWTO (2015), arrivals in emerging destinations between 2010 and 2030 are
expected to increase at twice the rate of those in advanced economies, reaching a 57%
share of the market. Mature destinations in Northern and Western Europe and North
America are expected to experience a comparatively slower growth during the next two
decades. On the contrary, Africa, the Middle East, and especially Asia and the Pacific are
the regions expected to grow faster. As a result, tourism in emerging markets is drawing
increasing attention (Cohen et al., 2014). Despite the growing interest in emerging
markets, most tourism research still focus on the world’s top tourist destinations (Claveria,
2016; UNWTO, 2015).
This study aims to shed some light on the evolution of tourism trends during the last
decade in the world’s main 45 tourist destinations. We use the methodology proposed by
Claveria (2016) to position and cluster 20 emerging tourist destinations. We aim to
contribute to tourism research literature by analysing how the dynamic interactions
between the main tourist and economic indicators ultimately affected the positioning of
destinations since the turn of the century. Li et al. (2013) noted the importance of the
economic dimension in determining destinations competitiveness. Song et al. (2012)
pointed out that one of the limitations of most tourism studies is the omission of economic
indicators and the lack of attention paid to economic return. To cover this deficit, we
combine official tourism data with economic information at the macro level, and generate
an indicator of economic performance of inbound tourism (total number of international
tourist arrivals) at the destination level: the ratio of total expenditure per tourist.
4
Research Institute of Applied Economics Regional Quantitative Analysis Research Group
Working Paper 2017/13, pàg. 4 Working Paper 2017/07, pag. 4

On the one hand, we use data from the Compendium of Tourism Statistics provided
by the World Tourism Organization (UNWTO). Data include the annual number of
international overnight visitors, total expenditure, total number of rooms, and the
percentage of the occupancy rates from 2000 to 2010. The country selection criterion is
based on the number of international overnight visitors and the availability of secondary
data for the sample period, under the constraint that all regions are represented. We use
the UNWTO regional classification.
On the other hand, we incorporate economic information in the form of the Gross
Domestic Product (GDP) provided by the World Bank. Finally, in order to capture the
relationship between tourism and development beyond economic growth alone, we
include the Human Development Index (HDI), which is a composite indicator obtained
as the geometric mean of three indices. The HDI can be regarded as a summary measure
of average achievement in three key dimensions of human development: the health
dimension, assessed by life expectancy at birth; the education dimension, measured by
mean of years of schooling for adults aged 25 years and more and expected years of
schooling for children of school entering age, and the standard of living dimension, which
is measured by the logarithm of the gross national income (GNI) per capita so as to reflect
the diminishing importance of income with increasing GNI.
This research also differs from previous destination positioning studies in that we use
annual percentage growth rates of the variables to avoid the issues derived from working
with non-stationary time series (Oh, 2005; Lim & McAleer, 2002). Several authors have
pointed out the importance of working with growth rates instead of levels (Li et al., 2013),
since most tourism variables are non-stationary due to its steady growth (Chu et al., 2014).
The proposed approach for positioning tourist destinations is based on a two-step
methodology proposed by Claveria (2016). First, we rank the 45 tourist destinations
regarding their average growth rates in all items over the sample period, indirectly
introducing a dynamic perspective into the analysis. By assigning a numerical value to
each destination corresponding to its position in the rankings, we then cluster the
destinations by means of two dimensionality reduction techniques: Multidimensional
Scaling (MDS) and Categorical Principal Component Analysis (CATPCA). Finally, we
use perceptual maps to project the results and to position the destinations.
The remainder of the study is organized as follows. The next section provides a review
of the existing literature. Section 3 describes the data set. In Section 4 we rank the
destinations and present the results of the multivariate analysis. Finally, Section 5
concludes.
5
Research Institute of Applied Economics Regional Quantitative Analysis Research Group
Working Paper 2017/13, pàg. 5 Working Paper 2017/07, pag. 5
2. Literature review
The factors conditioning the demand for tourism range from politics to economics.
Wang (2009) stressed the importance of identifying the key factors affecting tourism
demand in order to effectively understand changes and trends in the tourism market, and
create competitive advantages for the tourism industry. Several authors have examined
the effects of economic variables in both the hospitality industry (Lee & Ha, 2012) and
tourism development (Novak et al., 2011; Pranić et al., 2012).
The contribution of tourism to economic growth, as well as to destination
competitiveness, has been extensively analysed in the tourism literature (Balaguer &
Cantavella-Jordá, 2002, Brida et al., 2016; Capó et al., 2007; Chou, 2013; Croes, 2011;
Crouch & Richie, 1999, 2006; Durbarry, 2004; Oh, 2005; Pérez-Rodríguez et al., 2015;
Schubert & Brida, 2009; Schubert et al., 2011; Seo et al., 2010; Torraleja, 2009). Recent
literature highlighted the role of capital formation, arguing that the mechanism underlying
tourism’s welfare-promoting effect heavily relies on capital goods imports (Nowak et al.,
2007; Cortés-Jiménez et al. 2011). Foreign direct investment, trade volume, and exchange
rates have also proved to be linked to tourism (Santana-Gallego et al., 2010, 2011; Wong
& Tang, 2010).
Nevertheless, there are few studies addressing the interdependence between tourism
and economic growth by means of multivariate analysis (Chandra & Menezes, 2001).
Multivariate methods can be classified into two major categories: dependency and
interdependency techniques. While dependency procedures assume that a set of variables
is explained by other variables, interdependency methods involve the simultaneous
analysis of all the variables in the dataset. By reducing the dimensionality in a dataset,
interdependency analysis is used to detect underlying relationships between variables.
There are several multivariate techniques for dimensionality reduction: cluster analysis,
multiple correspondence analysis (MCA), exploratory factor analysis (EFA),
confirmatory factor analysis (CFA), principal components (PCA), etc. For a detailed
description of these techniques see Hair et al. (2009), Jolliffe (2002) and Sharma (1996).
Dimensionality reduction techniques have been used in a wide range of tourism
studies: from image and perception analyses to motivation research. One of the main areas
in which multivariate analysis is widely used is market segmentation studies (Dey &
Sarma, 2010; Donaire et al, 2014; Keng & Cheng, 1999; Lee et al., 2006; Park & Yoon,
2009; Rid et al., 2014; Sinclari-Maragh et al., 2015; Upchurch et al., 2004; Voges, 2007).
6
Research Institute of Applied Economics Regional Quantitative Analysis Research Group
Working Paper 2017/13, pàg. 6 Working Paper 2017/07, pag. 6
Guo et al. (2015) conducted conjoint and a cluster analyses to segment Chinese spa
customers in Hong Kong. Arimond & Elfessi (2001) used MCA to spatially map
attributes from a categorical survey data, and then cluster analysis to identify market
segments.
MDS is also known as Principal Coordinates Analysis or Torgerson scaling
(Torgerson, 1952, 1958). MDS is a multivariate analytical procedure that allows to
visualize the level of similarity between individuals based on the proximity of individuals
to each other in a generated projection, known as perceptual map. These representations
allow the visualization of the strengths and weaknesses of destinations. For an overview
of MDS, see Borg & Groenen (2005), Borg et al. (2013) and Fentom & Pearce (1988). In
a recent study, Marcussen (2014) reviewed 64 papers that applied MDS to tourism
research, finding that the most common topics were image and positioning of destinations.
For a review of the literature on destination image see Pike (2002).
The first application of MDS to tourism destinations was that of Wish et al. (1970).
Since then, a large number of studies have analysed the positioning of destinations by
means of MDS (Andreu et al. 2000; Crompton et al., 1992; Gursoy et al., 2009; Kayar &
Kozak, 2010; Kim, 1998; Leung & Baloglu, 2013; Li et al., 2015; Marcussen, 2014; Uysal
et al., 2000). Haahti (1986) assessed the relative status of Finland as a summer holiday
destination compared to nine European competitors. Applying a two-dimensional MDS
analysis, Gartner (1989) clustered four American states with similar tourism and
recreation attributes. Kim & Agrusa (2005) positioned seven honeymoon destinations
according to the perception of Korean tourists regarding eight attributes. Kim et al. (2005)
used MDS to identify the position of overseas golf tourism destinations. Omerzel (2006)
analysed the competitiveness of Slovenia as a tourist destination regarding the ratings for
85 indicators grouped into six categories. Via MDS analysis, Zins (2010) depicted
destination images of ten different countries from the perspective of two traveller
segments.
Lozano & Gutierrez (2011) applied MDS to analyse 25 European destinations.
Marcussen (2011) combined MDS with FA to position and group 33 European
destinations in relation to each other. Using official data from Eurostat regarding monthly
overnight stays from 1998 to 2009, the author found that European destinations could be
grouped by major language spheres. Claveria & Poluzzi (2017) arrived to a similar
conclusion for the world’s top ten destinations.
7
Research Institute of Applied Economics Regional Quantitative Analysis Research Group
Working Paper 2017/13, pàg. 7 Working Paper 2017/07, pag. 7

In a similar study, Leung & Baloglu (2013) evaluated the destination competitiveness
of 16 Asia Pacific destinations, generating three-dimensional perceptual maps, and using
cluster analysis to identify groupings on the maps. Recently, Li et al. (2015) analysed the
position of the United States (US) against its major non-Asian competitors. By combining
MDS, MCA, and logistic regression, the authors found that the US holds a unique position
in relation to its competitor destinations. MDS has also been applied in other tourism
studies. Chhetri et al. (2004) identified the underlying dimensions influencing visitor
experiences in nature-based tourism destinations.
Recent developments in multivariate analysis focus on dealing with nonlinear
relationships in data. PCA has been extended by using autoassociative neural networks
(Kramer, 1991), principal curves and manifolds (Hastie & Stuetzle, 1989), and kernel
approaches (Schölkopf et al., 1998). Another machine learning technique are Self-
Organizing Maps (SOMs) (Kohonen, 2001). SOMs can be regarded as a nonlinear
generalization of PCA (Liu & Weisberg, 2005). SOM analysis is used to generate visual
representations of data that allow to disclose unknown patterns. While SOMs are starting
to be used in economic studies (Claveria et al., 2016; Sarlin & Peltonen, 2013, Zarate-
Solano & Zapata-Sanabria, 2017), to our knowledge, the only application in tourism is
that of Bloom (2005), who used a SOM for segmenting the inbound tourism demand to
Cape Town.
CATPCA, also known as nonlinear PCA, represents another development in
nonlinear dimensionality reduction. See Gifi (1990) for a historical overview, and Linting
et al. (2007) for an exhaustive treatment of nonlinear PCA. CATPCA does not assume
that the relationships between variables are linear, and can discover nonlinear
relationships between variables. Another advantage of CATPCA over standard PCA, is
that it allows incorporating nominal and ordinal variables. In spite of these features, few
studies have applied CATPCA in tourism research (Correia et al., 2007; Green, 2005).
In order to cover this deficit, we compare the performance of CATPCA and MDS in
the positioning of the main 45 destinations based on the rankings regarding different
official indicators that combine tourist and economic information. These procedures are
used to reduce the dimensionality of data by transforming the original set of correlated
variables into a smaller set of uncorrelated variables known as factors, which can be
interpreted as synthetic indicators that maintain the original ordinal structures.
8
Research Institute of Applied Economics Regional Quantitative Analysis Research Group
Working Paper 2017/13, pàg. 8 Working Paper 2017/07, pag. 8

3. Data
The dataset is comprised of two major sources of information: tourist and economic
indicators. On the one hand, we use official data from the Compendium of Tourism
Statistics provided by the UNWTO (http://www2.unwto.org/content/data-0). We focus
on five indicators: overnight visitors (thousands), total expenditure (US$ millions),
occupancy rate (%), rooms, and inbound expenditure over GDP (%). From these set of
data, we calculate and additional indicator of economic performance at the destination
level: the ratio of total expenditure per tourist.
On the other hand, we add economic information in the form of the GDP at market
prices based on constant local currency provided by the World Bank
(http://data.worldbank.org/indicator/NY.GDP.MKTP.KD.ZG). Finally, we include the
HDI (http://hdr.undp.org/en/content/human-development-index-hdi), which is a
composite indicator of life expectancy, education, and income per capita that allows us to
capture the relationship between tourism and development beyond a strictly economic
sense.
The country selection criterion is based on the number of international overnight
visitors and the availability of secondary data for the sample period (2000-2010), under
the constraint that all regions are represented. We use the UNWTO regional classification,
which divides the world into five major regions Europe (Northern, Western,
Central/Eastern, Southern/Mediterranean), Asia and the Pacific (North-East Asia, South-
East Asia, Oceania, South Asia), Americas (Caribbean, North, Central and South
America), Africa (North, Sub-Saharan), and Middle East.
The set of countries is as follows (Table 1): Austria (1), Botswana (2), Bulgaria (3),
Cambodia (4), Chile (5), China (6), Costa Rica (7), Croatia (8), Cyprus (9), Dominican
Republic (10), Egypt (11), Estonia (12), Finland (13), France (14), Germany (15), Greece
(16), Hong Kong (17), Indonesia (18), Ireland (19), Israel (20), Italy (21), Jamaica (22),
Jordan (23), Latvia (24), Lithuania (25), Madagascar (26), Mexico (27), Morocco (28),
New Zealand (29), Norway (30), Panama (31), Paraguay (32), Philippines (33), Poland
(34), Portugal (35), Singapore (36), Slovenia (37), South Africa (38), Spain (39), Sri
Lanka (40), Sweden (41), Tunisia (42), Turkey (43), United Kingdom (UK) (44), and the
US (45).
The information in Table 1 indicates that the tourism sector is highly concentrated in
few destinations, as the first five national markets (France, Spain, the US, China and Italy)
9
Research Institute of Applied Economics Regional Quantitative Analysis Research Group
Working Paper 2017/13, pàg. 9 Working Paper 2017/07, pag. 9

account for almost 50% of world tourism. The next ten destinations (the UK, Germany,
Mexico, Turkey, Austria, Greece, Poland, Hong Kong, Portugal and Egypt) represent an
additional 32% of total international overnight visitors.
Table 1. Frequency distribution of international inbound tourism – Annual average 2000-2010
Destination Average
2000-2010
Relative
frequency
worldwide
Destination Average
2000-2010
Relative
frequency
worldwide
France 76,934 14.43% Sweden 4,561 0.86%
Spain 53,019 9.94% Norway 3,811 0.71%
US 50,719 9.51% Dom. Rep. 3,558 0.67%
China 44,269 8.30% Finland 3,142 0.59%
Italy 40,731 7.64% Jordan 2,928 0.55%
UK 26,470 4.96% Philippines 2,559 0.48%
Germany 21,711 4.07% Cyprus 2,405 0.45%
Mexico 21,167 3.97% New Zealand 2,225 0.42%
Turkey 19,998 3.75% Chile 2,121 0.40%
Austria 19,956 3.74% Israel 1,867 0.35%
Greece 14,677 2.75% Estonia 1,762 0.33%
Poland 14,323 2.69% Costa Rica 1,593 0.30%
Hong Kong 13,981 2.62% Botswana 1,590 0.30%
Portugal 9,736 1.83% Lithuania 1,563 0.29%
Egypt 8,516 1.60% Slovenia 1,551 0.29%
Croatia 7,764 1.46% Jamaica 1,546 0.29%
South Africa 7,346 1.38% Cambodia 1,413 0.27%
Ireland 7,201 1.35% Latvia 1,153 0.22%
Singapore 6,916 1.30% Panama 831 0.16%
Morocco 6,242 1.17% Sri Lanka 485 0.09%
Tunisia 6,106 1.14% Paraguay 352 0.07%
Indonesia 5,453 1.02% Madagascar 221 0.04%
Bulgaria 4,618 0.87%
Note: Tourist arrivals are measured in thousands. Dom. Rep. stands for the Dominican Republic.
In Table 2 we compute the annual percentage growth rates of all the variables used in
the study. Given that growth rates are dimensionless measures of the amount of variation
of a specific variable from one year to another in percentage terms, they provide a
comparative overview of the evolution of the different tourist and economic indicators.
Thus, Cambodia and Madagascar are the destinations that show the highest average
growth rates for most variables. In the case of the expenditure per tourist, Cambodia
obtains the second lowest average rate, as opposed to Madagascar with the highest
10
Research Institute of Applied Economics Regional Quantitative Analysis Research Group
Working Paper 2017/13, pàg. 10 Working Paper 2017/07, pag. 10

average rate. At the opposite end, Cyprus shows some of the lowest average growth rates
for most tourist variables (total expenditure, occupancy, and GDP).
Table 2. Descriptive analysis – Average annual percentage growth rates (2000-2010)
Expenditure
per tourist
Overnight
visitors
Total
expenditure
Inbound
expenditure
per GDP
Rooms Occupancy GDP HDI
Austria 3.14 2.14 5.41 -0.37 -0.05 0.86 1.69 0.51
Botswana -2.45 9.35 4.69 -6.45 11.46 2.46 4.00 0.77
Bulgaria 4.00 8.63 13.10 -0.10 8.83 -0.21 4.27 0.77
Cambodia -1.63 20.20 18.45 6.44 12.47 3.79 8.12 1.82
Chile 1.61 5.45 6.59 -3.39 4.26 0.07 3.92 0.68
China 4.66 7.23 12.51 -3.61 6.49 1.19 10.33 1.55
Costa Rica -1.16 6.93 5.87 -2.06 3.88 1.77 4.16 0.85
Croatia 4.67 9.06 12.83 1.04 -0.72 6.80 2.65 0.63
Cyprus 2.46 -0.85 1.52 -6.48 -0.20 -0.11 3.26 0.50
Dom. Rep. 0.81 4.28 5.12 -1.70 2.78 0.12 5.01 0.85
Egypt 0.14 11.69 11.63 3.64 8.43 0.99 4.90 1.08
Estonia -1.19 9.02 7.13 3.72 12.63 0.11 4.19 0.65
Finland 3.58 3.91 7.19 1.13 0.15 -1.64 2.12 0.52
France 3.44 0.59 4.01 -1.36 0.43 0.21 1.47 0.44
Germany 2.21 4.33 6.56 2.23 0.73 1.03 1.12 0.53
Greece 1.91 2.07 3.78 -3.06 2.36 -2.39 2.04 0.67
Hong Kong 3.56 9.66 13.40 9.75 5.37 1.41 4.45 1.00
Indonesia 2.41 4.02 7.00 -6.78 3.28 1.35 5.21 1.39
Ireland 7.51 1.13 8.84 1.13 1.97 -1.13 3.18 0.42
Israel 0.86 5.64 3.56 -4.05 1.53 -0.35 3.88 0.34
Italy 1.76 1.80 3.20 -1.95 1.25 -0.74 0.64 0.56
Jamaica -0.73 4.09 3.37 -0.44 2.34 0.59 -0.50 0.69
Jordan 6.16 8.82 15.49 3.04 3.40 4.11 6.14 0.72
Latvia 10.02 10.15 19.85 6.53 6.63 -0.82 4.42 0.72
Lithuania 6.35 2.12 6.72 -5.07 7.08 1.99 1.59 0.87
Notes: HDI stands for the annual average growth rate of the Human Development Indicator during
2000-2010. Statistics are conducted for the sample period: 2000-2010. Dom. Rep. stands for
the Dominican Republic.
11
Research Institute of Applied Economics Regional Quantitative Analysis Research Group
Working Paper 2017/13, pàg. 11 Working Paper 2017/07, pag. 11

Table 2. (cont.) Descriptive analysis – Average annual percentage growth rates (2000-2010)
Expenditure
per tourist
Overnight
visitors
Total
expenditure
Inbound
expenditure
per GDP
Rooms Occupancy GDP HDI
Madagascar 18.43 14.93 18.72 12.91 8.49 5.19 2.94 1.24
Mexico 2.37 1.98 4.37 -2.65 3.33 -0.15 2.14 0.64
Morocco 4.63 8.50 13.40 5.17 5.50 -2.99 4.64 1.35
New Zealand 4.16 4.00 8.40 -0.59 19.99 0.00 2.57 0.33
Norway 2.82 3.72 6.80 -2.59 1.89 -0.93 1.72 0.32
Panama 5.30 10.48 16.17 7.36 3.89 4.59 5.82 0.62
Paraguay 5.32 5.35 10.74 1.16 5.21 0.83 3.01 0.79
Philippines -0.36 4.93 5.16 -4.02 -5.86 1.37 4.74 0.61
Poland 8.97 -3.02 5.72 -4.34 6.62 -0.52 3.88 0.49
Portugal 15.44 -3.83 7.61 1.76 2.47 -1.50 1.03 0.43
Singapore 5.53 5.53 11.56 0.48 2.87 1.74 6.18 0.77
Slovenia 2.66 7.28 9.85 2.47 3.23 1.09 2.86 0.58
South Africa 9.59 3.59 12.53 0.97 2.86 -0.57 3.55 0.78
Spain 4.14 1.43 5.66 -2.16 2.52 -1.27 2.52 0.43
Sri Lanka 5.87 5.20 10.92 -0.33 2.62 3.38 5.27 -0.01
Sweden 2.93 6.89 8.25 3.53 1.44 0.73 2.39 0.11
Tunisia 1.52 3.45 5.20 -1.98 2.12 -0.63 4.45 1.01
Turkey -0.04 15.61 15.28 8.31 6.22 2.74 4.26 1.04
UK 0.97 1.98 3.14 -0.42 2.40 0.71 1.94 0.39
US 1.74 2.16 4.03 0.01 1.93 -0.75 1.88 0.29
Notes: See Notes of Table 2
4. Multivariate analysis
4.1. Ranking of destinations
In this section we rank the 45 destinations according to the average annual growth
experienced over the period comprised from 2000 to 2010 for each variable (Table 3).
12
Research Institute of Applied Economics Regional Quantitative Analysis Research Group
Working Paper 2017/13, pàg. 12 Working Paper 2017/07, pag. 12

Table 3. Ranking of destinations – Average annual percentage growth rates (2000-2010)
Expenditure
per tourist
Overnight
visitors
Total
expenditure
Inbound
expenditure
per GDP
Rooms Occupancy GDP HDI
Madagascar Cambodia Latvia Madagascar New Zealand Croatia China Cambodia
Portugal Turkey Madagascar Hong Kong Estonia Madagascar Cambodia China
Latvia Madagascar Cambodia Turkey Cambodia Panama Singapore Indonesia
South Africa Egypt Panama Panama Botswana Jordan Jordan Morocco
Poland Panama Jordan Latvia Bulgaria Cambodia Panama Madagascar
Ireland Latvia Turkey Cambodia Madagascar Sri Lanka Sri Lanka Egypt
Lithuania Hong Kong Morocco Morocco Egypt Turkey Indonesia Turkey
Jordan Botswana Hong Kong Estonia Lithuania Botswana Dominican
Rep. Tunisia
Sri Lanka Croatia Bulgaria Egypt Latvia Lithuania Egypt Hong Kong
Singapore Estonia Croatia Sweden Poland Costa Rica Philippines Lithuania
Paraguay Jordan South Africa Jordan China Singapore Morocco Costa Rica
Panama Bulgaria China Slovenia Turkey Hong Kong Hong Kong Dominican
Rep.
Croatia Morocco Egypt Germany Morocco Philippines Tunisia Paraguay
China Slovenia Singapore Portugal Hong Kong Indonesia Latvia South Africa
Morocco China Sri Lanka Paraguay Paraguay China Bulgaria Singapore
New Zealand Costa Rica Paraguay Ireland Chile Slovenia Turkey Botswana
Spain Sweden Slovenia Finland Panama Germany Estonia Bulgaria
Bulgaria Israel Ireland Croatia Costa Rica Egypt Costa Rica Jordan
Finland Singapore New Zealand South Africa Jordan Austria Botswana Latvia
Hong Kong Chile Sweden Singapore Mexico Paraguay Chile Jamaica
France Paraguay Portugal US Indonesia Sweden Poland Chile
Austria Sri Lanka Finland Bulgaria Slovenia UK Israel Greece
Sweden Philippines Estonia Sri Lanka Singapore Jamaica South Africa Estonia
Norway Germany Indonesia Austria South Africa France Cyprus Mexico
Slovenia Dominican
Rep. Norway UK
Dominican
Rep.
Dominican
Rep. Ireland Croatia
Cyprus Jamaica Lithuania Jamaica Sri Lanka Estonia Paraguay Panama
Indonesia Indonesia Chile New Zealand Spain Chile Madagascar Philippines
Mexico New Zealand Germany France Portugal New Zealand Slovenia Slovenia
Notes: HDI stands for the annual average growth rate of the Human Development Indicator. Dom.
Rep. stands for the Dominican Republic.
13
Research Institute of Applied Economics Regional Quantitative Analysis Research Group
Working Paper 2017/13, pàg. 13 Working Paper 2017/07, pag. 13

Table 3 (cont.). Ranking of destinations – Average annual percentage growth rates (2000-2010)
Expenditure
per tourist
Overnight
visitors
Total
expenditure
Inbound
expenditure
per GDP
Rooms Occupancy GDP HDI
Germany Finland Costa Rica Dominican
Rep. UK Cyprus Croatia Italy
Greece Norway Poland Italy Greece Mexico New Zealand Germany
Italy South Africa Spain Tunisia Jamaica Bulgaria Spain Finland
US Tunisia Austria Costa Rica Tunisia Israel Sweden Austria
Chile US Tunisia Spain Ireland Poland Mexico Cyprus
Tunisia Austria Philippines Norway US South Africa Finland Poland
UK Lithuania Dominican
Rep. Mexico Norway Tunisia Greece France
Israel Greece Botswana Greece Israel Italy UK Spain
Dominican Rep.
UK Mexico Chile Sweden US US Portugal
Egypt Mexico US China Italy Latvia Norway Ireland
Turkey Italy France Philippines Germany Norway Austria UK
Philippines Spain Greece Israel France Ireland Lithuania Israel
Jamaica Ireland Israel Poland Finland Spain France New Zealand
Costa Rica France Jamaica Lithuania Austria Portugal Germany Norway
Estonia Cyprus Italy Botswana Cyprus Finland Portugal US
Cambodia Poland UK Cyprus Croatia Greece Italy Sweden
Botswana Portugal Cyprus Indonesia Philippines Morocco Jamaica Sri Lanka
Notes: See Note of Table 3.
The rankings in Table 3 confirm some of the results of the previous section. China
and Cambodia are in the top positions regarding the average growth in GDP and HDI.
Cambodia is also in the top positions in all tourist indicators except for the average growth
rate in expenditure per tourist. Madagascar is in the first position with respect to the
average growth of the expenditure per tourist and the inbound expenditure over GDP, and
in the top positions for most of the indicators with the exception of GDP. On the other
extreme, Cyprus occupies low positions in most tourist indicators. See Sun et al. (2015),
Chheang (2008), Peypoch et al. (2012) and Altinay & Bowen (2006) for recent tourism
research about China, Cambodia, Madagascar and Cyprus respectively.
14
Research Institute of Applied Economics Regional Quantitative Analysis Research Group
Working Paper 2017/13, pàg. 14 Working Paper 2017/07, pag. 14

4.2. Positioning of destinations
By assigning a numerical value to each country corresponding to its ranking in Table
3, we generate a set of categorical data that we use to cluster the different destinations.
The grouping of all countries is done by means of two optimal scaling techniques for
categorical data: CATPCA and MDS, using IBM SPSS Statistics 24 (Meulman et al.,
2012).
Both techniques allow us to reduce the information contained in Table 3 into two
dimensions. We have used the Kaiser-Guttman method (Guttman, 1954; Kaiser, 1960;
Yeomans & Golder, 1982) in order to determine the number of factors to retain.
According to this criterion, only the factors that have eigenvalues greater than one are
retained for interpretation. Eigenvalues represent the amount of variance accounted for
by a specific component. Each component has an eigenvalue, so the sum of all
eigenvalues equals the number of variables in a component analysis. In the screeplot of
Fig. 1 we graph the eigenvalues of the correlation matrix of the quantified variables. We
can observe that only the first two factors have eigenvalues larger than the unity. As a
result, the appropriate number of components to be chosen is two.
In Table 4 we present a summary of the models. Regarding CATPCA, the first two
factors account for almost 83% of the variance of the variables under analysis, indicating
a similar goodness of fit of the components as the obtained with the MDS model.
Table 5 shows the obtained component loadings, which we use to label the two
dimensions to which we have reduced the dataset to. We have applied Varimax rotation
to facilitate the interpretation of the components. The five factors with the highest
loadings in the first dimension are (Fig. 2): the rakings regarding the average growth of
overnight visitors, total expenditure, rooms, GDP and HDI. Therefore, the first dimension
better captures the aspects reflecting the development of the economy and the tourism
industry, whereas the second dimension those more related to the profitability of the
tourist activity at the destination level. Accordingly, we label the first dimension as
“tourist and economic development”, and the second as “economic performance of tourist
activity”.
15
Research Institute of Applied Economics Regional Quantitative Analysis Research Group
Working Paper 2017/13, pàg. 15 Working Paper 2017/07, pag. 15

Fig. 1. Scree plot
Table 4. Multivariate analysis – Summary
CATPCA Model MDS Model
Dimension Cronbach’s
alpha
Variance
Stress 0.17 Total
(eigenvalue)
% of
variance
1 0.85 3.65 45.62
2 0.79 2.98 37.24 RSQ 0.86
Total 0.97 6.63 82.87
Notes: *Cronbach’s alpha mean is based on the mean of the eigenvalue. Rotation method:
Varimax with Kaiser Normalisation. Kruskal’s stress values indicate the amount of
distortion in distances to tolerate. Stress values range from zero to one, zero indicating a
perfect representation of the input data in two dimensions. The RSQ stands for the squared
correlations in distances. RSQ values are the proportion of variance of the scaled data
(disparities) in the partition which is accounted for by their corresponding distances.
16
Research Institute of Applied Economics Regional Quantitative Analysis Research Group
Working Paper 2017/13, pàg. 16 Working Paper 2017/07, pag. 16
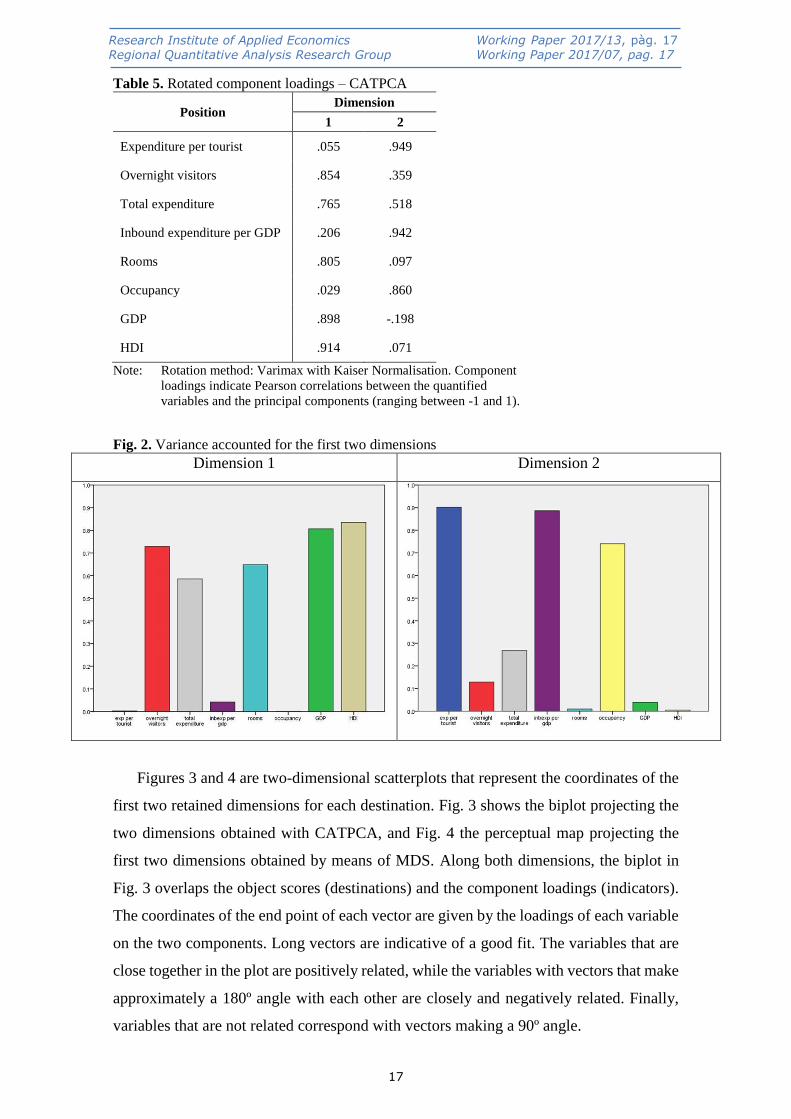
Table 5. Rotated component loadings – CATPCA
Position Dimension
1 2
Expenditure per tourist .055 .949
Overnight visitors .854 .359
Total expenditure .765 .518
Inbound expenditure per GDP .206 .942
Rooms .805 .097
Occupancy .029 .860
GDP .898 -.198
HDI .914 .071
Note: Rotation method: Varimax with Kaiser Normalisation. Component
loadings indicate Pearson correlations between the quantified
variables and the principal components (ranging between -1 and 1).
Fig. 2. Variance accounted for the first two dimensions
Dimension 1 Dimension 2
Figures 3 and 4 are two-dimensional scatterplots that represent the coordinates of the
first two retained dimensions for each destination. Fig. 3 shows the biplot projecting the
two dimensions obtained with CATPCA, and Fig. 4 the perceptual map projecting the
first two dimensions obtained by means of MDS. Along both dimensions, the biplot in
Fig. 3 overlaps the object scores (destinations) and the component loadings (indicators).
The coordinates of the end point of each vector are given by the loadings of each variable
on the two components. Long vectors are indicative of a good fit. The variables that are
close together in the plot are positively related, while the variables with vectors that make
approximately a 180º angle with each other are closely and negatively related. Finally,
variables that are not related correspond with vectors making a 90º angle.
17
Research Institute of Applied Economics Regional Quantitative Analysis Research Group
Working Paper 2017/13, pàg. 17 Working Paper 2017/07, pag. 17
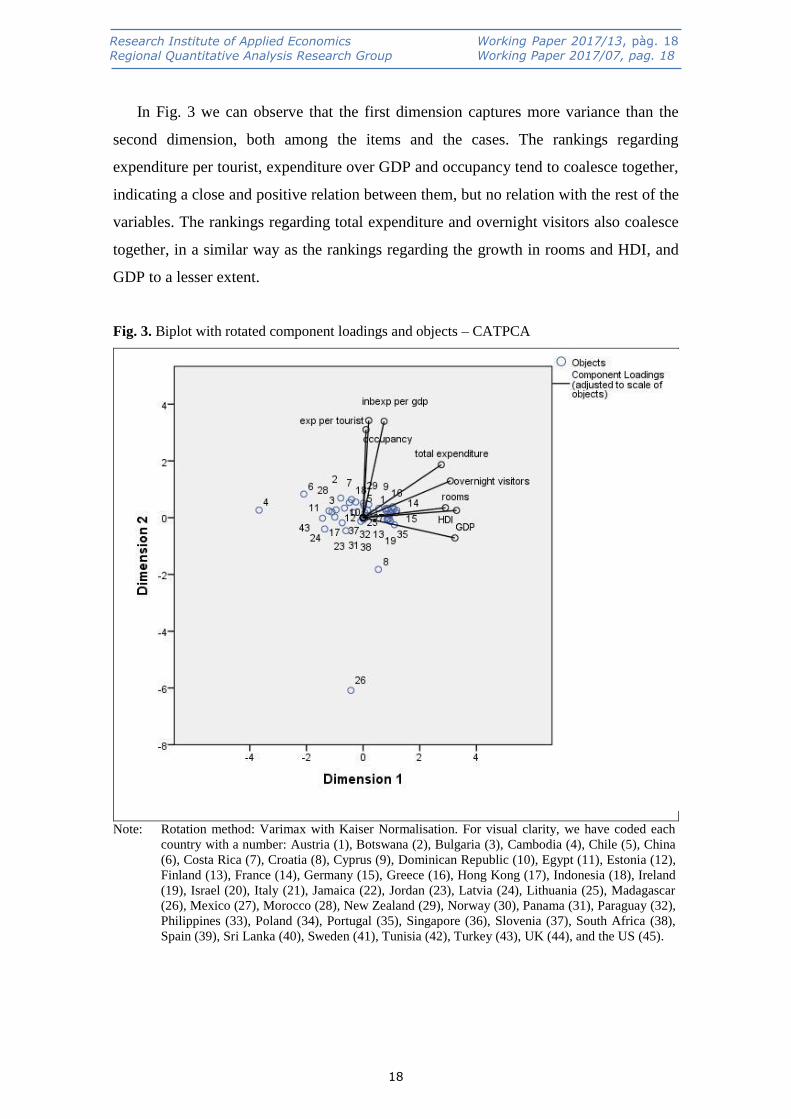
In Fig. 3 we can observe that the first dimension captures more variance than the
second dimension, both among the items and the cases. The rankings regarding
expenditure per tourist, expenditure over GDP and occupancy tend to coalesce together,
indicating a close and positive relation between them, but no relation with the rest of the
variables. The rankings regarding total expenditure and overnight visitors also coalesce
together, in a similar way as the rankings regarding the growth in rooms and HDI, and
GDP to a lesser extent.
Fig. 3. Biplot with rotated component loadings and objects – CATPCA
Note: Rotation method: Varimax with Kaiser Normalisation. For visual clarity, we have coded each
country with a number: Austria (1), Botswana (2), Bulgaria (3), Cambodia (4), Chile (5), China
(6), Costa Rica (7), Croatia (8), Cyprus (9), Dominican Republic (10), Egypt (11), Estonia (12),
Finland (13), France (14), Germany (15), Greece (16), Hong Kong (17), Indonesia (18), Ireland
(19), Israel (20), Italy (21), Jamaica (22), Jordan (23), Latvia (24), Lithuania (25), Madagascar
(26), Mexico (27), Morocco (28), New Zealand (29), Norway (30), Panama (31), Paraguay (32),
Philippines (33), Poland (34), Portugal (35), Singapore (36), Slovenia (37), South Africa (38),
Spain (39), Sri Lanka (40), Sweden (41), Tunisia (42), Turkey (43), UK (44), and the US (45).
18
Research Institute of Applied Economics Regional Quantitative Analysis Research Group
Working Paper 2017/13, pàg. 18 Working Paper 2017/07, pag. 18
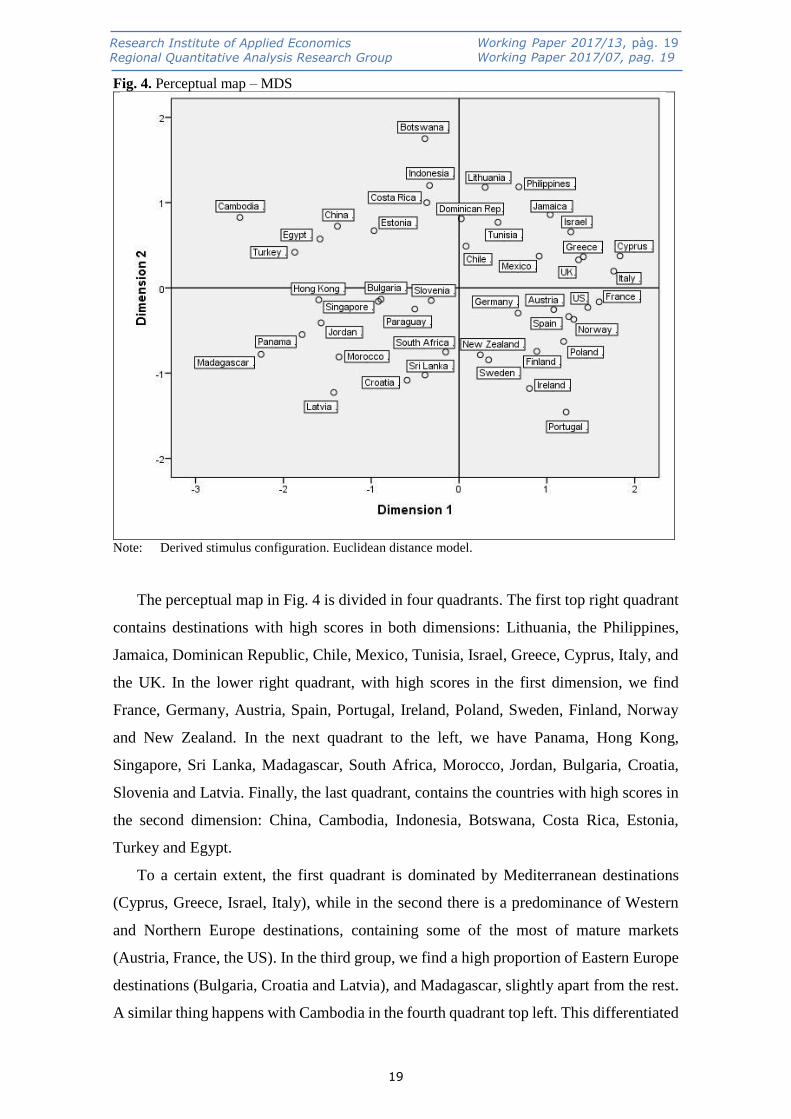
Fig. 4. Perceptual map – MDS
Note: Derived stimulus configuration. Euclidean distance model.
The perceptual map in Fig. 4 is divided in four quadrants. The first top right quadrant
contains destinations with high scores in both dimensions: Lithuania, the Philippines,
Jamaica, Dominican Republic, Chile, Mexico, Tunisia, Israel, Greece, Cyprus, Italy, and
the UK. In the lower right quadrant, with high scores in the first dimension, we find
France, Germany, Austria, Spain, Portugal, Ireland, Poland, Sweden, Finland, Norway
and New Zealand. In the next quadrant to the left, we have Panama, Hong Kong,
Singapore, Sri Lanka, Madagascar, South Africa, Morocco, Jordan, Bulgaria, Croatia,
Slovenia and Latvia. Finally, the last quadrant, contains the countries with high scores in
the second dimension: China, Cambodia, Indonesia, Botswana, Costa Rica, Estonia,
Turkey and Egypt.
To a certain extent, the first quadrant is dominated by Mediterranean destinations
(Cyprus, Greece, Israel, Italy), while in the second there is a predominance of Western
and Northern Europe destinations, containing some of the most of mature markets
(Austria, France, the US). In the third group, we find a high proportion of Eastern Europe
destinations (Bulgaria, Croatia and Latvia), and Madagascar, slightly apart from the rest.
A similar thing happens with Cambodia in the fourth quadrant top left. This differentiated
19
Research Institute of Applied Economics Regional Quantitative Analysis Research Group
Working Paper 2017/13, pàg. 19 Working Paper 2017/07, pag. 19

positioning is due to the fact that both countries experienced the highest average growth
rates for most variables during the sample period, displaying top positions in most tourist
indicators (Table 3). However, while Madagascar is in the first position with respect to
the average growth of the expenditure per tourist, Cambodia has the second lowest
average rate. This persistent growth of the tourism industry in Cambodia poses profound
challenges, especially in terms of profitability. Chens et al. (2008) found that in spite of
Cambodia’s endowed resources, the country needed supporting factors to increase its
competitiveness.
On the whole, both techniques depict a similar positioning of the destinations with
respect of the rankings in Table 3. The groupings are also consistent with the results of
the descriptive analysis in Section 3. These results show the potential of dimensionality
reduction and data visualization techniques for exploratory data analysis, as well as their
applicability as tools for the identification of key attributes in the positioning of tourism
destinations.
This evidence adds to previous studies by Assaf & Tsionas (2015), Claveria (2016,
2017), Huang & Peng (2012), and Yau & Chan (1990). Yau & Chan (1990) used MDS
to map seven cities of the Asia and the Pacific region regarding prices and range of
activities, and they also found that the market position of Singapore was close to that of
Hong Kong. Assaf & Tsionas (2015) ranked 101 countries according to 20 indicators of
quality grouped in three dimensions (infrastructure, human resources and nature), finding
that based on overall quality, Cambodia, Egypt and Madagascar were worse positioned
than the rest of the destinations analysed in the study. In their research, most of the
countries with low scores in infrastructure fell below the median, while Austria, the US,
the UK, France, New Zealand and Sweden were in the top positions.
5. Summary and concluding remarks
This study assesses the performance of data visualization techniques for the
positioning of tourism destinations. We compare the performance of CATPCA and MDS.
These techniques allow us to generate two-dimensional visual representations of large
datasets. Via perceptual maps we capture the strengths and weaknesses of destinations,
and allow visualizing the similarity between them.
First, the world’s 45 top destinations were ranked according to the average annual
growth experienced over the sample period for a set of tourism and economic indicators.
20
Research Institute of Applied Economics Regional Quantitative Analysis Research Group
Working Paper 2017/13, pàg. 20 Working Paper 2017/07, pag. 20
By means of two dimensionality reduction techniques for categorical data, all the
information was summarised into two components: “tourist and economic development”
and “economic performance of tourist activity”. Finally, two-dimensional projections
representing the coordinates of the first two retained dimensions for each country were
generated to map all destinations simultaneously.
We found that countries can be clustered into four different groups. The first one,
containing some of the destinations with the highest scores in both dimensions, is
dominated by Mediterranean countries (Cyprus, Greece, Israel, and Italy). In the second
group there is a predominance of Western and Northern Europe destinations, and it
contains some of the most of mature markets (Austria, France, and the US). The third
group, with low scores in the first dimension but high ones in the second, is the more
geographic diverse, with countries like Cambodia, China, Botswana, Egypt and Turkey.
Finally, in the group with low scores in both dimensions, we find a high proportion of
Eastern Europe destinations (Bulgaria, Croatia and Latvia).
The study aims to shed some light on how the interactions between the main tourist
and economic indicators ultimately affects the positioning of destinations. Given that the
analysis exclusively makes use of official data, it is easily replicable to different sets of
destinations. The proposed approach facilitates the identification of attributes that are
most relevant in positioning tourism destinations, and could thereby assist in monitoring
the evolution of destination competitiveness in an ever-changing tourism market, and in
the enhancement of destinations competitiveness.
Nevertheless, this is is a descriptive study, and inference cannot be made. Either for
lack of data, or the existence of outliers, there have been several issues left for further
research. An independent analysis by purpose of travel and the inclusion of additional
tourism indicators, such as the contribution of tourism to employment or the average
expenditure per day, would give further insight into the profitability and the contribution
of tourism development to economic growth. On the other hand, another question left for
future research is the implementation and assessment of artificial intelligence techniques
such as self-organizing maps in the positioning of the destinations.
Acknowledgements
We wish to thank Laura Muñoz and Jacinta García at the World Tourism Organization (UNWTO)
for providing us with the data used in this study. This paper has been partially financed by the
project ECO2016-75805-R of the Spanish Ministry of Economy and Competitiveness.
21
Research Institute of Applied Economics Regional Quantitative Analysis Research Group
Working Paper 2017/13, pàg. 21 Working Paper 2017/07, pag. 21

References
Altinay, L., & Bowen, D. (2006). Politics and tourism interface: The case of Cyprus.
Annals of Tourism Research, 33(4), 939–956.
Andreu, L., Bigné, J. E., & Cooper, C. (2000). Projected and perceived image of Spain
as a tourist destination for British travellers. Journal of Travel and Tourism
Marketing, 9(4), 47–67.
Arimond, G., & Elfessi, A. (2001). A clustering method for categorical data in tourism
market segmentation research. Journal of Travel Research, 39(4), 391–397.
Assaf, A. G., & Tsionas, E. G. (2015). Incorporating destination quality into the
measurement of tourism performance: A Bayesian approach. Tourism Management,
49, 58–71.
Balaguer, J., & Cantavella-Jordá, M. (2002). Tourism as a long-run economic growth
factor: The Spanish case. Applied Economics, 34(7), 877–884.
Bloom, J. Z. (2005). Market segmentation: A neural network application. Annals of
Tourism Research, 32(1), 93–111.
Borg, I., & Groenen, P. J. F. (2005). Modern multidimensional scaling: Theory and
applications (2nd Ed.). New York: Springer-Verlag.
Borg, I., Groenen, P. J. F., Patrick, M. (2013). Applied multidimensional scaling. Berlin:
Springer-Verlag.
Brida, J. G., Cortes-Jimenez, I., & Pulina, M. (2016). Has the tourism-led growth
hypothesis been validated? A literature review. Current Issues in Tourism, 19(5),
394–430.
Capó, J., Riera, A., & Rosselló, J. (2007). Tourism and long-term growth. A Spanish
perspective. Annals of Tourism Research, 34(3), 709–726.
Chandra, S., & Menezes, D. (2001). Applications of multivariate analysis in
international tourism research: The marketing strategy perspective of NTOs. Journal
of Economic and Social Research, 3(1), 77–98.
Chens, C. Y., Sok, P., & Sok, K. (2008). Evaluating the competitiveness of the tourism
industry in Cambodia: Self-assessment from professionals. Asia Pacific Journal of
Tourism Research, 13(1), 41–66.
Chheang, V. (2008). The political economy of tourism in Cambodia. Asia Pacific
Journal of Tourism Research, 13(3), 281–297.
Chhetri, P., Arrowsmith, C., & Jackson, M. (2004). Determining hiking experiences in
nature-based tourism destinations. Tourism Management, 25(1), 31–43.
Chou, M. C. (2013). Does tourism development promote economic growth in transition
countries? A panel data analysis. Economic Modelling, 33, 226–232.
Chu, H. P., Yeh, M. L., & Chang, T. Y. (2014). Are visitor arrivals to China stationary?
An empirical note. Asia Pacific Journal of Tourism Research, 19(2), 248–256.
Claveria, O. (2016). Positioning emerging tourism markets using tourism and economic
indicators. Journal of Hospitality and Tourism Management, 29, 143–153.
Claveria, O. (2017). Two-dimensional mapping of Asia Pacific destinations combining
tourism and economic indicators. Asia Pacific Journal of Tourism Research, 22(7),
720–734.
Claveria, O., Monte, E., & Torra, S. (2016). A self-organizing map analysis of survey-
based agents’ expectations before impending shocks for model selection: The case of
the 2008 financial crisis. International Economics, 146, 40–58.
22
Research Institute of Applied Economics Regional Quantitative Analysis Research Group
Working Paper 2017/13, pàg. 22 Working Paper 2017/07, pag. 22

Claveria, O., & Poluzzi, A. (2017). Positioning and clustering of the world’s top tourist
destinations by means of dimensionality reduction techniques for categorical data.
Journal of Destination Marketing & Management, 6(1), 22–32.
Cohen, S. A., Prayag, G., & Moital, M. (2014). Consumer behaviour in tourism:
Concepts, influences and opportunities. Current Issues in Tourism, 17(10), 872–909.
Correia, A., Oom do Valle, P., & Moço, C. (2007). Modeling motivations and
perceptions of Portuguese tourists. Journal of Business Research, 60(1), 76–80.
Cortes-Jimenez, I., Nowak, J., & Sahli, M. (2011). Mass beach tourism and economic
growth: Lessons from Tunisia. Tourism Economics, 17(3), 531–547.
Croes, R. (2011). Measuring and explaining competitiveness in the context of small
island destinations. Journal of Travel Research, 50(4), 431–442.
Crompton, J. L., Fakeye, P. C., & Lue, C. (1992). Positioning: The example of the
Lower Rio Grande Valley in the winter long stay destination market. Journal of
Travel Research, 31, 20–26.
Crouch, G. I., & Ritchie, J. R. B. (1999). Tourism, competitiveness and social
prosperity. Journal of Business Research, 44(3), 137–152.
Crouch, G., & Ritchie, J. R. B. (2006). Competitiveness and tourism. In L. Dwyer & P.
Forsyth (Eds.), International Handbook on the Economics of Tourism (pp. 419–433).
Cheltenham: Edward Elgar Publishing.
Dey, B., & Sarma, M. K. (2010). Information source usage among motive-based
segments of travellers to newly emerging tourist destinations. Tourism Management,
31(3), 341–344.
Donaire, J. A., Camprubí, R., & Galí, N. (2014). Tourist clusters from Flickr travel
photography. Tourism Management Perspectives, 11, 26–33.
Durbarry, R. (2004). Tourism and economic growth: the case of Mauritius. Tourism
Economics, 10(4), 389–401.
Fentom, M., & Pearce, P. (1988). Multidimensional scaling and tourism research.
Annals of Tourism Research, 15, 236–254.
Gartner, W. C. (1989). Tourism image: Attribute measurement of state tourism products
using multidimensional scaling techniques. Journal of Travel Research, 28, 16–20.
Gifi, A. (1990). Nonlinear multivariate analysis. Chichester, England: Wiley.
Green, R. (2005). Community perceptions of environmental and social change and
tourism development on the island of Koh Samui, Thailand. Journal of
Environmental Psychology, 25(1), 37–56.
Gursoy, D., Baloglu, S., & Chi, C. G. (2009). Destination competitiveness of Middle
Eastern countries: An examination of relative positioning. Anatolia, 20(1), 151–163.
Guttman, L. (1954). Some necessary and sufficient conditions for common factor
analysis. Psychometrika, 19(2), 149–161.
Haahti, A. J. (1986). Finland’s competitive position as a destination. Annals of Tourism
Research, 13(1), 11–35.
Hair, J. F., Black, W. C., Babin, B. J., & Anderson, R. E. (2009). Multivariate data
analysis (7th Ed.). Upper Saddle River, NJ: Prentice Hall.
Hastie, T., & Stuetzle, W. (1989). Principal curves. Journal of the American Statistical
Association, 84 (406), 502–516.
Huang, J. H., & Peng, K. H. (2012). Fuzzy Rasch model in TOPSIS: A new approach
for generating fuzzy numbers to assess the competitiveness of the tourism industries
in Asian countries. Tourism Management, 33(2), 456–465.
Jolliffe, I. T. (2002). Principal component analysis (2nd Ed.). Springer Series in
Statistics.
Kaiser, H. F. (1960). The application of electronic computers to factor analysis.
Educational and Psychological Measurement, 20, 141–151.
23
Research Institute of Applied Economics Regional Quantitative Analysis Research Group
Working Paper 2017/13, pàg. 23 Working Paper 2017/07, pag. 23

Kayar, C. H., & Kozak, N. (2010). Measuring destination competitiveness: An
application of the Travel and Tourism Competitiveness Index (2007). Journal of
Hospitality Marketing & Management, 19(3), 203–216.
Keng, K. A., & Cheng, J. L. (1999). Determining tourist role typologies: An exploratory
study of Singapore vacationers. Journal of Travel Research, 37 (4): 382–390.
Kim, H. (1998). Perceived attractiveness of Korean destinations. Annals of Tourism
Research, 25(2), 340–361.
Kim, S. S., & Agrusa, J. (2005). The positioning of overseas honeymoon destinations.
Annals of Tourism Research, 32(4), 887–904.
Kim, S. S., Chun, H., & Petrick, J. F. (2005). Positioning analysis of overseas golf tour
destinations by Korean golf tourists. Tourism Management, 26(6), 905–917.
Kohonen T. (2001). Self-organizing maps. Springer: Berlin.
Kramer, M. A. (1991). Nonlinear principal component analysis using autoassociative
neural networks. AIChE Journal, 37(2), 233–243.
Lee, C. K., Lee, Y. K., Bernhard, B. J., & Yoon, Y. S. (2006). Segmenting casino
gamblers by motivation: A cluster analysis of Korean gamblers. Tourism
Management, 27(5), 856–866.
Lee, K., & Ha, I. S. (2012). Exploring the impacts of key economic indicators and
economic recessions in the restaurant industry. Journal of Hospitality Marketing &
Management, 21 (3), 330–343.
Leung, X. Y., & Baloglu, S. (2013). Tourism competitiveness of Asia Pacific
destinations. Tourism Analysis, 18(4), 371–384.
Li, X. (Robert), Cheng, C., Kim, H., & Li, X. (2015). Positioning USA in the Chinese
outbound travel market. Journal of Hospitality & Tourism Research, 39(1), 75–104.
Li, G., Song, H., Cao, Z., & Wu, D. C. (2013). How competitive is Hong Kong against
its competitors? An econometric study. Tourism Management, 36, 247–256.
Lim, C., & McAleer, M. (2002). Time series forecasts of international travel demand for
Australia. Tourism Management, 23(4), 389–396.
Linting, M., Meulman, J. J., Groenen, P. J. F., & Van der Kooij, A. J. (2007). Nonlinear
principal component analysis: Introduction and application. Psychological Methods,
12(3), 336–358.
Liu, Y., & Weisberg, R. H. (2005). Patterns of ocean current variability on the west
Florida shelf using the self-organizing map. Journal of Geophysical Research,
110(C6), 1–12.
Lozano, S., & Gutiérrez, E. (2011). Efficiency analysis of EU-25 member states as
tourist destinations. International Journal of Services Technology and Management,
15(1/2), 69–88.
Maguigad, V. M. (2013). Tourism planning in archipelagic Philippines: A case review.
Tourism Management Perspectives, 7, 25–33.
Marcussen, C. H. (2011). Visualising groups of European destinations. European
Journal of Travel Research, 4(2), 180–190.
Marcussen, C. H. (2014). Multidimensional scaling in tourism literature. Tourism
Management Perspectives, 12, 31–40.
Mariani, M. M., Buhalis, D., Longhi, C., & Vitouladiti, O. (2014). Managing change in
tourism destinations: Key issues and current trends. Journal of Destination
Marketing & Management, 2(4), 269–272.
Meng, X., Siriwardana, M., & Pham, T. (2013). A CGE assessment of Singapore’s
tourism policies. Tourism Management, 34, 25–36.
Meulman, J. J., Heiser, W. J., & SPSS. (2012). SPSS Categories 20.0. Chicago, Illinois:
SPSS.
24
Research Institute of Applied Economics Regional Quantitative Analysis Research Group
Working Paper 2017/13, pàg. 24 Working Paper 2017/07, pag. 24

Novak, M., Petrić, L., & Pranić, L. (2011). The effects of selected macroeconomic
variables on the presence of foreign hotels in Croatia. Tourism and Hospitality
Management, 17 (1), 45–65.
Nowak, J., Sahli, M., & Cortes-Jimenez, I. (2007). Tourism, capital goods imports and
economic growth: theory and evidence for Spain. Tourism Economics, 13(4), 515–
536.
Oh, C. O. (2005). The contribution of tourism development to economic growth in the
Korean economy. Tourism Management, 26(1), 39–44.
Omerzel, D. G. (2006). Competitiveness of Slovenia as a Tourist Destination. Managing
Global Transitions, 4(2), 167–189.
Park, D. B., & Yoon, Y. S. (2009). Segmentation by motivation in rural tourism: A
Korean case study. Tourism Management, 30(1), 99–108.
Pérez-Rodríguez, J. V., Ledesma-Rodríguez, F., & Santana-Gallego, M. (2015). Testing
dependence between GDP and tourism's growth rates. Tourism Management, 48,
268–282.
Peypoch, N., Randriamboarison, R., Rasoamananjara, F., & Solonandrasan, B. (2012).
The length of stay of tourists in Madagascar. Tourism Management, 33(5), 1230–
1235.
Pike, S. (2002). Destination image analysis – A review of 142 papers from 1973 to
2000. Tourism Management, 23(5), 541–549.
Pranić, L., Ketkar, S., & Roehl, W. S. (2012). The impact of macroeconomic country-
specific factors on international expansion of US hotel chains. Tourismos, 7 (1), 155–
173.
Rid, W., Ezeuduji, I. O., & Pröbstl-Haider, U. (2014). Segmentation by motivation for
rural tourism activities in The Gambia. Tourism Management, 40, 102–116.
Santana-Gallego, M., Ledesma-Rodríguez, F. J., & Pérez-Rodríguez, J. V. (2010).
Exchange rate regimes and tourism. Tourism Economics, 16(1), 25–43.
Santana-Gallego, M., Ledesma-Rodriguez, F. J., & Perez-Rodriguez, J. V. (2011).
Tourism and trade in small island regions: The case of the Canary islands. Tourism
Economics, 17(1), 107–125.
Sarlin, P., & Peltonen, T. A. (2013). Mapping the state of financial stability. Journal of
International Financial Markets, Institutions & Money, 26, 46–76.
Schölkopf, B., Smola, A. J., & Müller, K. (1988). Nonlinear component analysis as a
kernel eigenvalue problem. Neural Computation, 10(5), 1299–1319.
Schubert, S. F., & Brida, J. G. (2009). Macroeconomic effects of changes in tourism
demand: A simple dynamic model. Tourism Economics, 15(3), 591–613.
Schubert, S. F., Brida, J. G., & Risso, W. A. (2011). The impacts of international
tourism demand on economic growth of small economies dependent on tourism.
Tourism Management, 32, 377–385.
Seo, J. H., Park, S. Y., & Boo, S. (2010). Interrelationships among Korean outbound
tourism demand: Granger causality analysis. Tourism Economics, 16(3), 597–610.
Sharma, S. (1996). Applied multivariate techniques. New York: Wiley and Sons.
Sinclari-Maragh, G., Gursoy, D., & Vieregge, M. (2015). Residents' perceptions toward
tourism development: A factor-cluster approach. Journal of Destination Marketing &
Management, 4(1), 36–45.
Song, H., Dwyer, L., Li, G., & Cao, Z. (2012). Tourism economics research: A review
and assessment. Annals of Tourism Research, 39(3), 1653–1682.
Sun, J., Zhang, J., Zhang, J., Maa, J., & Zhang, Y. (2015). Total factor productivity
assessment of tourism industry: Evidence from China. Asia Pacific Journal of
Tourism Research, 20(3), 942–953.
25
Research Institute of Applied Economics Regional Quantitative Analysis Research Group
Working Paper 2017/13, pàg. 25 Working Paper 2017/07, pag. 25

Tang, X. (2017). The historical evolution of China's tourism development policies
(1949–2013) – A quantitative research approach. Tourism Management, 58, 259–
269.
Torgerson, W. S. (1952). Multidimensional scaling: I. Theory and method.
Psychometrika, 17(4), 401–419.
Torraleja, F. G., Vázquez, A. M., & Franco, M. J. B. (2009). Flows into tourist areas:
An econometric approach. International Journal of Tourism Research, 11(1), 1–15.
UNWTO (2015). UNWTO Tourism highlights, 2015 Edition. UNWTO (http://www.e-
unwto.org/doi/book/10.18111/9789284416899).
UNWTO (2016). UNWTO Tourism highlights, 2016 Edition. UNWTO
(http://mkt.unwto.org/publication/unwto-tourism-highlights-2016-edition).
Upchurch, R. S, Ellis, T., & Seo, J. (2004). Applying the hierarchical cluster analysis
procedure upon the process of yield management—A comparative study. Journal of
Travel & Tourism Marketing, 16(4), 47–58.
Uysal, M., Chen, J., & Williams, D. R. (2000). Increasing state market share through a
regional positioning. Tourism Management, 21(1), 89–96.
Voges, K. E. (2007). Rough clustering of destination image data using an evolutionary
algorithm. Journal of Travel & Tourism Marketing, 21(4), 121–137.
Wang, Y. C., & Pizam, A. (2011). Destination marketing and management: Theories
and applications. Oxford: CABI.
Wang, Y. S. (2009). The impact of crisis events and macroeconomic activity on
Taiwan’s international inbound tourism demand. Tourism Management, 30(1), 75–
82.
Wish, M., Deutsch, M., & Biener, L. (1970). Differences in conceptual structures of
nations: An exploratory study. Journal of Personality and Social Psychology, 16(3),
361–373.
Wong, K. N., & Tang, T. C. (2010). Tourism and openness to trade in Singapore:
Evidence using aggregate and country-level data. Tourism Economics, 16(4), 965–
980.
Yau, O. H. M., & Chan, C. F. (1990). Hong Kong as a travel destination in South-East
Asia: A multidimensional approach. Tourism Management, 11(2), 123–132.
Yeomans, K. A., & Golder, P. A. (1982). The Guttman-Kaiser criterion as a predictor of
common factors. Journal of the Royal Statistical Society. Series D (The Statistician),
31(3), 221–229.
Zarate-Solano, H. M., & Zapata-Sanabria, D. R. (2017). Clustering and forecasting
inflation expectations using the World Economic Survey: The case of the 2014 oil
price shock on inflation targeting countries. Borradores de Economía, 993.
Zins, A. H. (2010). Mapping beneficial destination images. Journal of Hospitality and
Tourism Management, 17, 96–107.
26
Research Institute of Applied Economics Regional Quantitative Analysis Research Group
Working Paper 2017/13, pàg. 26 Working Paper 2017/07, pag. 26

Institut de Recerca en Economia Aplicada Regional i Pública Document de Treball 2014/17, pàg. 5 Research Institute of Applied Economics Working Paper 2014/17, pag. 5