Embed Size (px)
Citation preview


M.I.T. LIBRARIES - DEWEY

Digitized by the Internet Archive
in 2011 with funding from
Boston Library Consortium Member Libraries
http://www.archive.org/details/whatpricescantelOOelli

t ! ! tfg ^
B31M415
5-10
working paper
department
of economics
massachusetts
institute of
technology
50 memorial drive
Cambridge, mass. 02139


WORKING PAPER
DEPARTMENTOF ECONOMICS
WHAT PRICES CAN TELL US ABOUTTHE MARKET FOR ANTIBIOTICS
Sara Fisher Ellison
98-10 July, 1998
MASSACHUSETTSINSTITUTE OF
TECHNOLOGY
50 MEMORIAL DRIVE
CAMBRIDGE, MASS. 02142

ETTS INSTITUTE^TECHNOLOGY
SEP 1 6 1998
LIBRARIES

What Prices Can Tell Us About the Market for Antibiotics
Sara Fisher Ellison 1
July, 1998
1MIT; I would like to thank Ernie Berndt, Glenn Ellison, Nancy Rose, Christopher Snyder, and
Peter Temin for helpful comments. This paper grew out of a collaboration with Judy Hellerstein,
'
and it has benefitted from many discussions with her. I also thank Nada Mora and Jeff Wilder for
excellent research assistance. Finally, I gratefully acknowledge funding from Eli Lilly through their
grant to the NBER.


Abstract
This paper is a study of pricing of wholesale antibiotics over the period from 1985 to
1996. The period included a number of political events and public debates concerning
pharmaceuticals. Drug prices offer a valuable lens through which we can see the effects of
these events and also shed light on public perceptions about drug prices and price growth.
In addition, drug prices give us information about changing market structure and, given
unique institutions in pharmaceutical markets, provide a tool for observing the sources and
effects of monopsony power. Among the paper's findings are the following: First, overall,
price growth has been very modest over the last decade, well below that of corresponding
government indexes. Second, branded manufacturers on average have positive price growth
whereas generic manufacturers on average have lower prices and negative price growth.
Third, there are significant and persistent differences across wholesale markets in price
levels and price growth. For instance hospitals consistently pay much lower prices than
drugstores, but there are relatively small differences across different types of drugstores,
such as small independents and large chains. These differences are interpreted in light of
the changing structure of the wholesale market for pharmaceuticals, including a discussion
of the importance of restrictive formularies in establishing monopsony power. Finally, in
constrast with the salient, effect of these market forces on drug prices, I find relatively little
evidence of effects of major events, such as the generic drug scandal and debate surrounding
healthcare reform.
Sara Fisher Ellison
MIT
Department of Economics E52-274a
50 Memorial Drive
Cambridge MA 02142-1347


1 Introduction
Political debate and the popular press over the past ten years have been concerned with
pharmaceutical prices to an extraordinary degree in a variety of settings: from the Catas-
trophic Health Insurance Bill to proposals for Medicare coverage of drugs, from healthcare
reform to voluntary price restraints, from the effect of managed care on drug prices to
price discrimination lawsuits brought against the manufacturers. Reports on pharmaceuti-
cal prices captivate the public, cause outrage from consumers' groups, industry groups, or
both, and provide fodder for a seemingly endless string of Congressional hearings and leg-
islative proposals. My purpose is to use a systematic study of antibiotics prices to establish
facts about price levels and growth rates, look for effects—both overall and differential
—
of legal changes and political climates on prices, shed light on public discussions of drug
prices, and use antibiotics prices as a tool to study the changing structure of the market
for pharmaceuticals.
To document price patterns, I compute price indexes from a data set that is unusually
rich in both its length and its cross-sectional detail. I can construct a monthly wholesale
price index for one subclass of antibiotics over eleven years ending in 1996. I can also
offer a more detailed picture of pricing across a variety of wholesale markets—independent
drugstores, HMOs, federal hospitals, clinics, for instance—for a shorter period. Finally,
I can identify manufacturers' characteristics in order to examine, for example, branded-
generic price differences.
To complement the examination of pricing patterns, I present a timeline of events rel-
evant, to pharmaceutical pricing. The timeline was constructed mainly from popular press
accounts of political, legislative, and legal events that could affect pricing as well as ac-
counts on attitudes and perceptions of prescription pharmaceutical pricing. It is essentially
an attempt to reconstruct the atmosphere in which these pricing decisions were made and
identify important general factors. A study of prices can shed light on public perceptions
about drug prices and price growth. Drug prices also offer a valuable lens through which
The Bureau of Labor Statistics uses "indexes," not "indices," as the plural form. I am not one to argue
with the U.S. government over grammar.

we can see the effects of certain events. We will look for overall effects on prices, but in
some cases also for differential effects across various segments of the antibiotics market.
This study presents a number of findings. First, overall price growth has been very
modest over the last decade, well below that of corresponding government indexes. Second,
branded manufacturers on average have positive price growth whereas generic manufactur-
ers on average have lower prices and negative price growth. Third, there are significant and
persistent differences across wholesale markets in price levels and price growth. For instance
hospitals consistently pay much lower prices than drugstores, but there are relatively small
differences across different types of drugstores, such as small independents and large chains.
These differences are interpreted in light, of the changing structure of the wholesale market
for pharmaceuticals, including a discussion of the importance of restrictive formularies in
establishing market power. Finally, in constrast with the salient effect of these market
forces on drug prices, there is little, if any, evidence of effects of several major events, such
as the generic drug scandal and debate surrounding healthcare reform.
A large literature on questions related to the pricing of pharmaceuticals precedes this
study. 2 At least, three recent, articles focus on antibiotics in particular and enrich the stock
of pricing facts which we are establishing. Griliches and Cockburn (1994) look at, two
antibiotics over the time period 1984-1991, which experienced generic entry. They find
increasing branded price both before and after generic entry, decreasing generic price, and
generic entry at, between 60% and 80% of branded price. Ellison, et alv (1997) look at pric-
ing patterns of four antibiotics from 1985-1991 as a prelude to an estimation of a demand
system. They find that, two of the four branded manufacturers charged prices to hospitals
that, were lower and slower-growing than those charged to drugstores. Hospital and drug-
store prices were comparable for the other two branded drugs. They also find that, generic
prices tended to drop over time, that generic hospital and drugstore prices were similar,
and that generics entered anywhere from 40% to 100% of the branded price. Wiggins and
Maness (1995) look at the entire class of antibiotics from 1984-1990. First, they find that
2See, for example, Caves, Whinston, and Hurwitz (1991), Grabowski and Vernon (1992), and
Schweitzer(1997).

the existence of one generic manufacturer of a drug relative to no generic is associated with
an average price of that drug about 50% lower. Additional generic manufacturers beyond
one are associated with a significant but smaller difference. Furthermore, they find price
decreases after generic entry even when looking at branded manufacturers alone. 3
The remainder of the paper is structured as follows: Section 2 is a chronology culled
from the contemporary popular press of events and perceptions relevant to pharmaceu-
tical pricing over the past ten years. Section 3 is a description of data sets. Section 4
is a documentation and discussion of overall price trends of antibiotics. Section 5 is an
examination of pricing across different wholesale purchasers, for example, prices paid by
hospitals compared with those paid by drugstores. Section 6 is an examination of pricing
differences between branded and generic manufacturers. Section 7 is a discussion of official
pharmaceutical price indexes. Section 8 concludes.
2 Chronology
The time period under consideration begins in October 1985, a year after passage of the
Drug Price Competition and Patent-term Restoration Act of 1984 (commonly referred to
as the Waxman-Hatch Act), which lifted substantial barriers to generic entry into many
therapeutic categories. Note that provisions similar to those in Waxman-Hatch had already
been in place for antibiotics for decades (see Hellerstein (1995)), one reason why generic
entry into antibiotics had historically been so substantial. After the start of our time
period, the first event of some note is a series of Congressional proposals to mandate
Medicare coverage of prescription drugs under some circumstances. Medicare coverage
of drugs is a recurrent theme is Congressional debate, in part because the elderly are a
politically strong interest group and their consumption of prescription drugs is relatively
high. Representative Henry Waxman proposes such legislation in June 1987, along with
the requirement that Medicare coverage only be provided for the lowest-priced version
among a set of bioequivalent drugs (i.e., typically only for a generic version when one
For historical perspectives and longer horizon discussions of the pricing of antibiotics, see Schwartzman
(1976) and Temin (1980).

was available). Similar proposals are included in the Catastrophic Health Insurance Bill
debated in Congress in mid-1988 (The Washington Post, 1987b, 1988). Nothing comes of
these proposed pieces of legislation, but in the course of these debates, much is made of the
rapid rise in prescription drug prices. "A new congressional study shows that prescription
drug prices have risen more than four times the inflation rate in the past two years .... 'I
don't think we can ask older people of fixed incomes to pay these kinds of price increases,'
[Rep. Waxman] said (The Washington Post 1987a)."
Then, starting in July of 1988, public scrutiny shifts as a scandal involving several
manufacturers of generic drugs starts to break. The scandal involves allegations of Food
and Drug Administration (FDA) favoritism in granting approval of generic drugs, payoffs
by manufacturers to FDA officials, and substitution of other manufacturers' drugs in the
preapproval testing process. The scandal crescendoes over the next year, resulting in fines
and jail sentences for several FDA officials and drug company executives as well as a public
loss of confidence in the reliability of generic drugs. "For the consumer, the scandal raises
doubts about the industry that provides one third of all the drugs Americans swallow, sip
and inject into their bodies (The Washington Post, 1989)." Proposals involving mandated
generic substitution in government purchasing of drugs are tabled. In fact it is reported
that "as the current crisis continues to hold the public spotlight, many health officials fear
that one of the most effective ways to hold down medical costs for the consumer may now
be in serious jeopardy (The Washington Post, 1989)." In November 1989 the head of the
FDA resigns, and less than a year later David Kessler is chosen to replace him.
Despite the favoritism and payoffs, no compromise of drug quality is found. As the
scandal fades from public view and confidence is restored in generic manufacturers and the
FDA, branded manufacturers once again come under scrutiny. The years 1990 and 1991
bring growing public concern over prescription drug prices expressed in both the tragic
and the comic. In 1990 hearings of the Senate Labor and Human Resources Committee, a
former drug company official testifies " 'The price of prescription drugs is determined by
what the market will bear,' he said. 'Pain, suffering, and desperation will support a high
price' (The Washington Post, 1990b)." Also, Art Buchwald writes,

The price of prescription drugs rose 153 percent during the '80s and is going
still higher. Pills cost so much that Americans are now buying them for invest-
ment rather than for curing an ailment .... 'That's a tranquilizer,' Tom said.
'Sotheby's sold one like it last week for $18,000 ...' (The Washington Post,
1991).
Such concern prompts Merck & Co. to announce voluntary price restraints (amounting
to a pledge not to raise prices faster than inflation) in 1990 and to publicly scold its
competitors for large price increases in 1991. Merck's CEO Roy Vagelos says " 'It is clear
that the U.S. public and our congressmen and senators are focusing on health-care costs
.... People are really concerned . . . and drug prices are such an obvious target'(The Wall.
Street Journal, 1991)." (Several other leading manufacturers will join Merck's voluntary
price restraints a few years later in the midst of the debate on healthcare reform.)
Also in 1990 Congress becomes concerned over Medicaid drug costs. Medicaid, unlike
Medicare, does provide prescription pharmaceutical coverage, and a proposal requiring
that Medicaid only provide the coverage for the least expensive drug (i.e., generic, when
available) is defeated. Instead, a plan by which each drug company must charge Medicaid
the lower of its "best" wholesale price or approximately 15% off its current inflation-indexed
average manufacturer's price4 (The Los Angeles Tim.es, 1990, The Washington Post, 1990a)
is passed and slated to go into effect in January of 1991.
There is some speculation in the industry that such a provision will cause firms to
eliminate deep discounts given to some wholesale customers (such as hospitals and HMOs).
Such action would have two effects, decreasing wholesale price dispersion and also raising
the average wholesale price. Accounts in the popular press about the effect of "best price"
lag imposition of the reform by a couple of years, though. The two quotations below
illustrate this recognition (although the economic reasoning in the first is sketchy at best).
[The Medicaid best price provision] indirectly raised drug costs for some
hospitals, as drug companies raised their "best price" to offset the required
The average manufacturer's price is the average price charged by wholesalers for products distributed
to the retail class of trade (U.S. Congress, Office of Technology Assessment (1993)).

discounts to Medicaid. For example, just as the "best price" provision began
to take effect last, year, Duke University Medical Center was renegotiating the
contracts under which it buys more than $15 million worth of prescription drugs
a year, said James McAllister, Duke's director of pharmacy. "Almost, overnight,
Duke's collective drug bill went up 22 percent, more than double the previous
year's increase" (The Washington Post, 1992).
Best-price is working brilliantly for its proponents. By forcing drugmakers to
extend discounts to Medicaid for no additional business, it makes price cutting
far more expensive. The manufacturers' response is simple: On many drugs, no
buyer gets a discount deeper than Medicaid's 15.7%. The losers are the most
powerful buyers like HMOs and hospitals, which frequently received discounts
of 40%, 50%, or more {Fortune, 1993b).
During much of this period, there is a vague public discussion of the need for healthcare
reform, but the discussion heats up considerably during the 1992 Presidential campaign. 5
In September of 1992, then-candidate Clinton gives a speech at Merck discussing the need
for reform but offering few specifics. The speech is generally well-received by the industry.
After Hillary Rodham Clinton is appointed the head of the Healthcare Task Force in January
of 1993 and leaks about the Task Force's attitude toward drug prices surface later in the
spring of 1993, prospects for the pharmaceutical industry dim significantly.
As part of a plan to transform the cost and delivery of health care, the
Clinton Administration has launched a scalding attack on drugmakers, fanning
public outrage over their high prices. The presidential task force, headed by
Hillary Rodham Clinton, has threatened to shackle the industry with price
controls and other onerous regulations (Fortune, 1993a).
The prospects of the industry are reflected in a huge decrease, over 40% by one measure, 6
5Much of the chronology and discussion of healthcare reform in the Clinton Administration is based on
The System by Johnson and Biodei.
6See Ellison and Mullin (1997).

in the market-adjusted value of a portfolio of pharmaceutical stocks over the year during
which the healthcare reform plan is being formulated. The most precipitous decline occurs
in the spring months, after leaks about price controls.
In March several pharmaceutical companies announce "voluntary" price restraint, essen-
tially keeping price increases at, the rate of inflation (The San Francisco Chronicle, 1993).
The Task Force disbands at the end of May, and in September of 1993, the President's
Health Security Plan is first, leaked and then officially unveiled before Congress. The plan
does not include price controls for pharmaceuticals. Instead it proposes to control costs of
pharmaceuticals by giving the purchasers more "buying clout."
Under reform, with the addition of prescription drug coverage, Medicare
will become the world's largest purchaser of drugs. And the Medicare program
will use its negotiating power to get discounts from the pharmaceutical compa-
nies. In addition, with competing health plans trying to become more efficient,
more and more buyers will use the same successful negotiating techniques(The
President's Health Security Plan, 1993).
October of 1993 marks the high point for the political prospects of healthcare reform
(Johnson and Broder (1996)). The demise of the Clinton Plan is gradual, beginning soon
after its official unveiling, continuing with announcements of various business and con-
sumer interest groups that they would oppose it (For example, The Business Roundtable
announces opposition to the plan in February), and culminating with a statement by Demo-
cratic Congressional leaders in July of 1994 that the Clinton Plan is dead.
In the midst of debate on healthcare reform, and perhaps prompted by discussions on
differential "buying clout" in the market for pharmaceuticals, the first of a series of lawsuits
alleging illegal price discrimination under the Robinson-Patman Act is filed against certain
pharmaceutical manufacturers by a group of drugstores(The New York Times Abstracts,
1993). More lawsuits follow through October of 1994 (Dow Jones News Service Ticker,
1994).
The suits, filed in federal court, allege that manufacturers violate antitrust

laws by giving mail order drug companies and HMOs a big break on price not
available to community drugstores. The breaks, which are said sometimes to
range up to 80 percent, are in return for their steering patients to the manufac-
turers' products, according to the suits (Chicago Tribune, 1994).
The main argument in the lawsuits is that pharmaceutical manufacturers are charging
lower wholesale prices to some customers, such as HMOs, than to drugstore chains and
independents, that these price differences are not based on volume of purchase, a type
of discrimination allowed under the Robinson-Patman Act, and that these wholesale pur-
chasers sometimes compete in the retail market. Previously, there had been widespread
recognition that the wholesale prices charged to hospitals were lower than those charged
to drugstores. The markets were largely separate, though, in the sense that a consumer's
choice between purchasing a drug in a hospital or pharmacy was determined entirely by
whether he was a patient in that hospital. The new development is lower wholesale prices
being charged to firms that compete with retail drugstores to fill outpatient prescriptions.
Many of the lawsuits are settled in January 1996.
The settlement, if it holds, could undercut vast changes in the drug indus-
try that overall have held down prices and enabled employers to curb some
health-care costs. While the preliminary settlement doesn't explicitly require
any changes in drug companies' future discounting practices, they now may be
able to curb the managed-care discounts by citing the legal liability they could
incur (The Wall Street Journal, 1996a).
The settlement also involves a $600 million payment to drugstores.
3 Data
The data used to document antibiotics prices come from two sets, one covering 1985 to
1991 and the second covering 1990 to 1996. The first data set, collected by IMS America,
contains wholesale quantities and revenues of all prescription cephalosporins (a subclass of
8

antibiotics) sold in the U.S. from October 1985 to December 1991. These quantities and
revenues are those from transactions between manufacturers or distributors and retailers of
various kinds. These data are divided into two types of retailers, or channels of distribution,
hospitals and retail drugstores, and are at the level of presentation for each pharmaceutical
product. The second data set, also collected by IMS America, has a similar structure but
covers the months September 1990 through August 1996 and has data on all antibiotics.
The other main difference is that after January 1992, the data in this second set are divided
into a richer group of channels of distribution: federal facilities, clinics, HMOs, nonfederal
facilities, chain drugstores, independent drugstores, foodstores, and longterm care.8
Note that the definition of "hospitals" in the first data set corresponds closely to that
of "nonfederal facilities" in the second and that "retail drugstores" corresponds to the sum
of "independent drugstores," "chain drugstores," and "foodstores."
Since I only have data on cephalosporins before September 1990, any longer time series
will include only cephalosporins. It should be noted that cephalosporins are a large—during
this period, they account, for approximately 40% of antibiotics revenues—but not necessarily
representative subclass of antibiotics. The first cephalosporin, cephalexin, was not intro-
duced until the 1970's, long after penicillins had become available. Many cephalosporins
are still on patent, and there is significant name recognition of some of the branded drugs
which are now off patent, in contrast to penicillins, where no patents are held and no
'A presentation is a particular choice of packaging and doseform for a product, for example, 150 mg
coated tablets in bottles of 100, or 25 ml of 5% aqueous solution in a vial for intravenous injection. A drug
will often be sold in many presentations simultaneously.
Federal facilities are all types of federal government hospitals, nursing homes, and outpatient facilities.
Clinics include outpatient clinics, urgent care centers, and physician offices. The HMO category includes
prescriptions dispensed at HMO-owned hospitals and drugstores, not prescriptions dispensed elsewhere but
paid for by an HMO drug benefit. The HMO channel of distribution, then, reflects only a small portion
of the influence that HMOs and other managed care have had on pharmaceutical purchasing. Nonfederal
facilities are all private and nonfederal government hospitals. Chain drugstores are in chains of four or
more stores. Independent drugstores are owned independently or are in chains not qualifying for the chain
drugstore categoiy. Foodstores are drugstores located in a foodstore. Longterm care includes nursing homes
and convalescent centers and retail drugstores with more than half of their sales to nursing homes. Home
health care is not included in this category.

manufacturers are considered incumbent.
To look at broad pricing patterns, I need to aggregate over the thousands of products
for which I have data. I do this by computing monthly price indexes where the index is
calculated as the weighted sum of price changes for all presentations sold in a month. In
particular, I compute Divisia price indexes using as weights the average revenue share of
each presentation in the two months for which I calculate the price change. 9 Divisia indexes
have the advantage (over, for example, Laspeyres indexes) that the weights are allowed to
vary from month to month as different drugs lose or gain relative importance in the market.
In addition, new drugs can enter the price index in their second month, which is the first
month for which one can compute a price change. Price indexes usually start at one in the
first month of the data, but we are not just interested in price growth, but also in differences
in the levels of prices when comparing indexes. I therefore rebase the price indexes to reflect
relative price differences. For example, in the first data set which begins in October 1985,
I base the price index for cephalosporins sold to hospitals at 1.00, but the pharmacy price
index at 1.26. To compute this relative price of cephalosporins sold to drugstores relative
to hospitals, I calculate a weighted sum of the price ratios of all of the presentations sold to
both drugstores and hospitals. The weights are total revenues (in drugstores and hospitals)
of each presentation as a share of the the total across all identical presentations of the same
drug. Finally, when constructing a long price index from both the earlier and later data
sets, I compute a price index from each data set and attach them together at the date in
the middle of the overlap.
Note that the data are at the wholesale level, arguably the level of most interest in this
9The Divisia price index calculated for N products in a month t is:
/ N
It = expJy^Jntlogj -
) It-i.Pnt
sntiog(-
\n=l
where P„ t is the price of the nth product in month t, s„ t = 0.5(s„ t + s„t-i) and
PntQnt
J2 n=l PntQnt
where Q is quantity.
10

market. Much of the public debate, centering on the actions of the drug manufacturers,
is focused on the wholesale level. In addition, recent significant changes in organization of
healthcare delivery such as mergers and alliances give rise to "countervailing power" among
drug purchasers. At the wholesale level we can see most clearly how this exercise and
counterexercise of market power has played out over the past several years. Government
policies regarding drug reimbursement also are concerned with wholesale prices.
4 Overall Price Trends
Much of the public debate and political action mentioned in the chronology is the direct
result of the perception that drug prices were rising rapidly.
Prescription drug prices have risen more than four times the inflation rate in
the past two years, according to a recent congressional study. The AARP said
that many senior citizens do not purchase needed drugs because they cannot
afford them (The Washington Post, 1987b).
Following a decade in which drug prices surged, on average, three times
the rate of inflation, the federal government and states that buy drugs for a
variety of health programs are rebelling with a host of new and threatened price
regulations (The Wall Street Journal, 1992a).
In the past few months, the pharmaceutical industry has been lambasted by
critical reports from Congress, the GAO, the American Association of Retired
Persons and Families USA Foundation. The reports detail the sharp rise in
prescription drug prices . . . (The Washington Post, 1992).
In the early 1990's, the threat of government price controls under President
Clinton's ill-fated health reforms prompted a drastic rollback in annual drug
price increases. Lately, analysts report prices are beginning to creep up again
(Associated Press, 1995).
11

An eleven year monthly price index of all cephalosporins 10 (Figure 1) casts doubt on
these perceptions. Not only does this aggregate index exhibit a modest average annual
growth rate (AAGR) of 1.1% it also exhibits consistency through the political vicissitudes
of the past eleven years. The only notable deviation from a broad linear trend occurs over
the most recent few years. As public -concern -over rising drug prices waxes and wanes,
cephalosporin prices, at least, steer a fairly steady course of small price increases until
approximately 1994, when prices level off and then drop.
Consider, now, the events in the chronology in more detail. The Medicaid best price
provision, taking effect in January 1991, has no obvious impact on prices of cephalosporins,
despite speculation in the popular press about how average wholesale prices will go up.
(There is a run-up in price in the four months leading up to January 1991 of about 2%,
but this increase is not out of line with other fluctuations around the general trend. We
will reexamine this issue in the next section.) Scott Morton (1997) provides a detailed
discussion of the 1991 Medicaid reimbursement change and analysis of its effect on drug
prices. Using average wholesale prices of cardiovascular drugs, she finds an increase in price
at the time of Medicaid best price.
The significant slowing down of price increases and eventual decline in prices is roughly
coincident with serious healthcare reform debate, which began in the fall of 1992. Since no
major healthcare reform was enacted, it is interesting to speculate how the debate could
have had a significant effect on prices. Obviously, political pressure on drug manufacturers
and public scrutiny of their actions was intense and the fear of price regulation in the
industry was palpable, but one specific mechanism through which price increases could
have moderated was the voluntary price restraints.
To examine this possibility, we consider price indexes for all antibiotics for a number of
manufacturers separately, including many of the firms who pledged to voh .ntarily restrain
Obviously, the statements in the popular press about rising prices were not made specifically about
cephalosporins or even antibiotics. Later discussion will touch on how representative the indexes in the
paper are and will also compare this index with official Bureau of Labor Statistics indexes.
12

prices.11 See Table 1. From the indexes I calculated AAGRs for the period 1990-1992
(roughly, the pre-pledge period) and 1993-1996 (roughly, the post-pledge period) for each
firm. First, AAGRs for the pre-pledge period range from -14.2% to 7.5%, five exceeding
the inflation rate of 4.0%. Second, only one firm exceeded the inflation rate of 2.8% for the
post-pledge period, and seven of the seventeen decreased prices during that period. All but
four of the firms had slower price growth (or sharper decline) in the post-pledge period, but
this group interestingly included many for whom the inflation-based pledge was not close to
binding in the first, period. While pricing behavior could have been changed by the pledge,
other explanations might be at work in light of this fact. Note that I cannot formally test
the drug companies' pledges because I only have data on antibiotics.
Much of our discussion of overall price trends has focused on cephalosporins because
that is the subclass for which I have the longest price series. Cephalosporins could, however,
have special pricing patterns because of their special economic characteristics among an-
tibiotics. Recall that cephalosporins are relatively new with many drugs still on patent and
significant name recognition of some of the branded drugs which are now off patent. Figure
2 is a comparison of overall indexes for four different subclasses of antibitoics since 1990.
The similarity in their price growth, all very modest, is striking given their very different
characteristics. For instance, penicillins, the first antibiotics, are a very old class of drugs
with nothing we would consider to be an incumbent brandname drug. Both trimethoprim
and erythromycin are one-drug subclasses, trimethoprim being fairly new and recently off-
patent and erythromycin being older. The one thing that the drugs in these subclasses
have in common, though, is a large number of potential substitutes for them, either within
or outside the subclass or both. 12
A couple of differences in these patterns from that of cephalosporins should be noted.
First, while none of the other three subclasses exhibits significantly higher or lower price
1This list was constructed using both newspaper accounts of firms who joined the pledge as well as a
March 14, 1996 Federal Trade Commission document concerning an investigation of the pledge as a means
of price fixing. Some firms from that master list were omitted because they either did not sell antibiotics in
my data set or their sales were very small.
1 Temin (1980) also discusses the characteristics and pricing of different subclasses of antibiotics.
13

Table 1: AAGRs by-Firm
Firm Monthly Sales 1990-92 1993-96
Abbot 1,070,000 3.6 2.4
American Home Products 2,154,000 2.3 1.1
Bristol-Myers Squibb 2,739,000 3.3 0.1
Ciba-Geigy 954,000 -6.5 -2.3
DuPont Merck 199,000 7.5 -27.9
Eli Lilly 1,051,000 6.4 0.7
Glaxo Wellcome 552,000 7.5 -0.5
Hoechst-Marion Roussell 1,231,000 -0.9 -2.1
Hoffman LaRoche 350,000 1.3 -1.3
Johnson & Johnson 12,229,000 -0.1 2.8
Knoll 1,290,000 6.3 4.5
Merck 175,000 -0.3 2.6
Pfizer 515,000 4.1 -3.6
Pharmacia & Upjohn 410,000 2.3 1.4
Searle 1,604,000 -14.2 1.0
Smithkline Beecham 1,702,000 2.8 1.3
Warner Lambert 808,000 2.0 -10.5
14
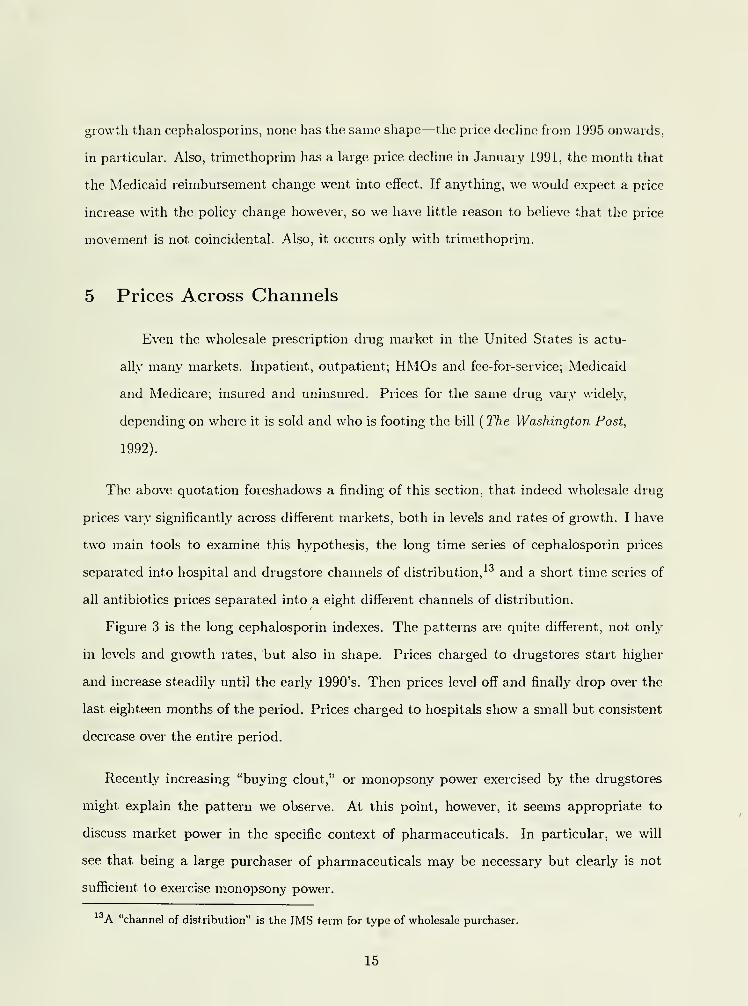
growth than cephalosporins, none has the same shape—the price decline from 1995 onwards,
in particular. Also, trimethoprim has a large price decline in January 1991, the month that
the Medicaid reimbursement change went into effect. If anything, we would expect a price
increase with the policy change however, so we have little reason to believe that the price
movement, is not coincidental. Also, it occurs only with trimethoprim.
5 Prices Across Channels
Even the wholesale prescription drug market in the United States is actu-
ally many markets. Inpatient, outpatient; HMOs and fee-for-service; Medicaid
and Medicare; insured and uninsured. Prices for the same drug vary widely,
depending on where it is sold and who is footing the bill(The Washington Post,
1992).
The above quotation foreshadows a finding of this section, that indeed wholesale drug
prices vary significantly across different markets, both in levels and rates of growth. I have
two main tools to examine this hypothesis, the long time series of cephalosporin prices
separated into hospital and drugstore channels of distribution, 13 and a short time series of
all antibiotics prices separated into a eight different channels of distribution.
Figure 3 is the long cephalosporin indexes. The patterns are quite different, not only
in levels and growth rates, but also in shape. Prices charged to drugstores start higher
and increase steadily until the early 1990's. Then prices level off and finally drop over the
last eighteen months of the period. Prices charged to hospitals show a small but consistent
decrease over the entire period.
Recently increasing "buying clout," or monopsony power exercised by the drugstores
might explain the pattern we observe. At this point, however, it seems appropriate to
discuss market power in the specific context of pharmaceuticals. In particular, we will
see that being a large purchaser of pharmaceuticals may be necessary but clearly is not
sufficient to exercise monopsony power.
A "channel of distribution" is the IMS term for type of wholesale purchaser.
15

The main reason is that some retail sellers of pharmaceuticals have very little control
over which products they must stock and sell. Consider, for example, the case of a large
pharmacy chain such as CVS negotiating over the price at which they will purchase Prozac
from Dista (Eli Lilly). Despite the fact that other therapeutically similar drugs 14exist,
CVS could not credibly threaten Dista with not carrying Prozac in their negotiations.
Customers will still come into CVS with prescriptions for Prozac that neither the patient
nor the pharmacist has authority to change. 15
In contrast, purchasers with restrictive formularies, most hospitals for instance, actually
make the decisions about which drugs their end consumers will take. They can and do play
off manufacturers of similar drugs against one another and credibly threaten to carry in
their formulary only the drug for which they received the best deal. It is interesting to
note that the importance of a restrictive formulary is not reflected in the statement in the
chronology about "buying clout" taken from The President's Health Security Plan. Implicit
in the statement is the assumption that size alone will provide negotiating power.
This notion of how market power can be exercised, size plus a restrictive formulary, is
consistent with the divergence in hospital and drugstore pricing patterns we see in Figure 3.
Pharmacies, because of their inability to exercise market power, paid higher prices for their
drugs than hospitals did, and as more hospitals established and used restrictive formularies,
the divergence grew.
The theoretical literature on monopsony power focuses mostly on the case of a monopoly
supplier, and discounts are achieved by the large buyers because, for instance, they can cap-
ture more of the surplus in a bargaining game. We see a very different source of monopsony
power here: supplier competition. Manufacturers who make therapeutically similar drugs
are competing in the size of discount they offer to the large buyers to win their business.
See Snyder (1996, 1998) for a theoretical treatment of this phenomenon.
Zoloft by Roerig, Paxil by Smithkline Beecham, and Luvox by Solvay, all have similar chemical structures
and therapeutic profiles.
Ellison et al. (1997) shows evidence of little price sensitivity in the decision on chemical compound in
the drugstore market. Such a finding is consistent, with this story.
16

I offer the following caveat to the above interpretations. I am presenting evidence on
price changes in addition to price levels. The interpretations only apply to price changes
to the extent that wholesale purchasers' market power is changing over time. In particu-
lar, the growing discrepency in hospital and drugstore prices over time could be the result
of increasing use of formularies by hospitals, increasing size of hospitals, or both. As a
crude measure of the use of restrictive formularies, an innovation largely brought about
by managed care, I cite the well-known fact that managed care penetration has increased
dramatically over this period, by more then three-fold, in fact (Wholey et al. (1997)). As a
crude measure of the size and degree of consolidation of hospitals, I refer to the number of
premerger notifications in health services given to the Federal Trade Commission over this
period. They have increased nearly seven-fold from 1986 to 1996. (Compare this increase
with premerger notifications in general merchandise, which have remained constant.) Inter-
estingly, premerger notifications in miscellaneous retailing, which includes drugstores, have
increased ten- fold, including some high profile mergers and merger attempts in drugstores
(The Wall Street Journal, 1996b, 1997). This apparent consolidation, however, seems not to
have increased their monopsony power in the prescription drug market absent a restrictive
formulary.
This finding complements those of a small economics literature on restrictive formularies.
Moore and Newman (1993) look at the effect of restrictive formularies on healthcare and
the retail market, for drugs and find that restrictive formularies lower retail expenditures on
drugs but do not. lower overall healthcare expenditures because of input substitution. Here
we see the effect of restrictive formularies back one level: buyers with restrictive formularies
appear to pay lower prices at the wholesale level.
The recent decline in the pharmacy index, however, is still left unexplained. One possible
explanation is the series of price discrimination lawsuits. Drug manufacturers might have
become wary of such large discrepencies in the prices they charged to different customers
and have moderated them for that reason.
In the previous sections we noted that one possible effect of the 1991 Medicaid best price
provision would be to raise average wholesale prices, but found no evidence of such an effect
17

when looking at the overall price index. Another possible effect would be the decrease in
dispersion of wholesale prices. I do not, of course, have data at. the level of individual whole-
sale customers, but can infer some information about the overall distribution of prices from
the average drugstore and hospital prices. Since hospital prices are much lower than drug-
store prices, they would be differentially affected by a law which made discounting of drugs
more expensive for the manufacturers. Again, no effect is evident. Increasing discrepency
between the hospital and pharmacy markets during this period continues unabated.
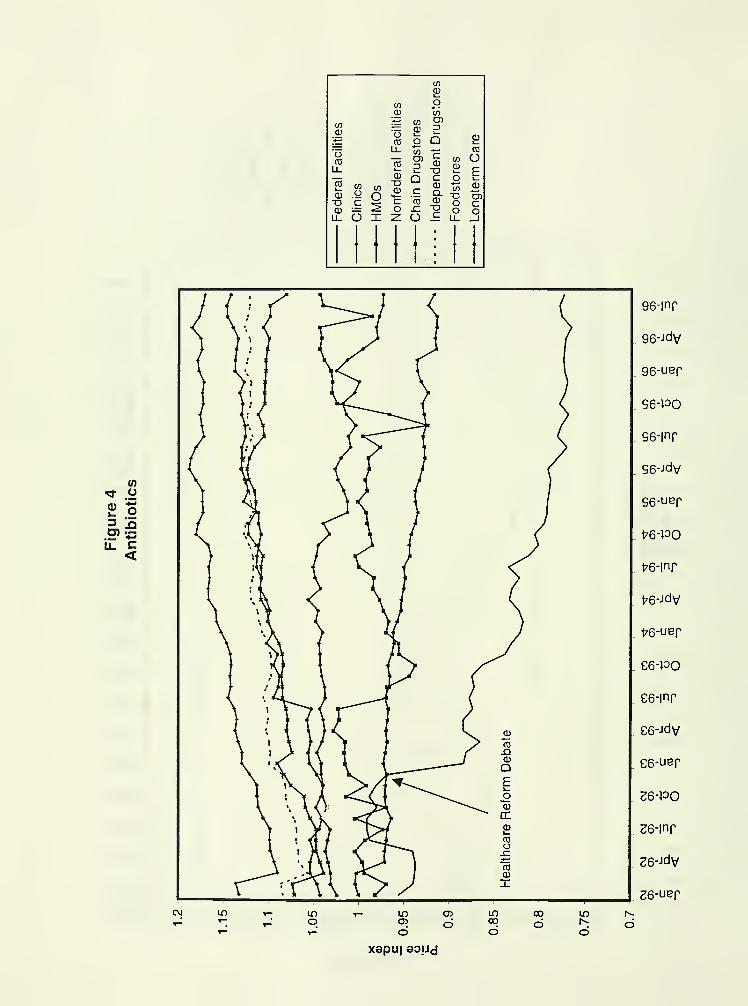
Different price levels, growth rates, and overall patterns are again evident in Figure 4,
the graph of wholesale price indexes of all antibiotics separated out by eight channels of
distribution. 16 See also Table 2 for AAGRs and base prices from this graph. The most
salient feature of this graph is the significant price dispersion. For instance, there is more
than a 40% difference in the highest and lowest values for price indexes near the end of
1996. Note also that any within channel dispersion would be masked by these indexes. Like
Figure 3 we see, broadly speaking, higher prices being charged to various types of retail
drugstores and lower prices being charged to various types of hospitals. Federal facilities,
for instance, starts with the lowest prices and experiences the steepest price decreases over
this period. Foodstores starts and ends with the highest prices.
Two surprising features of the graph are the relatively high prices and high price growth
for longterm care facilities (many of which employ restrictive formularies) and the high
price growth for HMOs. Recall that this HMO channel is just direct sales to HMOs, not
all sales that will eventually be reimbursed by HMOs. Pharmaceutical company executives
tell the story that large price concessions were initially given to HMOs in anticipation of
their market shares increasing dramatically. Price concessions were gradually abandoned
then, as many HMOs moved away from in-house drugstores and instead contracted with
outside drugstores. "Drug companies already had begun to rein in discounting in the past
year, tying discounts to demands that an HMO's business had to visibly increase a maker's
market share or revenues (The Wall Street Journal, 1996a)."
6This graph starts in January 1992, the date at which IMS started aggregating data at this finer level.
18

Table 2: Channel of Distribution, 1/92 to 8/96
Channel Monthly Sales AAGR Base Price
Chain Drugstores 187,000,000 0.2% 1.07
Independent, Drugstores 116,000,000 0.7% 1.08
Foodstores 39,000,000 0.7% 1.13
Longterm Care 14,000,000 2.4% 1.02
Federal Facilities 10,000,000 -4.4% 0.96
Clinics 9,000,000 -1.4% 1.04
HMOs 9,000,000 1.3% 0.98
Nonfederal Facilities 162,000,000 -1.8% 1.00
In this graph we do see an instance where healthcare reform debate may have played a
role. There is a large decline—a drop of nearly 10%—in the price paid by federal facilities
in January of 1993, the month that Hillary Rodham Clinton was appointed to head the
task force. I am aware of no legal change or other factor that could have caused the decline,
but it could, of course, have been coincidence.
Also, we see additional support for the idea that bargaining power in wholesale pharma-
ceuticals is crucially dependent on restrictiveness. If bargaining were purely volume-based,
we would expect a difference to show up in the fairly clean comparison of chain drugstores
and independent drugstores. Restrictive formularies would not be important in either mar-
ket, and we would expect them to be similar in other institutional characteristics. Chain
drugstores, however, would be larger volume buyers. Their indexes are very similar, sug-
gesting that volume is of little importance in bargaining in the absence of a restrictive
formulary.
19

6 Branded-Generic Price Differences
Considering pricing differences between branded and generic 17 manufacturers gives us an-
other lens through which to examine issues touched on in the chronology and the previ-
ous sections because we would expect some of these events to have differential impacts
on branded and generic manufacturers. Figure 5 shows the branded-generic split. In
cephalosporins, the generic index is rebased at approximately 50% of the branded index.
In other words, existing generics in October 1985 were pricing on average at half of the
branded price for the corresponding chemical compound. The branded index exhibits price
increases over the entire period, although at a slower rate starting around 1993. The generic
index is falling over our entire period, with an increasing rate of price decline in recent years
paralleling the branded slow down. Aside from the difference in the two pricing patterns,
a fairly striking feature of these graphs is the consistency, near linearity over time, of the
pricing patterns of these two types of manufacturers.
Examination of a few individual drugs tends to bear out these general findings. Most
brandname drugs rise in price throughout their existence. Often, even patent expiration
and generic entry do not cause changes in price patterns over time, as is the case with
branded cephalexin, Keflex, for instance. There is substantial heterogeneity in branded
pricing, though, and a couple of exceptions to the rule are vancomycin and azithromycin.
The branded versions of both of those drugs, Vancocin and Zithromax respectively, have
been falling over the last few years. Zithromax was just introduced in 1992, has no generic
competition yet, and is widely prescribed for minor infections. Vancomycin is older, has
substantial generic competition, and is reserved for use in serious infection which have not
responded to other therapies. The general results on generics are more widely applicable.
All of the individual drugs I have examined which have generic competitors share the
following characteristics: average generic entry price is at or below branded price and price
1I use the terms "branded" and "generic" as a convenient if somewhat imprecise shorthand description.
To be precise, I categorize different types of manufacturers on a drug by drug basis: the innovator or patent
holder for a particular drug is categorized as "branded" whereas all other manufacturers including large,
brandname manufacturers are categorized as "generic" for that drug.
20

declines over time.
The first event of note to consider is the generic drug scandal. If the scandal served
to shift down demand for generic drugs, further differentiate branded and generic versions,
temporarily relieve political pressure on branded manufacturers, or all three, we would
expect a further widening of the branded-generic price difference during this period. We
do, in fact, see a small but perceptible increase in the rate at which generics are decreasing
prices around mid-1988. The branded index appears unaffected. Note, however, that
cephalosporins had relatively little generic penetration at this time—generic sales were
about a third of branded sales in mid-1988. Also, one would expect the generic scandal to
have a small effect on antibiotics relative to other classes of drugs. Its special regulatory
treatment has led to many brandname manufacturers producing "generic" versions of drugs,
or so classified in these data, and those brandname manufacturers were not implicated in
the scandal.
Healthcare reform, also, would be expected to have differential impacts on branded and
generic manufacturers. Political pressure was clearly focused on branded manufacturers,
and it was the branded manufacturers who voluntarily restrained prices.18 We see instead,
if anything, a somewhat more pronounced deviation in generic pricing over the last few
years than in branded pricing, leading us to believe that healthcare reform discussions
might have had little if any effect on drug prices. Other factors might be more important,
a point which leads us back to the discussion of countervailing power.
While it seems that restrictive formularies are important in attempts to exercise market
power, the issue is somewhat more subtle than was implied in the previous section. Phar-
macies might have trouble playing manufacturers of therapeutically similar but chemically
distinct drugs off against one another, but they can play generic manufacturers off against
one another. Pharmacies only need to (and typically only do) carry one generic version of
each drug for which a generic exists, although there are often many manufacturers. 19 To
Such political pressure could have had an indirect effect on generic manufacturers through changes in
the competitive environment, but one would expect those effects to be smaller than any direct effect.
Drug Facts and Comparisons, which seems to list at most seven generic manufacturers, lists, for ex-
21

explore this distinction, we next consider Figure 6 which presents the four way branded-
generic and hospital-pharmacy split. Both hospitals and drugstores should be able to
exercise market power against generic manufacturers, but only hospitals would have signif-
icant market power against branded manufacturers. Again, we see patterns consistent with
this notion of market power and with increasing concentration in hospitals and drugstores.
Three of the four indexes exhibit negative growth: both of the generic indexes and the
branded hospital index. Only the branded pharmacy index is increasing, with an average
annual growth rate of 6.6%. In other words, there was negative price growth in the three
submarkets where buyers could exercise monopsony power, substantial price growth in the
one submarket where they could not.
Finally, we consider the four way branded-generic and chain-independent drugstore
split. Neither chain nor independent drugstores would employ restrictive formularies, but
chain drugstores would be larger volume purchasers. Examining this four way split, then,
will allow us to distill out the effect of size of purchaser on monopsony power holding
constant, the purchasers' abilities to play off manufacturers against one another. See Figure
7. We reach the striking conclusion that size does not seem to matter much at all. The big
difference here is, again, in the purchase of branded versus generic drugs. Neither type of
drugstore can play branded manufacturers off against one another, but they can do so with
generic manufacturers.
7 Official Price Indexes
While not, an event particular to pharmaceuticals, one of the bigger economic news stories
of 1997 was the formation of a blue ribbon panel of economists to report on how the BLS
computes price indexes and what biases are likely to be inherent, in their methods (The
Wall Street Journal, 1996c). The formation of this panel followed a series of scholarly arti-
cles auditing BLS methods, including several using drug prices as the empirical setting.20
ample, seven manufacturers for both generic trimethoprim and sulfamethoxazole combination and generic
cephalexin and five manufacturers for generic clindamycin.20
See, for example, Berndt, Griliches, Rosett (1993), Griliches and Cockburn (1994), Ellison et al. (1997),
Baye, Maness, and Wiggins (1992), and Suslow (1992), all of which discuss price index issues with a specific
22

The political reality which made the panel possible was growth in inflation-indexed por-
tions of the budget: a scholarly panel report saying that the BLS might be significantly
overstating inflation could provide justification for cutting the rate at which Social Security
payments, for instance, are increased annually. Ironically, the scholarly articles and panel
report have been used (justifiably, perhaps) by critics of budget-cutting measures to ar-
gue that government expenditures on pharmaceuticals are growing for reasons other than
price increases—price increases have been overstated by the BLS—and that, the government
should not exert downward pressure on prices charged by drug manufacturers. "Drug prices
have not skyrocketed. Supporters of price controls often cite a BLS report that suggests
that drug prices increased 9% a year .... However, a review of the BLS data by the
National Bureau of Economic Research showed that the real increase was actually 5.7%. .
. . {The Wall Street, Journal, 1992b)."
While the panel's report and much of the public debate surrounding price indexes
focused on the Consumer Price Index (CPI), many of the issues are applicable to the
Producer Price Index (PPI) as well. For our purposes, I compare the cephalosporin index
with a PPI for cephalosporins, both because the PPI is available at that level of product
disaggregation and because it is also a measure of prices at the wholesale level. See Figure
8.21 The Divisia index I calculate indicates a 0.8% average annual increase in wholesale
cephalosporin prices over this period. The PPI increases at an average annual rate of 4.5%.
As Figure 8 illustrates, this difference is huge when compounded over several years. Ellison
and Hellerstein (1997) carry out. a more detailed analysis of the difference between these two
particular indexes, finding evidence that most of the difference is attributable to sampling
as opposed to methodology. This is not surprising given that I have (aggregated) data on
a near census of transactions in this market whereas the BLS samples quite selectively and
often in a nonrepresentative fashion. In addition to consistent, systematic differences in the
two indexes, it is interesting to note that the Divisia index picks up a recent price decrease
entirely missed by the PPI.
application to pharmaceuticals, the first two of which had direct impact on the panel's findings.
The index starts in January 1988 because that is the date at which the BLS started computing their
PPI for cephalosporins.
23

This finding bolsters the claim made earlier that the public perception of rapidly increas-
ing drug prices is probably exaggerated. While we only compare an index of cephalosporin
prices to an official index, to the extent that similar biases exist for other types of drugs,
price growth has been overstated by official indexes.22
8 Conclusion
The study of prices provides us with a powerful tool to examine effects of political and legal
events on markets as well as shed light, on public perceptions of those markets. Through
the systematic documentation of wholesale antibiotics prices since 1985, we see a surprising
consistency of prices through different events and political climates, but also an illustration
of the importance of traditional concerns in industrial organization, such as market structure
and bargaining power, on prices. The unusual institutional structure in the market for
wholesale pharmaceuticals—some purchasers having much greater bargaining power due
to their use of restrictive formularies—offers unique insight into the effect of monopsony
power.
This point lias been made forcefully by several papers, most notably Berndt, Griliches, Ftosett (1993)
and Griliches and Cockbuin (1994).
24

Wc1_^ o
(1) ai- (03 oO) TO
U_ J=a.a>
O
in
CO*-•
mXICO
QEo"a3
DC
COl_coo
CO
X
CO inC\J
CM in ino in
d
96-unp
96-qaj
S6-J0O
96-unr
S6-Q9d
f6-PO
t-6-unr
fr6-q9d
C6-J30
£6-unr
£6-q9d
26-JOO
26-unp
26-qsd
1-6-PO
1.6-unr
i.6-q9j
06-PO
06-unr
06-q9d
68-PO
68-unp
68-q9d
88-PO
88-unr
88-q9d
I Z8-PO
Z8-unp
/8-q9d
98-PO
98-unp
98-q9d
4- S8-PO
d
xapu| aoud
\
(0Q)<fl
(0tz
o.Q
(/)
U<N •§
CD (U
3 °-o>2il 5>
too
o!5
c<
<M CD
O
96-unr
I 96-JBlAJ
96-090
96-das
96-unp
96-Jey\|
176-090
176-das
^6-unr
t>6-JE;A|
96-090
. 96-d9S
. 96-unr
96-JBlAI
26-090
26-d9S
26-unr
26-JBlAI
1-6-090
16-des
1.6-unp
1-6-JeifM
06-oaa
06-d9S
oo
dxapui aoud

COCD3
_00
TO
a.</)
oX
CO to CO COco CD a> CD (Doj 3 -I _1 ~1
CCD>CD
ooocCD>CD
OOo (0
CD>CD
oooCCD>a)
ooo>^ o 1_ o o »— o_c m r o o O o r o o o
.1
—
m in r- tn CO ro COcoE,
1_LCOr>
CD
ECMCO To i
—
Z>
CD
£COCT>
-aGO
I Q
(ft
ci-
CO o(1) a1= WD oOl
ca
u_ .nQ.Qi
O
CM
C\j
C\J oo CO
r- t—
xapu| Baud
CVJ
96-Jdy
S6-PO
S6-Jdv
^6-PO
f6-Jdv
I E6-PO
£6-Jdv
26-PO
26-JdV
1-6-100
16-Jdv
06-100
06-Jdv
68-P0
68-Jdv
I- 88-PO
88-Jdv
Z8-PO
Z8-JdV
98-PO
98-Jdv
4 98-POco
d
a) oTT cCD —
CD
LL O
CD
oca
COi—
8 |S OI 2:
01CD3CO
CD
o a01
3
c'ca
O
8 £c o
•a °
CO
OE
£co
(A
2! o
UL C<
oxapu| aoud

^ CD
(A
Ci_
10 ofl>
Q.l- (03 oG) «J
LL x:Q.Oo
00
dCO
d dCM
d
96-Jdy
S6-PO
96-Jdv
t^6-P0
1/6-JdV
C6-PO
£6-Jdv
26-PO
26-JdV
I-6-P0
1.6-Jdv
06-PO
06-Jdv
69-PO
68-Jdv
I- 88-PO
88-Jdv
Z8-P0
Z8-Jdv
98-PO
98-JdV
98-PO
xapuj aoud

to
O 03
m
to0)
o
V)O
cn CL(/3
OX
CO
"3
X a QT3 T3
(11o o
T3C03
C03
c0)
CD
mm m CD CD
WCi_
CO o(1>
a,1_ </)
3 oo> CO
LL .caa>
O
C\J 00
96-JdV
96-PO
96-JdV
t>6-P0
p6-Jdv
E6-P0
£6-Jdv
26-PO
36-Jdv
L6-P0
l-6-Jdv
06-130
06-Jdv
68-PO
68-Jdv
88-PO
88-JdV
Z8-P0
/8-Jdv
98-PO
98-Jdv
S8-J30CM
dxapuj aoud

COa>
in
3CCDDQ c
r- «"E CS-
CO <U
O -E
CD CD
C CCO COI— 1—
m m
05en3CO
CD
P Q *CO «
o Qco
3
CO
cCD
C=CD
Q.CDXI
O £o o"i_ "i_
CD CDC CCD CD
CD CD
CO
N- .°
£ O
.£?*=u. c<
C\J CO
O O O
96-|nr
96-Jdv
.96-uBp
S6-PO
S6-|nr
S6-Jdv
S6-uer
fr6-PO
t76-Jdv
t76-uer
S6-PO
£6-|nr
.£6-Jdv
£6-uer
26-PO
S6-|nr
26-JdV
26-uer
xapu| aoud

> ^O CO
(ACi-
00 o(1)
Q.1_ (/)
3 Oen
ra
u. x:Q.Q)
o
co 10 co
96-Aey\|
96-uer
S6-das
S6-Abiai
S6-uer
fr6-d3S
P6-fe\N
t76-uep
£6-d9S
E6-ABN
. S6-uer
26-das
26-Abi^j
26-uer
^6-das
U6-Ae|/\|
1.6-uep
06-das
06-Aew
06-uer
68-das
68-Ab|AI
68-uer
88-dss
88-ABiflj
88-uBf
CT>
dCD
dxapu| aoucj

References
Associated Press, (1995). "Most Drug Companies Gain Thanks to New Products, Foreign
Exchange." July 20.
Baye, M., R. Maness, S. Wiggins (1992). "Demand Systems and the 'True' Subindex of the
Cost-of-Living for Pharmaceuticals." Mimeo, Department of Economics, Texas A&M.
Berndt, E., Z. Griliches, J. Rosett (1993). "Auditing the Producer Price Index: Micro
Evidence from Prescription Pharmaceutical Products." Jov.rn.al. of Business and Economic
Statistics, 11, 251-264.
The Boston Consulting Group, Inc. (1993). "The Changing Environment for U.S. Phar-
maceuticals." Mimeo.
Caves, R., M. Whinston, M. Hurwitz (1991). "Patent Expiration, Entry, and Competition
in the U.S. Pharmaceutical Industry." Brookings Papers on Economic Activity, Microeco-
nomics, 1-66.
Chicago Tribune (1994). "Independent Pharmacies Face Bitter Pill." November 6, p. 1.
Dow Jones News Service— Ticker (1994). "106 Va. Drugstores Sue Drug Makers; Claim
Unfair Pricing." September 2.
Ellison, S.F., I. Cockburn, Z. Griliches, J. Hausman (1997). "Characteristics of Demand for
Pharmaceutical Products: An Examination of Four Cephalosporins." The RAND Journal
of Economics, 28(3), 426-446.
Ellison, S.F. and J. Hellerstein (1998). "The Economics of Antibiotics." Forthcoming,
Measuring the Prices of Medical Treatments, AEI-Brookings Conference Volume.
Ellison, S.F. and W.P. Mullin (1997). "Gradual Incorporation of Information into Stock
Prices: Empirical Strategies." NBER Working Paper 6218.
25

Federal Trade Commission (1986-1997). "Ninth"- "Nineteenth Annual Report to Congress
Pursuant to Section 201 of the Hart-Scott-Rodino Antitrust Improvements Act of 1976."
Fortune (1993a). "Why Drug Prices Will Go Lower." May 5, p. 56.
Fortune (1993b). "The Plots to Keep Drug Prices High." December 27, p. 120.
Grabowski, H. and J. Vernon (1992). "Brand Loyalty, Entry, and Price Competition in
Pharmaceuticals after the 1984 Drug Act." Journ.al of Law and Economics, 35(2), 331-
350.
Griliches, Z. and I. Cockburn (1994). "Generics and New Goods in Pharmaceutical Price
Indexes." American Economic Review, 84, 1213-1232.
Hellerstein, J. (1995). "Economic Impediments to the Development of New Antibiotic
Drugs." Contract paper prepared for the Office of Technology Assessment, U.S. Congress.
The Los Angeles Tim.es (1990). "Medicaid Savings." November 20, p. 5.
Moore, W. and R. Newman (1993). "Drug Formulary Restrictions as a Cost-Containment
Policy in Medicaid Programs." Joum,al of Law and Economics, 36, 71-93.
The New York Times Abstracts (1993). "Seven Big Drug Makers Are Sued Over Pricing."
October 15, p. 3, col. 5.
The San Francisco Chronicle (1993). "Drug Firms' Proposal For Holding Prices Down."
March 13, p. A5.
Scott Morton, F. (1997). "The Strategic Response by Pharmaceutical Firms to the Medi-
caid Most-Favored-Customer Rules." The RAND Journal of Economics, 28(2), 269-290.
Suslow, V. (1992). "Are There Better Ways to Spell Relief?: A Hedonic Pricing Analysis of
Ulcer Drugs." Working paper, University of Michigan School of Business Administration.
Schwartzman, D. (1976). Innovation in the Pharmaceutical Industry. Baltimore, MD:
26

MIT LIBRARIES
3 9080 01444 0819
Johns Hopkins University Press.
Schweitzer, S. (1997). Pharm.aceuti.cal Economics and Policy. Baltimore, MD: Johns Hop-
kins University Press.
Snyder, C. (1996). "A Dynamic Theory of Countervailing Power." The RAND Journal of
Economics, 27(4), 747-769.
Snyder, C. (1998). "Why Do Larger Buyers Pay Lower Prices? Intense Supplier Competi-
tion." Economics Letters, 58, 205-209.
Temin, P. (1980). Taking Your Medicine: Drug Regulation in the United States. Cambridge,
MA: Harvard University Press.
U.S. Congress. Office of Technology Assessment (1993). Pharmaceutical. R&D: Costs, Risks,
and Rewards. OTA-H-522, Washington D.C.: U.S. Government Printing Office.
The Wall Street Journal (1991). "Merck's Chairman Blames Price Rises On Industry
Rivals." November 8, p. B2A.
The Wall. Street Journal (1992a). "Specter of Regulation Sets Off Price War." September
25, p. A4.
The Wall Street Journal. (1992b). "Pricing Health Care: The Myth of High Drug Costs."
September 29, p. A16.
The Wall Street Journal (1996a). "Drug-Suit Settlement May Be Bitter Pill for Con-
sumers." January 19, p. Bl.
The Wall Street Journal (1996b). "Rx for Pharmacies: Bigger Line of Products and Ser-
vices." September 12, p. B4.
The Wall. Street Journal (1996c). "Panel Faults Price Index As Excessive." December 5,
p. Al.
27

The Wall Street Journal (1997). "Merger Mania Among Drugstores Is Likely to Continue."
January 13, p. 12.
The Washington Post (1987a). "Prices for Prescription Drugs Rising Sharply, Study Finds."
April 22, p. F01.
The Washington Post (1987b). "Pharmaceutical Firms Fight New Medicare Benefit." June
16, p. A13.
The Washington Post (1988). "A Good Health Bill." May 27, p. A18.
The Washington Post (1989). "How Safe Are the Drugs You Take." August 22, p. Z12.
The Washington Post (1990a). "Drug Price Controls." November 11, p. A26.
The Washington Post (1990b). "Pharmaceutical Companies Blamed for Drug Price Rise;
Physicians Wooed with Lavish Gifts, Senate Panel Told." December 12, p. A02.
The Washington Post (1991). "Prescription for Profit." October 1, p. E01.
The Washington Post (1992). "Drug Prices: What's Up?." December 15, p. Z08.
Wiggins, S. and R. Maness (1995). "Price Competition in Pharmaceuticals: The Case of
Antiinfectives." Mimeo, Department of Economics, Texas A&M.
Wholey, D., J. Christianson, J. Engberg, C. Bryce (1997). "HMO Market Structure and
Performance: 1985-1995." Health Affairs, Nov-Dec, 75.
, 8-
Q [j
28


Date Due
Lib-36-67


iSlifil'sllilli
«Sill
? i PSm
ill
tsig
I!pill |
Itan
ill
;"ill f
Bail