Embed Size (px)
Citation preview

______________________________________________________________________
What Now for Obama?
__________________________________________________________________
Larry J. Sabato
January 2011
PPoottoommaacc PPaappeerr 66
United States Program

The Institut français des relations internationales (Ifri) is a research center and a forum for debate on major international political and economic issues. Headed by Thierry de Montbrial since its founding in 1979, Ifri is a non-governmental and a non-profit organization. As an independent think tank, Ifri sets its own research agenda, publishing its findings regularly for a global audience. Using an interdisciplinary approach, Ifri brings together political and economic decision-makers, researchers and internationally renowned experts to animate its debate and research activities. With offices in Paris and Brussels, Ifri stands out as one of the rare French think tanks to have positioned itself at the very heart of European debate.
The opinions expressed in this text are the responsibility of the author alone.
The U.S. Program at Ifri publishes a series of online policy papers called “Potomac papers”. They present analyses of U.S. policies,
politics and social debates.
The United States Program is supported by:
Photo credits: AP/Charles Dharapak for The Jakarta Post. President Obama addresses a joint session of Congress,
February 2009.
ISBN: 978-2-86592-815-6 © Ifri – 2011 – All rights reserved
Website: Ifri.org
Ifri-Bruxelles Rue Marie-Thérèse, 21
1000 – Brussels – BELGIUM Tel: +32 (0)2 238 51 10 Fax: +32 (0)2 238 51 15
Email: [email protected]
Ifri 27 rue de la Procession
75740 Paris Cedex 15 – FRANCE Tel: +33 (0)1 40 61 60 00 Fax: +33 (0)1 40 61 60 60
Email: [email protected]

1 © Ifri
Ce qu’il faut retenir
Renouvelant la totalité de la Chambre des représentants, un tiers du Sénat et un certain nombre de sièges de gouverneurs et d’assem-blées d’États, les élections de mi-mandat constituent une mesure reconnue quoique peu précise de la popularité du président en place. Elles sont généralement mauvaises pour le parti de ce dernier, surtout s’il s’agit des midterms de son second mandat. Ainsi ces élections induisent-elles un risque récurrent de blocage des institu-tions – ce qui peut paraître un bienfait à certains au pays de l’équilibre des pouvoirs.
Professeur de sciences politiques à l’université de Virginie, Larry Sabato nous fournit des clés de compréhension et une solide base de référence historique pour l’analyse des élections de mi-mandat en général et de celles de 2010 en particulier.
En ce qui concerne ces dernières, il insiste notamment sur l’effet minorant des candidatures issues des Tea Parties sur la victoire des républicains au Sénat et sur l’impact qu’auront les succès républicains au niveau des États sur le redécoupage des circons-criptions électorales pour la décennie 2011-2021. Celui-ci est en effet élaboré par les gouverneurs et chambres des États fédérés et doit intervenir en début d’année, à l’issue du recensement de 2010.
L’étude du sondage de sortie des urnes de novembre dernier permet enfin de confirmer l’évolution des votes selon les catégories précises de population depuis la présidentielle de 2008. Elle pointe surtout ce qui a été l’enjeu central des élections de 2010 et consti-tuera sans doute un facteur décisif pour la présidentielle de 2012 : l’état préoccupant de l’économie pour les électeurs américains.
L. J. Sabato / What Now for Obama?
2 © Ifri
Executive Summary
By renewing the totality of U.S. House seats, a third of U.S. Senate seats and a number of Governors and state assembly seats, midterm elections have long been considered a referendum on the President, even though this particular vote obeys a number of other conside-rations. Midterms are generally bad for the party of the President, especially when they take place during the President’s second term. They do indeed introduce a risk of institutional paralysis, which some in the country of checks and balances may consider a good thing.
Larry J. Sabato, Professor of Politics at the University of Virginia, provides us with solid historical references and keys of analysis to understand midterms in general and those of 2010 in particular.
The most significant elements of the November 2010 election, Sabato tells us, are the damaging effect of Tea Party candidacies on the Republican victory in the Senate; and the lasting consequences of Republican gains in state governorships and legislative chambers: in the wake of the 2010 census, they will be in charge of redistricting the states for national House and state legislative seats for the next decade.
The exit polls show how precise categories of the electorate have evolved since the presidential election of 2008. More than anything, they point to the major factor in the 2010 election –and most probably the 2012 presidential election–: the bad economy and its impact on voters’ attitudes.

L. J. Sabato / What Now for Obama?
3 © Ifri
Contents
INTRODUCTION: ABOUT MIDTERM ELECTIONS ...................................... 4
A Measure of Approval? ............................................................. 5
A Setback for Presidents… ........................................................ 6
The Risk of Gridlock ................................................................... 6
The Sixth-Year Itch ..................................................................... 7
CHRONOLOGICAL COUNTDOWN TO 2010 ............................................. 9
The « Big Picture » Elections ................................................... 14
MAKING SENSE OF THE 2010 MIDTERM ELECTION .............................. 16
The Lower Chamber ................................................................. 16
The Higher Chamber ................................................................ 18
Impact of the Tea Party Movement on Senate Elections ...... 22
State Governorships ................................................................ 23
State Legislative Chambers ..................................................... 26
The 2011 Redistricting Process ............................................ 26
SLICING AND DICING THE 2010 VOTE ................................................. 28
The 2010 Exit Polls Point to the Bad Economy ..................... 30
CONCLUSION: CONNECTING THE DOTS—OR NOT ............................... 33

L. J. Sabato / What Now for Obama?
4 © Ifri
Introduction:
About Midterm Elections
Will President Barack Obama win reelection in 2012? Will 2008 GOP1 vice presidential nominee Sarah Palin run for President? Who will actually emerge as the Republican nominee for President of the United States? The ballots had barely been counted on Election Day 2008 before observers began to ask these questions. Of course, no one knew the answers then, and despite the addition of the 2010 midterm election results, no one knows the answers now.
In politics the only constant is change, and elections in the United States prove it. After two heavily Democratic elections in 2006 and 2008, Republicans surged back to the forefront in 2010. As is often the case in the midterm contests, American voters applied the brakes to the presidential agenda. It was a classic ―check-and-balance‖ election, guaranteed to create gridlock in the American system of separation of powers. Once more, the United States has ―divided government‖—with power divvied up among a Democratic president, a Senate that will be controlled – narrowly – by Democrats, and a sizable Republican majority in the U.S. House of Represen-tatives. Each institution has a popular mandate, yet as a whole, the mandates are overlapping and contradictory.
The deep unpopularity of President George W. Bush, President Obama’s comfortable victory in the presidential election of 2008, and the Democratic-tilting demographic trends underlying it (growth of the Latino, African-American, and youth votes) led many to predict that the Republicans would face a lengthy banishment to a political wilderness. The outcome on November 2, 2010 proved these forecasts to be hasty, and there was a significant pendulum swing among the electorate. The presidential match-up of 2012 will be shaped by the dramatic results witnessed in the midterm. It may be that the pendulum will swing again, and no midterm is a realistic forecast of the next presidential race. Still, the midterm election nicely
Larry J. Sabato is Robert Kent Gooch Professor and University Professor of Politics at the University of Virginia and Director of the U. Va. Center for Politics. To follow all of Professor Sabato’s projections, please visit: Centerforpolitics.org or go on Twitter@LarrySabato. 1 The Republican Party is often called the Grand Old Party, or GOP. Another
particularity non-U.S. readers may want to bear in mind is that blue is the color of the Democrats (as in « California is a blue state ») while red is that of the Republicans.

L. J. Sabato / What Now for Obama?
5 © Ifri
encapsulates the challenges facing President Obama’s reelection campaign and the opportunities Republicans unexpectedly may have to win back the White House.
The midterm election is a remarkable phenomenon that has become a critical part of democracy’s superstructure in the United States. Coming at the midpoint of each presidential term, the elections for about a third of the U.S. Senate, the entire U.S. House of Representatives, and nearly three-quarters of the state governorships give voters an opportunity to pass preliminary judgment on the person in the White House.
A Measure of Approval?
In the strictest sense, a midterm is not a referendum on the president. The president’s name is not on the ballot. But increasingly political scientists have come to realize that campaign outcomes for Congress, governors, and even thousands of state legislative posts around the country have a strong relationship to the voters’ level of approval for the White House administration.
It is not a perfect measure since a much lower proportion of Americans turns out to vote in a midterm year than in a presidential year, and the circumstances vary depending on the political climate. One party’s activists may be more enthused and thus turn out at a higher rate than the other’s, giving them a leg up in producing victories. While 63 percent of adults voted in the 2008 presidential election, about 40 percent voted in November 2010. Republicans were more eager to vote in 2010 in large measure because of their strong opposition to the policies of the Obama administration.
Another reason why a midterm is not a perfect measure of popular opinion is that some states and districts do not have compe-titive contests in any given year. For example, in 2010, 13 states had no election for governor, another 13 lacked a Senate contest, and dozens of the 435 U.S. House races were either unopposed or lightly opposed. Voter turnout was lower in most of these locales. Ideally, if we wanted to accurately determine national public opinion at the ballot box, there would be highly competitive campaigns everywhere. This would encourage more citizens to register their views.
Yet another basis to question midterm elections can be found by examining the races individually. The skills of the candidates, as well as the campaigns they run, influence the results. Simply put, many election outcomes depend heavily on the abilities and characteristics of the people running for office—their strengths, weaknesses, financial war chests, policies, etc. Some politicians are a better fit for their states or districts than their opponents, and they may raise more money and run smarter campaigns. Also, incumbents running for reelection can skew the results, since they usually have

L. J. Sabato / What Now for Obama?
6 © Ifri
higher name recognition and better contacts with cash contributors. A combination of these factors can produce victory for a candidate even though the national tide is in the other party’s direction.
A Setback for Presidents…
Most analysts start from the national perspective because the condi-tions existing in the nation set the tone for virtually every campaign across the United States. From the second midterm of Franklin Roosevelt’s presidency in 1938 through the first midterm of Bill Clinton’s presidency in 1994, the party in charge of the White House lost House seats in the congressional elections without exception.
Political scientists have laid out logical explanations for this. Some have theorized that midterms serve as natural electoral "reflexes" to counterbalance strong party showings in presidential cycles. The notion of ―checks and balances‖ is deeply rooted in our Constitution and our national psyche. Generally, we recoil from giving one political party too much power for too long. Even though most Americans still have some degree of partisan identification with either the Democrats or the Republicans, they may not trust either party enough to countenance unified control of the White House, the Senate, and the House of Representatives by one party for a long period of time.
In the 70 years since the beginning of World War II, Ameri-cans have switched control of the presidency from one party to another eight times, control of the Senate nine times, and control of the House seven times. Unified party control of both the executive and legislative branches is becoming rare. In 33 of the 65 years since 1945, the parties have shared power in one combination or another, and the 2010 election has guaranteed that two more years will be added to the split-control total. In the last 42 years—since President Richard Nixon came to power—there have been just 13 years when one party simultaneously had the White House and majorities of both houses of Congress.
The Risk of Gridlock
This has considerable implications for governance. It is much easier for a party to enact its platform if its officials are in charge across the board. It was only because of large Democratic majorities in both houses of Congress that President Obama was able to narrowly secure passage of an $800 billion stimulus bill, health care reform, and financial services reform from 2009 to 2010. Divided control usually produces gridlock, and not much is accomplished legislatively. On the other hand, conservatives would argue, invoking Henry David

L. J. Sabato / What Now for Obama?
7 © Ifri
Thoreau and Thomas Jefferson, ―That government is best which governs least.‖ To those who favor smaller and less government, gridlock may be a good thing.
Leading up to Election Day, President Obama faced a stern test in maintaining Democratic majorities for the second half of his term, especially since the economy was not cooperating with the party in power. Democrats won a solid Electoral College presidential majority in 2008, and strengthened their hold on both the Senate and the House at the same moment Barack Obama won the presidency. Beginning in the administration of former President George W. Bush, the economy has been exceptionally weak, leading to low ratings for those in power. Voters in November 2010 experienced a kind of ―buyer’s remorse‖ as they remembered the Democratic promises made during the campaign, and compared them to the reality they saw in their lives and the country’s fortunes.
This is a common circumstance throughout American history. Even in good times, voters are inclined to trim at least a few seats from the governing White House party, perhaps to remind those in power that the people are the boss. In rocky stretches, when unem-ployment is up and disposable family income is down, Americans eagerly express their frustrations at the polls. One can think of midterm elections as an opportunity for the voters to send a message to the government. In a very real sense, citizens are suggesting the need for course corrections at the midpoint of a presidency. In 2010 voters applied the brakes to a presidential agenda that most regarded as far-reaching.
The Sixth-Year Itch
Usually, but not always, the president’s party loses fewer seats in the first midterm than in the second, which occurs in the sixth year of a two-term presidency. There have been seven of these sixth-year elections in the post–World War II era: 1950, 1958, 1966, 1974, 1986, 1998, and 2006. This tendency is called the ―sixth-year itch.‖ But history can play tricks, and there are no iron laws in politics.
For instance, the durability of the sixth-year itch prior to 1998 led most analysts to speculate about how many seats President Clinton’s Democrats would lose, especially in the midst of an im-peachment effort following the Monica Lewinsky sex scandal. Yet remarkably, the Democrats gained a few House seats and held their own in the Senate, as voters appeared to resent Republican efforts to oust Clinton. If President Obama is reelected in 2012—a result not to be taken for granted given the 2010 outcome and continuing econo-mic distress—it will be interesting to see whether his second midterm, in 2014, is more or less unhappy for his party than his first midterm. That is, will Obama follow the Clinton model in reversing the usual relationship of mild to moderate losses in the first midterm versus

L. J. Sabato / What Now for Obama?
8 © Ifri
heavy losses in the second? It is far too soon to have any reasonable guess, even if one makes a hasty assumption about a second Obama term.
Another unusual midterm election occurred in 2002—the first of the George W. Bush presidency. In the wake of the terrorist attacks on September 11, 2001, the narrowly elected Bush soared to near-unanimous approval in the opinion polls, and a year later he retained enough of that popularity to add GOP seats in both the House and Senate. This was something that had not occurred in the first midterm election of a presidency since 1934 when Franklin Roosevelt’s New Deal program to combat the Great Depression was exceptionally popular.
Both the 1998 and 2002 cycles took place under extraordinary circumstances that enhanced the political positions of the presidents' parties. It is possible that in a couple of decades, we will look back on 1998 and 2002 as the "great exceptions" to the historic rules that have governed midterm elections. By definition, exceptional elections do not happen often. Sure enough, in 2006 (Bush’s sixth-year-itch election), Americans returned to form, and Democrats regained majorities in both the House and the Senate, ending years of unified GOP rule.

L. J. Sabato / What Now for Obama?
9 © Ifri
Chronological Countdown to 2010
At this point, a short history lesson will help to better understand the ebb and flow of public opinion in modern midterm years, and the effect – or lack thereof – on each subsequent US presidential elec-tion:
Just for starters, let us take a glance at the midterm results from 1946 to 2002 (also see tables 1 and 2, as well as figures 1, 2, and 3 for reference). It is all so easy to analyze after the fact, and every bit of it falls neatly into a sentence or two:
1946: After 14 years of solid Democratic control under Franklin D. Roosevelt (FDR) and Harry S. Truman, voters wanted change. The end of World War II and postwar economic dislocation encouraged the ―time for a change‖ theme. Truman did not seem up to the job—who would, after Franklin Roosevelt?—and the mantra became ―To err is Truman.‖ So Republicans captured both houses of Congress, grabbing 55 House seats and 12 Senate seats, plus two more governorships (for a total of 25 out of 48).
1950: Truman’s come-from-behind presidential victory in 1948 had restored Democratic rule by adding 76 House and nine Senate seats. But 18 straight years of Democratic presidencies and an unpopular war in Korea took their toll again in the midterm, and Democrats gave back 29 House and six Senate seats. Recognize those numbers? They are identical to the Democratic net gains in 2006, when another unpopular foreign war, this time in Iraq, dealt the governing party a severe setback.
1954: Dwight Eisenhower’s triumph two years earlier gave the GOP narrow majorities in Congress, even though his coattails were not particularly long. By the time of the midterm, a slight swing away from the Republicans cost 18 of the party’s 24 newly gained House seats and one Senate seat.
1958: This is the first dramatic modern example of the so-called ―sixth-year itch,‖ when voters decide to give the other party sizable congressional majorities after the first six years of a two-term presidency. While Democrats had already won back control of Congress in 1956, despite Eisenhower’s landslide reelection, the additional 48 House and 13 Senate berths for Democrats ensured that Ike’s legislative influence would be minimal in his final two years in office.

L. J. Sabato / What Now for Obama?
10 © Ifri
Table 1. Gain or Loss for President’s Party: Presidential Election Years
Year President House Senate Governor
1948 Truman (D) +76 +9 +6
1952 Eisenhower (R) +24 +2 +5
1956 Eisenhower (R) -2 0 -2
1960 Kennedy (D) -20 -2 0
1964 Johnson (D) +38 +2 -1
1968 Nixon (R) +7 +5 +4
1972 Nixon (R) +13 -2 -1
1976 Carter (D) +2 0 +1
1980 Reagan (R) +33 +12 +4
1984 Reagan (R) +15 -2 +1
1988 Bush (R) -3 -1 -1
1992 Clinton (D) -10 0 +2
1996 Clinton (D) +9 -2 -1
2000 Bush (R) -2 -5 -1
2004 Bush (R) +3 +4 0
2008 Obama (D) +21 +8 +1
Source: Compiled by the author
1962: Like Eisenhower before him, John F. Kennedy (JFK) had almost no coattails in his 1960 presidential squeaker; Democrats actually lost 20 House seats and two Senate seats. JFK feared more losses in his 1962 midterm, but the Cuban Missile Crisis boosted support for his administration just before the balloting. The result was a wash, with Democrats losing four House seats but picking up three Senate seats. Such “October surprises” can affect congressional elections every bit as much as presidential contests.
1966: Lyndon Johnson’s historic 61 percent landslide in 1964 appeared to presage a new era of Democratic rule, as he carried in 38 House freshmen and two additional senators to an already heavily Democratic Congress. But that was before the Vietnam War began to devour President Johnson. Already by 1966, voters were turning against the president’s conduct of the war, and it cost the Democrats 47 House seats and two Senate seats—though not overall control of Congress.
1970: Richard Nixon’s close 43 percent victory in 1968 did not stop him from dreaming of a ―silent majority‖ of Republicans and conservative Southern Democrats, and he made a major effort to improve the GOP’s weak position in Congress. (Nixon had added but seven House members and five senators to the Republican minority in 1968.) His efforts paid off to a certain degree, as the GOP added two Senate seats in 1970, while holding House losses to a relatively small 12 seats. Democrats still ruled the Capitol Hill roost, though.

L. J. Sabato / What Now for Obama?
11 © Ifri
Table 2. Gain or Loss for President’s Party: Midterm Election Years
Year President House Senate Governor
1946 Truman (D) -55 -12 +2
1950 Truman (D) -29 -6 -6
1954 Eisenhower (R) -18 -1 -9
1958 Eisenhower (R) -48 -13 -5
1962 Kennedy (D) -4 +3 0
1966 Johnson (D) -47 -4 -8
1970 Nixon (R) -12 +2 -11
1974 Ford (R) -48 -5 -5
1978 Carter (D) -15 -3 -5
1982 Reagan (R) -26 +1 -7
1986 Reagan (R) -5 -8 +8
1990 Bush (R) -9 -1 -2
1994 Clinton (D) -52 -9 -10
1998 Clinton (D) +5 0 0
2002 Bush (R) +6 +2 -1
2006 Bush (R) -30 -6 -6
2010 Obama (D) -63 -6 -7*
* This total of seven includes Florida, which switched on Election Day from an independent governor, Charlie Crist, to a Republican governor, Rick Scott. Crist was elected as a Republican in 2006 but left the party in spring 2010 to run unsuccessfully for the U.S. Senate. We traditionally count party switches in this fashion, though one could argue that there was no change between the elections of 2006 and 2010, and thus the national gain for the GOP in 2010 was +6 governorships. Take your pick. Source: Compiled by the author
1974: Oddly, Nixon’s 61 percent reelection landslide in 1972 almost precisely returned his party to its paltry 1968 levels in both houses. The Republicans could ill afford a coattail-less election, given what was soon to happen: Nixon’s resignation in disgrace, a recession, and an unelected successor GOP president (Gerald Ford) who squandered his initial popularity by pardoning Nixon—all just in time for November 1974. Democrats picked up 48 House seats and five Senate seats; Ford was left mainly with his veto power for his remaining two years in office.
1978: Jimmy Carter’s narrow 1976 election left Congress virtually unchanged, though still heavily Democratic. And Carter’s fall from grace had barely started in 1978. A quiet midterm before the storm of 1980 nonetheless subtracted 15 House and three Senate seats from the Democratic totals.
1982: Ronald Reagan’s 10-point slaughter of Carter in 1980 was a now-rare coattail election, as the GOP also won 33 House seats and 12 Senate seats. That was enough to take over the Senate outright and obtain a working majority on some issues with

L. J. Sabato / What Now for Obama?
12 © Ifri
conservative House Democrats. But this tumultuous period in American politics continued through 1982, when a serious recession deprived the GOP of 26 House seats. The Senate stayed Republican, however, and the GOP actually added a seat.
1986: After yet another coattail-less reelection of a president—Reagan’s massive 59 percent win in 1984—the sixth-year itch returned in 1986. Voters turned over eight Senate seats to the Democrats, and thus control of that body. The GOP lost only five House seats, but the Democrats were solidly in charge of the House in any event.
Figure 1. Political Divisions of the U.S. Senate on Opening Day of Congress
Figure 2. Political Divisions of the U.S. House on Opening Day of Congress

L. J. Sabato / What Now for Obama?
13 © Ifri
1990: Vice President Bush had won Reagan’s ―third term‖ in 1988 by a solid 54 percent margin, but the Republicans suffered from having no coattails again, losing three House seats and one Senate seat. With partisan politics somewhat at abeyance due to the pre-Persian Gulf War military buildup, a quiet midterm saw Republicans lose nine House seats and one Senate berth. Much like Carter in 1978, Bush did not see the gathering storm clouds in this eerie calm.
1994: A recession and a disengaged administration took George H.W. Bush from the all-time height of 90 percent popularity to a humiliating 38 percent finish in the 1992 election. With Ross Perot securing 19 percent, Bill Clinton’s 43 percent victory was not impressive, and Democrats lost 10 House seats and stayed even in the Senate. A disastrous overreaching by new President Clinton on health care reform, gays in the military, and other issues, cou-pled with a slow economy, produced a sixth-year itch in the second year. In 1994 Republicans gained an eye-popping 52 House seats and nine Senate seats to win control of both houses.
1998: Proving that every defeat can yield the seeds of victory, Clinton let Republicans overreach just as he had. Running against both ex-Senate majority leader Bob Dole (the GOP nominee) and Speaker Newt Gingrich (the unpopular foil), Clinton won a 49 per-cent reelection. But Democrats captured only nine House seats and actually lost two more Senate seats, leaving Republicans in charge of Congress. Would Clinton have another catastrophic mid-term election? It certainly looked that way as the Monica Lewinsky scandal unfolded. But Republicans again overplayed their hand, beginning unpopular impeachment proceedings that yielded a Democratic gain of five House seats (with the Senate unchanged).
2002: ―The George W. Bush Midterm,‖ plain and simple. In an election dominated by terrorism, Iraq, and the president himself, the Republicans defied conventional wisdom by gaining seats in both houses of Congress, making Bush the first president since FDR in 1934 to pick up seats in both houses in his first term. The Democrats were unable to link the poor economy to Bush, and the media’s extensive coverage of the impending confrontation with Iraq and the Beltway sniper incidents in the Washington, D.C. area overshadowed the somewhat fuzzy Democratic election agenda. In the final two weeks of the general election, key White House adviser Karl Rove sent Bush on a whirlwind campaign tour of the battleground states, which ended up reaping rich rewards for the GOP. The Republicans gained two seats in the Senate and six House seats. The only positive note for the Democrats was a net gain of three governorships, but the GOP maintained a narrow overall statehouse majority (26 to 24).
L. J. Sabato / What Now for Obama?
14 © Ifri
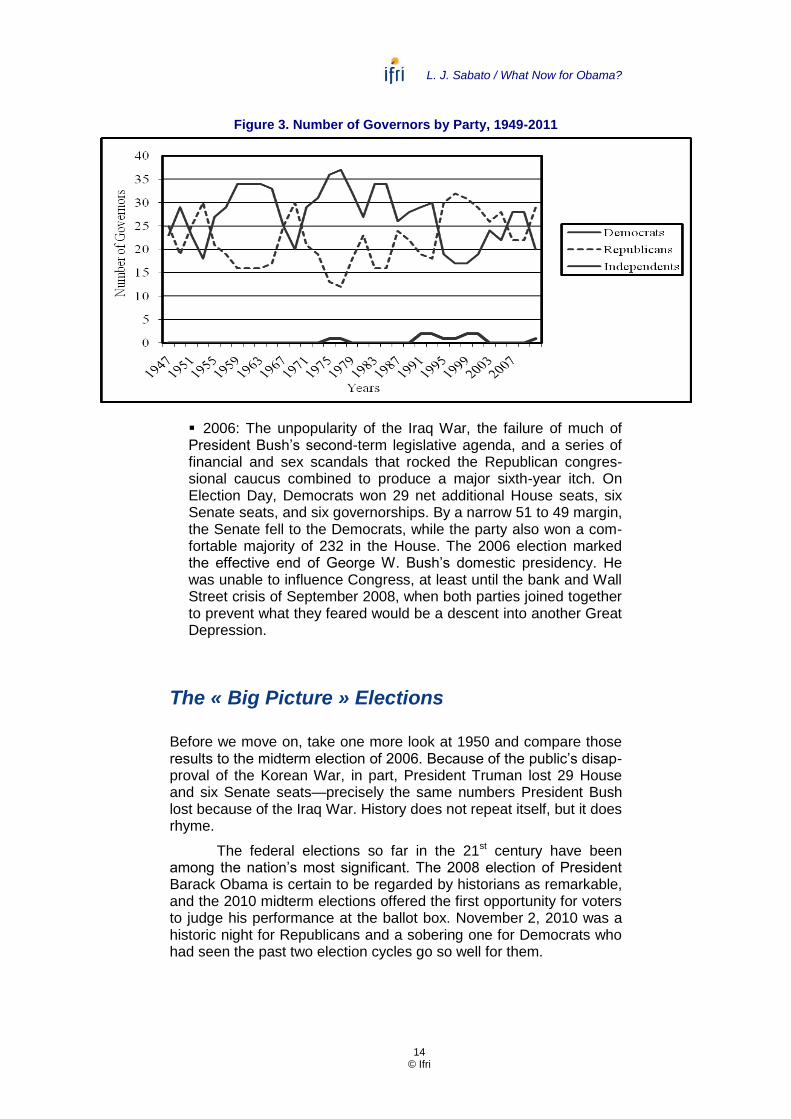
Figure 3. Number of Governors by Party, 1949-2011
2006: The unpopularity of the Iraq War, the failure of much of President Bush’s second-term legislative agenda, and a series of financial and sex scandals that rocked the Republican congres-sional caucus combined to produce a major sixth-year itch. On Election Day, Democrats won 29 net additional House seats, six Senate seats, and six governorships. By a narrow 51 to 49 margin, the Senate fell to the Democrats, while the party also won a com-fortable majority of 232 in the House. The 2006 election marked the effective end of George W. Bush’s domestic presidency. He was unable to influence Congress, at least until the bank and Wall Street crisis of September 2008, when both parties joined together to prevent what they feared would be a descent into another Great Depression.
The « Big Picture » Elections
Before we move on, take one more look at 1950 and compare those results to the midterm election of 2006. Because of the public’s disap-proval of the Korean War, in part, President Truman lost 29 House and six Senate seats—precisely the same numbers President Bush lost because of the Iraq War. History does not repeat itself, but it does rhyme.
The federal elections so far in the 21st century have been among the nation’s most significant. The 2008 election of President Barack Obama is certain to be regarded by historians as remarkable, and the 2010 midterm elections offered the first opportunity for voters to judge his performance at the ballot box. November 2, 2010 was a historic night for Republicans and a sobering one for Democrats who had seen the past two election cycles go so well for them.

L. J. Sabato / What Now for Obama?
15 © Ifri
By the way, a record number of elections for state governor and the largest number of Senate seats since 1962 were at stake in 2010. Adding to the political drama was the fact that 405 of the 435 U.S. House seats had nominees from both major political parties—the largest proportion since 1996.
Democrats, Republicans, and others may not agree on very much these days, but Americans were virtually unanimous in seeing 2010 as a critical midterm election. This was another ―big picture‖ election, with the issues of a lagging economy, skyrocketing national debt, health care reform, and many other issues factoring into the decisions that voters were asked to make.
L. J. Sabato / What Now for Obama?
16 © Ifri
Making Sense of the 2010 Midterm Election
When looking back at any election, we first need to examine the basic facts of what happened on Election Day. The one-sided nature of 2010 makes this exercise a simple one.
The Lower Chamber
In the House of Representatives, Republicans had their best election in 72 years. In 1938, Democratic president Franklin Roosevelt suffe-red his sixth-year itch, and Republicans gained 80 seats. Amazingly, though, the Republicans still failed to take control of the heavily Democratic House in the New Deal era.
In 2010 Republicans had much better luck since they were starting from a higher seat level. The GOP needed to gain 39 House seats to take control of the lower chamber—218 seats is a simple majority—and the party easily surpassed that number by 24 seats. With 242 total seats in the new House, the Republicans secured their largest majority since the 246 seats they won in 1946, the first post-World War II election. Even in the 1994 Republican congressional sweep, the total of GOP seats had been only 232.
2010 was also the worst year for House incumbents in over three decades. (See table 3.) With 58 incumbents losing their seats (four in the primary and 54 in the general), just 85 percent of House members who sought another term were reelected. By contrast, 38 incumbents lost in 1994, a year often thought of as a killing field for Democratic congressmen.

L. J. Sabato / What Now for Obama?
17 © Ifri
Table 3. Defeated House Incumbents, 1980-2010
Year Primary General
1980 6 31
1982 10 29
1984 3 16
1986 3 6
1988 1 6
1990 1 15
1992 19 24
1994 4 34
1996 2 21
1998 1 6
2000 3 6
2002 8 8
2004 2 7
2006 2 22
2010 4 54
Figure 4. U.S. House Seat Pickups in the 2010 Midterm Election
Take a look at the map in figure 4. Each dot represents the
switch of a House seat from one party to the other in that district. The 66 dark dots represent Republican pick-ups, while the three lighter dots in Delaware, Hawaii, and Louisiana represent the only seats Democrats were able to switch from the GOP this cycle.
The Election Day ―wave‖ for the Republicans produced a bumper crop of new seats in southern border states, where the GOP traditionally does well. But the key to the Republican House takeover occurred in the North Central states from Pennsylvania through the industrial Midwest.

L. J. Sabato / What Now for Obama?
18 © Ifri
Note that even overwhelmingly Democratic New York State added five Republican House seats in 2010, despite Democratic landslides for governor and both U.S. Senate posts in the state. Of course, this is partly explained by the GOP’s recent failures in the Empire State; prior to November 2010, the party had fallen to a mere two House seats out of 29, and had nowhere to go but up.
The other side of the coin can be seen in the Pacific Coast states (Alaska, California, Hawaii, Oregon, and Washington). Despite the red wave sweeping America, the net House gain for the GOP in these five states was zero (+1 in Washington and -1 in Hawaii). California, Oregon, and Washington, in particular, have become a blue sandbar that can withstand even a Republican tsunami.
The Higher Chamber
Despite the Republicans’ success in the House, the Senate proved a much tougher nut to crack. Democrats had a large 59-seat majority in the 100-member Senate on Election Day. (The total of 59 includes two Independents, Senators Joseph Lieberman of Connecticut and Bernie Sanders of Vermont, who both caucus with the Democrats.) This meant that Republicans needed to gain 10 seats to win control since Democratic vice president Joseph Biden would break a 50-50 tie in his party’s favor. While it has been done on occasion, it is difficult to secure that many seat turnovers with only 37 Senate seats on the ballot across the country. In the end, Senate incumbents on the ballot had a reasonably good year, with just four of 23 losing reelection (two each in the primary and general). In four recent election years, more incumbent senators have lost their seats. (See table 4.)
While Republicans held all 19 of their Senate seats on the ballot, they were able to gain just six of the 10 seats they needed for control, winning formerly Democratic seats in Arkansas, Illinois, Indiana, North Dakota, Pennsylvania, and Wisconsin. Democrats held onto 12 of the 18 Senate seats they were defending. (See a list of all Senate races in table 5 and the corresponding map in figure 4 bis).

L. J. Sabato / What Now for Obama?
19 © Ifri
Figure 4 bis. Senate Race Results, 2010
Map credit: Joe Figueroa, U.Va. Center for Politics
Table 4. Defeated Senate Incumbents, 1980-2010
Year Primary General
1980 4 9
1982 0 2
1984 0 3
1986 0 7
1988 0 4
1990 0 1
1992 1 4
1994 0 2
1996 1 1
1998 0 3
2000 0 6
2002 1 3
2004 0 1
2006 0* 6
2010 2^ 2
*Sen. Joseph Lieberman (D) of Connecticut was defeated for renomination in an August 8 primary but won the general election as a petitioning Independent. ^Sen. Lisa Murkowski (R) was defeated in the Republican primary by Joe Miller, but won the general election as a write-in (see footnote#1), so she is not counted in the total.

L. J. Sabato / What Now for Obama?
20 © Ifri
Table 5. Senate Races, 2010
State Candidate Percentage Total
Alaska^ Lisa Murkowski (R-write in)* 40 102,252
Joe Miller (R) 35 90,740
Scott McAdams (D) 23 60,007
Alabama Richard Shelby (R)* 65 964,329
William Barnes (D 35 513,540
Arkansas John Boozman (R) 58 447,562
Blanche Lincoln (D)* 37 284,362
Arizona John McCain (R)* 59 926,372
Rodney Glassman (D) 35 540,904
California Barbara Boxer (D)* 52 4,377,730
Carly Fiorina (R) 42 3,554,066
Colorado Michael Bennet (D)* 48 799,072
Ken Buck (R) 47 783,426
Connecticut Richard Blumenthal (D) 55 627,085
Linda McMahon (R) 43 493,158
Delaware Chris Coons (D) 57 173,900
Christine O’Donnell (R) 40 123,025
Florida Marco Rubio (R) 49 2,615,262
Charlie Crist (I) 30 1,588,821
Kendrick Meek (D) 20 1,076,028
Georgia Johnny Isakson (R)* 58 1,462,823
Michael Thurmond (D) 39 986,338
Hawaii Daniel Inouye (D)* 75 276,928
Cam Cavasso (R) 22 79,830
Iowa Chuck Grassley (R)* 65 714,667
Roxanne Conlin (D) 33 368,202
Idaho Michael Crapo (R)* 71 318,704
Tom Sullivan (D) 25 111,924
Illinois Mark Kirk (R) 48 1,765,594
Alexi Giannoulias (D) 46 1,694,093
Indiana Dan Coats (R) 57 950,244
Brad Ellsworth (D) 42 695,859
Kansas Jerry Moran (R) 70 578,768
Lisa Johnston (D) 26 215,270
Kentucky Rand Paul (R) 56 755,061
Jack Conway (D) 44 598,885
Louisiana David Vitter (R)* 57 715,304
Charles Melancon (D) 38 476,423
Maryland Barbara Mikulski (D)* 62 1,055,387
Eric Wargotz (R) 36 619,204
Missouri Roy Blunt (R) 54 1,051,495
Robin Carnahan (D) 41 785,719

L. J. Sabato / What Now for Obama?
21 © Ifri
State Candidate Percentage Total
North Carolina Richard Burr (R)* 55 1,448,003
Elaine Marshall (D) 43 1,131,305
North Dakota John Hoeven (R) 76 181,409
Tracy Potter (D) 22 52,854
New Hampshire Kelly Ayotte (R) 60 272,703
Paul Hodes (D) 37 166,538
Nevada Harry Reid (D)* 50 361,655
Sharron Angle (R) 45 320,996
New York (full) Charles Schumer (D)* 65 2,710,735
Jay Townsend (R) 33 1,365,439
New York (special)
Kirsten Gillibrand (D)* 62 2,519,806
Joe DioGuardi (R) 36 1,455,183
Ohio Rob Portman (R) 57 2,125,555
Lee Fisher (D) 39 1,447,848
Oklahoma Tom Coburn (R)* 71 716,347
Jim Rogers (D) 26 265,519
Oregon Ron Wyden (D)* 57 775,569
Jim Huffman (R) 39 564,362
Pennsylvania Pat Toomey (R) 51 1,995,026
Joe Sestak (D) 49 1,916,703
South Carolina Jim DeMint (R)* 62 792,133
Alvin Greene (D) 28 358,276
South Dakota John Thune (R)* uncontested
Utah Mike Lee (R) 62 360,130
Sam Granato (D) 33 191,657
Vermont Patrick Leahy (D)* 64 148,444
Len Britton (R) 31 71,273
Washington Patty Murray (D)* 52 1,247,071
Dino Rossi (R) 48 1,176,017
Wisconsin Ron Johnson (R) 52 1,125,637
Russ Feingold (D)* 47 1,020,860
West Virginia Joe Manchin (D) 54 280,771
John Raese (R) 44 227,960
Source: Official sources * Indicates incumbent. ^ Indicates unofficial results. Note: Percentages may not total 100 because of rounding
L. J. Sabato / What Now for Obama?
22 © Ifri
Impact of the Tea Party Movement on Senate Elections While delighted with their victories, senior Republicans privately rued the fact that they could have achieved at least a 50-50 Senate tie had stronger candidates been nominated in states such as Colorado, Delaware, and Nevada. In all of those states, the new Tea Party faction of the GOP overwhelmed more mainstream candidates in party primaries to nominate candidates that were too far to the right—and too ill prepared for the rigors of modern campaigning—to win general elections. All three of these contests are dissected later in this volume, so it is enough to say for now that GOP nominees Ken Buck (Colorado), Christine O’Donnell (Delaware), and Sharron Angle (Nevada) cost the Republicans dearly.
At the same time, it should be noted that Tea Party candidates won several other Senate races (such as those in Kentucky and Utah), as well as several dozen House seats and a few governor-ships. However, in the vast majority of cases, they won in heavily Republican territory, where almost any GOP nominee was going to be elected in the strongly Republican year of 2010.
The strangest election of the year may well have been in Alaska, where incumbent Lisa Murkowski (R-AK) was upended in a low-turnout GOP primary by Tea Party candidate Joe Miller. Instead of endorsing Miller, Murkowski decided to launch what appeared to be a long-shot write-in candidacy2 against Miller and a weak Demo-cratic nominee, Scott McAdams. Yet Miller drowned in a sea of gaffes and controversies, and to the amazement of the national political community, Murkowski became the first Senate write-in contender to win since Strom Thurmond did so in 1954 in South Carolina. Murkowski will continue to sit in the Republican caucus, though many are watching to see whether she votes more often as a moderate-conservative after her near-fatal brush with the Tea Party.
By the way, the Tea Party is not an official political party, but rather a grassroots movement of conservatives (mainly Republicans) who are concerned about the level of taxation, spending, and national debt. There is no question this group will be a major force in the 2012 Republican presidential process. While these activists bring new energy to GOP efforts, there is also a danger that they could push the party to nominate a candidate unable to win in November, just like the 2010 Senate nominees we have discussed. But it is also possible the movement will mature over the next two years and learn to consider ―electability‖ at the polling places on primary day.
2 A write-in candidate is a candidate in an election whose name does not appear on
the ballot, but for whom voters may vote nonetheless by writing in the person's name. Write-in candidates usually stand a very small chance of winning. Write-in candidacies are a mostly American tradition.

L. J. Sabato / What Now for Obama?
23 © Ifri
State Governorships
For all the legitimate attention the congressional elections received, the contests at the state level may have more long-term meaning. In adding six net governorships (seven counting Florida, which flipped from Independent-controlled to Republican), the GOP climbed to control of 29 states, including the powerhouses of Pennsylvania, Michigan, and Ohio. This Republican statehouse total was the most in a decade. (See table 6 for a listing of the results of all 37 governor’s contests and figure 5 for the corresponding map.) Moreover, the GOP added some much needed diversity into their officeholders’ ranks with the election of Hispanic Governors Susana Martinez of New Mexico and Brian Sandoval of Nevada, as well as Governor Nikki Haley of South Carolina, whose roots are traced to the Indian subcontinent.
On the other hand, Democrats kept 20 statehouses and captured the biggest prize of the night, gargantuan California. Retiring GOP governor Arnold Schwarzenegger could not run again—and given his very low popularity, almost certainly could not have won another term. Democrat Jerry Brown, formerly governor from 1975 to 1983, won by a wide margin over Republican Meg Whitman. One state, tiny Rhode Island, was taken by an Independent, former GOP U.S. senator Lincoln Chafee.
The overall GOP trend obscured the sizable degree of seat-swapping that took place around the nation. Republicans captured 11 governorships formerly in Democratic control, while Democrats managed to wrest three governorships away from the GOP, despite the bad environment for their party.
Table 6. Governors’ Races, 2010
State Candidate Percentage Total
Alabama Robert Bentley (R) 58 857,162
Ron Sparks(D) 42 623,492
Alaska Sean Parnell (R)* 59 119,347
Ethan Berkowitz(D) 38 77,552
Arizona Jan Brewer (R)* 55 867,323
Terry Goddard (D) 42 669,793
Arkansas Mike Beebe (D)* 65 498,755
Jim Keet (R) 34 260,282
California Jerry Brown (D) 53 4,552,290
Meg Whitman (R) 42 3,571,675
Colorado John Hickenlooper (D) 51 856,569
Tom Tancredo (C) 37 620,626
Dan Maes (R) 11 187,998
Connecticut Dan Malloy (D) 50 564,885
Tom Foley (R) 49 557,123

L. J. Sabato / What Now for Obama?
24 © Ifri
State Candidate Percentage Total
Florida Rick Scott (R) 49 2,589,915
Alex Sink (D) 48 2,522,857
Georgia Nathan Deal (R) 53 1,341,589
Roy Barnes (D) 43 1,094,621
Hawaii Neil Abercrombie (D) 58 222,510
Duke Aiona (R) 41 157,098
Idaho Butch Otter (R)* 59 266,717
Keith Allred (D) 33 148,223
Iowa Terry Branstad (R) 53 589,565
Chet Culver (D)* 43 481,297
Illinois Pat Quinn (D) *47 1,721,812
Bill Brady (R) 46 1,702,399
Kansas Sam Brownback (R) 63 522,540
Tom Holland (D) 32 264,214
Maine-Paul LePage (R) 38 215,486
Eliot Cutler (I) 37 205,601
Libby Mitchell (D) 19 107,702
Maryland Martin O’Malley (D)* 56 966,446
Robert Ehrlich (R) 42 733,491
Massachusetts Deval Patrick (D)* 48 1,108,404
Charlie Baker (R) 42 962,848
Tim Cahill (I) 8 183,933
Michigan Rick Snyder (R) 58 1,880,438
Virg Bernero (D) 40 1,289,928
Minnesota Mark Dayton (D) 44 919,231
Tom Emmer (R) 43 910,480
Tom Horner (I) 12 251,491
Nebraska Dave Heineman (R)* 74 352,267
Mike Meister (D) 26 121,994
Nevada Brian Sandoval (R) 53 382,350
Rory Reid (D) 42 298,170
New Hampshire John Lynch (D)* 53 239,390
John Stephen (R) 45 205,433
New Mexico Susana Martinez (R) 54 317,421
Diane Denish (D) 47 274,892
New York Andrew Cuomo (D) 61 2,602,443
Carl Paladino (R) 34 1,445,779
Ohio John Kasich (R) 49 1,849,609
Ted Strickland (D)* 47 1,752,507
Oklahoma Mary Fallin (R) 60 624,285
Jari Askins (D) 40 415,150
Oregon John Kitzhaber (D) 49 680,840
Chris Dudley (R) 48 665,930

L. J. Sabato / What Now for Obama?
25 © Ifri
State Candidate Percentage Total
Pennsylvania Tom Corbett (R) 55 2,137,983
Dan Onorato (D) 45 1,783,995
Rhode Island Lincoln Chafee (I) 36 123,398
John Robitaille (R) 34 114,761
Frank Caprio (D) 23 78,776
South Carolina Nikki Haley (R) 51 674,576
Vincent Sheheen (D) 47 617,733
South Dakota Dennis Daugaard (R) 62 195,021
Scott Heidepriem (D) 38 122,010
Tennessee Bill Haslam (R) 65 1,040,688
Mike McWherter (D) 33 529,834
Texas Rick Perry (R)* 55 2,733,784
Bill White (D) 42 2,102,606
Utah Gary Herbert (R)* 64 381,244
Peter Corroon (D) 32 188,832
Vermont Peter Shumlin (D) 50 116,277
Brian Dubie (R) 48 111,988
Wisconsin Scott Walker (R) 52 1,128,159
Tom Barrett (D) 47 1,005,008
Wyoming Matt Mead (R) 72 123,764
Leslie Petersen (D) 25 43,336
Source: Official sources
* Indicates incumbent.
Figure 5. Governors’ Race Results, 2010
* Denotes the pick-up of a new governorship for the victorious party Map credit: Joe Figueroa, U.Va. Center for Politics

L. J. Sabato / What Now for Obama?
26 © Ifri
State Legislative Chambers
The turnover at the state legislative level was nothing short of astounddding, and here the Republicans could do virtually all the crowing. As the map in figure 6 shows, the GOP picked up about 720 state legislative seats out of the 6,115 on the ballot in 2010. This enabled the Republicans to grab 20 state legislative chambers (House and/or Senate) in 14 states, including both houses in Alabama, Maine, Minnesota, New Hampshire, North Carolina, and Wisconsin.3 By comparison, Republicans picked up 472 state legislative seats in their 1994 landslide year, and Democrats won 628 legislative seats in 1974, the year when they benefited enormously from the Nixon Watergate scandal.4
Figure 6. Republican State Legislature Pickups, 2010
Map credit: Joe Figueroa, U.Va. Center for Politics
The 2011 Redistricting Process Why is this so noteworthy? Once the decennial census population figures are released in early 2011, the governors and state legislatures in most states will re-draw the district lines for U.S. House and state legislative seats. Seven states—Alaska, Montana, North Dakota, South Dakota, Wyoming, Delaware, Vermont—have just one U.S. representative, so the lines cannot be changed there, and seven more states—California, New Jersey, Washington, Arizona, Hawaii, Florida, and Idaho—have non-partisan redistricting where governors and legislatures have little or no direct influence on redistricting.
3 National Conference of State Legislatures at http://www.ncsl.org
4 Jeremy P. Jacobs, ―Devastation: GOP Picks Up 680 State Leg. Seats,‖ posted
online on Hotline On Call at Hotlineoncall.nationaljournal.com
L. J. Sabato / What Now for Obama?
27 © Ifri
As a result of the strongly Republican election results in 2010, the GOP will completely control the redistricting process in 17 states covering 195 U.S. House seats, while Democrats will have the same power in just six states and 49 House seats. Inevitably, Republicans will be able to protect some of their endangered incumbents and eliminate some Democratic districts during the redistricting process. It is impossible to estimate exactly how many seats will be added to the GOP column via redistricting before the fact, but it will be surprising if Republicans cannot manage at least a dozen-seat gain in the House and many dozens in state legislatures around the country. These new lines, assuming they are confirmed during the inevitable legal challenges that follow, will last until the next redistricting in 2021.5
5 In 2011, 10 states are projected to lose U.S. House seats (one or two) as a result of
population shifts: New York (-2), Ohio (-2), New Jersey (-1), Illinois (-1), Massachusetts (-1), Louisiana (-1), Iowa (-1), Missouri (-1), Michigan (-1), and Pennsylvania (-1). Eight states are projected to gain U.S. House seats (up to four) at the same time. They are: Texas (4), Florida (2), Georgia (1), South Carolina (1), Utah (1), Nevada (1), Washington (1), and Arizona (1). Keep in mind that with the transfer of House seats also go Electoral College votes. All the changes, for both House seats and the Electoral College, take effect in the 2012 election. It is worth noting that the actual census population figures, once released, may or may not confirm all of these projections.

L. J. Sabato / What Now for Obama?
28 © Ifri
Slicing and Dicing the 2010 Vote
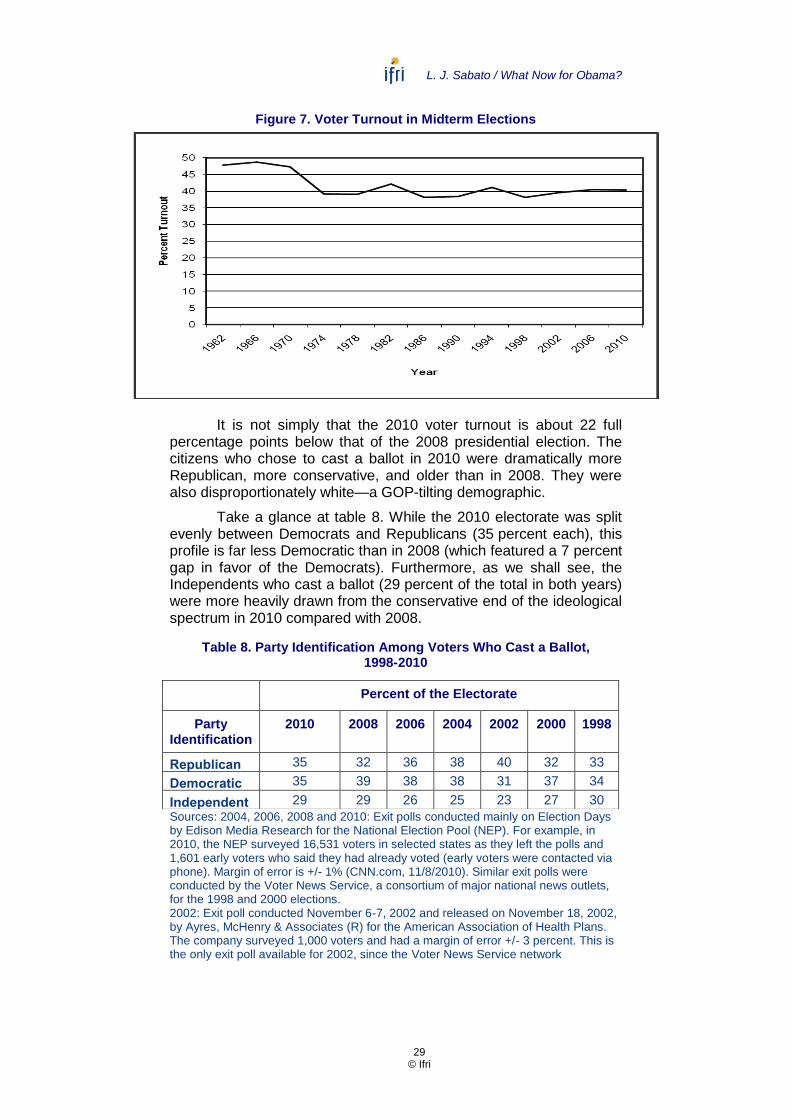
Every election is determined by the people who show up. This truism is amply demonstrated in the 2010 election. Often political observers make the fundamental error of equating all electorates, but in fact, the smaller midterm electorate is not a random sampling of the big-turnout presidential group of voters. As mentioned earlier, the turnout in 2010 of the voting eligible population (VEP—see definition below table 7) was between 40 and 41 percent. This is approximately the same turnout the nation has produced for every midterm election since 1974 (the first one that included the newly enfranchised 18- to 20-year-olds).
Table 7. Voter Turnout in Midterm Elections
Year Turnout of Voting Eligible Population (VEP)
1962 47.7%
1966 48.7
1970 47.3
1974 39.1
1978 39.0
1982 42.1
1986 38.1
1990 38.4
1994 41.1
1998 38.1
2002 39.5
2006 40.4
2010 40.3
Source: United States Elections Project, Michael McDonald (George Mason University) at Elections.gmu.edu
Voting eligible population (VEP) means the voting-age popu-lation (from 1962 to 1970 this was adults age 21 and over, but since 1974 it is age 18 and over) minus those ineligible to vote, such as noncitizens, felons, and mentally incapacitated persons, but adding persons in the military or civilians living overseas who are eligible to cast ballots in U.S. elections.
L. J. Sabato / What Now for Obama?
29 © Ifri
Figure 7. Voter Turnout in Midterm Elections
It is not simply that the 2010 voter turnout is about 22 full
percentage points below that of the 2008 presidential election. The citizens who chose to cast a ballot in 2010 were dramatically more Republican, more conservative, and older than in 2008. They were also disproportionately white—a GOP-tilting demographic.
Take a glance at table 8. While the 2010 electorate was split evenly between Democrats and Republicans (35 percent each), this profile is far less Democratic than in 2008 (which featured a 7 percent gap in favor of the Democrats). Furthermore, as we shall see, the Independents who cast a ballot (29 percent of the total in both years) were more heavily drawn from the conservative end of the ideological spectrum in 2010 compared with 2008.
Table 8. Party Identification Among Voters Who Cast a Ballot, 1998-2010
Sources: 2004, 2006, 2008 and 2010: Exit polls conducted mainly on Election Days by Edison Media Research for the National Election Pool (NEP). For example, in 2010, the NEP surveyed 16,531 voters in selected states as they left the polls and 1,601 early voters who said they had already voted (early voters were contacted via phone). Margin of error is +/- 1% (CNN.com, 11/8/2010). Similar exit polls were conducted by the Voter News Service, a consortium of major national news outlets, for the 1998 and 2000 elections. 2002: Exit poll conducted November 6-7, 2002 and released on November 18, 2002, by Ayres, McHenry & Associates (R) for the American Association of Health Plans. The company surveyed 1,000 voters and had a margin of error +/- 3 percent. This is the only exit poll available for 2002, since the Voter News Service network
Percent of the Electorate
Party Identification
2010 2008 2006 2004 2002 2000 1998
Republican 35 32 36 38 40 32 33
Democratic 35 39 38 38 31 37 34
Independent 29 29 26 25 23 27 30

L. J. Sabato / What Now for Obama?
30 © Ifri
consortium had an organizational meltdown on Election Day and was unable to provide verifiable polling data for 2002.
The Republican nature of the 2010 voters is best shown in
their actual behavior in marking their ballots. (See table 9) In the House contests—the best measure since there was an election in each of the 435 districts covering the entire country—Republicans secured 52.2 percent of the votes to the Democrats 44.7 percent. (About 3 percent voted for other candidates.) Thus, Republicans had a lead of 7.5 percent over the Democrats—the largest GOP advan-tage since the 9 percent gap that occurred in 1946.
Table 9. Total Votes by Party, 2010
Party Number of Votes
Percentage
Governors
Republicans 32,777,044 48.4
Democrats 31,662,548 46.7
Independents/Others 3,347,676 4.9
Total 77,787,268
Senate
Republicans 33,367,194 49.4
Democrats 30,307,407 44.9
Independents/Others 3,811,714 5.6
Total 67,486,315
House
Republicans 43,339,838 52.2
Democrats 37,160,314 44.7
Independents/Others 2,562,288 3.1
Total 83,062,440
Source: Calculations by author. Percentages may not total 100 percent because of rounding.
Republicans also bested the Democrats for Senate and gover-
nor, but by much smaller margins, since the 37 contests in each cate-gory left out much U.S. territory. The GOP had a 4.5 percent edge for Senate races and just 1.7 percent for gubernatorial match-ups.
The 2010 Exit Polls Point to the Bad Economy The Republican coloration of the 2010 voters—and the sharp distinc-tions with the 2008 voters who elected President Obama—can best be seen in the exit poll data presented in Table 10 at the end of this paper. The exit poll was conducted by a professional, nonpartisan polling organization and financed by a consortium of news organi-zations. In total, 18,132 voters were interviewed by telephone or at

L. J. Sabato / What Now for Obama?
31 © Ifri
polling places.6 Absentee and mail voters (especially in Colorado, Oregon, and Washington state, where three-quarters or more of the ballots come from the mail-in category) were included in the sample, giving us useful comparisons between the demographics of the 2008 and 2010 voters.
And those comparisons are stunning. One of the most Democratic groups in the electorate, young voters aged 18 to 29, saw their turnout plummet from 18 percent of the total in 2008 to 12 percent in 2010. Similarly, heavily Democratic African-Americans and Hispanics dropped from 13 percent and 9 percent of the national turnout in 2008, respectively, to 11 percent and 8 percent in 2010. These percentage changes are small but they amount to many tens of thousands of votes subtracted from the Democratic column. Mean-while, the most Republican-friendly voters were participating in much larger numbers. Those aged 65 and over skyrocketed from 15 per-cent of the electorate in 2008 to 21 percent in 2010. White voters jumped from 74 percent in 2008 to 77 percent of the 2010 electorate.
These marginal changes add up to several million more GOP votes. Whites voted Republican by 60 percent to 37 percent in 2010, a dramatic increase over their GOP edge of 55 percent to 43 percent in 2008. The same change is visible among older voters, with an 8 percent GOP margin in 2008 swelling to a massive 21 percent land-slide in 2010. As usual, men of all races and ages were very Repu-blican, 55 percent to 41 percent—quite a contrast with the near-parity in 2008. The surprise was women, who voted Democratic by 56 per-cent to 43 percent in 2008, but narrowly backed the GOP by 1 per-cent in 2010.
As with women, other usually Democratic groups showed some slippage to Republicans. The Democratic edge among Latinos fell from 36 percent in 2008 to 22 percent in 2010. (Some Latino groups dispute the exit poll’s findings, suggesting that it oversampled affluent Latinos who were more GOP-inclined.) Asian-Americans went from 27 percent pro-Democratic in 2008 to 18 percent Democra-tic-tilting in 2010. The most loyal Democratic demographic of all, African-Americans, also displayed a slight Republican trend, increa-sing its backing of GOP candidates from 4 percent in 2008 to 9 per-cent in 2010. Much the same thing can be observed in every category of voter, as one would expect in a ―wave‖ election like 2010.
While Republican margins grew everywhere, the normal divi-sions of American politics were still visible, and not just among the races, genders, and age groupings. Democrats handily won voters making less than $50,000 a year, with Republicans carrying those over $50,000 with an even larger majority. Voters making $200,000 or more annually picked the GOP by a two-to-one margin. Democrats were favored by the least well-educated (no high school diploma) and
6 National Exit Poll: Edition.cnn.com

L. J. Sabato / What Now for Obama?
32 © Ifri
the most well-educated (those with postgraduate training), while Republicans won the in-between categories. Union households were Democratic; those with no union connection were Republican. The GOP won Protestants and Catholics alike (especially white, evange-lical Christians), but Democrats were heavily chosen by those belon-ging to other religions or having no religion. We have seen these patterns repeatedly in recent decades.
As would be expected, Democrats won almost all Democratic Party identifiers in the electorate, and the Republicans swept the GOP voters. It was among Independents that preferences changed from 2008 to 2010. Democrats won the affections of Independents by 8 percent in 2008, but lost them by a much wider margin of 19 percent in 2010. Of course, this was not the same pool of Independents. Those choosing to vote in the midterm election were, on the whole, more conservative and closely aligned with the GOP than those who voted in 2010.
The Republican identity of the 2010 electorate is revealed in the job approval numbers for President Obama. The RealClearPolitics.com pre-election polling average for Obama’s job approval was 46 percent approve and 49 percent disapprove—not a bad split, considering the condition of the economy.7 But among voters who actually cast a ballot, Obama’s numbers were conside-rably worse: 44 percent approve, 55 percent disapprove.
Analysts have made the case for any number of influences on the 2010 results, but a fair reading of the complete exit poll points overwhelmingly to one factor: the bad economy. Fully 63 percent of voters named the economy the top issue; nothing else even hit 20 percent. If voters felt their family’s personal financial situation had improved recently, they cast a Democratic ballot by 60 percent to 37 percent. But if they judged the family worse off financially, the Republicans won a 61 percent to 35 percent landslide. Just 15 percent said their family was better off, while 41 percent answered worse off. That was the election in a nutshell. (Among the 43 percent who said nothing much had changed financially, the election was essentially a tie.) When the voters say, by close to two-to-one, that the country is off on the wrong track—as they did in 2010—it is almost impossible for the governing party to win an election.
7 Real Clear Politics, Realclearpolitics.com

L. J. Sabato / What Now for Obama?
33 © Ifri
Conclusion: Connecting the Dots—or Not
Elections are nuanced, and in a diverse country such as the United States, they can be analyzed from a thousand perspectives. Yet they are thematic too, at least in decisive years like 2010. The condition of the economy, a president’s job approval, and the precariousness of voters’ own lives drove the 2010 election.
The very same thing will happen in two years during the 2012 presidential and congressional elections. But be careful about connecting the dots too quickly. The Democratic near-landslide of 2008 could never have immediately foretold the thumping Democrats took in 2010. Nor does the Republican near-landslide of 2010 tell us very much about the outcome in 2012. It is only natural to take what we see as true today, and project it forward. But who can say where the economy will go in the next two years—and once again, the economy may prove central to the 2012 election results. Terrorism, Afghanistan, scandal, and social issues, just to name a few, might alter the political landscape.
The past is worth analyzing at length since retrospectives grounded in hard data are revealing. Yet the future is endlessly unknowable, and we should be hesitant to project a reality beyond our knowledge. Events not in anyone’s immediate control, and trends that can only be guessed at, will be in play two years hence.

L. J. Sabato / What Now for Obama?
34 © Ifri
Table 10. Exit Polls, 2010
Please note: *Bracketed percentages in ―Democrat‖ column indicate percentages received by President Barack Obama in 2008. ┼Bracketed percentages in ―Republican‖ column indicate percentages received by Senator John McCain in 2008. ** Bracketed percentages indicate percentages received by each party when question referred to President George W. Bush in 2008.
Sample Distribution Democrat (%) Republican (%)
VOTE BY GENDER
Male (48 ) 41 [49 ]* 55 [48 ]┼
Female (52 ) 48 [56 ] 49 [43 ]
VOTE BY RACE AND BY GENDER
White Males (38 ) 34 [41 ] 62 [57 ]
White Females (40 ) 39 [46 ] 58 [53 ]
Black Males (5 ) 86 [95 ] 13 [5 ]
Black Females (6 ) 92 [96 ] 6 [3 ]
Latino Males (4 ) 55 [64 ] 44 [33 ]
Latino Females (4 ) 65 [68 ] 33 [30 ]
All Other Races (4 ) 55 [64 ] 42 [32 ]
VOTE BY RACE
White (77 ) 37 [43 ] 60 [55 ]
African –American (11 ) 89 [95 ] 9 [4 ]
Latino (8 ) 60 [67 ] 38 [31 ]
Asian (2 ) 58 [62 ] 40 [35 ]
Other (2 ) 53 [66 ] 44 [31 ]
VOTE BY AGE
18-29 (12 ) 55 [66 ] 42 [32 ]
30-44 (24 ) 46 [52 ] 50 [46 ]
45-64 (43 ) 45 [50 ] 53 [49 ]
65 and Older (21 ) 38 [45 ] 59 [53 ]
VOTE BY INCOME
Under $30,000 (17 ) 57 40
$30-50,000 (19 ) 51 46
$50-75,000 (21 ) 45 51
$75-100,000 (15 ) 42 56
$100-200,000 (19 ) 43 56
$200,000 or More (8 ) 34 64
VOTE BY INCOME
Less than $50,000 (36 ) 54 [60 ] 43 [38 ]
More than $50,000 (64 ) 42 [49 ] 55 [49 ]
VOTE BY INCOME
Less than $100,000 (73 ) 49 [55 ] 48 [43 ]
More than $100,000 (27 ) 40 [49 ] 58 [49 ]
VOTE BY EDUCATION
No High School (3 ) 57 [63 ] 36 [35 ]
H.S. Graduate (17 ) 46 [52 ] 52 [46 ]

L. J. Sabato / What Now for Obama?
35 © Ifri
Sample Distribution Democrat (%) Republican (%)
Some College (28 ) 43 [51 ] 53 [47 ]
College Graduate (30 ) 40 [50 ] 58 [48 ]
Postgraduate (21 ) 53 [58 ] 45 [40 ]
VOTE BY EDUCATION
No College Degree (48 ) 45 [53 ] 52 [45 ]
College Graduate (52 ) 45 [53 ] 53 [46 ]
ANYONE IN HOUSEHOLD IN A UNION?
Yes (17 ) 61 [59 ] 37 [39 ]
No (83 ) 43 [51 ] 54 [47 ]
VOTE BY PARTY IDENTIFICATION
Democrat (35 ) 91 [89 ] 7 [10 ]
Republican (35 ) 5 [9 ] 94 [90 ]
Independent (29 ) 37 [52 ] 56 [44 ]
VOTE BY IDEOLOGY
Liberal (20 ) 90 [89 ] 8 [10 ]
Moderate (38 ) 55 [60 ] 42 [39 ]
Conservative (42 ) 13 [20 ] 84 [78 ]
VOTE BY RELIGION
Protestant (55 ) 38 [45 ] 59 [54 ]
Catholic (23 ) 44 [54 ] 54 [45 ]
Jewish (2 ) N/A [78 ] N/A [21 ]
Other (8 ) 74 [73 ] 24 [22 ]
None (12 ) 68 [75 ] 30 [23 ]
VOTE BY RELIGION AMONG WHITES
White Protestant (44 ) 28 [34 ] 69 [65 ]
White Catholic (17 ) 39 [47 ] 59 [52 ]◦
White Jewish (2 ) N/A [83 ] N/A [16 ]
White- Other Religion (5 ) 71 [67 ] 28 [28 ]
White- No Religion (9 ) 62 [71 ] 37 [26 ]
Non-whites (23 ) 75 [79 ] 24 [18 ]
WHITE EVANGELICAL/BORN- AGAIN?
Yes (25 ) 19 [24 ] 77 [74 ]
No (75 ) 55 [62 ] 42 [36 ]
DO YOU HAVE CHILDREN UNDER 18?
Yes (34 ) 46 [53 ] 50 [45 ]
No (66 ) 47 [53 ] 51 [45 ]
ARE YOU GAY, LESBIAN, OR BISEXUAL?
Yes (3 ) 69 [70 ] 29 [27 ]
No (97 ) 46 [53 ] 52 [45 ]

L. J. Sabato / What Now for Obama?
36 © Ifri
Sample Distribution Democrat (%) Republican (%)
HOW OBAMA IS HANDLING HIS JOB
Approve (44 ) 85 [10 ]** 14 [89 ]
Disapprove (55 ) 11 [67 ] 84 [31 ]
HOW CONGRESS IS HANDLING ITS JOB
Approve (23 ) 79 [62 ] 20 [36 ]
Disapprove (73 ) 33 [51 ] 64 [47 ]
YOUR VOTE FOR HOUSE MEANT TO SEND A MESSAGE OF
Support for Obama (23 ) 96 3
Opposition to Obama (37 ) 6 92
Obama Not a Factor (38 ) 52 44
YOUR VOTE FOR HOUSE MEANT TO SEND A MESSAGE
In Favor of Tea Party (22 ) 8 90
Against Tea Party (17 ) 93 6
Tea Party Not a Factor (57 ) 44 53
OBAMA’S POLICIES WILL
Help the Country (43 ) 86 12
Hurt the Country (52 ) 8 89
OPINION OF DEMOCRATIC PARTY
Favorable (44 ) 91 8
Unfavorable (52 ) 10 87
OPINION OF REPUBLICAN PARTY
Favorable (41 ) 11 88
Unfavorable (53 ) 73 23
OPINION OF GOVERNMENT
Government Should
Do More (38 ) 77 [76 ] 21 [23 ]
Government Doing
Too Much (56 ) 20 [27 ] 76 [71 ]
OPINION OF FEDERAL GOVERNMENT
Satisfied/Enthusiastic (25 ) 81 16
Angry/Dissatisfied (73 ) 32 65
OPINION OF TEA PARTY
Support (41 ) 11 86
Neutral (24 ) 47 50
Oppose (30 ) 86 12

L. J. Sabato / What Now for Obama?
37 © Ifri
Sample Distribution Democrat (%) Republican (%)
MOST IMPORTANT ISSUE FACING COUNTRY TODAY
War in Afghanistan (7 ) 58 40
Health Care (18 ) 51 47
Economy (63 ) 43 54
Illegal Immigration (8 ) 26 68
IS THE ECONOMY THE MOSTIMPORTANT ISSUE?
Yes (63 ) 43 54
No (33 ) 46 51
ANYONE IN HOUSEHOLD LOST A JOB IN LAST TWO YEARS?
Yes (30 ) 50 46
No (69 ) 45 53
FAMILY FINANCIAL SITUATION
Better (15 ) 60 [37 ] 37 [60 ]
Worse (41 ) 35 [71 ] 61 [28 ]
Same (43 ) 49 [45 ] 48 [53 ]
STIMULUS PACKAGE HAS
Helped Economy (32 ) 86 13
Hurt Economy (34 ) 10 87
Made No Difference (31 ) 39 57
WHO DO YOU BLAME FOR ECONOMIC PROBLEMS?
Wall Street (35 ) 41 57
George W. Bush (29 ) 83 15
Barack Obama (24 ) 6 91
LIFE FOR THE NEXT GENERATION WILL BE
Better (32 ) 60 39
Worse (39 ) 33 64
About the Same (26 ) 52 45
WHAT SHOULD CONGRESS DO WITH NEW HEALTH CARE LAW?
Expand It (31 ) 84 15
Leave It As Is (16 ) 63 34
Repeal It (48 ) 11 86
BUSH-ERA TAX CUTS SHOULD BE CONTINUED FOR
All Americans (40 ) 14 84
Families Under $250,000 (36 ) 64 32
No One (15 ) 75 22
U.S. WAR IN AFGHANISTAN
Approve (40 ) 24 75
Disapprove (54 ) 61 36

L. J. Sabato / What Now for Obama?
38 © Ifri
Sample Distribution Democrat (%) Republican (%)
SHOULD SAME SEX MARRIAGES BE LEGALLY RECOGNIZED?
Yes (41 ) 67 30
No (53 ) 27 70
COUNTRY IS GOING IN
Right Direction (34 ) 82 [27 ] 16 [71 ]
Wrong Track (61) 22 [62 ] 76 [36]
VOTE BY SIZE OF COMMUNITY
Urban (31 ) 56 [63 ] 41 [35]
Suburban (49 ) 42 [50 ] 55 [48 ]
Rural (20 ) 36 [45 ] 61 [53 ]
VOTE BY REGION
Northeast (21 ) 54 [59 ] 44 [40 ]
Midwest (25 ) 44 [54 ] 53 [44 ]
South (31 ) 37 [45 ] 61 [54 ]
West (23 ) 49 [57 ] 48 [40 ] Source: Cnn.com