Embed Size (px)
Citation preview

Home » Cambria » WESTMONT HILLTOP SD » WESTMONT HILLTOP EL
For Parents
This report is a summary of your school's Adequate Yearly Progress (AYP) results. The purpose of AYP is to
ensure that all students have reading and mathematics skills that prepare them for the future. Adequate Yearly
Progress measures whether each school has met the improvement goals established by No Child Left Behind.
For a school to "Make AYP," students in the school must meet goals in three areas: (1) Attendance (for schools
without a high school graduating class) or Graduation (for schools with a High School graduating class), (2)
Academic Performance, and (3) Test Participation. For WESTMONT HILLTOP EL, the Pennsylvania System of
School Assessment (PSSA) taken by students in Grade 3 and 4 is used to determine Academic Performance and
Test Participation in Reading and Mathematics. To learn more about AYP, click the "About AYP" link at the top
of the page.
WESTMONT HILLTOP EL met 13 out of 13 AYP measures in 2010-11. Because AYP requires meeting all of the
measures, this school met AYP requirements. This is good news! This school is on track to meet the goal of all
students reaching proficiency.
The performance chart and/or data table can show more details about how this school performed.
Safe Harbor is achieved when a subgroup has greatly improved since the previous year — even though it did not
meet the state goal. (The measure for Safe Harbor improvement is at least a 10% reduction of the percentage
of students who scored below Proficient for Reading or Mathematics from last year to this year).
Since all test performance targets/goals to meet AYP were met by WESTMONT HILLTOP EL, Safe Harbor was not
applicable to this school.
The Growth Model recognizes the efforts of schools whose students have not achieved proficiency but are on
trajectories towards proficiency on future PSSA exams. The Growth Model will be calculated for Performance
Indicators (i.e., the all student group and up to nine subgroups). Projected scores are calculated for all
students - including students who are proficient. If a projected score cannot be calculated for a particular
student, the student’s actual score is used. The Growth Model will be applied to an AYP Performance Indicator
only if the indicator cohort has not met AYP performance by any of the existing goals or targets. Actual, not
projected, PASA scores, PSSA-M scores, 3 grade scores, and 11 grade scores are always used, as well as the
scores for any students with insufficient data points to make a projection.
What is this Adequate Yearly Progress (AYP) Report?•
Did this school meet all AYP measures?•
Did this school meet any AYP targets through Safe Harbor?•
Did this school meet any AYP measures through the Growth Model?•
Did this school meet any AYP measures through the appeals process?•
What does this report mean for WESTMONT HILLTOP EL?•
What can parents do?•
What is this Adequate Yearly Progress (AYP) report?
Top
Did this school meet all AYP measures?
Top
Did this school meet any AYP targets through Safe Harbor?
Top
Did this school meet any AYP measures through the Growth Model?
rd th
3 Actual Grade 3 Scores
4 Projected Scores in Grade 6
5 Projected Scores in Grade 7
6 Projected Scores in Grade 8
7 Projected Scores in Grade 8
Grade Last Tested Scores used in Growth Model Calculation
Page 1 of 2Pennsylvania Dept of Education - Academic Achievement Report
11/1/2011http://paayp.emetric.net/School/Parents/c11/108118503/1290

PDE Site | PSSA Results | Contact
Since all test performance targets/goals to meet AYP were met by WESTMONT HILLTOP EL, Growth Model
considerations do not apply to this school.
When initial AYP results are announced each year, schools and districts have the opportunity to review the data
that is utilized to determine AYP and request changes through the Bureau of Assessment and Accountability to
correct any errors. Also, schools and districts have the opportunity to appeal the AYP rulings through the
Pennsylvania Department of Education if they believe their AYP identification was in error for statistical or
other substantive reasons.
Since all test performance targets/goals to meet AYP were met by WESTMONT HILLTOP EL, appeals were not
applicable.
Well done! This school has met all AYP measures for the 2010-11 school year. This school has performed well
this year, and appears to be on track to meet the goal of all students attaining proficiency in Reading and Math
by the year 2014.
This school may wish to review its improvement strategies and create an improvement plan to continue to
meet AYP next year. Click the 'About AYP' link at the top of the page to learn more about AYP requirements
and AYP status levels in Pennsylvania.
There are several ways to get involved in your child's education and to help your child and your child's school
succeed.
8 Projected Scores in Grade 11
11 Actual Grade 11 Scores
Top
Did this school meet any AYP measures through the appeals process?
Top
What does this report mean for WESTMONT HILLTOP EL?
Top
What can parents do?
Make sure your child is in school: Please make sure your child is attending school every day, including
testing days.
•
Help your child succeed: The most important requirements of AYP are your child’s achieved performance
and demonstrated growth in Reading and Mathematics.
•
Work with your child's teacher to help your child succeed in school. Your child's teacher can help you
find resources and provide insight and suggestions for you to help your child reach his or her full
potential.
◦
If your child was tested in Spring 2011, you should receive a printed Parent Report that outlines your
child's performance on the Assessment. This report includes educational activities to do with your
child and is a good starting point to discuss your child's performance with their teacher.
◦
Get involved: You can join your school's Parent-Teacher Organization (PTO) or volunteer at your child's
school. Contact your child's school for information on other ways to get involved.
•
Top
Page 2 of 2Pennsylvania Dept of Education - Academic Achievement Report
11/1/2011http://paayp.emetric.net/School/Parents/c11/108118503/1290

PDE Site | PSSA Results | Contact
Home » Cambria » WESTMONT HILLTOP SD » WESTMONT HILLTOP EL WESTMONT HILLTOP ELSchool AYP Overview
2011 AYP Status
Made AYP
Target Result
Attendance 1 / 1
Academic Performance 6 / 6
Test Participation 6 / 6
Totals: 13 / 13
2010 AYP Status
Made AYP
Target Result
Attendance 1 / 1
Academic Performance 6 / 6
Test Participation 6 / 6
Totals: 13 / 13
2011 Academic Performance Test Participation
Reading Mathematics Reading Mathematics
Students Overall
White non-Hispanic
Black/African American non-Hispanic - - - -Latino/Hispanic - - - -Asian/Pacific Islander - - - -American Indian/Native American - - - -Multi-racial/ethnic - - - -IEP-Special Education - - - -English Language Learners - - - -Economically Disadvantaged
Measures Achieved
Group met measure
Group met goal using Confidence Interval
Group met target using Safe Harbor
Group met target using Safe Harbor with Confidence Interval
Group met measure using Growth Model
Group met goal or target using an Appeal
Group did not meet measure
- Fewer than 40 students tested
LegendFor confidentiality and reliability, performance results may be based on data from this year, or on an
average of this year and the previous year's data.
■
For confidentiality and reliability, participation results may be based on data from this year, or on an
average of up to three years.
■
Top
Page 1 of 1Pennsylvania Dept of Education - Academic Achievement Report
11/1/2011http://paayp.emetric.net/School/Overview/c11/108118503/1290

Home » Cambria » WESTMONT HILLTOP SD » WESTMONT HILLTOP EL WESTMONT HILLTOP ELSchool AYP Data Table
Attendance 95.47% 95.34%
Previous Year Current Year Met Measure
1
Attendance measure is a goal of 90%, or any improvement from last year 1
Students Overall 80.2 -3.1 93.9 -0.1 100.0 100.0
White non-Hispanic 79.8 -2.8 94.0 -0.2 100.0 100.0
Black/African American non-Hispanic - - - - - - - - - -
Latino/Hispanic - - - - - - - - - -
Asian/Pacific Islander - - - - - - - - - -
American Indian/Native American - - - - - - - - - -
Multi-racial/ethnic - - - - - - - - - -
IEP-Special Education - - - - - - - - - -
English Language Learners - - - - - - - - - -
Economically Disadvantaged 70.8 -0.6 84.4 -4.2 100.0 100.0
Reading Mathematics Reading Mathematics
% At/Above Proficient
Increase/ Decrease from Last
Year Result
% At/Above Proficient
Increase/ Decrease from Last
Year Result % Tested Result % Tested Result
72% 67% 95% 95%
Academic Performance Test Participation
2011 Goals:
Page 1 of 2Pennsylvania Dept of Education - Academic Achievement Report
11/1/2011http://paayp.emetric.net/School/DataTable/c11/108118503/1290

PDE Site | PSSA Results | Contact
How is the Confidence Interval (C.I.) used in AYP decisions?
How is the Growth Model used in AYP decisions?
Group met measure
Group met goal using Confidence Interval
Group met target using Safe Harbor
Group met target using Safe Harbor with Confidence Interval
Group met measure using Growth Model
Group met goal or target using an Appeal
Group did not meet measure
- Fewer than 40 students tested
Legend
In Pennsylvania a school or district can make AYP by using two or three consecutive years of data if the
result is better than a single current year calculation. Two or three years of data is only used if the single
current year calculation doesn't meet the goal and the two or three year calculation does.
For confidentiality and reliability, performance results may be based on data from this year, or on
an average of this year and the previous year's data.
■
For confidentiality and reliability, participation results may be based on data from this year, or on
an average of up to three years.
■
For Academic Performance AYP decisions, a margin of error is added to the percentage of Proficient
students. The margin of error is based on a 95% Confidence Interval when used to meet state goals,
and is based on a 75% Confidence Interval when used to meet Safe Harbor targets.
■
Values indicate the number of percentage points the proficiency rate changed from last year to this
year. Positive values indicate the proficiency rate improved since last year. Note that the
calculation of the difference between last year's and this year's proficiency rate uses the precise
value at each time point, while the rate for this year, as listed in the Percent At/Above Proficient
column, may be based on an average across years.
■
т This percentage includes two consecutive years of data.
π This percentage includes three consecutive years of data.
Confidence intervals take into account the fact that the students tested in any particular year might not be
representative of students in that school across the years. Confidence intervals control for this sampling error or
variation across years by promoting schools or subgroups that come very close to achieving their performance goals,
thus meeting their specific goal. In 2004, the United States Department of Education approved a 95% Confidence
Interval (C.I.) in Pennsylvania for AYP performance calculations. A 95% C.I. can be used for meeting the state
performance goal, while a 75% C.I. can be used for meeting the Safe Harbor target.
The Growth Model recognizes the efforts of schools whose students have not achieved proficiency but are on
trajectories towards proficiency on future PSSA exams. The Growth Model will be calculated for Performance
Indicators (i.e., the all student group and up to nine subgroups). Projected scores are calculated for all students -
including students who are proficient. If a projected score cannot be calculated for a particular student, the student’s
actual score is used. The Growth Model will be applied to an AYP Performance Indicator only if the indicator cohort
has not met AYP performance by any of the existing goals or targets. Actual, not projected, PASA scores, PSSA-M
scores, 3 grade scores, and 11 grade scores are always used, as well as the scores for any students with insufficient
data points to make a projection.
rd th
3 Actual Grade 3 Scores
4 Projected Scores in Grade 6
5 Projected Scores in Grade 7
6 Projected Scores in Grade 8
7 Projected Scores in Grade 8
8 Projected Scores in Grade 11
11 Actual Grade 11 Scores
Grade Last Tested Scores used in Growth Model Calculation
Top
Page 2 of 2Pennsylvania Dept of Education - Academic Achievement Report
11/1/2011http://paayp.emetric.net/School/DataTable/c11/108118503/1290

For confidentiality and reliability, results may be based on data from this year, or on an average of up to three years of data.
Performance measures may be met using Confidence Intervals, Safe Harbor, the Growth Model or through the Appeals process.
Read more about how the Confidence Interval (C.I.) and Growth Model are used in AYP decisions.
How is the Confidence Interval (C.I.) used in AYP decisions?
How is the Growth Model used in AYP decisions?
Home » Cambria » WESTMONT HILLTOP SD » WESTMONT HILLTOP EL WESTMONT HILLTOP ELSchool AYP Performance Report
Students Overall
White non-Hispanic
Black/African American non-Hispanic - -
Latino/Hispanic - -
Asian/Pacific Islander - -
American Indian/Native American - -
Multi-racial/ethnic - -
IEP-Special Education - -
English Language Learners - -
Economically Disadvantaged
Group met measure
Group met goal using Confidence Interval
Group met target using Safe Harbor
Group met target using Safe Harbor with Confidence Interval
Group met measure using Growth Model
Group met goal or target using an Appeal
Group did not meet measure
- Fewer than 40 students tested
Percentage includes two consecutive years of data
Percentage includes three consecutive years of data
LegendBar may not reach goal line, but may still meet AYP either with a confidence interval, by Safe Harbor,
by the Growth Model, or by Appeals.
■
The Safe Harbor (S.H.) target is met when there is at least a 10% reduction in percentage of students
who scored below Proficient from the previous year. This target is only shown for groups that did not
meet the state target.
■
To evaluate Academic Performance, a margin of error is added to the percentage of Proficient
students. The margin of error is based on a 95% Confidence Interval when used to meet state goals,
and is based on a 75% Confidence Interval when used to meet Safe Harbor targets.
■
In Pennsylvania a school or district can make AYP by using two or three consecutive years of data if
the result is better than a single current year calculation. Two or three years of data is only used if
the single current year calculation doesn't meet the goal and the two or three year calculation does.
■
Confidence intervals take into account the fact that the students tested in any particular year might not be
representative of students in that school across the years. Confidence intervals control for this sampling error or
variation across years by promoting schools or subgroups that come very close to achieving their performance goals,
thus meeting their specific goal. In 2004, the United States Department of Education approved a 95% Confidence
Interval (C.I.) in Pennsylvania for AYP performance calculations. A 95% C.I. can be used for meeting the state
performance goal, while a 75% C.I. can be used for meeting the Safe Harbor target.
2011 2011
Student Group Result Reading Result Mathematics
Page 1 of 2Pennsylvania Dept of Education - Academic Achievement Report
11/1/2011http://paayp.emetric.net/School/Performance/c11/108118503/1290?prevYear=false&fTarg...

PDE Site | PSSA Results | Contact
The Growth Model recognizes the efforts of schools whose students have not achieved proficiency but are on
trajectories towards proficiency on future PSSA exams. The Growth Model will be calculated for Performance
Indicators (i.e., the all student group and up to nine subgroups). Projected scores are calculated for all students -
including students who are proficient. If a projected score cannot be calculated for a particular student, the student’s
actual score is used. The Growth Model will be applied to an AYP Performance Indicator only if the indicator cohort
has not met AYP performance by any of the existing goals or targets. Actual, not projected, PASA scores, PSSA-M
scores, 3 grade scores, and 11 grade scores are always used, as well as the scores for any students with insufficient
data points to make a projection.
rd th
3 Actual Grade 3 Scores
4 Projected Scores in Grade 6
5 Projected Scores in Grade 7
6 Projected Scores in Grade 8
7 Projected Scores in Grade 8
8 Projected Scores in Grade 11
11 Actual Grade 11 Scores
Grade Last Tested Scores used in Growth Model Calculation
Top
Page 2 of 2Pennsylvania Dept of Education - Academic Achievement Report
11/1/2011http://paayp.emetric.net/School/Performance/c11/108118503/1290?prevYear=false&fTarg...

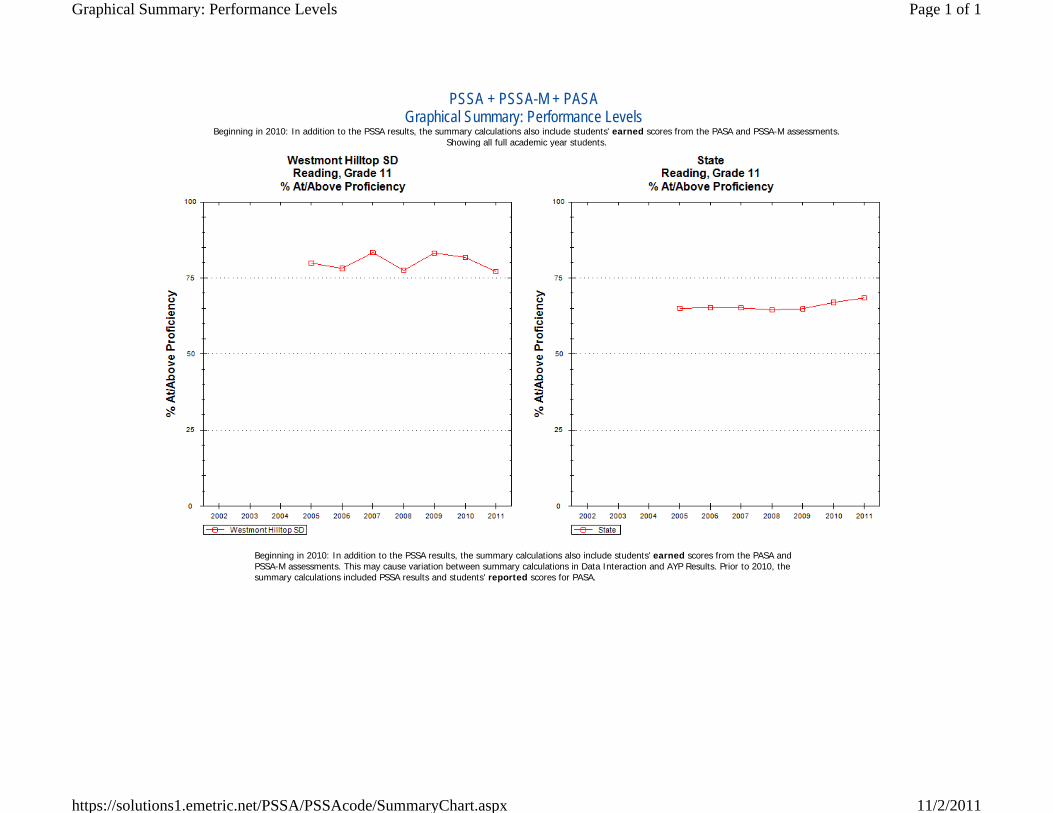
Beginning in 2010: In addition to the PSSA results, the summary calculations also include students' earned scores from the PASA and PSSA-M assessments. Showing all full academic year students.
PSSA + PSSA-M + PASA Graphical Summary: Performance Levels
Beginning in 2010: In addition to the PSSA results, the summary calculations also include students' earned scores from the PASA and PSSA-M assessments. This may cause variation between summary calculations in Data Interaction and AYP Results. Prior to 2010, the summary calculations included PSSA results and students' reported scores for PASA.
Page 1 of 1Graphical Summary: Performance Levels
11/2/2011https://solutions1.emetric.net/PSSA/PSSAcode/SummaryChart.aspx

Copyright © 2011 SAS Institute Inc., Cary, NC, USA. All Rights Reserved.
PVAAS
2011 District (Single Grade) Projection Summary Westmont Hilltop School District
3rd Grade Projected to 4th PSSA Reading (Proficient)
AYP Target for 2012: 81%
3rd Grade Projected to 4th PSSA Reading (Proficient)
Probability of Proficient or Above Nr of Students Percentage
Greater than or equal to 70% 71 61%
Between 40% and 70% 28 24%
Less than or equal to 40% 16 14%
Students who lack sufficient data 2 2%
Students whose probability of reaching proficient or above is greater than or equal to 70%
Students whose probability of reaching proficient or above is between 40% and 70%
Students whose probability of reaching proficient or above is less than or equal to 40%
Students who do not have a projection due to a lack of sufficient data.

Beginning in 2010: In addition to the PSSA results, the summary calculations also include students' earned scores from the PASA and PSSA-M assessments. Showing all full academic year students.
PSSA + PSSA-M + PASA Graphical Summary: Performance Levels
Beginning in 2010: In addition to the PSSA results, the summary calculations also include students' earned scores from the PASA and PSSA-M assessments. This may cause variation between summary calculations in Data Interaction and AYP Results. Prior to 2010, the summary calculations included PSSA results and students' reported scores for PASA.
Page 1 of 1Graphical Summary: Performance Levels
11/2/2011https://solutions1.emetric.net/PSSA/PSSAcode/SummaryChart.aspx

Copyright © 2011 SAS Institute Inc., Cary, NC, USA. All Rights Reserved.
PVAAS
2011 School (Single Grade) Projection Summary Westmont Hilltop Elementary School in Westmont Hilltop School District
3rd Grade Projected to 4th PSSA Math (Proficient)
AYP Target for 2012: 78%
3rd Grade Projected to 4th PSSA Math (Proficient)
Probability of Proficient or Above Nr of Students Percentage
Greater than or equal to 70% 107 91%
Between 40% and 70% 6 5%
Less than or equal to 40% 2 2%
Students who lack sufficient data 2 2%
Students whose probability of reaching proficient or above is greater than or equal to 70%
Students whose probability of reaching proficient or above is between 40% and 70%
Students whose probability of reaching proficient or above is less than or equal to 40%
Students who do not have a projection due to a lack of sufficient data.

Beginning in 2010: In addition to the PSSA results, the summary calculations also include students' earned scores from the PASA and PSSA-M assessments. Showing all full academic year students.
PSSA + PSSA-M + PASA Graphical Summary: Performance Levels
Beginning in 2010: In addition to the PSSA results, the summary calculations also include students' earned scores from the PASA and PSSA-M assessments. This may cause variation between summary calculations in Data Interaction and AYP Results. Prior to 2010, the summary calculations included PSSA results and students' reported scores for PASA.
Page 1 of 1Graphical Summary: Performance Levels
11/2/2011https://solutions1.emetric.net/PSSA/PSSAcode/SummaryChart.aspx

Copyright © 2011 SAS Institute Inc., Cary, NC, USA. All Rights Reserved.
PVAAS
2011 District (Single Grade) Projection SummaryWestmont Hilltop School District
3rd Grade Projected to 4th PSSA Reading (Proficient)
AYP Target for 2012: 81%
3rd Grade Projected to 4th PSSA Reading (Proficient)
Probability of Proficient or Above Nr of Students Percentage
Greater than or equal to 70% 71 61%
Between 40% and 70% 28 24%
Less than or equal to 40% 16 14%
Students who lack sufficient data 2 2%
Students whose probability of reaching proficient or above is greater than or equal to 70%
Students whose probability of reaching proficient or above is between 40% and 70%
Students whose probability of reaching proficient or above is less than or equal to 40%
Students who do not have a projection due to a lack of sufficient data.

Beginning in 2010: In addition to the PSSA results, the summary calculations also include students' earned scores from the PASA and PSSA-M assessments. Showing all full academic year students.
PSSA + PSSA-M + PASA Graphical Summary: Performance Levels
Beginning in 2010: In addition to the PSSA results, the summary calculations also include students' earned scores from the PASA and PSSA-M assessments. This may cause variation between summary calculations in Data Interaction and AYP Results. Prior to 2010, the summary calculations included PSSA results and students' reported scores for PASA.
Page 1 of 1Graphical Summary: Performance Levels
11/2/2011https://solutions1.emetric.net/PSSA/PSSAcode/SummaryChart.aspx

Copyright © 2011 SAS Institute Inc., Cary, NC, USA. All Rights Reserved.
PVAAS
2011 School (Single Grade) Projection Summary Westmont Hilltop Elementary School in Westmont Hilltop School District
4th Grade Projected to 5th PSSA Math (Proficient)
AYP Target for 2012: 78%
4th Grade Projected to 5th PSSA Math (Proficient)
Probability of Proficient or Above Nr of Students Percentage
Greater than or equal to 70% 110 83%
Between 40% and 70% 9 7%
Less than or equal to 40% 1 1%
Students who lack sufficient data 12 9%
Students whose probability of reaching proficient or above is greater than or equal to 70%
Students whose probability of reaching proficient or above is between 40% and 70%
Students whose probability of reaching proficient or above is less than or equal to 40%
Students who do not have a projection due to a lack of sufficient data.

Beginning in 2010: In addition to the PSSA results, the summary calculations also include students' earned scores from the PASA and PSSA-M assessments. Showing all full academic year students.
PSSA + PSSA-M + PASA Graphical Summary: Performance Levels
Beginning in 2010: In addition to the PSSA results, the summary calculations also include students' earned scores from the PASA and PSSA-M assessments. This may cause variation between summary calculations in Data Interaction and AYP Results. Prior to 2010, the summary calculations included PSSA results and students' reported scores for PASA.
Page 1 of 1Graphical Summary: Performance Levels
11/2/2011https://solutions1.emetric.net/PSSA/PSSAcode/SummaryChart.aspx

Home » Cambria » WESTMONT HILLTOP SD » WESTMONT HILLTOP MS
For Parents
This report is a summary of your school's Adequate Yearly Progress (AYP) results. The purpose of AYP is to
ensure that all students have reading and mathematics skills that prepare them for the future. Adequate Yearly
Progress measures whether each school has met the improvement goals established by No Child Left Behind.
For a school to "Make AYP," students in the school must meet goals in three areas: (1) Attendance (for schools
without a high school graduating class) or Graduation (for schools with a High School graduating class), (2)
Academic Performance, and (3) Test Participation. For WESTMONT HILLTOP MS, the Pennsylvania System of
School Assessment (PSSA) taken by students in Grade 5, 6, 7 and 8 is used to determine Academic Performance
and Test Participation in Reading and Mathematics. To learn more about AYP, click the "About AYP" link at the
top of the page.
WESTMONT HILLTOP MS met 17 out of 17 AYP measures in 2010-11. Because AYP requires meeting all of the
measures, this school met AYP requirements. This is good news! This school is on track to meet the goal of all
students reaching proficiency.
The performance chart and/or data table can show more details about how this school performed.
Safe Harbor is achieved when a subgroup has greatly improved since the previous year — even though it did not
meet the state goal. (The measure for Safe Harbor improvement is at least a 10% reduction of the percentage
of students who scored below Proficient for Reading or Mathematics from last year to this year).
Since all test performance targets/goals to meet AYP were met by WESTMONT HILLTOP MS, Safe Harbor was
not applicable to this school.
The Growth Model recognizes the efforts of schools whose students have not achieved proficiency but are on
trajectories towards proficiency on future PSSA exams. The Growth Model will be calculated for Performance
Indicators (i.e., the all student group and up to nine subgroups). Projected scores are calculated for all
students - including students who are proficient. If a projected score cannot be calculated for a particular
student, the student’s actual score is used. The Growth Model will be applied to an AYP Performance Indicator
only if the indicator cohort has not met AYP performance by any of the existing goals or targets. Actual, not
projected, PASA scores, PSSA-M scores, 3 grade scores, and 11 grade scores are always used, as well as the
scores for any students with insufficient data points to make a projection.
What is this Adequate Yearly Progress (AYP) Report?•
Did this school meet all AYP measures?•
Did this school meet any AYP targets through Safe Harbor?•
Did this school meet any AYP measures through the Growth Model?•
Did this school meet any AYP measures through the appeals process?•
What does this report mean for WESTMONT HILLTOP MS?•
What can parents do?•
What is this Adequate Yearly Progress (AYP) report?
Top
Did this school meet all AYP measures?
Top
Did this school meet any AYP targets through Safe Harbor?
Top
Did this school meet any AYP measures through the Growth Model?
rd th
3 Actual Grade 3 Scores
4 Projected Scores in Grade 6
5 Projected Scores in Grade 7
6 Projected Scores in Grade 8
7 Projected Scores in Grade 8
Grade Last Tested Scores used in Growth Model Calculation
Page 1 of 2Pennsylvania Dept of Education - Academic Achievement Report
11/1/2011http://paayp.emetric.net/School/Parents/c11/108118503/1292

PDE Site | PSSA Results | Contact
Since all test performance targets/goals to meet AYP were met by WESTMONT HILLTOP MS, Growth Model
considerations do not apply to this school.
When initial AYP results are announced each year, schools and districts have the opportunity to review the data
that is utilized to determine AYP and request changes through the Bureau of Assessment and Accountability to
correct any errors. Also, schools and districts have the opportunity to appeal the AYP rulings through the
Pennsylvania Department of Education if they believe their AYP identification was in error for statistical or
other substantive reasons.
Since all test performance targets/goals to meet AYP were met by WESTMONT HILLTOP MS, appeals were not
applicable.
Well done! This school has met all AYP measures for the 2010-11 school year. This school has performed well
this year, and appears to be on track to meet the goal of all students attaining proficiency in Reading and Math
by the year 2014.
This school may wish to review its improvement strategies and create an improvement plan to continue to
meet AYP next year. Click the 'About AYP' link at the top of the page to learn more about AYP requirements
and AYP status levels in Pennsylvania.
There are several ways to get involved in your child's education and to help your child and your child's school
succeed.
8 Projected Scores in Grade 11
11 Actual Grade 11 Scores
Top
Did this school meet any AYP measures through the appeals process?
Top
What does this report mean for WESTMONT HILLTOP MS?
Top
What can parents do?
Make sure your child is in school: Please make sure your child is attending school every day, including
testing days.
•
Help your child succeed: The most important requirements of AYP are your child’s achieved performance
and demonstrated growth in Reading and Mathematics.
•
Work with your child's teacher to help your child succeed in school. Your child's teacher can help you
find resources and provide insight and suggestions for you to help your child reach his or her full
potential.
◦
If your child was tested in Spring 2011, you should receive a printed Parent Report that outlines your
child's performance on the Assessment. This report includes educational activities to do with your
child and is a good starting point to discuss your child's performance with their teacher.
◦
Get involved: You can join your school's Parent-Teacher Organization (PTO) or volunteer at your child's
school. Contact your child's school for information on other ways to get involved.
•
Top
Page 2 of 2Pennsylvania Dept of Education - Academic Achievement Report
11/1/2011http://paayp.emetric.net/School/Parents/c11/108118503/1292

PDE Site | PSSA Results | Contact
Home » Cambria » WESTMONT HILLTOP SD » WESTMONT HILLTOP MS WESTMONT HILLTOP MSSchool AYP Overview
2011 AYP Status
Made AYP
Target Result
Attendance 1 / 1
Academic Performance 8 / 8
Test Participation 8 / 8
Totals: 17 / 17
2010 AYP Status
Made AYP
Target Result
Attendance 1 / 1
Academic Performance 8 / 8
Test Participation 8 / 8
Totals: 17 / 17
2011 Academic Performance Test Participation
Reading Mathematics Reading Mathematics
Students Overall
White non-Hispanic
Black/African American non-Hispanic - - - -Latino/Hispanic - - - -Asian/Pacific Islander - - - -American Indian/Native American - - - -Multi-racial/ethnic - - - -IEP-Special Education
English Language Learners - - - -Economically Disadvantaged
Measures Achieved
Group met measure
Group met goal using Confidence Interval
Group met target using Safe Harbor
Group met target using Safe Harbor with Confidence Interval
Group met measure using Growth Model
Group met goal or target using an Appeal
Group did not meet measure
- Fewer than 40 students tested
LegendFor confidentiality and reliability, performance results may be based on data from this year, or on an
average of this year and the previous year's data.
■
For confidentiality and reliability, participation results may be based on data from this year, or on an
average of up to three years.
■
Top
Page 1 of 1Pennsylvania Dept of Education - Academic Achievement Report
11/1/2011http://paayp.emetric.net/School/Overview/c11/108118503/1292

Home » Cambria » WESTMONT HILLTOP SD » WESTMONT HILLTOP MS WESTMONT HILLTOP MSSchool AYP Data Table
Attendance 95.85% 94.72%
Previous Year Current Year Met Measure
1
Attendance measure is a goal of 90%, or any improvement from last year 1
Students Overall 86.6 4.0 95.1 8.9 99.4 99.6
White non-Hispanic 87.4 4.2 95.3 8.8 99.6 99.6
Black/African American non-Hispanic - - - - - - - - - -
Latino/Hispanic - - - - - - - - - -
Asian/Pacific Islander - - - - - - - - - -
American Indian/Native American - - - - - - - - - -
Multi-racial/ethnic - - - - - - - - - -
IEP-Special Education 63.0 29.3 70.0 32.5 97.7 97.6
English Language Learners - - - - - - - - - -
Economically Disadvantaged 69.4 -1.7 87.0 9.8 99.1 99.2
Reading Mathematics Reading Mathematics
% At/Above Proficient
Increase/ Decrease from Last
Year Result
% At/Above Proficient
Increase/ Decrease from Last
Year Result % Tested Result % Tested Result
72% 67% 95% 95%
Academic Performance Test Participation
2011 Goals:
Page 1 of 2Pennsylvania Dept of Education - Academic Achievement Report
11/1/2011http://paayp.emetric.net/School/DataTable/c11/108118503/1292

PDE Site | PSSA Results | Contact
How is the Confidence Interval (C.I.) used in AYP decisions?
How is the Growth Model used in AYP decisions?
Group met measure
Group met goal using Confidence Interval
Group met target using Safe Harbor
Group met target using Safe Harbor with Confidence Interval
Group met measure using Growth Model
Group met goal or target using an Appeal
Group did not meet measure
- Fewer than 40 students tested
Legend
In Pennsylvania a school or district can make AYP by using two or three consecutive years of data if the
result is better than a single current year calculation. Two or three years of data is only used if the single
current year calculation doesn't meet the goal and the two or three year calculation does.
For confidentiality and reliability, performance results may be based on data from this year, or on
an average of this year and the previous year's data.
■
For confidentiality and reliability, participation results may be based on data from this year, or on
an average of up to three years.
■
For Academic Performance AYP decisions, a margin of error is added to the percentage of Proficient
students. The margin of error is based on a 95% Confidence Interval when used to meet state goals,
and is based on a 75% Confidence Interval when used to meet Safe Harbor targets.
■
Values indicate the number of percentage points the proficiency rate changed from last year to this
year. Positive values indicate the proficiency rate improved since last year. Note that the
calculation of the difference between last year's and this year's proficiency rate uses the precise
value at each time point, while the rate for this year, as listed in the Percent At/Above Proficient
column, may be based on an average across years.
■
т This percentage includes two consecutive years of data.
π This percentage includes three consecutive years of data.
Confidence intervals take into account the fact that the students tested in any particular year might not be
representative of students in that school across the years. Confidence intervals control for this sampling error or
variation across years by promoting schools or subgroups that come very close to achieving their performance goals,
thus meeting their specific goal. In 2004, the United States Department of Education approved a 95% Confidence
Interval (C.I.) in Pennsylvania for AYP performance calculations. A 95% C.I. can be used for meeting the state
performance goal, while a 75% C.I. can be used for meeting the Safe Harbor target.
The Growth Model recognizes the efforts of schools whose students have not achieved proficiency but are on
trajectories towards proficiency on future PSSA exams. The Growth Model will be calculated for Performance
Indicators (i.e., the all student group and up to nine subgroups). Projected scores are calculated for all students -
including students who are proficient. If a projected score cannot be calculated for a particular student, the student’s
actual score is used. The Growth Model will be applied to an AYP Performance Indicator only if the indicator cohort
has not met AYP performance by any of the existing goals or targets. Actual, not projected, PASA scores, PSSA-M
scores, 3 grade scores, and 11 grade scores are always used, as well as the scores for any students with insufficient
data points to make a projection.
rd th
3 Actual Grade 3 Scores
4 Projected Scores in Grade 6
5 Projected Scores in Grade 7
6 Projected Scores in Grade 8
7 Projected Scores in Grade 8
8 Projected Scores in Grade 11
11 Actual Grade 11 Scores
Grade Last Tested Scores used in Growth Model Calculation
Top
Page 2 of 2Pennsylvania Dept of Education - Academic Achievement Report
11/1/2011http://paayp.emetric.net/School/DataTable/c11/108118503/1292

For confidentiality and reliability, results may be based on data from this year, or on an average of up to three years of data.
Performance measures may be met using Confidence Intervals, Safe Harbor, the Growth Model or through the Appeals process.
Read more about how the Confidence Interval (C.I.) and Growth Model are used in AYP decisions.
How is the Confidence Interval (C.I.) used in AYP decisions?
How is the Growth Model used in AYP decisions?
Home » Cambria » WESTMONT HILLTOP SD » WESTMONT HILLTOP MS WESTMONT HILLTOP MSSchool AYP Performance Report
Students Overall
White non-Hispanic
Black/African American non-Hispanic - -
Latino/Hispanic - -
Asian/Pacific Islander - -
American Indian/Native American - -
Multi-racial/ethnic - -
IEP-Special Education
English Language Learners - -
Economically Disadvantaged
Group met measure
Group met goal using Confidence Interval
Group met target using Safe Harbor
Group met target using Safe Harbor with Confidence Interval
Group met measure using Growth Model
Group met goal or target using an Appeal
Group did not meet measure
- Fewer than 40 students tested
Percentage includes two consecutive years of data
Percentage includes three consecutive years of data
LegendBar may not reach goal line, but may still meet AYP either with a confidence interval, by Safe Harbor,
by the Growth Model, or by Appeals.
■
The Safe Harbor (S.H.) target is met when there is at least a 10% reduction in percentage of students
who scored below Proficient from the previous year. This target is only shown for groups that did not
meet the state target.
■
To evaluate Academic Performance, a margin of error is added to the percentage of Proficient
students. The margin of error is based on a 95% Confidence Interval when used to meet state goals,
and is based on a 75% Confidence Interval when used to meet Safe Harbor targets.
■
In Pennsylvania a school or district can make AYP by using two or three consecutive years of data if
the result is better than a single current year calculation. Two or three years of data is only used if
the single current year calculation doesn't meet the goal and the two or three year calculation does.
■
Confidence intervals take into account the fact that the students tested in any particular year might not be
representative of students in that school across the years. Confidence intervals control for this sampling error or
variation across years by promoting schools or subgroups that come very close to achieving their performance goals,
thus meeting their specific goal. In 2004, the United States Department of Education approved a 95% Confidence
Interval (C.I.) in Pennsylvania for AYP performance calculations. A 95% C.I. can be used for meeting the state
performance goal, while a 75% C.I. can be used for meeting the Safe Harbor target.
2011 2011
Student Group Result Reading Result Mathematics
Page 1 of 2Pennsylvania Dept of Education - Academic Achievement Report
11/1/2011http://paayp.emetric.net/School/Performance/c11/108118503/1292?prevYear=false&fTarg...

PDE Site | PSSA Results | Contact
The Growth Model recognizes the efforts of schools whose students have not achieved proficiency but are on
trajectories towards proficiency on future PSSA exams. The Growth Model will be calculated for Performance
Indicators (i.e., the all student group and up to nine subgroups). Projected scores are calculated for all students -
including students who are proficient. If a projected score cannot be calculated for a particular student, the student’s
actual score is used. The Growth Model will be applied to an AYP Performance Indicator only if the indicator cohort
has not met AYP performance by any of the existing goals or targets. Actual, not projected, PASA scores, PSSA-M
scores, 3 grade scores, and 11 grade scores are always used, as well as the scores for any students with insufficient
data points to make a projection.
rd th
3 Actual Grade 3 Scores
4 Projected Scores in Grade 6
5 Projected Scores in Grade 7
6 Projected Scores in Grade 8
7 Projected Scores in Grade 8
8 Projected Scores in Grade 11
11 Actual Grade 11 Scores
Grade Last Tested Scores used in Growth Model Calculation
Top
Page 2 of 2Pennsylvania Dept of Education - Academic Achievement Report
11/1/2011http://paayp.emetric.net/School/Performance/c11/108118503/1292?prevYear=false&fTarg...

Beginning in 2010: In addition to the PSSA results, the summary calculations also include students' earned scores from the PASA and PSSA-M assessments. Showing all full academic year students.
PSSA + PSSA-M + PASA Graphical Summary: Performance Levels
Beginning in 2010: In addition to the PSSA results, the summary calculations also include students' earned scores from the PASA and PSSA-M assessments. This may cause variation between summary calculations in Data Interaction and AYP Results. Prior to 2010, the summary calculations included PSSA results and students' reported scores for PASA.
Page 1 of 1Graphical Summary: Performance Levels
11/2/2011https://solutions1.emetric.net/PSSA/PSSAcode/SummaryChart.aspx

Copyright © 2011 SAS Institute Inc., Cary, NC, USA. All Rights Reserved.
PVAAS
2011 District (Single Grade) Projection Summary Westmont Hilltop School District
5th Grade Projected to 6th PSSA Reading (Proficient)
AYP Target for 2012: 81%
5th Grade Projected to 6th PSSA Reading (Proficient)
Probability of Proficient or Above Nr of Students Percentage
Greater than or equal to 70% 96 83%
Between 40% and 70% 5 4%
Less than or equal to 40% 7 6%
Students who lack sufficient data 7 6%
Students whose probability of reaching proficient or above is greater than or equal to 70%
Students whose probability of reaching proficient or above is between 40% and 70%
Students whose probability of reaching proficient or above is less than or equal to 40%
Students who do not have a projection due to a lack of sufficient data.

Beginning in 2010: In addition to the PSSA results, the summary calculations also include students' earned scores from the PASA and PSSA-M assessments. Showing all full academic year students.
PSSA + PSSA-M + PASA Graphical Summary: Performance Levels
Beginning in 2010: In addition to the PSSA results, the summary calculations also include students' earned scores from the PASA and PSSA-M assessments. This may cause variation between summary calculations in Data Interaction and AYP Results. Prior to 2010, the summary calculations included PSSA results and students' reported scores for PASA.
Page 1 of 1Graphical Summary: Performance Levels
11/2/2011https://solutions1.emetric.net/PSSA/PSSAcode/SummaryChart.aspx

Copyright © 2011 SAS Institute Inc., Cary, NC, USA. All Rights Reserved.
PVAAS
2011 District (Single Grade) Projection Summary Westmont Hilltop School District
5th Grade Projected to 6th PSSA Math (Proficient)
AYP Target for 2012: 78%
5th Grade Projected to 6th PSSA Math (Proficient)
Probability of Proficient or Above Nr of Students Percentage
Greater than or equal to 70% 103 90%
Between 40% and 70% 2 2%
Less than or equal to 40% 3 3%
Students who lack sufficient data 7 6%
Students whose probability of reaching proficient or above is greater than or equal to 70%
Students whose probability of reaching proficient or above is between 40% and 70%
Students whose probability of reaching proficient or above is less than or equal to 40%
Students who do not have a projection due to a lack of sufficient data.

Beginning in 2010: In addition to the PSSA results, the summary calculations also include students' earned scores from the PASA and PSSA-M assessments. Showing all full academic year students.
PSSA + PSSA-M + PASA Graphical Summary: Performance Levels
Beginning in 2010: In addition to the PSSA results, the summary calculations also include students' earned scores from the PASA and PSSA-M assessments. This may cause variation between summary calculations in Data Interaction and AYP Results. Prior to 2010, the summary calculations included PSSA results and students' reported scores for PASA.
Page 1 of 1Graphical Summary: Performance Levels
11/2/2011https://solutions1.emetric.net/PSSA/PSSAcode/SummaryChart.aspx

Copyright © 2011 SAS Institute Inc., Cary, NC, USA. All Rights Reserved.
PVAAS
2011 District (Single Grade) Projection Summary Westmont Hilltop School District
6th Grade Projected to 7th PSSA Reading (Proficient)
AYP Target for 2012: 81%
6th Grade Projected to 7th PSSA Reading (Proficient)
Probability of Proficient or Above Nr of Students Percentage
Greater than or equal to 70% 103 88%
Between 40% and 70% 8 7%
Less than or equal to 40% 3 3%
Students who lack sufficient data 3 3%
Students whose probability of reaching proficient or above is greater than or equal to 70%
Students whose probability of reaching proficient or above is between 40% and 70%
Students whose probability of reaching proficient or above is less than or equal to 40%
Students who do not have a projection due to a lack of sufficient data.
Beginning in 2010: In addition to the PSSA results, the summary calculations also include students' earned scores from the PASA and PSSA-M assessments. Showing all full academic year students.
PSSA + PSSA-M + PASA Graphical Summary: Performance Levels
Beginning in 2010: In addition to the PSSA results, the summary calculations also include students' earned scores from the PASA and PSSA-M assessments. This may cause variation between summary calculations in Data Interaction and AYP Results. Prior to 2010, the summary calculations included PSSA results and students' reported scores for PASA.
Page 1 of 1Graphical Summary: Performance Levels
11/2/2011https://solutions1.emetric.net/PSSA/PSSAcode/SummaryChart.aspx

Copyright © 2011 SAS Institute Inc., Cary, NC, USA. All Rights Reserved.
PVAAS
2011 District (Single Grade) Projection Summary Westmont Hilltop School District
6th Grade Projected to 7th PSSA Math (Proficient)
AYP Target for 2012: 78%
6th Grade Projected to 7th PSSA Math (Proficient)
Probability of Proficient or Above Nr of Students Percentage
Greater than or equal to 70% 106 91%
Between 40% and 70% 4 3%
Less than or equal to 40% 4 3%
Students who lack sufficient data 3 3%
Students whose probability of reaching proficient or above is greater than or equal to 70%
Students whose probability of reaching proficient or above is between 40% and 70%
Students whose probability of reaching proficient or above is less than or equal to 40%
Students who do not have a projection due to a lack of sufficient data.

Beginning in 2010: In addition to the PSSA results, the summary calculations also include students' earned scores from the PASA and PSSA-M assessments. Showing all full academic year students.
PSSA + PSSA-M + PASA Graphical Summary: Performance Levels
Beginning in 2010: In addition to the PSSA results, the summary calculations also include students' earned scores from the PASA and PSSA-M assessments. This may cause variation between summary calculations in Data Interaction and AYP Results. Prior to 2010, the summary calculations included PSSA results and students' reported scores for PASA.
Page 1 of 1Graphical Summary: Performance Levels
11/2/2011https://solutions1.emetric.net/PSSA/PSSAcode/SummaryChart.aspx

Copyright © 2011 SAS Institute Inc., Cary, NC, USA. All Rights Reserved.
PVAAS
2011 District (Single Grade) Projection Summary Westmont Hilltop School District
7th Grade Projected to 8th PSSA Reading (Proficient)
AYP Target for 2012: 81%
7th Grade Projected to 8th PSSA Reading (Proficient)
Probability of Proficient or Above Nr of Students Percentage
Greater than or equal to 70% 110 85%
Between 40% and 70% 6 5%
Less than or equal to 40% 5 4%
Students who lack sufficient data 9 7%
Students whose probability of reaching proficient or above is greater than or equal to 70%
Students whose probability of reaching proficient or above is between 40% and 70%
Students whose probability of reaching proficient or above is less than or equal to 40%
Students who do not have a projection due to a lack of sufficient data.
Beginning in 2010: In addition to the PSSA results, the summary calculations also include students' earned scores from the PASA and PSSA-M assessments. Showing all full academic year students.
PSSA + PSSA-M + PASA Graphical Summary: Performance Levels
Beginning in 2010: In addition to the PSSA results, the summary calculations also include students' earned scores from the PASA and PSSA-M assessments. This may cause variation between summary calculations in Data Interaction and AYP Results. Prior to 2010, the summary calculations included PSSA results and students' reported scores for PASA.
Page 1 of 1Graphical Summary: Performance Levels
11/2/2011https://solutions1.emetric.net/PSSA/PSSAcode/SummaryChart.aspx

Copyright © 2011 SAS Institute Inc., Cary, NC, USA. All Rights Reserved.
PVAAS
2011 District (Single Grade) Projection Summary Westmont Hilltop School District
7th Grade Projected to 8th PSSA Math (Proficient)
AYP Target for 2012: 78%
7th Grade Projected to 8th PSSA Math (Proficient)
Probability of Proficient or Above Nr of Students Percentage
Greater than or equal to 70% 99 76%
Between 40% and 70% 10 8%
Less than or equal to 40% 12 9%
Students who lack sufficient data 9 7%
Students whose probability of reaching proficient or above is greater than or equal to 70%
Students whose probability of reaching proficient or above is between 40% and 70%
Students whose probability of reaching proficient or above is less than or equal to 40%
Students who do not have a projection due to a lack of sufficient data.

Beginning in 2010: In addition to the PSSA results, the summary calculations also include students' earned scores from the PASA and PSSA-M assessments. Showing all full academic year students.
PSSA + PSSA-M + PASA Graphical Summary: Performance Levels
Beginning in 2010: In addition to the PSSA results, the summary calculations also include students' earned scores from the PASA and PSSA-M assessments. This may cause variation between summary calculations in Data Interaction and AYP Results. Prior to 2010, the summary calculations included PSSA results and students' reported scores for PASA.
Page 1 of 1Graphical Summary: Performance Levels
11/2/2011https://solutions1.emetric.net/PSSA/PSSAcode/SummaryChart.aspx

Copyright © 2011 SAS Institute Inc., Cary, NC, USA. All Rights Reserved.
PVAAS
2011 District (Single Grade) Projection Summary Westmont Hilltop School District
8th Grade Projected to 11th PSSA Reading (Proficient)
AYP Target for 2014: 100%
8th Grade Projected to 11th PSSA Reading (Proficient)
Probability of Proficient or Above Nr of Students Percentage
Greater than or equal to 70% 104 85%
Between 40% and 70% 7 6%
Less than or equal to 40% 8 7%
Students who lack sufficient data 3 2%
Students whose probability of reaching proficient or above is greater than or equal to 70%
Students whose probability of reaching proficient or above is between 40% and 70%
Students whose probability of reaching proficient or above is less than or equal to 40%
Students who do not have a projection due to a lack of sufficient data.

Beginning in 2010: In addition to the PSSA results, the summary calculations also include students' earned scores from the PASA and PSSA-M assessments. Showing all full academic year students.
PSSA + PSSA-M + PASA Graphical Summary: Performance Levels
Beginning in 2010: In addition to the PSSA results, the summary calculations also include students' earned scores from the PASA and PSSA-M assessments. This may cause variation between summary calculations in Data Interaction and AYP Results. Prior to 2010, the summary calculations included PSSA results and students' reported scores for PASA.
Page 1 of 1Graphical Summary: Performance Levels
11/2/2011https://solutions1.emetric.net/PSSA/PSSAcode/SummaryChart.aspx

Copyright © 2011 SAS Institute Inc., Cary, NC, USA. All Rights Reserved.
PVAAS
2011 District (Single Grade) Projection Summary Westmont Hilltop School District
8th Grade Projected to 11th PSSA Math (Proficient)
AYP Target for 2014: 100%
8th Grade Projected to 11th PSSA Math (Proficient)
Probability of Proficient or Above Nr of Students Percentage
Greater than or equal to 70% 77 63%
Between 40% and 70% 22 18%
Less than or equal to 40% 20 16%
Students who lack sufficient data 3 2%
Students whose probability of reaching proficient or above is greater than or equal to 70%
Students whose probability of reaching proficient or above is between 40% and 70%
Students whose probability of reaching proficient or above is less than or equal to 40%
Students who do not have a projection due to a lack of sufficient data.

Beginning in 2010: In addition to the PSSA results, the summary calculations also include students' earned scores from the PASA and PSSA-M assessments. Showing all full academic year students.
PSSA + PSSA-M + PASA Graphical Summary: Performance Levels
Beginning in 2010: In addition to the PSSA results, the summary calculations also include students' earned scores from the PASA and PSSA-M assessments. This may cause variation between summary calculations in Data Interaction and AYP Results. Prior to 2010, the summary calculations included PSSA results and students' reported scores for PASA.
Page 1 of 1Graphical Summary: Performance Levels
11/2/2011https://solutions1.emetric.net/PSSA/PSSAcode/SummaryChart.aspx

Home » Cambria » WESTMONT HILLTOP SD » WESTMONT HILLTOP HS
For Parents
This report is a summary of your school's Adequate Yearly Progress (AYP) results. The purpose of AYP is to
ensure that all students have reading and mathematics skills that prepare them for the future. Adequate Yearly
Progress measures whether each school has met the improvement goals established by No Child Left Behind.
For a school to "Make AYP," students in the school must meet goals in three areas: (1) Attendance (for schools
without a high school graduating class) or Graduation (for schools with a High School graduating class), (2)
Academic Performance, and (3) Test Participation. For WESTMONT HILLTOP HS, the Pennsylvania System of
School Assessment (PSSA) taken by students in Grade 11 is used to determine Academic Performance and Test
Participation in Reading and Mathematics. To learn more about AYP, click the "About AYP" link at the top of the
page.
WESTMONT HILLTOP HS met 9 out of 9 AYP measures in 2010-11. Because AYP requires meeting all of the
measures, this school met AYP requirements. This is good news! This school is on track to meet the goal of all
students reaching proficiency.
The performance chart and/or data table can show more details about how this school performed.
Safe Harbor is achieved when a subgroup has greatly improved since the previous year — even though it did not
meet the state goal. (The measure for Safe Harbor improvement is at least a 10% reduction of the percentage
of students who scored below Proficient for Reading or Mathematics from last year to this year).
Since all test performance targets/goals to meet AYP were met by WESTMONT HILLTOP HS, Safe Harbor was
not applicable to this school.
The Growth Model recognizes the efforts of schools whose students have not achieved proficiency but are on
trajectories towards proficiency on future PSSA exams. The Growth Model will be calculated for Performance
Indicators (i.e., the all student group and up to nine subgroups). Projected scores are calculated for all
students - including students who are proficient. If a projected score cannot be calculated for a particular
student, the student’s actual score is used. The Growth Model will be applied to an AYP Performance Indicator
only if the indicator cohort has not met AYP performance by any of the existing goals or targets. Actual, not
projected, PASA scores, PSSA-M scores, 3 grade scores, and 11 grade scores are always used, as well as the
scores for any students with insufficient data points to make a projection.
What is this Adequate Yearly Progress (AYP) Report?•
Did this school meet all AYP measures?•
Did this school meet any AYP targets through Safe Harbor?•
Did this school meet any AYP measures through the Growth Model?•
Did this school meet any AYP measures through the appeals process?•
What does this report mean for WESTMONT HILLTOP HS?•
What can parents do?•
What is this Adequate Yearly Progress (AYP) report?
Top
Did this school meet all AYP measures?
Top
Did this school meet any AYP targets through Safe Harbor?
Top
Did this school meet any AYP measures through the Growth Model?
rd th
3 Actual Grade 3 Scores
4 Projected Scores in Grade 6
5 Projected Scores in Grade 7
6 Projected Scores in Grade 8
7 Projected Scores in Grade 8
Grade Last Tested Scores used in Growth Model Calculation
Page 1 of 2Pennsylvania Dept of Education - Academic Achievement Report
11/1/2011http://paayp.emetric.net/School/Parents/c11/108118503/1293

PDE Site | PSSA Results | Contact
Since all test performance targets/goals to meet AYP were met by WESTMONT HILLTOP HS, Growth Model
considerations do not apply to this school.
When initial AYP results are announced each year, schools and districts have the opportunity to review the data
that is utilized to determine AYP and request changes through the Bureau of Assessment and Accountability to
correct any errors. Also, schools and districts have the opportunity to appeal the AYP rulings through the
Pennsylvania Department of Education if they believe their AYP identification was in error for statistical or
other substantive reasons.
Since all test performance targets/goals to meet AYP were met by WESTMONT HILLTOP HS, appeals were not
applicable.
Well done! This school has met all AYP measures for the 2010-11 school year. This school has performed well
this year, and appears to be on track to meet the goal of all students attaining proficiency in Reading and Math
by the year 2014.
This school may wish to review its improvement strategies and create an improvement plan to continue to
meet AYP next year. Click the 'About AYP' link at the top of the page to learn more about AYP requirements
and AYP status levels in Pennsylvania.
There are several ways to get involved in your child's education and to help your child and your child's school
succeed.
8 Projected Scores in Grade 11
11 Actual Grade 11 Scores
Top
Did this school meet any AYP measures through the appeals process?
Top
What does this report mean for WESTMONT HILLTOP HS?
Top
What can parents do?
Make sure your child is in school: Please make sure your child is attending school every day, including
testing days.
•
Help your child succeed: The most important requirements of AYP are your child’s achieved performance
and demonstrated growth in Reading and Mathematics.
•
Work with your child's teacher to help your child succeed in school. Your child's teacher can help you
find resources and provide insight and suggestions for you to help your child reach his or her full
potential.
◦
If your child was tested in Spring 2011, you should receive a printed Parent Report that outlines your
child's performance on the Assessment. This report includes educational activities to do with your
child and is a good starting point to discuss your child's performance with their teacher.
◦
Get involved: You can join your school's Parent-Teacher Organization (PTO) or volunteer at your child's
school. Contact your child's school for information on other ways to get involved.
•
Top
Page 2 of 2Pennsylvania Dept of Education - Academic Achievement Report
11/1/2011http://paayp.emetric.net/School/Parents/c11/108118503/1293

PDE Site | PSSA Results | Contact
Home » Cambria » WESTMONT HILLTOP SD » WESTMONT HILLTOP HS WESTMONT HILLTOP HSSchool AYP Overview
2011 AYP Status
Made AYP
Target Result
Graduation 1 / 1
Academic Performance 4 / 4
Test Participation 4 / 4
Totals: 9 / 9
2010 AYP Status
Made AYP
Target Result
Graduation 1 / 1
Academic Performance 4 / 4
Test Participation 4 / 4
Totals: 9 / 9
2011 Academic Performance Test Participation
Reading Mathematics Reading Mathematics
Students Overall
White non-Hispanic
Black/African American non-Hispanic - - - -Latino/Hispanic - - - -Asian/Pacific Islander - - - -American Indian/Native American - - - -Multi-racial/ethnic - - - -IEP-Special Education - - - -English Language Learners - - - -Economically Disadvantaged - - - -
Measures Achieved
Group met measure
Group met goal using Confidence Interval
Group met target using Safe Harbor
Group met target using Safe Harbor with Confidence Interval
Group met measure using Growth Model
Group met goal or target using an Appeal
Group did not meet measure
- Fewer than 40 students tested
LegendFor confidentiality and reliability, performance results may be based on data from this year, or on an
average of this year and the previous year's data.
■
For confidentiality and reliability, participation results may be based on data from this year, or on an
average of up to three years.
■
Top
Page 1 of 1Pennsylvania Dept of Education - Academic Achievement Report
11/1/2011http://paayp.emetric.net/School/Overview/c11/108118503/1293

Home » Cambria » WESTMONT HILLTOP SD » WESTMONT HILLTOP HS WESTMONT HILLTOP HSSchool AYP Data Table
Graduation 96.30% 97.64%
Previous Year Current Year Met Measure
1
Graduation measure is a goal of 85%, or a target of 82.5% or a 10% reduction1
of the difference between the previous year's graduation rate and 85%
Students Overall 77.1 -5.1 62.7 т -16.2 99.3 99.3
White non-Hispanic 76.4 -8.3 62.7 т -18.9 99.3 99.3
Black/African American non-Hispanic - - - - - - - - - -
Latino/Hispanic - - - - - - - - - -
Asian/Pacific Islander - - - - - - - - - -
American Indian/Native American - - - - - - - - - -
Multi-racial/ethnic - - - - - - - - - -
IEP-Special Education - - - - - - - - - -
English Language Learners - - - - - - - - - -
Economically Disadvantaged - - - - - - - - - -
Reading Mathematics Reading Mathematics
% At/Above Proficient
Increase/ Decrease from Last
Year Result
% At/Above Proficient
Increase/ Decrease from Last
Year Result % Tested Result % Tested Result
72% 67% 95% 95%
Academic Performance Test Participation
2011 Goals:
Page 1 of 2Pennsylvania Dept of Education - Academic Achievement Report
11/1/2011http://paayp.emetric.net/School/DataTable/c11/108118503/1293

PDE Site | PSSA Results | Contact
How is the Confidence Interval (C.I.) used in AYP decisions?
How is the Growth Model used in AYP decisions?
Group met measure
Group met goal using Confidence Interval
Group met target using Safe Harbor
Group met target using Safe Harbor with Confidence Interval
Group met measure using Growth Model
Group met goal or target using an Appeal
Group did not meet measure
- Fewer than 40 students tested
Legend
In Pennsylvania a school or district can make AYP by using two or three consecutive years of data if the
result is better than a single current year calculation. Two or three years of data is only used if the single
current year calculation doesn't meet the goal and the two or three year calculation does.
For confidentiality and reliability, performance results may be based on data from this year, or on
an average of this year and the previous year's data.
■
For confidentiality and reliability, participation results may be based on data from this year, or on
an average of up to three years.
■
For Academic Performance AYP decisions, a margin of error is added to the percentage of Proficient
students. The margin of error is based on a 95% Confidence Interval when used to meet state goals,
and is based on a 75% Confidence Interval when used to meet Safe Harbor targets.
■
Values indicate the number of percentage points the proficiency rate changed from last year to this
year. Positive values indicate the proficiency rate improved since last year. Note that the
calculation of the difference between last year's and this year's proficiency rate uses the precise
value at each time point, while the rate for this year, as listed in the Percent At/Above Proficient
column, may be based on an average across years.
■
т This percentage includes two consecutive years of data.
π This percentage includes three consecutive years of data.
Confidence intervals take into account the fact that the students tested in any particular year might not be
representative of students in that school across the years. Confidence intervals control for this sampling error or
variation across years by promoting schools or subgroups that come very close to achieving their performance goals,
thus meeting their specific goal. In 2004, the United States Department of Education approved a 95% Confidence
Interval (C.I.) in Pennsylvania for AYP performance calculations. A 95% C.I. can be used for meeting the state
performance goal, while a 75% C.I. can be used for meeting the Safe Harbor target.
The Growth Model recognizes the efforts of schools whose students have not achieved proficiency but are on
trajectories towards proficiency on future PSSA exams. The Growth Model will be calculated for Performance
Indicators (i.e., the all student group and up to nine subgroups). Projected scores are calculated for all students -
including students who are proficient. If a projected score cannot be calculated for a particular student, the student’s
actual score is used. The Growth Model will be applied to an AYP Performance Indicator only if the indicator cohort
has not met AYP performance by any of the existing goals or targets. Actual, not projected, PASA scores, PSSA-M
scores, 3 grade scores, and 11 grade scores are always used, as well as the scores for any students with insufficient
data points to make a projection.
rd th
3 Actual Grade 3 Scores
4 Projected Scores in Grade 6
5 Projected Scores in Grade 7
6 Projected Scores in Grade 8
7 Projected Scores in Grade 8
8 Projected Scores in Grade 11
11 Actual Grade 11 Scores
Grade Last Tested Scores used in Growth Model Calculation
Top
Page 2 of 2Pennsylvania Dept of Education - Academic Achievement Report
11/1/2011http://paayp.emetric.net/School/DataTable/c11/108118503/1293

For confidentiality and reliability, results may be based on data from this year, or on an average of up to three years of data.
Performance measures may be met using Confidence Intervals, Safe Harbor, the Growth Model or through the Appeals process.
Read more about how the Confidence Interval (C.I.) and Growth Model are used in AYP decisions.
How is the Confidence Interval (C.I.) used in AYP decisions?
How is the Growth Model used in AYP decisions?
Home » Cambria » WESTMONT HILLTOP SD » WESTMONT HILLTOP HS WESTMONT HILLTOP HSSchool AYP Performance Report
Students Overall
White non-Hispanic
Black/African American non-Hispanic - -
Latino/Hispanic - -
Asian/Pacific Islander - -
American Indian/Native American - -
Multi-racial/ethnic - -
IEP-Special Education - -
English Language Learners - -
Economically Disadvantaged - -
Group met measure
Group met goal using Confidence Interval
Group met target using Safe Harbor
Group met target using Safe Harbor with Confidence Interval
Group met measure using Growth Model
Group met goal or target using an Appeal
Group did not meet measure
- Fewer than 40 students tested
Percentage includes two consecutive years of data
Percentage includes three consecutive years of data
LegendBar may not reach goal line, but may still meet AYP either with a confidence interval, by Safe Harbor,
by the Growth Model, or by Appeals.
■
The Safe Harbor (S.H.) target is met when there is at least a 10% reduction in percentage of students
who scored below Proficient from the previous year. This target is only shown for groups that did not
meet the state target.
■
To evaluate Academic Performance, a margin of error is added to the percentage of Proficient
students. The margin of error is based on a 95% Confidence Interval when used to meet state goals,
and is based on a 75% Confidence Interval when used to meet Safe Harbor targets.
■
In Pennsylvania a school or district can make AYP by using two or three consecutive years of data if
the result is better than a single current year calculation. Two or three years of data is only used if
the single current year calculation doesn't meet the goal and the two or three year calculation does.
■
Confidence intervals take into account the fact that the students tested in any particular year might not be
representative of students in that school across the years. Confidence intervals control for this sampling error or
variation across years by promoting schools or subgroups that come very close to achieving their performance goals,
thus meeting their specific goal. In 2004, the United States Department of Education approved a 95% Confidence
Interval (C.I.) in Pennsylvania for AYP performance calculations. A 95% C.I. can be used for meeting the state
performance goal, while a 75% C.I. can be used for meeting the Safe Harbor target.
2011 2011
Student Group Result Reading Result Mathematics
Page 1 of 2Pennsylvania Dept of Education - Academic Achievement Report
11/1/2011http://paayp.emetric.net/School/Performance/c11/108118503/1293?prevYear=false&fTarg...

PDE Site | PSSA Results | Contact
The Growth Model recognizes the efforts of schools whose students have not achieved proficiency but are on
trajectories towards proficiency on future PSSA exams. The Growth Model will be calculated for Performance
Indicators (i.e., the all student group and up to nine subgroups). Projected scores are calculated for all students -
including students who are proficient. If a projected score cannot be calculated for a particular student, the student’s
actual score is used. The Growth Model will be applied to an AYP Performance Indicator only if the indicator cohort
has not met AYP performance by any of the existing goals or targets. Actual, not projected, PASA scores, PSSA-M
scores, 3 grade scores, and 11 grade scores are always used, as well as the scores for any students with insufficient
data points to make a projection.
rd th
3 Actual Grade 3 Scores
4 Projected Scores in Grade 6
5 Projected Scores in Grade 7
6 Projected Scores in Grade 8
7 Projected Scores in Grade 8
8 Projected Scores in Grade 11
11 Actual Grade 11 Scores
Grade Last Tested Scores used in Growth Model Calculation
Top
Page 2 of 2Pennsylvania Dept of Education - Academic Achievement Report
11/1/2011http://paayp.emetric.net/School/Performance/c11/108118503/1293?prevYear=false&fTarg...
Beginning in 2010: In addition to the PSSA results, the summary calculations also include students' earned scores from the PASA and PSSA-M assessments. Showing all full academic year students.
PSSA + PSSA-M + PASA Graphical Summary: Performance Levels
Beginning in 2010: In addition to the PSSA results, the summary calculations also include students' earned scores from the PASA and PSSA-M assessments. This may cause variation between summary calculations in Data Interaction and AYP Results. Prior to 2010, the summary calculations included PSSA results and students' reported scores for PASA.
Page 1 of 1Graphical Summary: Performance Levels
11/2/2011https://solutions1.emetric.net/PSSA/PSSAcode/SummaryChart.aspx

2003-2014 PSSA Target Goals
(Note: Target Goals are Used to Determine AYP) Percentage of Students Proficient and Advanced
Targets for
Spring of:
Percent of Proficient Reading
Performances
3
4
5
6
7
8
11
Percent of Proficient
Math Performances
3
4
5
6
7
8
11 2003 45% 64% 79% 69% 35% 67% 72% 63%
2004 45% 64% 72% 81% 74% 35% 67% 70% 75% 62%
2005 54% 77% 72% 83% 80% 45% 90% 78% 80% 75%
2006 54% 74% 83% 77% 75% 85% 91% 78% 45% 91% 89% 76% 78% 93% 82% 70%
2007 54% 88% 78% 75% 73% 78% 94% 83% 45% 91% 87% 85% 86% 81% 87% 73%
2008 63% 90% 82% 78% 85% 94% 91% 78% 56% 92% 88% 96% 97% 92% 86% 66%
2009 63% 87% 84% 72% 86% 85% 95% 83% 56% 95% 85% 86% 91% 94% 91% 71%
2010 63% 81% 84% 66% 76% 95% 92% 82% 56% 87% 95% 86% 89% 92% 79% 73%
2011 72% 83% 79% 75% 93% 88% 94% 78% 67% 95% 94% 97% 96% 97% 94% 56%
2012 81% 78%
2013 91% 89%
2014 100% 100%