Embed Size (px)
Citation preview

1
What is the Probability of Receiving a US Patent?*
Michael Carley†, Deepak Hegde‡,§ and Alan Marco**
January 10, 2014
ABSTRACT
We follow the prosecution histories of the 2.15 million new patent applications filed at the US Patent and
Trademark Office between 1996 and 2005 to calculate patent allowance rates. 55.8% of the applications
emerged as patents without using continuation procedures to spawn related applications. The success rate
of applications decreased substantially from 1996 to 2005, particularly for applications in the “Drugs and
Medical Instruments” and “Computers and Communications” fields. Applications filed by large firms are
more likely to emerge as patents than those filed by small firms. We discuss the implications of our
findings for inventors, policy makers, and social scientists who use successful patent applications as
indicators of innovation.
USPTO Economics Working Paper No. 2013-2.
Available at: http://ssrn.com/abstract=2367149
JEL Code: O34
* Authors are listed in alphabetical order. The authors thank Paul D’Agostino, Charles Eloshway, Kira
Fabrizio, Dan Hunter, Jenny Kuan, Joanne Oxley, Gregory Mills, Binta Robinson, Patrick Ross, Robert
Seamans, and Arvids Ziedonis for helpful discussions and suggestions. A.M. is Acting Chief Economist,
M.C. is Economist, and D.H. is a visiting scholar at the USPTO. D.H.’s research was funded by the 2012-
2013 Kauffman Faculty Fellowship. The analysis and recommendations in this manuscript, however, are
solely the authors’ and do not necessarily reflect the views of either the USPTO or the Kauffman
Foundation.
† United States Patent and Trademark Office
‡ New York University
§ Corresponding author; email: [email protected]
** United States Patent and Trademark Office
2
1. Introduction
Inventors choose among different appropriability mechanisms, such as patents, copyrights, trademarks,
and trade-secrecy, to protect their inventions based on their relative costs and benefits (Cohen, et al
2000). A key element of the inventors’ cost-benefit calculus is the expectation that their patent application
will succeed. However, little information exists on the historical rates at which patent applications are
granted in the US. This paucity of information about the probability of getting patents impairs inventors’
decisions regarding their choice of appropriability mechanisms; it also afflicts policy debates on the rigor
of patent examination and abuses of the US patent system (see National Academy of Sciences 2001, Jaffe
and Lerner 2004, Bessen and Meurer 2008). For example, writing with economist Gary Becker, Judge
Posner recently opined that “the problem of patent trolls is a function in part of the promiscuity with
which the patent office has issued patents...” (Posner 2013).
The calculation of patent allowance rates, while simple on the surface, is complicated by several aspects
of the patent examination process. First, US patent applications that are rejected after examination by the
patent office can spawn closely related but “new” applications (called “continuations”) that are hard to
track but may finally emerge as patents. Second, the US patent office publishes information on the
outcomes of examination only for the applications that are published (after patent grant for applications
filed before November 29, 2000 and after 18-months from application date for applications filed on or
after November 29, 2000 that are still pending at 18 months with some exceptions, See 35 USC 122).
Third, applicants alter and narrow the claims of their applications during the examination process. Thus,
the allowance of some patentable claims within an application is not the same as the allowance of an
application as it was filed, and should be taken into account in any discussion of allowance rates.
What is the probability that a patent application filed at the US Patent and Trademark Office (PTO, “the
agency,” or “the office”) emerges as a patent? Our objective here is to establish some facts related to this
question by analyzing unique application-level data available internally at the PTO. The data tracks each
of the 2.15 million new utility patent applications filed at the PTO between 1996 and 2005. These
applications represent the population of “progenitor applications,” that is, applications unrelated to any
previously filed US applications. We track the applications from the date they entered the Office through
June 30, 2013, by which time 99.8% of the progenitor applications had exited the system as a patent or
were abandoned. This allows us to link each progenitor application to its children applications
(subsequent applications spawned by the progenitor applications through the use of various continuation
procedures) and to accurately estimate the probability of allowance without the limitations of previous
3
studies based on partial samples of published applications (e.g., Lemley and Sampat 2008) or exit cohorts
(e.g., Quillen and Webster 2001, 2009).1,2
In order to capture the complexity of the examination process, we calculate three measures of patent
allowance rates: (i) first action allowance rate, or the proportion of progenitor applications that are
allowed without further examination; (ii) progenitor allowance rate (or simply, allowance rate), or the
proportion of progenitor applications that are allowed and patented without using any continuation
procedure, and (iii) family allowance rate, or the proportion of progenitor applications that produce at
least one patent, including the outcomes of applications that emerge from the progenitors through the use
of continuation procedures.
2. The US patent examination process
We simplify our description of the patent examination procedures and rules, and discuss only the most
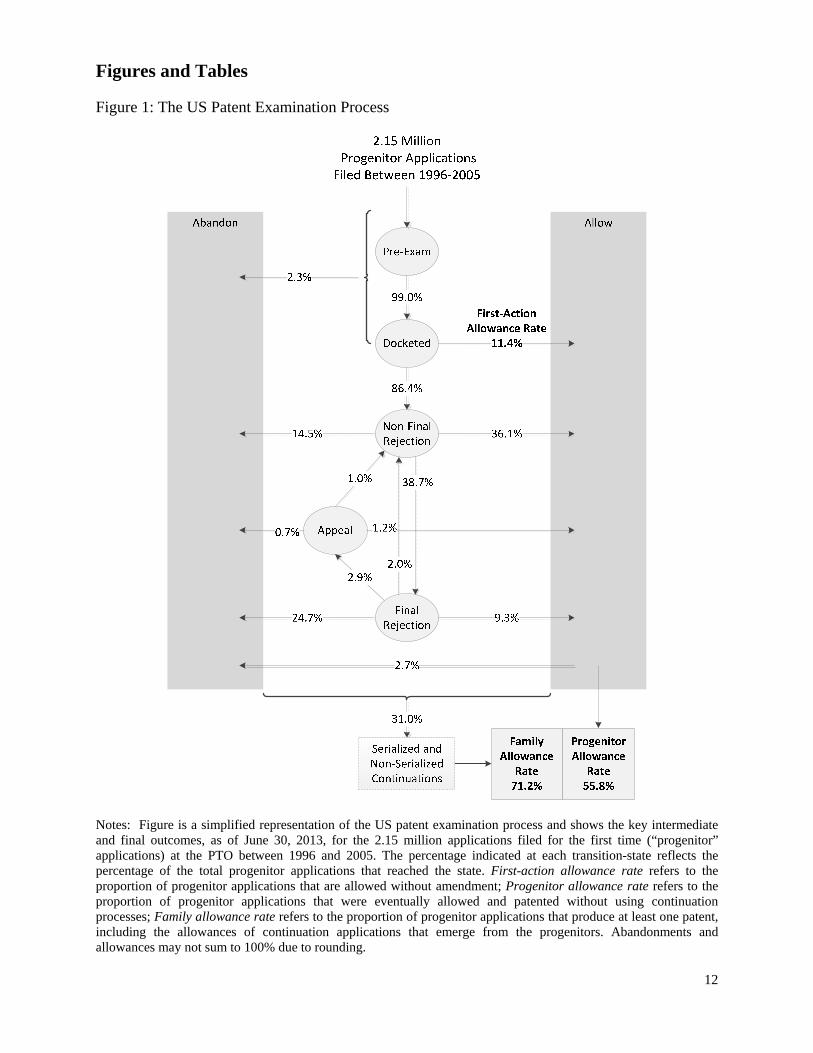
salient events relevant to our objective.3 Accordingly, Figure 1 presents a stylized version of the US
patent examination process, using data for the 1996-2005 filing cohorts of progenitor applications. Each
application is queued for examination when the application is docketed to an examiner. Applications that
are incomplete or not accompanied by the appropriate fees within the grace period are considered
abandoned and not docketed to an examiner. The first significant correspondence that an applicant
receives from the office is called a “first action on the merits” (or simply “first action”). The first action
includes a search report with a listing of relevant prior art that supports the examiner’s decision of either
allowance or non-final rejection. The office allowed 11.4% of the progenitor applications at first action
and delivered a non-final rejection decision for 86.4% of the applications, with the remaining 2.3% being
abandoned prior to first action. 36.1% of the progenitor applications were allowed after one or more
1 Data on unpublished applications are not made available to the public to protect the intellectual property
of patent applicants who may choose to abandon their applications prior to 18-month publication date. If
unpublished applications are more likely to be abandoned, allowance rates calculated based on publicly
available data (i.e., published applications) will be biased upwards. However, we will make available on
request, detailed instructions on how to obtain data on published patent applications.
2 The careful work of Lemley and Sampat (2008) attempts to overcome some of these problems by
tracking a sample of applications through the Patent Application Information Retrieval (PAIR) system,
but their analysis is based on a sample of published applications. The small sample of 9,960 applications
filed in January 2001 they examine also limits their study’s scope.
3 The USPTO’s official patent application filing guide provides a more comprehensive description of the
rules and procedures. See http://www.uspto.gov/patents/resources/types/utility.jsp
4
rounds of amendments and negotiations with the examiner, but prior to a final rejection. 14.5%
abandoned between non-final rejection and final rejection. 38.7% received a final rejection.
Figure 1 here
For most applications, prosecution at the office ends with patent allowance (and patent issue) or with
abandonment. Applications are considered abandoned if the applicant does not respond to the examiner’s
decision within the stipulated deadlines, or if the applicant expressly requests abandonment. Hence, there
is no formally decisive rejection from the Office—only abandonments that result from applicants’ actions
and non-actions. Applicants can continue to submit amended applications with additional material to
persuade the examiner even after receiving a final rejection. 9.3% of applications received a final
rejection and were allowed after the applicant responded with after final amendments and supporting
material. Further, applicants can formally appeal a final rejection by submitting an appeal to the erstwhile
Board of Patent Appeals and Interferences.7.5% (2.9/38.7) of the final rejections were subject to appeals
and 41.4% (1.2/2.9) of the appeals resulted in allowances. 2.7% of applications were abandoned after
allowance; thus, overall, 55.8% of progenitor applications emerged as patents without the use of
continuation procedures.
Continuation procedures
Applicants can continue prosecution after receiving a final rejection (or even after they receive an
allowance), by using various continuation procedures at the PTO. Some scholars have blamed the
procedures for several abuses of the patent system including submarine patents, long pending patent
applications, and low-quality patents (e.g., Lemley and Moore 2004), while others have pointed out that
they may help applicants revise their applications to reflect the developments to their inventions while the
applications are under examination (Hegde, et al, 2009).
31% of the progenitor applications utilized some form of continuation procedure. These continuation
procedures at the office can be of two broad types: non-serialized continuations and serialized
continuations.4 Non-serialized continuations do not receive a new serial number and are immediately
docketed to the same examiner that prosecuted the progenitor (the progenitor application is counted as
abandoned in many official statistics and examiner production metrics). Requests for Continued
Examination (RCEs, instituted in 1999) are by far the most common type of non-serialized continuations
4 Serialized continuations can be exercised at any point during patent examination. Non-serialized
continuations may only be used after particular events in prosecution—typically after final rejection.
5
and applicants may file an RCE multiple times during prosecution.5 19.5% of the progenitors filed at
least one RCE. Of the applications that moved from non-final rejection to final rejection, 38.7% filed an
RCE. Thus, if one includes allowances of the non-serialized continuation applications that emerged from
the progenitors, the allowance rate jumps from 55.8% to 69.2%.
In contrast to non-serialized continuations, serialized continuations are treated as new applications; they
receive a new serial number and are docketed to examiners based on the classification of the new
application. There are three types of serialized continuations. Applicants may file for a simple
continuation (CON) of a parent application to receive the benefit of the parent’s priority date so long as
the CON limits itself to the specification described in the parent. Applicants can use the “Continuation-In-
Part” (CIP) to introduce new subject matter to an existing application. Alternatively, if two or more
independent and distinct inventions are claimed in one application, the Office may require the application
to be restricted to one of the inventions, and the applicant may file a divisional (DIV) application.
Serialized continuations receive the priority date of the progenitor, with the exception of new matter
added in CIPs, so long as the progenitor is pending when the serialized continuation is filed. The
progenitor does not have to be abandoned following a serialized continuation. The parent and child may
proceed through the examination process in parallel, and a single progenitor can produce a chain of
several serialized continuations resulting in multiple patents, thus complicating the calculation of
allowance rates for progenitors. 15.8% of the progenitor applications gave birth to at least one serialized
continuation as of June 30, 2013.Overall, 71.2% of progenitor applications resulted in the issue of at least
one patent after counting the allowances of applications emerging from (serialized and non-serialized)
continuation procedures.
Figure 2 here
Figure 2 plots the three allowance rates by the entry year of the progenitors. The figure shows that the
probability of allowance is substantially lower for the recent cohort of applications. The striking decline
in first action allowance rates and progenitor allowance rates is unlikely to be due to censoring since the
5 There have been several incarnations of non-serialized continuations, including Continued Prosecution
Applications (CPAs), Rule 129 continuations (R129s), and File Wrapper Continuations (FWCs). The
most recent incarnation (and by far the most prevalent) is the Request for Continued Examination (RCEs).
Throughout this section, we refer collectively to all these non-serialized continuations as RCEs. Until
November 2009, RCEs were put on the “amended docket,” which meant that the examiner had to respond
within two months. Since that time, RCEs have gone on the “special new docket,” meaning that the
examiner has more discretion as to when to respond (similar to newly docketed applications).

6
mean first-action pendency for applications filed during the period was 21.1 months and total pendency
was 29.1 months (first-action pendency refers to the time between application date and first-action date;
total pendency refers to the time between application date and disposal date; Hegde 2012 reports
pendency statistics at the PTO between 1991 and 2010). Although less than 1% of the progenitor
applications in our study were pending to date, a larger proportion of abandoned progenitors have
continuation applications that are still pending, thus potentially biasing our family allowance rates
downward for the later years. We account for this by calculating the maximum possible family allowance
rate that would occur if all pending applications were to eventually issue. This upper bound is represented
by dashed lines in Figure 2. This correction demonstrates that for the 1996-2005 cohorts, the average
family allowance rate could at most be 72.3% (as compared to the rate of 71.2% based on disposals
observed to date) and the decline in allowance rates between 1996 and 2005 is quite robust.6
Our interviews with patent experts at the USPTO suggested at least three possible explanations for the
decline. First, the financial market bust in March 2000 and the following period of tighter financial
constraints may have forced some inventors to abandon their patent applications. Second, the PTO
introduced several procedures in 2000 to augment the quality of patent prosecution (e.g., the “second pair
of eyes” system which subjected certain applications to mandatory assessment by more than one examiner
before being allowed), which may have decreased the probability of patent allowance. Finally, the
number of pending applications, first-action pendency, and total pendency all steadily increased during
the period of our study. Longer pendencies have been shown to be correlated with more abandonments,
thus lowering the observed allowance rates (Mitra-Kahn, Marco et al 2013).7 Of course, establishing the
causal effects of these and other potential influences on allowance rates is difficult, and requires
separating out the effects of changes in the USPTO from changes in the propensity of applicants to
6 The effect of censoring is more pronounced for more recent cohorts, increasing sharply after 2005, thus
validating our choice of 2005 as the cut-off year for our study. Figure A1 of the Supplementary Appendix
presents the lower and upper bounds for each of the three allowance rates for 1991 to 2010. As the
window between filing and observation shrinks, the observed allowance rates will fall to 0% and the
hypothetical maximum for each allowance rate will approach 100%.
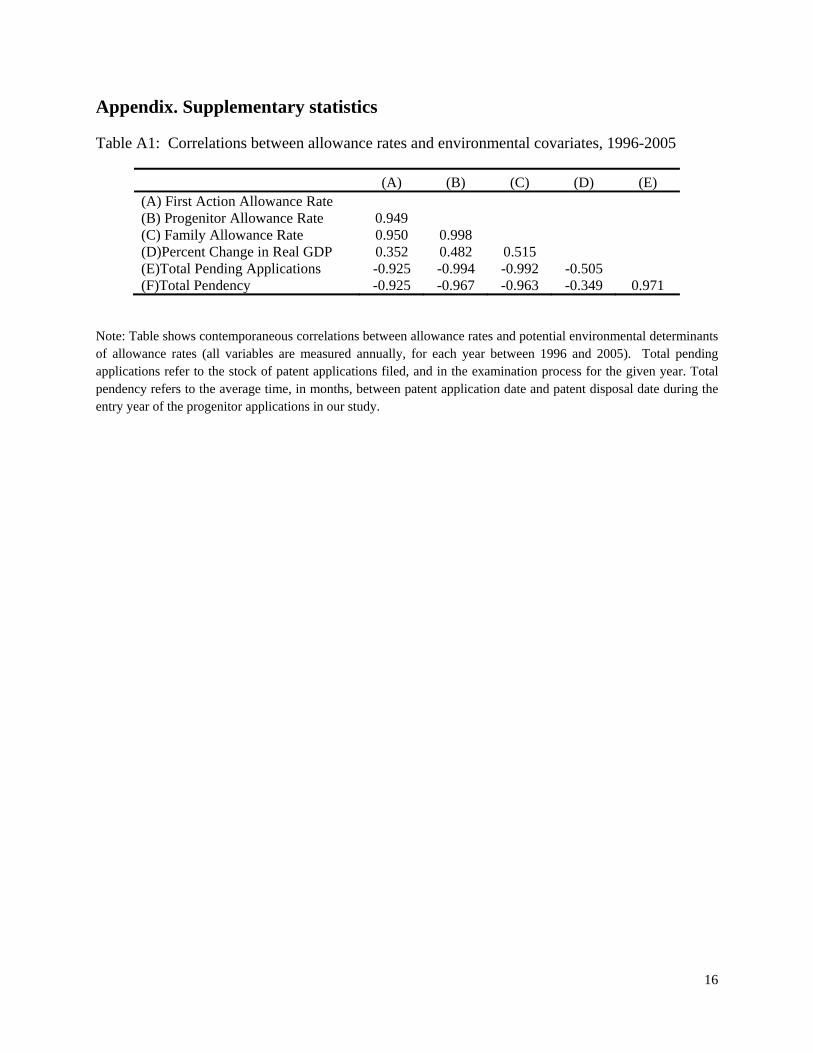
7 Table A1 of the Supplementary Appendix presents the correlation between our allowance rate measures
and the percent change in GDP from the previous year, the number of applications pending in the year of
filing and the total pendency for applications disposed in the year of filing. All three allowance rates are
strongly, negatively correlated with pendency and the number of pending applications and are
moderately, positively correlated with the percent change in GDP.
7
abandon their applications. We thus defer a careful examination of the determinants of allowance rates
for future research.
3. Allowance rates across technology fields
It is well known that patent value varies across industries (Cohen et al 2000). Inventors in discrete-
product industries, such as chemicals and pharmaceuticals, tend to use patents to preclude imitation by
rivals, while those in complex product industries such as electronics and computers amass patents to
enhance their bargaining power in cross-licensing negotiations (Hall and Ziedonis 2001). Inventors in
different industries also appear to pursue different strategies during the patent examination process,
including in their use of CONs (Hegde, et al 2008), and judicial decisions (for example, the State Street
decision in 1998 to validate patenting of business method patents, or the recent Myriad decision
invalidating patenting of DNA segments) affect the standards of patentability for some technological
fields, while leaving the standards unchanged for others.8
Figure 3 here
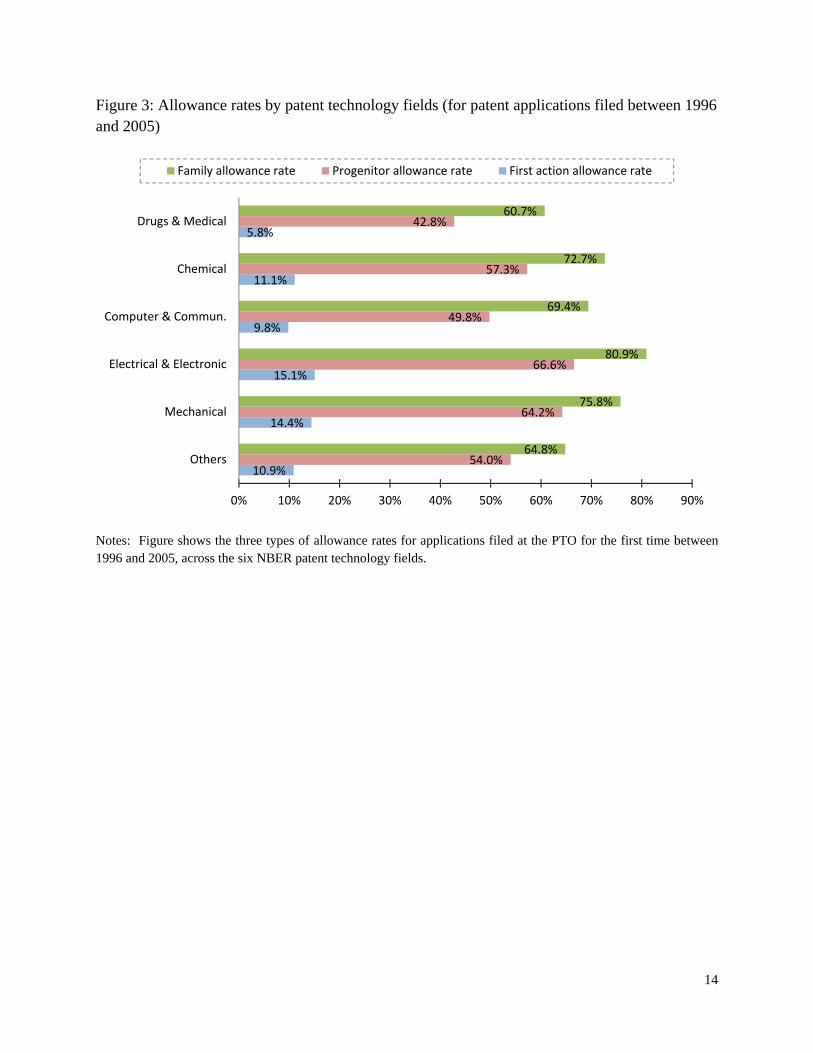
Figure 3 displays the probability of patent allowance for the patent technology categories defined by Hall,
Jaffe, and Trajtenberg (2001).9 Applications in Drugs and Medical Instruments have the lowest average
allowance rates (allowance rate of 42.8%) and applications in the Electrical and Electronics sectors enjoy
the highest allowance rates (allowance rate of 66.6%). In the Computers and Communication sector,
which includes a large majority of the controversial software and business method patents, allowance
rates are relatively lower (allowance rate of 49.8%). Applicants appear to use continuation procedures
more in the sectors with lower allowance rates (44.1% of the progenitor applications used at least one of
the continuation procedures in the Drugs and Medical sector; see Table A3 of the Supplementary
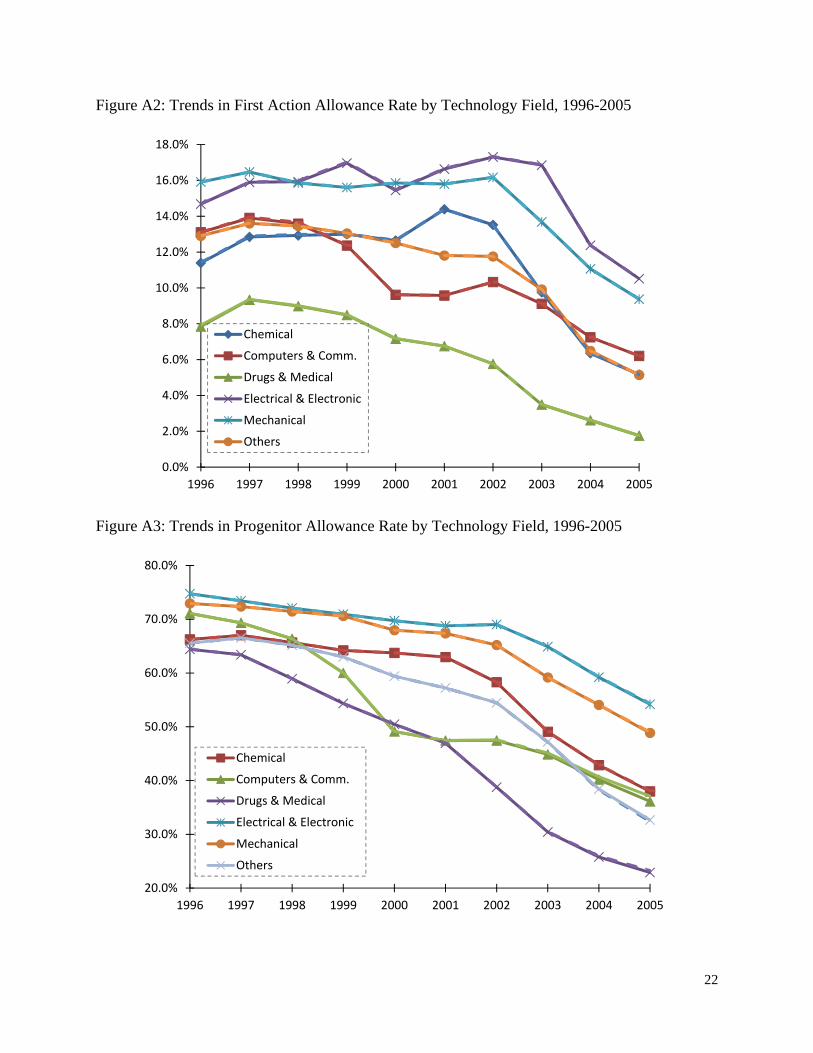
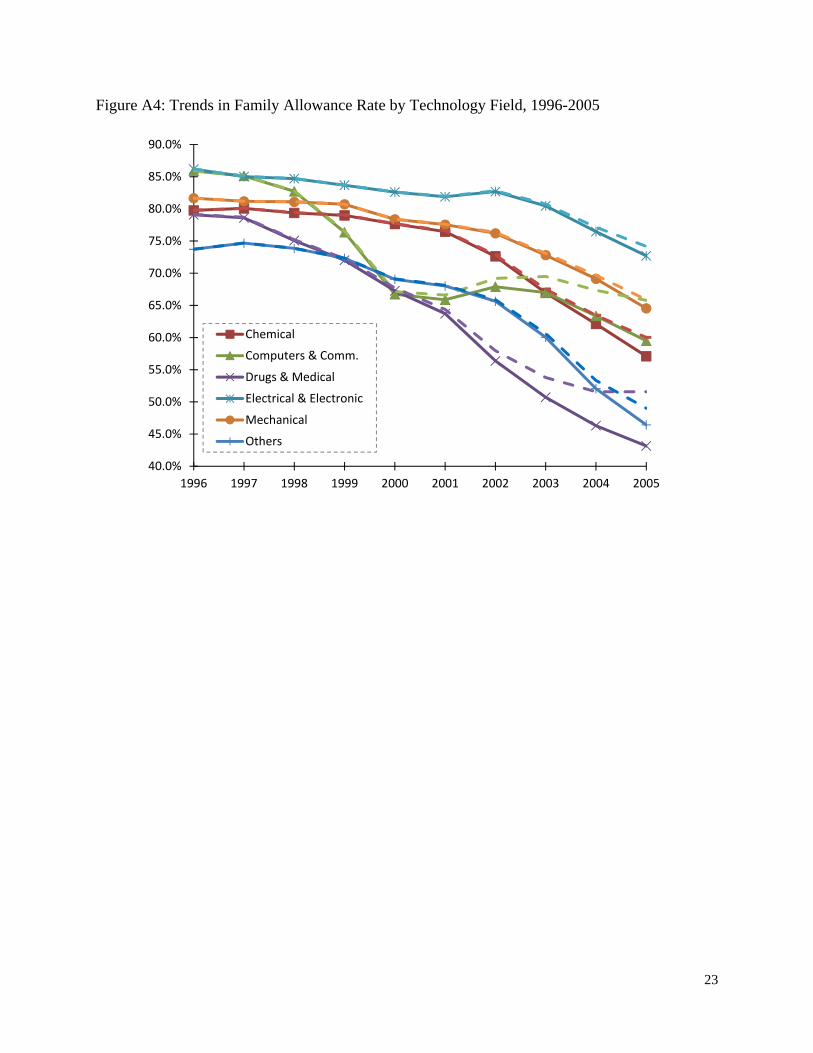
Appendix). The decline in allowance rates is particularly striking for Drugs and Medical Instrument
patents and for Computers and Communication patents (see also Graham and Vishnubhakat 2013). In
these sectors, both first-action allowance rate and progenitor allowance rates declined by more than 50%
(Figures A2-A4 of the Appendix compare sectoral trends for the three allowance rates).
8 See 149 F.3d 1368 (Fed. Cir. 1998) and 569 U.S. 12-398 (2013), respectively.
9 Hall, Jaffe, and Trajtenberg (2001) create a mapping from US Patent Classification (USPC) to six
technology categories for issued utility patent applications. The data were updated in 2006. We apply the
2006 mapping to all progenitor applications in our dataset in order to treat abandoned and issued
applications similarly. Child applications are assigned to the same technology category as the progenitor
application.
8
4. Allowance rates across inventor types
Small inventors play an important role in the US innovation system and the Office seeks to lower their
costs of patenting by charging discounted (50%-75%) examination fees.10 Like small entities, foreign
inventors may also find it difficult to access the legal resources required to enhance their chances of
receiving patents. Does the probability of patent issue differ for different applicant types? To answer this,
we identified patent applications as belonging to foreign inventors if the primary inventor on the
application was located abroad, and identified small-inventors as those that qualified for the USPTO’s
small-entity discounts. Large foreign inventors accounted for 39%, large U.S. inventors 31.1%, small
foreign inventors 9.6%, and small U.S. inventors 20.1% of our 2.15 Million progenitor applications.
Figure 4 here
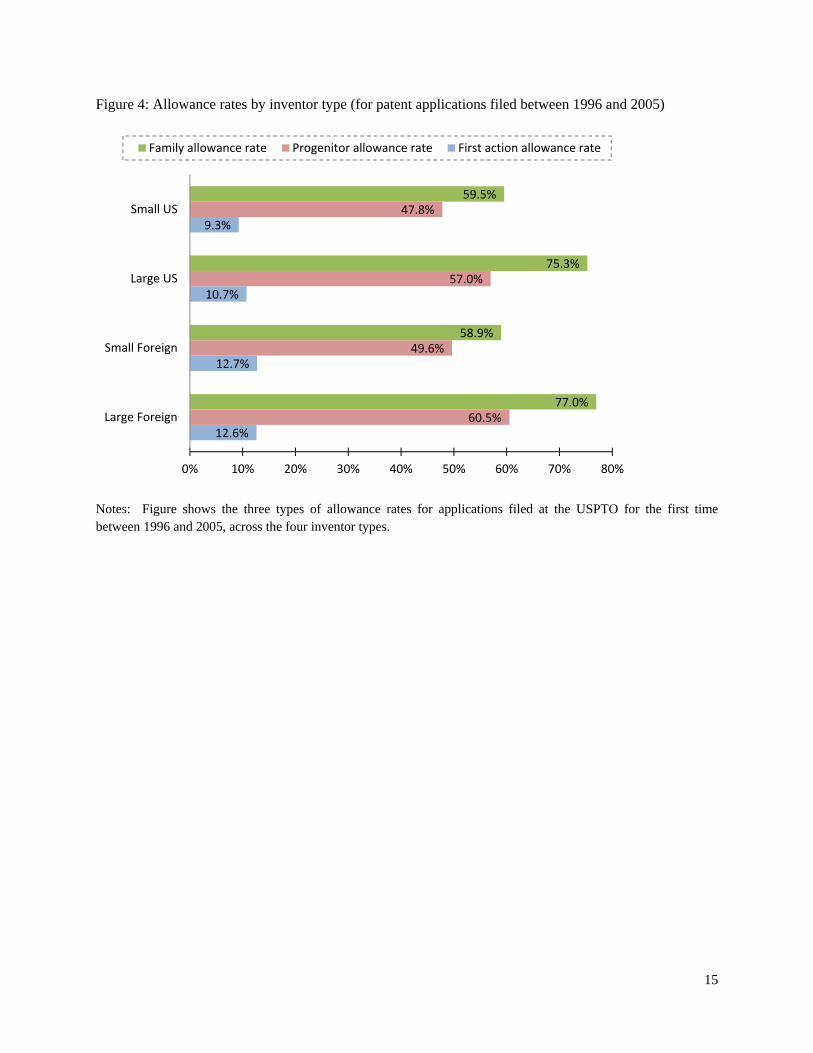
Figure 4 reveals that large foreign inventors enjoy the highest progenitor and family allowance rates
(60.5% and 77% respectively), followed by large US inventors (57% and 75.2%). US small inventors
have the lowest rates of patent allowance, particularly family allowance rates. Foreign applicants and
small inventors are less likely to use continuation applications (Table A4 of the Supplementary Appendix
reports the percentage of progenitor applications that used the different types of continuations by
applicant type). The differences in allowance rates across the different applicant types appear more
substantial in some fields (e.g. Computers and Communications) than others (Table A5 of the
Supplementary Appendix reports the allowance rates for the different applicant types across technology
fields).
These numbers should be interpreted with caution. The lower allowance rates for US small applicants
could reflect either their higher propensity to abandon their applications during the examination process,
or differences in the nature of inventions and subject matter covered by their applications. Similarly,
large foreign inventors may enjoy higher allowance rates either because they choose to seek protection in
the US for their most important inventions, or because they are more likely to have access to the legal
resources required to maximize the probability of allowance.
5. Concluding thoughts
Our analysis of progenitor applications filed between 1996 and 2005 uncovers several interesting facts
that counter conventional wisdom. We find that the first action allowance rate for patent applications is
10 USPTO fees are discounted by 50% for applicants and patentees who qualify as “Small Entities” by
having fewer than 500 employees (37 CFR 1.27). For exact patent examination fees, see:
http://www.uspto.gov/web/offices/ac/qs/ope/fee031913.htm
9
just 11.4%. Only 55.8% of progenitor applications eventually emerge as patents after several rounds of
amendments. The family allowance rate, which accounts for the use of continuation procedures by
progenitor applications, is just 71.2%. The probability of patent issue declined during the period of our
study: starting at nearly 70% for the applications filed in 1996, progenitor allowance rates declined to
40% for the 2005 cohort (even accounting for censoring issues as shown in Figure A1). Applications in
the “Drugs and Medical Instruments” fields are least likely to be successful and applications in the
“Electrical and Electronics” fields are most likely to be successful. Allowance rates declined sharply for
applications filed between 1996 and 2005 in the “Drugs and Medical Instruments” and “Computers and
Communication” fields. Allowance rates are lower across all technology sectors for small firms.
What are the implications of these findings? Many scholars have interpreted patent allowance rates,
typically incorrectly calculated, as reflecting examination quality alone, and argued that the high
allowance rates at the PTO indicate low examination quality (e.g., Quillen and Webster 2001, 2009). Our
findings challenge the conventional wisdom that the PTO allows nearly all of the applications it receives,
and rubber stamps applications without scrutiny. We also find no evidence for the claims that the PTO is
becoming more lenient in granting patents. To the extent that some inventors invest in preparing US
patent applications, based on assumptions about the probability of being successful, our findings help
correct their “priors,” and thus make more informed decisions about their investments.
Scholars in economics and management widely use the number of successful patent applications as a
proxy for the innovation intensity of firms, industries, and even nations. To the extent that at least some
of these differences are shaped by systematic differences in the probability of patent allowance across
types of inventors, technological fields, and time, as we have documented, scholars need to account for
factors underpinning these differences before drawing conclusions about the rate of innovation based on
simple counts of successful patent applications.
Our study suggests that patent allowance rates should be interpreted with caution by policy makers.
Allowance rates are the product of an “opt out” system for applicants: thus, the rates are driven not only
by the office’s rejection of applications, but applicants’ willingness to continue the prosecution of their
applications. Accordingly, the rates may reflect the influence of several variables including the
patentability of the subject matter claimed in the applications (which varies across technological fields),
the rigor of the patent examination process, the time taken for examination at the PTO, judicial decisions
about valid subject matter, and applicants’ access to the resources required to keep their applications
alive. Some of these variables could be uncorrelated with the rigor of the examination process. Hence,
economists should investigate the factors underlying the fluctuations in allowance rates, and be aware of
the infeasibility of defining an “optimal” allowance rate before recommending changes to the
10
examination system based on observed rates. Just as having a lenient process that rubber stamps
applications without scrutiny can impose costs on our innovation system, an allowance rate that is “too
low” may deter inventors, particularly those that cannot engage in costly negotiations with patent
examiners, from seeking patents, or worse still, investing in innovation.
11
References
Bessen, J. & Meurer, M.J. 2008. Patent Failure: How Judges, Bureaucrats, and Lawyers Put Innovators
at Risk (Princeton University Press, 2008).
Cohen W. M., Nelson, R.R., & Walsh J.P., 2000. Protecting Their Intellectual Assets: Appropriability
Conditions and Why US Manufacturing Firms Patent (or Not), National Bureau of Economic
Research Working Paper W7552.
Graham, S., & Vishnubhakat, S. 2013. Of Smart Phone Wars and Software Patents. Journal of Economic
Perspectives 27(1): 67-86.
Hall, B. H., Jaffe, A. B., & Trajtenberg, M. 2001. The NBER Patent Citations Data File: Lessons,
Insights), National Bureau of Economic Research Working Paper W8498.
Hall, B. H. & Ziedonis. R. 2001. The Patent Paradox Revisited: An Empirical Study of Patenting in the
US Semiconductor Industry, 1979–1995, RAND Journal of Economics, 32:1, p 101–28.
Hegde, D., Mowery, D.C. & Graham, S.J. 2009. Pioneering inventors or thicket‐builders: which firms
use continuations in patenting?, Management Science 55, 1214–1226 (2009).
Jaffe, A.B. & Lerner, J. 2004. Innovation and Its Discontents: How Our Broken Patent System is
Endangering Innovation and Progress, and What to Do About It (Princeton University Press, 2004).
Lemley, M.A. & Sampat, B.N. 2008. Is the Patent Office a Rubber Stamp? Emory Law J. 58, 415–427.
Lemley M. A. & Moore K. 2004. Ending Abuse of Patent Continuations, Boston University Law Review,
84(1), p 63-123.
Mitra-Kahn, B., Marco, A., et al., 2013, “Patent backlogs, inventories, and pendency: An international
framework,” UK IPO & PTO joint report, http://www.ipo.gov.uk/ipresearch-uspatlog-201306.pdf
National Academy of Sciences 2004 Committee on Intellectual Property Rights in the Knowledge-Based
Economy, National Research Council. A Patent System for the 21st Century, National Academies
Press, Washington, DC, 2004.
Posner, Richard. 2013. Patent Trolls. The Becker-Posner Blog, dated 07/21/2013, Accessed from
http://www.becker-posner-blog.com/2013/07/patent-trollsposner.html on 08/03/2013
Quillen, C. D. & Webster. O. H. 2001. Continuing Patent Applications and Performance of the US Patent
Office, Federal Circuit Bar Journal, 1, p 1-21.
Quillen, C. D. & Webster. O. H. 2009. Continuing Patent Applications and Performance of the US Patent
Office—One More Time, Federal Circuit Bar Journal, 18 (13), p 379-404.
12
Figures and Tables
Figure 1: The US Patent Examination Process
Notes: Figure is a simplified representation of the US patent examination process and shows the key intermediate and final outcomes, as of June 30, 2013, for the 2.15 million applications filed for the first time (“progenitor” applications) at the PTO between 1996 and 2005. The percentage indicated at each transition-state reflects the percentage of the total progenitor applications that reached the state. First-action allowance rate refers to the proportion of progenitor applications that are allowed without amendment; Progenitor allowance rate refers to the proportion of progenitor applications that were eventually allowed and patented without using continuation processes; Family allowance rate refers to the proportion of progenitor applications that produce at least one patent, including the allowances of continuation applications that emerge from the progenitors. Abandonments and allowances may not sum to 100% due to rounding.

13
Figure 2: Trends in allowance rates, 1996-2005
Notes: Figure shows trends in the three types of allowance rates for the 2.15 million applications filed at the PTO for the first time between 1996 and 2005. 18,270 of the 2.15 million applications were pending as of June 30, 2013 and the dotted lines (for the first-action allowance rate and progenitor allowance rate) represent the corresponding rates if all the pending applications are, in fact, allowed. Thus, they represent the theoretical upper-bound for the allowance rates. For progenitor applications that produced continuation applications which are still pending, we calculate the maximum possible family allowance rate for each progenitor cohort by assuming that every pending continuation application produced by the progenitors will eventually be allowed. This maximum possible family allowance rate is represented by the corresponding dashed line.
0%
10%
20%
30%
40%
50%
60%
70%
80%
90%
1996 1997 1998 1999 2000 2001 2002 2003 2004 2005
First action allowance rate
Progenitor allowance rate
Family allowance rates
14
Figure 3: Allowance rates by patent technology fields (for patent applications filed between 1996 and 2005)
Notes: Figure shows the three types of allowance rates for applications filed at the PTO for the first time between 1996 and 2005, across the six NBER patent technology fields.
10.9%
14.4%
15.1%
9.8%
11.1%
5.8%
54.0%
64.2%
66.6%
49.8%
57.3%
42.8%
64.8%
75.8%
80.9%
69.4%
72.7%
60.7%
0% 10% 20% 30% 40% 50% 60% 70% 80% 90%
Others
Mechanical
Electrical & Electronic
Computer & Commun.
Chemical
Drugs & Medical
Family allowance rate Progenitor allowance rate First action allowance rate
15
Figure 4: Allowance rates by inventor type (for patent applications filed between 1996 and 2005)
Notes: Figure shows the three types of allowance rates for applications filed at the USPTO for the first time between 1996 and 2005, across the four inventor types.
12.6%
12.7%
10.7%
9.3%
60.5%
49.6%
57.0%
47.8%
77.0%
58.9%
75.3%
59.5%
0% 10% 20% 30% 40% 50% 60% 70% 80%
Large Foreign
Small Foreign
Large US
Small US
Family allowance rate Progenitor allowance rate First action allowance rate
16
Appendix. Supplementary statistics
Table A1: Correlations between allowance rates and environmental covariates, 1996-2005
(A) (B) (C) (D) (E) (A) First Action Allowance Rate (B) Progenitor Allowance Rate 0.949 (C) Family Allowance Rate 0.950 0.998 (D)Percent Change in Real GDP 0.352 0.482 0.515 (E)Total Pending Applications -0.925 -0.994 -0.992 -0.505 (F)Total Pendency -0.925 -0.967 -0.963 -0.349 0.971
Note: Table shows contemporaneous correlations between allowance rates and potential environmental determinants of allowance rates (all variables are measured annually, for each year between 1996 and 2005). Total pending applications refer to the stock of patent applications filed, and in the examination process for the given year. Total pendency refers to the average time, in months, between patent application date and patent disposal date during the entry year of the progenitor applications in our study.
17
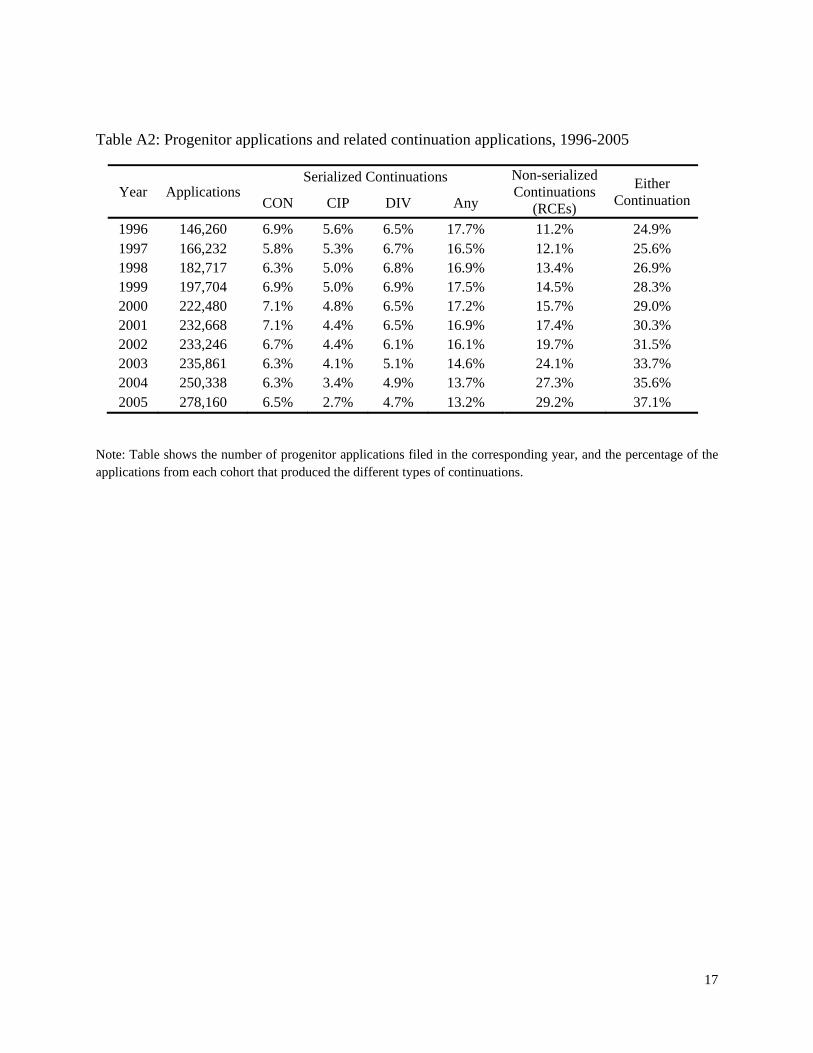
Table A2: Progenitor applications and related continuation applications, 1996-2005
Year Applications Serialized Continuations Non-serialized
Continuations (RCEs)
Either Continuation CON CIP DIV Any
1996 146,260 6.9% 5.6% 6.5% 17.7% 11.2% 24.9% 1997 166,232 5.8% 5.3% 6.7% 16.5% 12.1% 25.6% 1998 182,717 6.3% 5.0% 6.8% 16.9% 13.4% 26.9% 1999 197,704 6.9% 5.0% 6.9% 17.5% 14.5% 28.3% 2000 222,480 7.1% 4.8% 6.5% 17.2% 15.7% 29.0% 2001 232,668 7.1% 4.4% 6.5% 16.9% 17.4% 30.3% 2002 233,246 6.7% 4.4% 6.1% 16.1% 19.7% 31.5% 2003 235,861 6.3% 4.1% 5.1% 14.6% 24.1% 33.7% 2004 250,338 6.3% 3.4% 4.9% 13.7% 27.3% 35.6% 2005 278,160 6.5% 2.7% 4.7% 13.2% 29.2% 37.1%
Note: Table shows the number of progenitor applications filed in the corresponding year, and the percentage of the applications from each cohort that produced the different types of continuations.
18
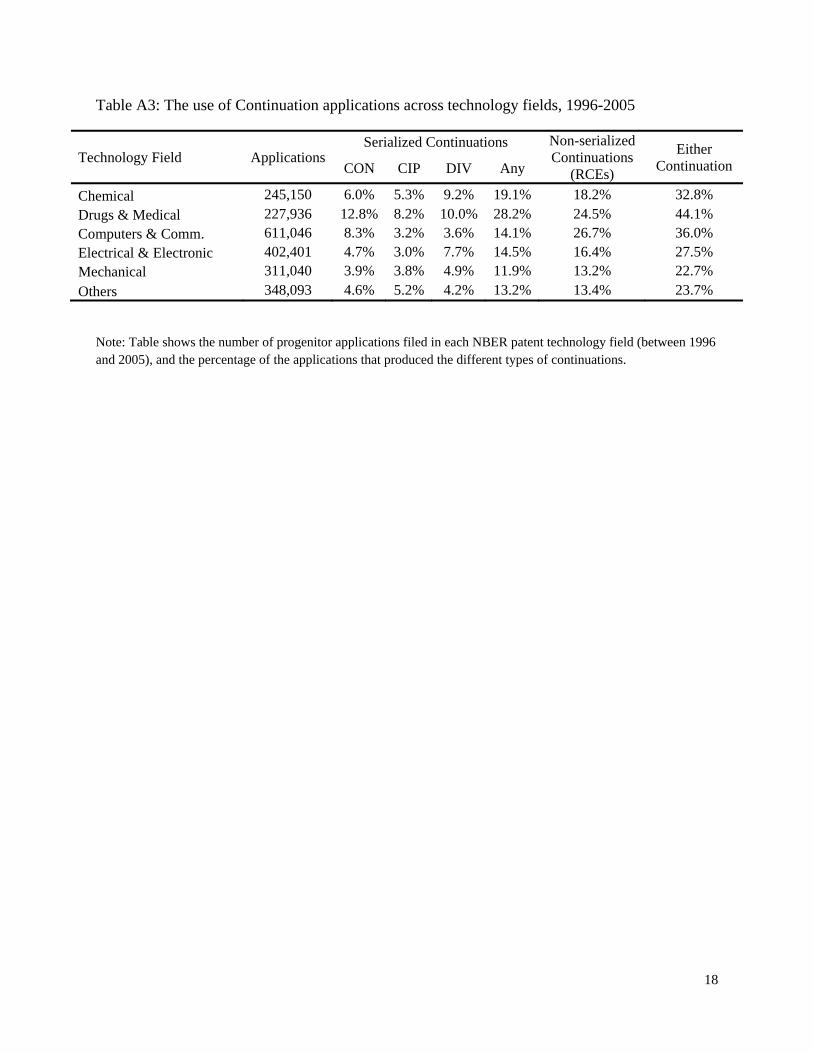
Table A3: The use of Continuation applications across technology fields, 1996-2005
Technology Field Applications Serialized Continuations Non-serialized
Continuations (RCEs)
Either Continuation CON CIP DIV Any
Chemical 245,150 6.0% 5.3% 9.2% 19.1% 18.2% 32.8%
Drugs & Medical 227,936 12.8% 8.2% 10.0% 28.2% 24.5% 44.1% Computers & Comm. 611,046 8.3% 3.2% 3.6% 14.1% 26.7% 36.0% Electrical & Electronic 402,401 4.7% 3.0% 7.7% 14.5% 16.4% 27.5% Mechanical 311,040 3.9% 3.8% 4.9% 11.9% 13.2% 22.7%
Others 348,093 4.6% 5.2% 4.2% 13.2% 13.4% 23.7%
Note: Table shows the number of progenitor applications filed in each NBER patent technology field (between 1996 and 2005), and the percentage of the applications that produced the different types of continuations.

19
Table A4: The use of Continuation applications across applicant types, 1996-2005
Applicant Type Applications Serialized Continuations Non-serialized
Continuations Either
Continuation CON CIP DIV Any
Large Foreign 838,210 4.4% 1.3% 5.9% 11.2% 21.1% 29.1% Small Foreign 207,460 3.7% 3.7% 2.9% 9.7% 12.1% 19.3% Large US 668,527 9.2% 5.2% 7.6% 20.4% 23.0% 37.6% Small US 431,469 8.2% 9.2% 5.0% 20.5% 14.3% 30.0%
Note: Table shows the number of progenitor applications filed by each applicant type (between 1996 and 2005), and the percentage of each type’s applications that produced the different types of continuations.

20
Table A5: Allowance Rates across applicant types and technology fields, 1996-2005
Technology Field Applicant Type Applications First Action Progenitor Family
Chemical
Large Foreign 112,598 11.0% 59.6% 75.4%
Large US 76,595 11.3% 57.2% 74.1%
Small Foreign 20,245 11.6% 52.9% 64.4%
Small US 35,712 9.7% 52.4% 65.8%
Computers & Commun.
Large Foreign 244,453 11.7% 54.5% 74.0%
Large US 251,253 8.9% 51.8% 74.1%
Small Foreign 32,847 9.6% 37.7% 48.9%
Small US 82,493 6.4% 34.5% 49.6%
Drugs & Medical
Large Foreign 62,142 5.3% 45.0% 63.6%
Large US 69,632 6.0% 43.1% 62.7%
Small Foreign 27,372 5.7% 39.9% 55.4%
Small US 68,790 5.6% 41.5% 58.3%
Electrical & Electronics
Large Foreign 204,125 15.5% 67.7% 83.3%
Large US 122,529 14.2% 69.3% 84.5%
Small Foreign 30,489 17.0% 57.7% 65.2%
Small US 45,258 13.1% 60.0% 71.1%
Mechanical
Large Foreign 128,328 15.1% 68.8% 82.1%
Large US 74,681 14.1% 67.2% 80.5%
Small Foreign 40,274 15.8% 56.2% 63.7%
Small US 67,757 12.0% 57.1% 65.9%
Others
Large Foreign 86,564 11.3% 60.7% 74.6%
Large US 73,837 9.9% 56.5% 71.9%
Small Foreign 56,233 13.5% 51.1% 57.7%
Small US 131,459 9.5% 49.3% 57.4%
Note: Table shows the number of progenitor applications filed in each of the six NBER patent technology fields by each applicant type (between 1996 and 2005), and the percentage of each type’s applications that produced the different types of continuations.
21
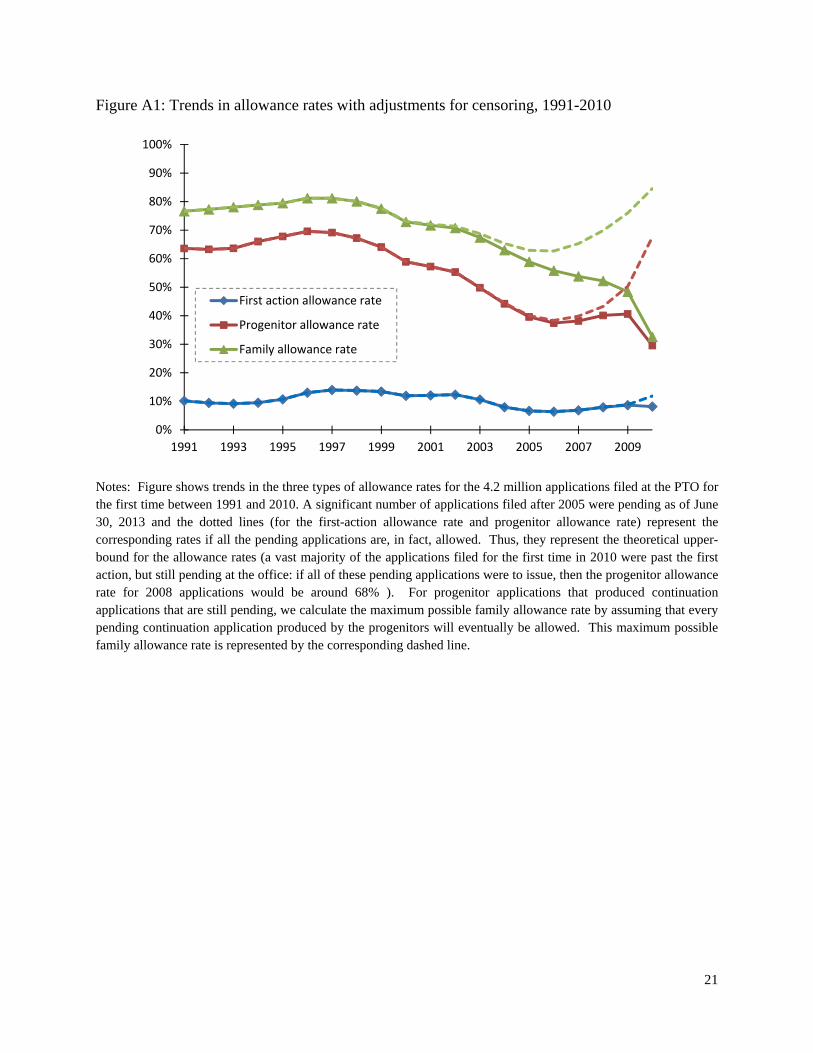
Figure A1: Trends in allowance rates with adjustments for censoring, 1991-2010
Notes: Figure shows trends in the three types of allowance rates for the 4.2 million applications filed at the PTO for the first time between 1991 and 2010. A significant number of applications filed after 2005 were pending as of June 30, 2013 and the dotted lines (for the first-action allowance rate and progenitor allowance rate) represent the corresponding rates if all the pending applications are, in fact, allowed. Thus, they represent the theoretical upper-bound for the allowance rates (a vast majority of the applications filed for the first time in 2010 were past the first action, but still pending at the office: if all of these pending applications were to issue, then the progenitor allowance rate for 2008 applications would be around 68% ). For progenitor applications that produced continuation applications that are still pending, we calculate the maximum possible family allowance rate by assuming that every pending continuation application produced by the progenitors will eventually be allowed. This maximum possible family allowance rate is represented by the corresponding dashed line.
0%
10%
20%
30%
40%
50%
60%
70%
80%
90%
100%
1991 1993 1995 1997 1999 2001 2003 2005 2007 2009
First action allowance rate
Progenitor allowance rate
Family allowance rate
22
Figure A2: Trends in First Action Allowance Rate by Technology Field, 1996-2005
Figure A3: Trends in Progenitor Allowance Rate by Technology Field, 1996-2005
0.0%
2.0%
4.0%
6.0%
8.0%
10.0%
12.0%
14.0%
16.0%
18.0%
1996 1997 1998 1999 2000 2001 2002 2003 2004 2005
Chemical
Computers & Comm.
Drugs & Medical
Electrical & Electronic
Mechanical
Others
20.0%
30.0%
40.0%
50.0%
60.0%
70.0%
80.0%
1996 1997 1998 1999 2000 2001 2002 2003 2004 2005
Chemical
Computers & Comm.
Drugs & Medical
Electrical & Electronic
Mechanical
Others
23
Figure A4: Trends in Family Allowance Rate by Technology Field, 1996-2005
40.0%
45.0%
50.0%
55.0%
60.0%
65.0%
70.0%
75.0%
80.0%
85.0%
90.0%
1996 1997 1998 1999 2000 2001 2002 2003 2004 2005
Chemical
Computers & Comm.
Drugs & Medical
Electrical & Electronic
Mechanical
Others