Embed Size (px)
Citation preview

What is the most environmentally beneficial way to
treat commercial food waste?
Supporting Information
James W. Levis* and Morton A. Barlaz
North Carolina State University, Department of Civil, Construction, and Environmental
Engineering, Campus Box 7908, Raleigh, NC 27695-7908
∗Corresponding author. Phone: (919) 515-0887; fax: (919)515-7908; email: [email protected]

Landfill Model. An estimate of the total global warming potential (GWP), SOx, NOx and net
energy attributable to the disposal of materials in a landfill requires consideration of landfill
construction, operations, final cover placement, gas and leachate management, and long-term
maintenance and monitoring (Eq. 1).
Eq. 1
Each of the terms in Eq. 1 are in mass units (kg). GHG emissions associated with all aspects of
the landfill except gas management have been shown to be small relative to emissions associated
with gas management. As such, the emissions for landfill construction, operations, final cover
placement, leachate management and long-term maintenance were adopted from Camobreco et
al., 199921 and are shown in Table S1. The GHG emissions and sinks associated with gas
management and the storage of biogenic carbon were developed in this study with carbon storage
factors adopted from Staley and Barlaz, 2009.22
Landfill gas generation was modeled using a first order decay model as in the EPA’s
LandGEM model.23 The decay rate (k) is dependent on climate and landfill operation strategy
(traditional vs. bioreactor). In contrast to LandGEM,23 in which MSW is treated as one substrate,
the k and methane yield (L0) for food waste and branches were modeled separately to study the
influence of biodegradability on methane generation and subsequent collection and emissions.
Component-specific decay rates for food waste and branches were calculated as described in De
la Cruz and Barlaz, 2010.25 Calculation of component-specific decay rates requires specification
of a bulk MSW decay rate, which was 0.04 for the traditional landfills as 0.12 for the bioreactor
landfill.
For waste in landfills that utilize the methane beneficially, it was necessary to estimate the
period over which there was sufficient gas to operate energy recovery equipment. First, it was
assumed that all recovered methane is converted to electrical energy although in practice some
gas is used directly in industrial boilers along with other beneficial uses. Second, it was assumed
that landfills could only generate electricity while the gas flow rate was above 0.236 m3 s-1 (500
ft3 min-1) at 50% methane. For both landfill categories, the length of time that the landfill gas
flow was above this threshold was determined by modeling methane generation for a 2100 Mg
day-1 landfill that accepted waste for 40 years. This resulted in a threshold of 76 years for the
traditional landfill and 39 years for the bioreactor landfill. All calculations were based on a 100
year time horizon at which point, food waste and branches will have produced 100 and 78% of
their methane in the traditional landfill and 100 and 99% of their methane in a bioreactor. For
landfills that utilize the gas for energy, the gas produced at a rate lower than the aforementioned
threshold was assumed to be flared between the threshold year and year 100.
Landfill gas collection systems are placed based on the age of the landfill cell. This means that
waste buried earlier in the cell’s life will be under gas collection for less time than waste buried
later in the cell’s life. It is therefore necessary to temporally average the collection efficiency for
each year of cell operation. Gas collection schemes were based on the assumption that a typical
cell life is 5 years and that no gas collection is in place for the first two years of cell operation (6
mo for bioreactors). Further, the collection efficiency prior to cell closure and intermediate cover
installation is 50% (i.e., years 3 to 5, or 0.5 to 3 yr for a bioreactor). After cell closure at the end
of year 5, the collection efficiency is assumed to be 75%. It is further assumed that 10 years after
final waste placement (i.e., 15 years after initial waste placement), a final cover is put in place
and the gas collection efficiency increases from 75% to 95%. All of the gas collection system
default values can be varied in the model.
Some fraction of the uncollected methane is oxidized to CO2 as it passes through the landfill
cover. Ten percent oxidation was assumed as recommended in the U.S. EPA’s AP-42 database26
and as used in the U.S. GHG inventory.24 This value is likely conservative as other studies
estimate methane oxidation of 22 to 55%.27
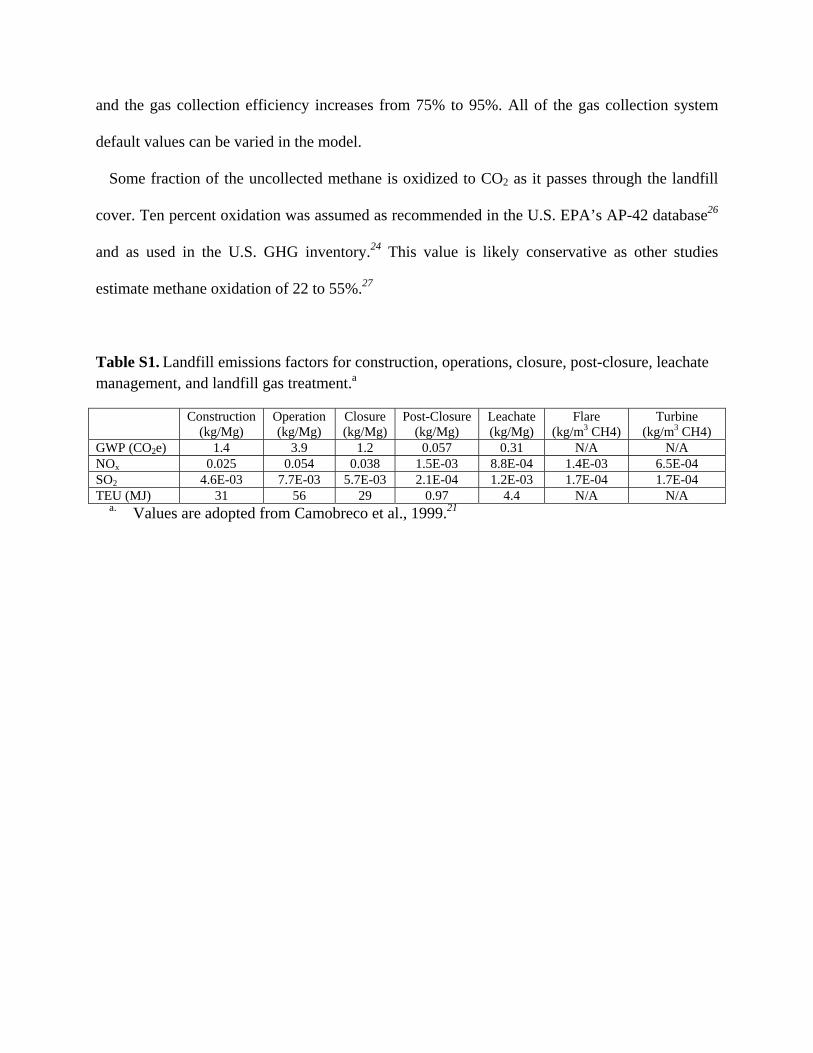
Table S1. Landfill emissions factors for construction, operations, closure, post-closure, leachate management, and landfill gas treatment.a
Construction
(kg/Mg) Operation (kg/Mg)
Closure (kg/Mg)
Post-Closure (kg/Mg)
Leachate (kg/Mg)
Flare (kg/m3 CH4)
Turbine (kg/m3 CH4)
GWP (CO2e) 1.4 3.9 1.2 0.057 0.31 N/A N/A NOx 0.025 0.054 0.038 1.5E-03 8.8E-04 1.4E-03 6.5E-04 SO2 4.6E-03 7.7E-03 5.7E-03 2.1E-04 1.2E-03 1.7E-04 1.7E-04 TEU (MJ) 31 56 29 0.97 4.4 N/A N/A
a. Values are adopted from Camobreco et al., 1999.21
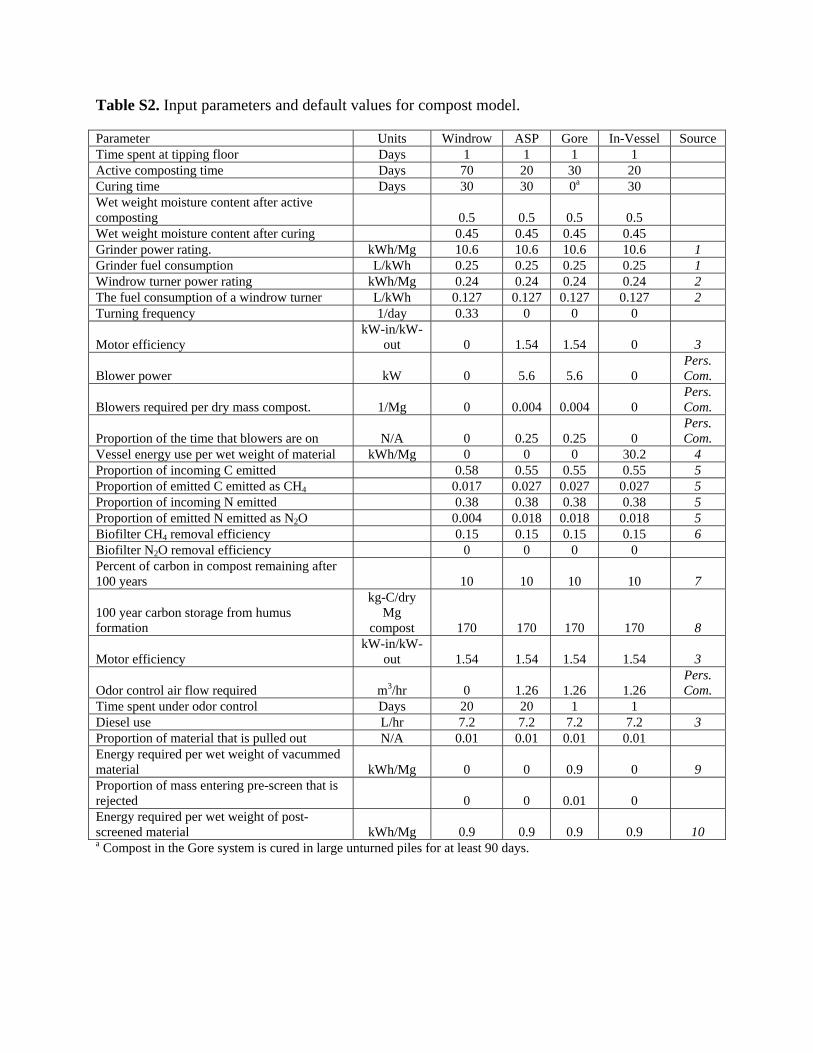
Table S2. Input parameters and default values for compost model.
Parameter Units Windrow ASP Gore In-Vessel Source Time spent at tipping floor Days 1 1 1 1 Active composting time Days 70 20 30 20 Curing time Days 30 30 0a 30 Wet weight moisture content after active composting 0.5 0.5 0.5 0.5 Wet weight moisture content after curing 0.45 0.45 0.45 0.45 Grinder power rating. kWh/Mg 10.6 10.6 10.6 10.6 1 Grinder fuel consumption L/kWh 0.25 0.25 0.25 0.25 1 Windrow turner power rating kWh/Mg 0.24 0.24 0.24 0.24 2 The fuel consumption of a windrow turner L/kWh 0.127 0.127 0.127 0.127 2 Turning frequency 1/day 0.33 0 0 0
Motor efficiency kW-in/kW-
out 0 1.54 1.54 0 3
Blower power kW 0 5.6 5.6 0 Pers. Com.
Blowers required per dry mass compost. 1/Mg 0 0.004 0.004 0 Pers. Com.
Proportion of the time that blowers are on N/A 0 0.25 0.25 0 Pers. Com.
Vessel energy use per wet weight of material kWh/Mg 0 0 0 30.2 4 Proportion of incoming C emitted 0.58 0.55 0.55 0.55 5 Proportion of emitted C emitted as CH4 0.017 0.027 0.027 0.027 5 Proportion of incoming N emitted 0.38 0.38 0.38 0.38 5 Proportion of emitted N emitted as N2O 0.004 0.018 0.018 0.018 5 Biofilter CH4 removal efficiency 0.15 0.15 0.15 0.15 6 Biofilter N2O removal efficiency 0 0 0 0 Percent of carbon in compost remaining after 100 years 10 10 10 10 7
100 year carbon storage from humus formation
kg-C/dry Mg
compost 170 170 170 170 8
Motor efficiency kW-in/kW-
out 1.54 1.54 1.54 1.54 3
Odor control air flow required m3/hr 0 1.26 1.26 1.26 Pers. Com.
Time spent under odor control Days 20 20 1 1 Diesel use L/hr 7.2 7.2 7.2 7.2 3 Proportion of material that is pulled out N/A 0.01 0.01 0.01 0.01 Energy required per wet weight of vacummed material kWh/Mg 0 0 0.9 0 9 Proportion of mass entering pre-screen that is rejected 0 0 0.01 0 Energy required per wet weight of post-screened material kWh/Mg 0.9 0.9 0.9 0.9 10 a Compost in the Gore system is cured in large unturned piles for at least 90 days.
Table S2 (continued). Input parameters and default values for compost model.
Parameter Units Windrow ASP Gore In-Vessel Source Proportion of mass entering post-screen that is rejected. 0.2 0.2 0.2 0.2 Actual payload of dump trucks filled with screen rejects Mg 18 18 18 18 Empty return of screen reject truck disposal 0/1 1 1 1 1 Frequency of turning during curing phase 1/day 0 0.14 0 0.32
Pers. Com.
Front end loader energy required per wet weight flow of material MJ/Mg 1.20 1.20 1.20 1.20 11 Front end loader specific fuel consumption L/kWh 0.26 0.26 0.26 0.26 12 Office Area required per ton per day of material
m2 /Mgpd 7.03E-03 7.03E-03 7.03E-03 7.03E-03 11
Energy required to power an office kWh/ m2-yr 321 321 321 321 13
Percent phosphorus of dry final compost. % 5.60E-03 5.60E-03 5.60E-03 5.60E-03 5 Percent nitrogen of dry final compost. % 1.85E-02 1.85E-02 1.85E-02 1.85E-02 5 Percent potassium of dry final compost. % 1.32E-02 1.32E-02 1.32E-02 1.32E-02 5 Mineral fertilizer equivalent for nitrogen 0.4 0.4 0.4 0.4 5 Mineral fertilizer equivalent for phosphorus 1.0 1.0 1.0 1.0 5 Mineral fertilizer equivalent for potassium. 1.0 1.0 1.0 1.0 5 Ratio of compost required to meet P demand to N demand.
1.0
1.0
1.0
1.0 14
Ratio of compost required to meet K demand to N demand. 0.74 0.74 0.74 0.74 14 Volumetric peat replacement factor 1 1 1 1 5 Density of peat kg/m3 200 200 200 200 5 General equipment fuel consumption. L/kWh 0.26 0.26 0.26 0.26 12

Table S3. Input parameters and default values for AD model.
Parameter Units Value Source Daily operating hours hours 8 Annual operating days days 260 Specific electricity usage. kWh/Mg 50 15 Food waste moisture content. 0.7 16 Yard waste moisture content. 0.5 16 Carbon content of yard waste % 48.1 16 Nitrogen content of yard waste % 0.1 16 Reactor moisture content. 0.75 Digestate moisture content after dewatering 0.5 Nitrogen content of digestate kg-N/dry Mg 35 17 Finished compost moisture content. 0.45 Proportion of incoming waste that is screened out. 0.1 Proportion of food waste in pre-screened mass. 0.1 Density of final compost kg/m3 700 18 Ultimate yield of food waste L/dry kg 300 19 Proportion of methane in biogas. N/A 0.6 15
Heat rate for electrical energy generation. MJ/kWh 12.2 Pers. Com.
Proportion of gas that is flared w/out electricity generation. 0.05 Methane destruction efficiency 1 Percent of carbon in compost remaining after 100 years % 10 7
100 year carbon storage from humus formation kg-C/dry Mg
compost 170 8 Front end loader use per facility capacity. kWh/Mgd 1.2 11 Front end loader specific fuel consumption. L/kWh 0.26 12 Screen specific electricity consumption. kWh/kg 0.0009 10 Proportion of material remaining after post-screening 0.98 Office Area required per ton per day of material M2/Mgd 0.007 11 Energy required to power an office kWh/m2 321.1 13 Tub grinder power rating. kWh/Mg 10.6 1 Tub grinder fuel consumption L/kWh 0.25 1 Retention time in windrows Days 30 Windrow turner energy required per ton of compost kWh/Mg 0.24 2 The fuel consumption of a windrow turner L/kWh 0.13 2 Turning frequency 1/day 0.5

Table S3 (continued). Input parameters and default values for AD model.
Parameter Units Value Source Leachate density kg/L 1 20 Mass of sludge per BOD removed. kg sludge/kg BOD 0.5 20 Electricity used per pound of BOD removed. kWh/kg 0.992 20 Amount of BOD in leachate kg/L 0.001 15 BOD removal efficiency. 0.92 13 Mass of biomass CO2 emitted per pound of BOD removed kg CO2/kg BOD 3.6 20 Haul distance to treatment facility. km 24.1 20 Empty return from treatment facility. 0/1 1 20 Percent phosphorus of dry final compost. % 0.0056 5 Percent nitrogen of dry final compost. % 0.0185 5 Percent potassium of dry final compost. % 0.0132 5 Mineral fertilizer equivalent for nitrogen 0.4 5 Mineral fertilizer equivalent for phosphorous 1 5 Mineral fertilizer equivalent for potassium 1 5 Ratio of compost required to meet P demand to N demand. 1.0 14 Ratio of compost required to meet K demand to N demand. 0.74 14 Aerobic activity left in digestate 0.25 Proportion of incoming C emitted 0.58 5 Proportion of emitted C emitted as CH4 0.017 5 Proportion of incoming N emitted 0.38 5 Proportion of emitted N emitted as N2O 0.004 5 Biofilter CH4 removal efficiency 0.15 6 Biofilter N2O removal efficiency 0 Haul distance to the landfill. km 32.2 Empty return from landfill. 0/1 1 General equipment fuel consumption. L/kWh 0.26 12 Volumetric peat replacement factor 1 18 Density of peat kg/m3 200 18

Table S4. Windrow composting process emissionsa
Emission
Yard Waste
Shredding
Active Windrow Turning
Screen and Reject Mngt Curing
Front End Loaders
Biodegradation
GWP (kg CO2e) 4.9 5.2 -7.4 0.42 1.5 83 SO2 (kg) 0.0028 0.0018 0.0033 1.5E-04 3.6E-04 0 NOx (kg) 0.026 0.028 0.0022 0.0023 0.0081 0 TEU (MJ) 65 38 8.1 3 6.6 0
Emission Electricity
Use Peat
Offset Fertilizer
Offset
Soil Carbon Storage
Gross Emissions Peat Net Fertilizer Net
GWP (kg CO2e) 0.019 -143 -17 -219 87.5 -275 -148 SO2 (kg) 1.45E-04 -0.0056 -0.029 0 0.009 0.0029 -0.0201 NOx (kg) 6.8E-05 -0.10 -0.032 0 0.067 -0.033 0.035 TEU (MJ) 0.31 -185 -152 0 121 -64 -30.8 a. The net emissions include either peat or fertilizer as the beneficial use of compost, but not both. Hence, two results are presented.

Table S5. ASP composting process emissionsa
Emission Yard Waste Shredding
Electricity Use
Screen and Reject
Mngt Curing Front End Loaders Biodegradation
GWP (kg CO2e) 4.9 24 -7.4 0.42 1.5 142 SO2 (kg) 0.0028 0.18 0.0033 1.5E-04 3.6E-04 0 NOx (kg) 0.026 0.086 0.0022 0.0023 0.0081 0 TEU (MJ) 65 397 8.1 3 6.6 0
Emission Peat Offset Fertilizer
Offset
Soil Carbon Storage
Gross Emissions Peat Net Fertilizer Net
GWP (kg CO2e) -143 -17 -222 166 -199 -73 SO2 (kg) -0.0056 -0.029 0 0.19 0.18 0.16 NOx (kg) -0.10 -0.032 0 0.13 0.026 0.094 TEU (MJ) -185 -152 0 480 295 328 a. The net emissions include either peat or fertilizer as the beneficial use of compost, but not both. Hence, two results are presented.

Table S6. Gore composting process emissionsa
Emission
Yard Waste
Shredding Electricity
Use Screen and
Reject Mngt Front End Loaders Biodegradation
GWP (kg CO2e) 4.9 3.7 -17 1.5 142 SO2 (kg) 0.0028 0.028 0.011 3.6E-04 0 NOx (kg) 0.026 0.013 0.007 0.0081 0 TEU (MJ) 65 61 26 6.6 0
Emission Peat
Offset Fertilizer
Offset Soil Carbon
Storage Gross
Emissions Peat Net Fertilizer
Net GWP (kg CO2e) -142 -17 -220 134.9 -228 -102 SO2 (kg) -0.0055 -0.028 0 0.042 0.036 0.013 NOx (kg) -0.099 -0.032 0 0.055 -0.044 0.023 TEU (MJ) -184 -151 0 159 -25 8 a. The net emissions include either peat or fertilizer as the beneficial use of compost, but not both. Hence, two results are presented.

Table S7. In-Vessel composting process emissionsa
Emission
Yard Waste
Shredding Electricity
Use
Screen and Reject
Management Curing Front End Loaders Biodegradation
GWP (kg CO2e) 4.9 33 -7.4 0.97 1.5 142 SO2 (kg) 0.0028 0.25 0.0033 3.4E-04 3.6E-04 0 NOx (kg) 0.026 0.12 0.0022 0.0052 0.0081 0 TEU (MJ) 65 541 8.1 7 6.6 0
Emission Peat
Offset Fertilizer
Offset Soil Carbon
Storage Gross
Emissions Peat Net
Emissions Fertilizer Net
Emissions GWP (kg CO2e) -143 -17 -222 175 -190 -64 SO2 (kg) -0.0056 -0.029 0 0.25 0.25 0.22 NOx (kg) -0.100 -0.032 0 0.16 0.060 0.13 TEU (MJ) -185 -152 0 628 443 476 a. The net emissions include either peat or fertilizer as the beneficial use of compost, but not both. Hence, two results are presented.

Table S8. AD process emissionsa
Front End Loader
Yard Waste
ShreddingWindrow
Turner Electricity
Use Post-
screening Office Leachate Transport
Leachate Treatment
Landfill Transport
GWP (kg CO2e) 8.1 4.9 1.6 31.1 0.29 0.006
0.47 0.22 0.63 SO2 (kg) 0.0047 0.0028 0.0010 0.0022 0.0022 4.2E-05 5.4E-04 0.0016 7.2E-04 NOx (kg) 0.044 0.026 0.0089 0.0011 0.0010 2.0E-05 0.0016 0.0008 0.0021 TEU (MJ) 112 65 23 332 4.8 0.09 5.8 3.5 7.8
Landfill Curing Biogas
Combustion Soil
Storage Gross
Emissions Elec. Offset
Fertilizer Offset
Peat Offset
Fertilizer Net
Peat Net
GWP (kg CO2e) 3.6 3.5 0.00 -218 -164 -214 -17 -143 -395 -521 SO2 (kg) 0.0025 0 0.01 0 0.032 -1.6 -0.028 -5.5E-03 -1.6 -1.5 NOx (kg) 0.013 0 0.11 0 0.21 -0.76 -0.032 -0.099 -0.59 -0.65 TEU (MJ) 27 0 0.00 0 581 -2660 -151 -184 -2230 -2260 a. The net emissions include either peat or fertilizer as the beneficial use of compost, but not both. Hence, two results are presented.

Figure S1. Mass flow diagram for composting processes. All weights are wet mass.
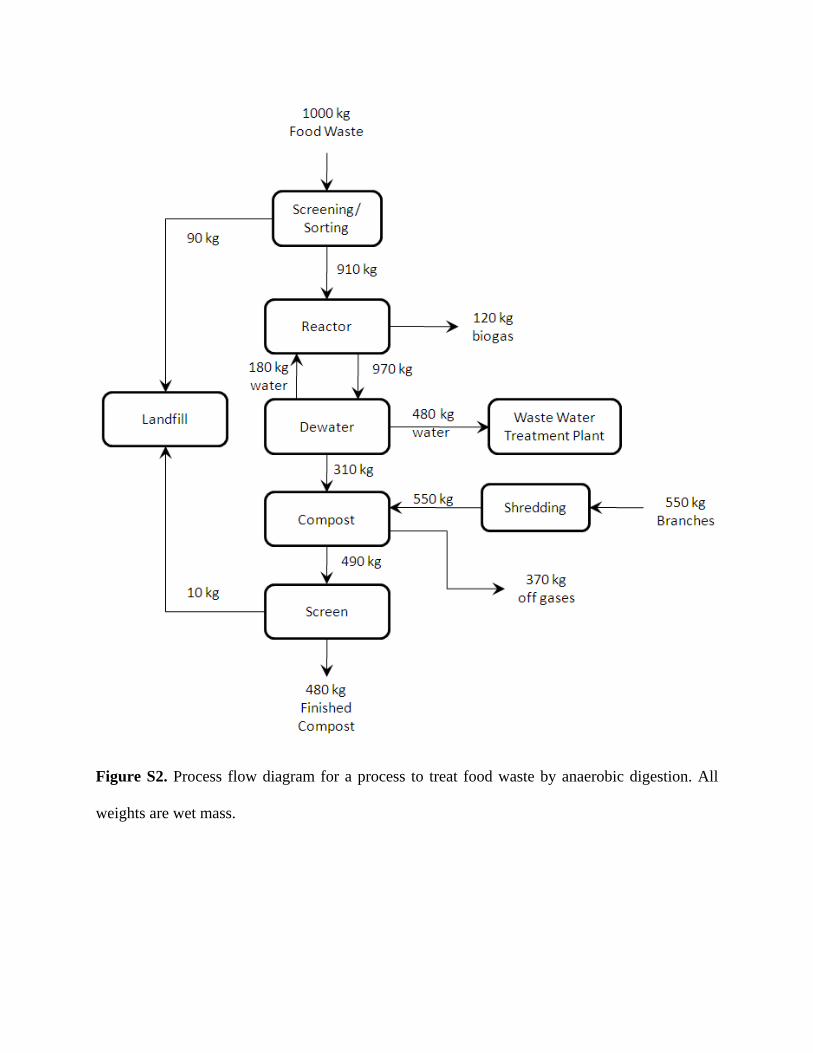
Figure S2. Process flow diagram for a process to treat food waste by anaerobic digestion. All
weights are wet mass.

Figure S3. Sensitivity results for SO2 from composting alternatives. The x-axis shows percent
distance between the minimum and maximum values for each parameter (Table 4). MC:
moisture content, %N in FC is the nitrogen content of the final compost product. The MFE for
nitrogen was also tested. The line was directly under the %N in FC line because both control the
same offset mechanism and were varied by the same relative amount.

Figure S4. Sensitivity results for NOx from composting alternatives. The x-axis shows percent
distance between the minimum and maximum values for each parameter (Table 4). MC:
moisture content, %N in FC is the nitrogen content of the final compost product. The MFE for
nitrogen was also tested. The line was directly under the %N in FC line because both control the
same offset mechanism and were varied by the same relative amount.

Figure S5. Sensitivity results for TEU from composting alternatives. The x-axis shows percent
distance between the minimum and maximum values for each parameter (Table 4). MC:
moisture content, %N in FC is the nitrogen content of the final compost product. The MFE for
nitrogen was also tested. The line was directly under the %N in FC line because both control the
same offset mechanism and were varied by the same relative amount.
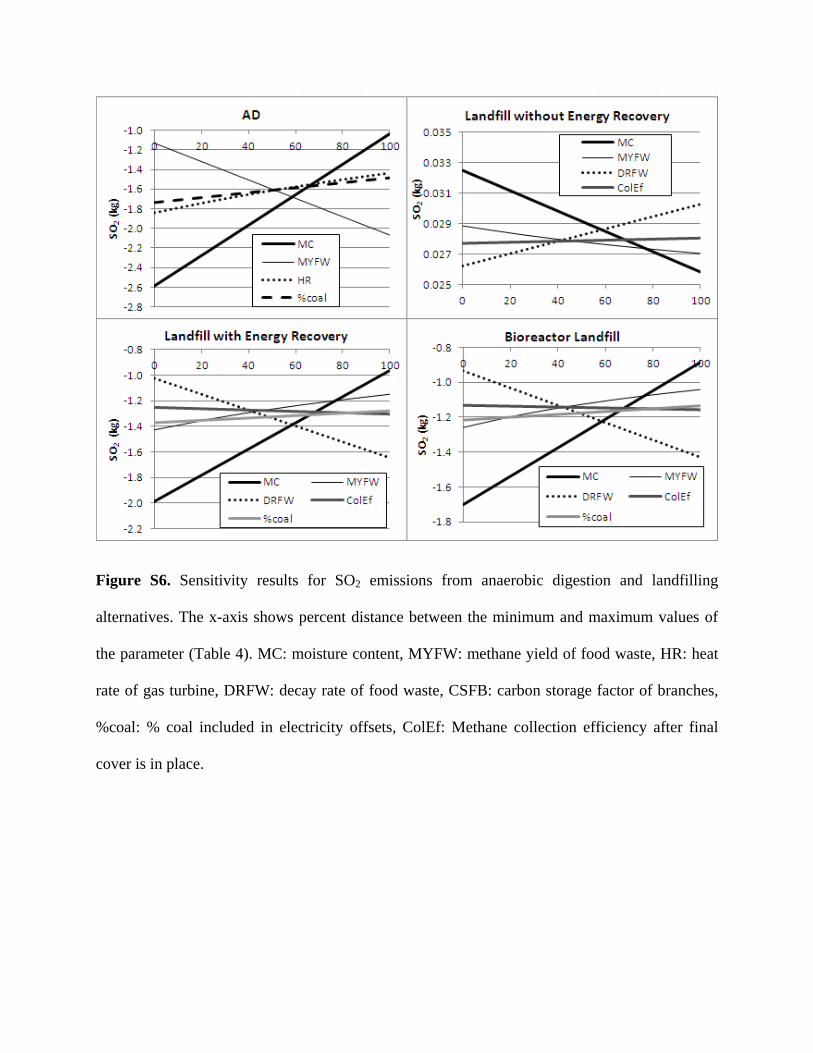
Figure S6. Sensitivity results for SO2 emissions from anaerobic digestion and landfilling
alternatives. The x-axis shows percent distance between the minimum and maximum values of
the parameter (Table 4). MC: moisture content, MYFW: methane yield of food waste, HR: heat
rate of gas turbine, DRFW: decay rate of food waste, CSFB: carbon storage factor of branches,
%coal: % coal included in electricity offsets, ColEf: Methane collection efficiency after final
cover is in place.
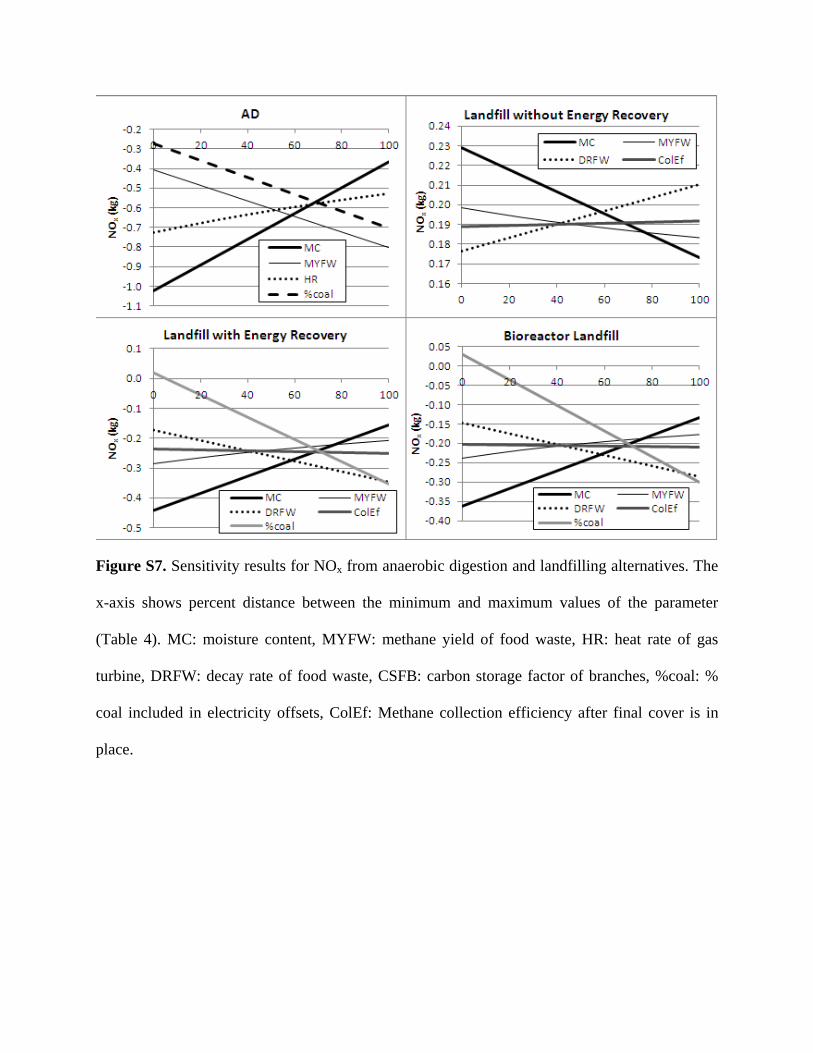
Figure S7. Sensitivity results for NOx from anaerobic digestion and landfilling alternatives. The
x-axis shows percent distance between the minimum and maximum values of the parameter
(Table 4). MC: moisture content, MYFW: methane yield of food waste, HR: heat rate of gas
turbine, DRFW: decay rate of food waste, CSFB: carbon storage factor of branches, %coal: %
coal included in electricity offsets, ColEf: Methane collection efficiency after final cover is in
place.
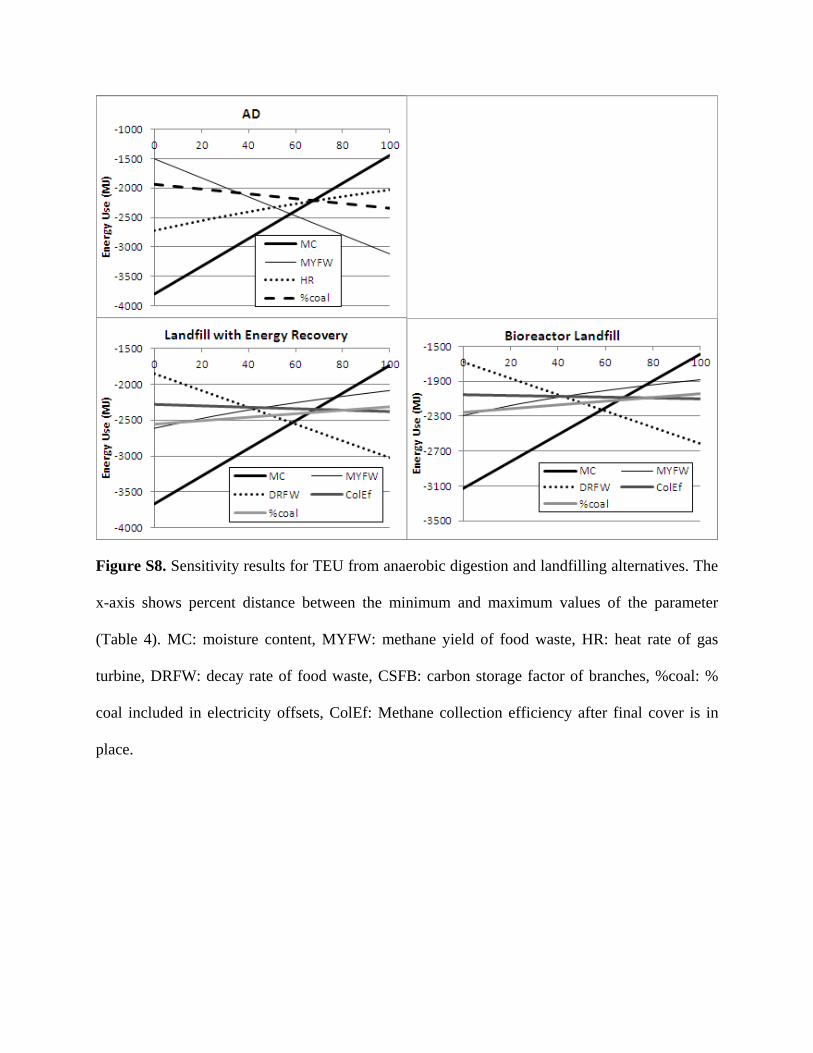
Figure S8. Sensitivity results for TEU from anaerobic digestion and landfilling alternatives. The
x-axis shows percent distance between the minimum and maximum values of the parameter
(Table 4). MC: moisture content, MYFW: methane yield of food waste, HR: heat rate of gas
turbine, DRFW: decay rate of food waste, CSFB: carbon storage factor of branches, %coal: %
coal included in electricity offsets, ColEf: Methane collection efficiency after final cover is in
place.

(1) Diamond Z Manufacturing Horizontal Grinder Sales Literature.
http://www.diamondz.com/index.php?id=52 Accessed November 11, 2007.
(2) Backhaus Ecoengineers Windrow Turners Sales Literature
http://www.backhus.com/index.php?id=31&L=1&tx_abdownloads_pi1[action]=getviewclick
eddownload&tx_abdownloads_pi1[uid]=10&cHash=6225a1805d March 26, 2008.
(3) New York Blower Co. Series 20 General Industrial Blower sales literature.
http://www.nyb.com/Catalog/Bulletins/251.pdf March 26, 2008.
(4) Wright Environmental Management In-Vessel Composting System Specifications Retrieved
from http://www.wrightenvironmental.com/index_nonflash.html Accessed April 18,2008.
(5) Boldrin, A.; Andersen, J.K.; Moller, J.; Christensen, T.H.; Favoino, E. Composting and
compost utilization: accounting of greenhouse gases and global warming contributions Waste
Manage. Res., 2009, 27 (8), 800-812.
(6) Amlinger, F.; Peyr, S.; and Cuhls, C. Greenhouse gas emissions from composting and
mechanical biological treatment Waste Manage. Res., 2008, 26 (1) 47-60.
(7) Bruun, S.; Hansen, T.L.; Christensen, T.H.; Magid, J.; Jensen, L.S. Application of processed
organic municipal solid waste on agricultural land: a scenario analysis. Environ. Model.
Assess., 2006, 11, 251-265.
(8) U.S. Environmental Protection Agency. Solid Waste Management and Greenhouse Gases,
EPA 530-R-02-006, Office of Solid Waste and Emergency Response, Washington, D.C.,
2006.

(9) Airlift AL2000D compost vacuum specs. Retrieved from
http://www.airliftseparator.com/models/al200d/ Accessed on 3 August 2010.
(10) Diaz, L.F.; Savage, G.; Golueke, G. Resource Recovery from Municipal Solid Wastes:
Volume 1, Primary Processing, CRC Press, Inc., Boca Raton, FL, 1982.
(11) Komilis, D.P.; Ham, R.K. Life-Cycle inventory of municipal solid waste and yard waste
windrow composting in the United Stated. J. Environ. Eng., 2004, 130 (11), 1390-1400.
(12) U.S. Environmental Protection Agency. Exhaust and crankcase emission factors for
nonroad engine modeling - compression-ignition, EPA420-P-04-009, Office of Air and
Radiation, Washington, D.C. 2004.
(13) U.S. Department of Energy. Commercial Buildings Energy Consumption and Expenditures
1992, Energy Information Administration, DOE/EIA-0318(92)/2, Department of Energy,
Washington, D.C. 1995.
(14) Levis, J. W. A life-cycle analysis of alternatives for the management of waste hot-mix asphalt,
commercial food waste, and construction and demolition waste. Master’s Thesis, Raleigh, North
Carolina: Department of Civil, Construction and Environmental Engineering, North Carolina State
University, 2008.
(15) DRANCO Brecht II DRANCO – Anaerobic Digestion Facility (Belgium) Retrieved from
http://cd12.lacity.org/pdf/Landfilling_Resources_OWS_Brecht_II_Dranco.pdf Accessed 3
August 2010.
(16) Tchobanoglous, G.; Theisen, H.; and Vigil, S. Integrated Solid Waste Management:
Engineering Principles and Management Issues. McGraw-Hill, Inc., New York, 1993.

(17) Hansen, T.L.; Gurbakhash, B.S.; Christensen, T.H. (2006) Life cycle modelling of
environmental impacts of application of processed organic municipal solid waste on
agricultural land (EASEWASTE). Waste Manage. Res., 2006, 24 (2) 153-166.
(18) Boldrin, A.; Hartling, K.R.; Laugen, M.; Christensen, T.H. Environmental inventory
modelling of the use of compost and peat in growth media, Resour. Conserv. Recycl., 2010,
54 (10), 1250-1260.
(19) Eleazer, W.E,; Odie, W.S.; Wang, Y.S.; Barlaz, M.A. Biodegradability of municipal solid
waste components in laboratory-scale landfills. Envir. Sci. Technol., 1997, 31 (3), 911-917.
(20) Sich, B.; Barlaz, M. A. Process model documentation: Calculation of the cost and life-cycle
inventory for waste disposal in traditional, bioreactor and ash landfills. Internal Report, Dept. of
Civil Engineering, North Carolina State Univ., Raleigh, N.C, 2000.
21. Camobreco, V.; Ham, R.; Barlaz, M.; Repa, E.; Felker, M.; Rousseau, C.; Rathle, J. Life-
cycle inventory of a modern municipal solid waste landfill. Waste Manage. Res. 1999, 17, 394-
408.
22. Staley, B.F. and Barlaz, M.A. Composition of Municipal Solid Waste in the United States
and Implications for Carbon Sequestration and Methane Yield. J. Environ. Eng. -ASCE 2009,
135, 901-909.
23. Landfill Gas Emissions Model (LandGEM) Version 3.02 User’s Guide; EPA-600/R-05/047;
U.S. EPA, Office of Research and Development: Washington, DC, 2005; Retrieved:
November 11, 2010.

24. Inventory of U.S. Greenhouse Gas Emissions and Sinks: 1990-2008; EPA 430-R-10-006;
U.S. EPA: Washington, DC, 2010;
http://www.epa.gov/climatechange/emissions/downloads10/US-GHG-Inventory-
2010_Report.pdf.
25. De la Cruz, F.B. and Barlaz, M.A. Estimation of Waste Component-Specific Landfill Decay
Rates Using Laboratory-Scale Decomposition Data. Environ. Sci. Technol. 2010, 44, 4722-4728.
26. AP 42, Fifth Edition, Volume I Chapter 2: Solid Waste Disposal; U.S. EPA, Office of
Resource Conservation and Recovery: Washington, DC, 1998; Retrieved: November 11, 2010.
27. Chanton, J.R.; Powelson, D.K.; Green, R.B. Methane Oxidation in Landfill Cover Soils, is a
10% Default Value Reasonable? J. Environ. Qual. 2009, 38, 654-663.