Embed Size (px)
Citation preview

What is the impact of non-contributory pensions on poverty? Estimates from Brazil and South Africa
Armando Barrientos* Institute for Development Policy and Management, University of Manchester Harold Hankins Building, Oxford Road, Manchester M13 9QH
CPRC Working Paper No 33 Chronic Poverty Research Centre
ISBN Number: 1-904049-32-X
* The author draws on materials from a research project on “Non-contributory pensions and poverty prevention in developing countries? A comparative study of South Africa and Brazil”, funded by the Department for International Development of the UK Government, and with the participation of Peter Lloyd-Sherlock and Helena Legido-Quigley from the UK, Monica Ferreira and Valerie Møller from South Africa, João Saboia and Maria Lucia Werneck Vianna from Brazil, and Mark Gorman and Amanda Heslop from HAI. Further information is available at http://idpm.man.ac.uk/ncpps.

2
Abstract This paper considers the impact of cash transfer programmes for the old in Brazil and South Africa on poverty among households with older people. Using datasets collected specifically for the purpose, the paper constructs conditional and unconditional estimates of the poverty reduction capacity of these programmes. The paper finds that non-contributory pensions have a measurable and significant impact upon poverty reduction and poverty prevention in the two countries studied.
August 2003
JEL: H55, I32, I38, J14 Keywords: poverty, pensions, South Africa, Brazil
3
In developing countries, the incidence of old age poverty is high (Delgado and Cardoso 2000c; Barrientos 2002; Barrientos, Gorman et al. 2003), but cash transfer programmes for the old and their households are scarce (Barrientos and Lloyd-Sherlock 2003). This neglect reinforces itself. As Kanbur notes in the context of AIDS, poverty measurements focus on the currently living with the implication that poverty measures “decrease if the poorest died as a result of poverty” (Kanbur 2002). Given the link between income and life expectancy, this ‘non-random attrition’ works to make old age poverty less visible and old age support less urgent. There is an implicit resistance to establishing non-contributory pension programmes1 in developing countries.2 This is based on three widely held generalisations. Firstly, there is a widespread, although weakening, belief that households in low income countries provide effective old age support, and that the introduction of formal old age protection may simply ‘crowd out’ existing support (World Bank 1994). Secondly, old age poverty is usually given a low priority in development policy, perhaps because of “the assessment that there are other, more likely, contributors to development and other, more pressing, needs” (Treas and Logue 1976). Thirdly, the financial costs attached to the introduction of public pension programmes appear to be beyond the capacity of poorer developing countries, especially as such programmes look increasingly difficult to finance in developed countries (Weaver 2003). The evidence emerging from the handful of developing countries with substantial non-contributory public pension programme suggests that, to an important extent, this resistance to non-contributory pension programmes is misplaced (Willmore 2001; Bertranou, Solorio et al. 2002; Barrientos and Lloyd-Sherlock 2003; Willmore 2003). The two countries with the largest non-contributory pension programmes are Brazil and South Africa, and the findings from a number of studies indicate that these programmes have large positive impacts upon a wide range of variables. Non-contributory pension programmes reduce poverty among the elderly and their households, enable investment in human and physical capital within beneficiary households, strengthen intergenerational solidarity and transfers, insure poorer rural communities against the adverse effects of agricultural reform, and encourage local economy activity.3 A small number of studies have focused on the impact of non-contributory pension programmes in Brazil and South Africa on poverty. Lund identified the poverty reduction and promotion effects of the ‘social pension’ in South Africa, and has traced the expanding literature (Lund 1993; Ardington and Lund 1995; Lund 1999). Deaton
1 In the paper non-contributory pension programmes refer to cash transfer programmes targeted primarily on older people. They are non-contributory in so far as, in practice, payroll contributions to social insurance schemes do not constitute a pre-requisite for entitlement. These include assistential pension programmes. 2 James articulates this resistance: “Probably for most developing countries, a universal flat old age benefit is a luxury they cannot afford, nor is the best use of their limited public resources” (James 2001). 3 See inter alia (Ardington and Lund 1995; Lund 1995; Møller and Sotshangaye 1996; Case and Deaton 1998; Ferreira 1999; Fultz and Pieris 1999; Lund 1999; Saad 1999; Sagner and Mtati 1999; Carvalho 2000b, a; Case and Wilson 2000; Delgado and Cardoso 2000c, a; Duflo 2000; Schwarzer 2000; Case 2001; Devereux 2001a, b; van der Berg 2001; Bertranou, Solorio et al. 2002; Brumer 2002; Camarano and Pasinato 2002; Committe of Inquiry into a Comprehensive System of Social Security for South Africa 2002; Jensen 2002; Lund 2002; Schwarzer and Querino 2002; Barrientos 2003b, a; Barrientos and Lloyd-Sherlock 2003; Dieden 2003; Werneck Vianna 2003).

4
and Case looked at this issue in the context of a 1993 nationwide household dataset and confirmed that the ‘social pension’ has significant effects on poverty. Their analysis showed that around 35% of Africans survived on less than US$1 a day, and that this “figure would be 40% if the pension incomes were removed and there was no off-setting change in pre-pension incomes” (Case and Deaton 1998, p.132). Studies using more recent data have confirmed the poverty reduction effects of the ‘social pension’, albeit less directly through estimating the correlation existing between the presence of pensioners in a households and measures of income and poverty (Leibbrandt 2001). In Brazil, researchers at IPEA have investigated the impact of the rural old age pension and have concluded that the programme has significant effects on poverty (Delgado and Cardoso 2000b; Delgado and Cardoso 2000c; Schwarzer 2000; Schwarzer and Querino 2002). Delgado and Cardoso compared households with a pension beneficiary against households without one, and found that the incidence of poor households was higher among the latter. The proportion of beneficiary households who were poor was 38.1 percent in the Northeast region and 14.3 percent in the South, whereas among non-beneficiary households poverty incidence was 51.5 percent and 18.9 percent respectively (Delgado and Cardoso 2000a). This paper aims to make a contribution to this literature by constructing reliable estimates of the impact of non-contributory pension programmes on poverty. The analysis makes use of comparable datasets from Brazil and South Africa collected in October-December 2002 from a sample of households with older people. The datasets provide detailed information on non-contributory pensioner households in the two countries. They also enable a cross-country comparison as an additional check on the country specific results. The paper is organised as follows: Section One provides basic information on the non-contributory pension programmes in Brazil and South Africa. Section Two describes the poverty indicators and data. Section Three computes and discusses poverty measures with and without pension income. Section Four presents estimates of the impact of the pension programme on the probability of being poor in a multivariate setting. A final section discusses the main conclusions. 1. NON-CONTRIBUTORY PENSION PROGRAMMES IN BRAZIL AND SOUTH AFRICA This section provides a brief description of the non-contributory pension programmes. South Africa A pension benefit of 640 Rand is paid to men aged 65 and over and women aged 60 and over. Benefit entitlements are means tested on the income of the individual beneficiary, and his/her partner if married, but not on the income of other household members. The programme began in the early 1900s as a means of providing a basic income in retirement for whites who lacked an occupational pension (van der Berg 2001). Subsequently, the programme was extended to Coloureds (1928) and Africans (1944), but with different conditions for entitlement and benefit levels. In the 1980s and 1990s, there was a gradual move towards parity in benefits, which was completed in 1996 with the introduction of non-discriminatory regulations. Africans are now the main beneficiaries. In 1993, there were just above 1.5 million old age pension being

5
paid, with 1.2 million being paid to Africans (van der Berg 2001). The most recent estimate is that there are 1.9 million beneficiaries of the state old age pension (Committe of Inquiry into a Comprehensive System of Social Security for South Africa 2002). The programme is reasonably well administered, and reaches the poorer rural areas. The programme is funded through general taxation, absorbing 60 percent of social security expenditure, and 1.4 percent of GDP. It is widely acknowledged that the old age pension produces a significant redistribution of income in the country (Committe of Inquiry into a Comprehensive System of Social Security for South Africa 2002). Brazil Limited provision of non-contributory pensions for workers in the rural sector dates back to 1963, but entitlements were restricted to the very old. The scheme was gradually upgraded during the 1970s, in response to mobilisations of rural workers and pressures for land reform (Brumer 2002). The 1988 Constitution recognised the right to social protection for workers in the rural sector, and especially for those in informal employment. This led to a range of reforms being implemented from 1991 to establish a new rural old age pension, referred to as Prêvidencia Rural (PR) below. As part of the reforms, the age of pension eligibility was reduced from 65 years of age to 60 for men and 55 for women. Entitlement to old age, disability and survivor pensions was extended to workers in subsistence activities in agriculture, fishing and mining, and to those in informal employment. Whereas prior to 1991 only heads of household were entitled to a pension, the reforms extended entitlement to all qualifying workers, thus expanding coverage to female rural workers who were not heads of household. The value of the pension benefits was raised from 0.5 to 1 minimum wage (200 Reais in December 2002). A key aspect of the programme is that access to pension entitlements does not require earnings or inactivity tests. In urban areas, provision of old age assistance pensions is much less developed. A social assistance pension Renda Mensual Vitalícia (RMV) was introduced in 1974 paying a flat rate benefit of one half the minimum wage to older or disabled people who could not provide for themselves. To be entitled to the RMV, individuals needed to be 70 years of age or over and have at least 12 months of contributions to social insurance. After the 1988 Constitution, a new social assistance pension, the Beneficio de Prestação Continuada (BPC) was introduced in 1993, paying one minimum wage to disabled or elderly people aged 67 and over living in urban or rural areas with per capita household income below a quarter of the minimum wage. Entitlement, including the means test, is reviewed every two years. The conditions for entitlement under the BPC are tougher than under the PR. In December 2000, there were 4.6 million beneficiaries of old age pensions under the PR programme, 0.3 million old age RMV beneficiaries, and 0.4 million old age BPC beneficiaries.4 The fiscal cost of the PR programme, including disability pensions, has been estimated at 1 percent of GDP (Schwarzer and Querino 2002), while the cost of the RMV and BPC programmes should be around 0.2 percent of GDP given the smaller number of beneficiaries. Overall, a reasonable estimate of the cost of old age pensions under the three non-contributory pension programmes for older people in Brazil is 1 percent of GDP.
4 These figures exclude beneficiaries of disability pensions under the three programmes.

6
2. POVERTY INDICATORS AND DATA This section describes the poverty measures, poverty line, and data used in the paper. Poverty measures The poverty headcount and the poverty gap are widely used poverty measures. These are special cases of the Foster, Greer, and Thorbecke class of poverty measures (Foster, Greer et al. 1984),
where n is the total number of individuals, q is the number of poor individuals (having a standard of living indicator no greater than z), z is the poverty line, yi is the standard of living indicator of individual i , and α is an aversion to poverty parameter. Where α=0, P0 provides a poverty headcount measure. Where α=1, P1 provides a poverty gap measure, interpreted as the improvement in standard of living required to bring the poor to the level of the poverty line. These two poverty measures will be used in the empirical work below. A number of alternative standards of living indicators are used in the literature, but the paper focuses on household income, because the objective is to isolate the impact of pension income on poverty.5 More precisely, the standard of living indicator used is adult equivalent per capita household income. To account for differences in the demographic composition of households, and economies of size within the households, total household income is transformed using the following formula:
where yi is adult equivalent per capita household income of individual i, yij is household income of individual i from source j (j = 1,2,…,J), A is the number of adults, and K the number of children aged 15 and below. The parameter α is a measure of the ‘cost’ of children relative to adults, while θ reflects economies of size in the household. In this paper, the values chosen for these parameters are α = 0.5 and θ = 0.75, in line with the widely used ‘OECD equivalence scale’.6 Poverty lines Selecting a poverty line is a complex issue at the best of times. In the context of this paper, it is important to adopt a poverty line which facilitates comparative study. A useful strategy is to fix the poverty line at the level of the pension benefit in each country, and, as will be shown below, this has a number of advantages. In South
5 A companion paper considers multidimensional deprivation indicators (Barrientos 2003a). 6 There is a large literature on this, but see Klasen (2000) for a general discussion in the context of South Africa, and Woolard and Leibbrandt for a sensitivity analysis of different equivalence scales (2001). The latter find that the sensitivity of poverty estimates to different values for the parameters α and θ in the context of South Africa is low, especially around the values selected in this paper. Using adult equivalent standard of living indicators in very important in the study of old age poverty (Deaton and Paxson 1997; Barrientos, Gorman et al. 2003).
)1(011
≥
−
= ∑=
αα
α forz
yzn
Pq
i
i
)2(])1[(1
1
+−+=
∑ =θαKA
yy
J
j iji

7
Africa, the poverty line is set at 640 Rand, and in Brazil at 200 Reais, the maximum pension benefit levels in force at the time of the survey data collection in the two countries. There are good reasons for adopting the level of the pension benefit as the poverty line, as it represents a socially accepted minimum living standard in both countries. In Brazil, this is in line with the fact that the non-contributory pension benefit is equivalent, by law, to one minimum wage. This minimum living standard also applies to other benefits in the social insurance scheme, such as disability and survivor pensions and minimum guaranteed pensions for contributory programmes. In South Africa the situation is more complex because there is no official poverty line or general minimum wage, and other social assistance benefits vary in value. It would be useful to compare the poverty and indigence lines selected here with poverty lines identified for South Africa using alternative methodologies. May, Woolard and Leibbrandt compared alternative poverty lines in South Africa, a distributionally based 40th percentile of population minimum, the commonly used US$2 a day international poverty line, and the value of a calorific intake of 8,500 KJ per day (May, Woolard et al. 2000; Woolard and Leibbrandt 2001). Updating their figures to November 2002, these three poverty lines are 586.2 Rand, 408 Rand, and 290 Rand respectively. The poverty adopted in this paper is slightly above the 40th percentile cut-off point,7 and it is one and a half times the US$ 2 a day threshold. In Latin America, it is common to define an indigence line, equivalent to the value of a minimum basket of consumption needed for physical survival (Boltvinick n.d.). As it happens, the value of the indigence level for Brazil was one half of the minimum wage, or 100 Reais at the time of the data collection. This indigence line will alsoe b used in the empirical work below, calculated in South Africa as one half of the pension benefit level, or 320 Rand. Against the alternative poverty lines noted in the previous paragraph, the indigence line for South Africa is very close to the minimum calorific intake poverty line. What about the comparability of poverty lines for Brazil and South Africa? At the official exchange rate for December 2000, the maximum non-contributory pension benefit was US$75.6 for South Africa and US$ 92.5. At international PPP US$, the respective values are 237.2 and 208.3.8 It is remarkable that the values of the non-contributory pension benefit in the two countries are so close to one another, and this provides an additional justification for using the value of the pension benefit as the poverty line and one half of the benefit as the indigence line. Data The data used in this paper comes from household surveys implemented in 2002 in Brazil and South Africa. The surveys targeted households with older people and included a household component, implemented on the ‘most knowledgeable person in the household’, and an additional supplement for household members 55 years of age and older, implemented on the older persons themselves. In South Africa, data was
7 The 40th percentile cut-off point refers to households ranked by adult equivalent expenditure (Woolard and Leibbrandt 2001). 8 The official exchange rate and PPP conversion rates were taken from the World Development Indicators 2002 (World Bank 2002). Deaton provides a good summary of the dangers of relying on cross-country comparisons of poverty based on PPP-set poverty lines (Deaton 2001). In the context of the paper, it is sufficient to note the poverty lines are roughly comparable.

8
collected on 1111 households in Cape Town and the Eastern Cape. The sample of urban households from Cape Town includes 324 Black households and 413 Coloured households. The rural sample includes 374 Black households. In Brazil, data was collected on 1006 households, 250 from the Municipality of Rio de Janeiro, 255 from the Metropolitan Region in Rio de Janeiro, 269 from the urban areas under the Municipality of Ilhéus, and 232 from rural areas in the same Municipality. The sample was constructed by selecting census cells (Enumerator Areas in South Africa and Setores Censitários in Brazil, on the basis of socio-economic - and in South Africa ethnic composition - indicators. Within the sampled cells, households were visited randomly, and interviewed if they had an old age member. A common survey instrument was used in the two countries with the aim of enabling full comparability. The questionnaire covers household location, housing, and demographic information; employment, income and expenditure, health care, and self-reported well being. The older person supplement covers pensions and other state benefits, health status, social participation and transfers.9 2. POVERTY IN THE ABSENCE OF NON-CONTRIBUTORY PENSIONS As a first step in identifying the impact of pension programmes on poverty, we could compare poverty measures computed using full household income against the same poverty measures computed excluding non-contributory pension income.10 There are number of drawbacks associated with this strategy, in as much as the household response to the absence of non-contributory pension is unobserved. It may well be the case that other income sources could be used to make up this shortfall, for example through increased labour supply or private transfers, but we are not able to account for this. Nonetheless, this rough and ready comparison provides some indication of the significance of non-contributory pension income for the sampled households. Table 1 below summarises the poverty incidence and gap with and without non-contributory pension income for the two samples. Full income involves incomes received by the household from all sources, including income from private transfers and the value of own produce consumed within the household.
Table 1. Poverty headcount and gap measures with and without pension income
(using adult equivalent household income per capita)
Brazil (n=3523) South Africa (n=5560) with n-c
pension without n-c pension
with n-c pension
without n-c pension
poverty headcount 61.0 65.3 41.3 43.1 poverty gap as % of poverty line
21.9
29.7 18.6 33.7
9 The survey instruments and field reports are available at http://idpm.man.ac.uk/ncpps .
10 This involves comparing α
α
α
α ∑∑=
−
=
−−
=
−
=q
i
iincyyq
i
iy
zncyyz
nPwith
zyz
nP
11
11
9
indigence headcount 21.0 30.6 17.0 19.3 indigence gap as % of indigence line
4.3 12.0 7.3
9.0
Own calculations using household datasets for Brazil and South Africa The figures in the Table show that non-contributory pension income reduces, other things being equal, both the poverty headcount and gap in the two countries involved. Non-contributory pension income reduces the poverty headcount among members of households with older people 4.2 percentage points in Brazil and 2.8 percentage points in South Africa. It also reduces the indigence headcount by 9.6 percentage points in Brazil, and 2.3 percentage points in South Africa. The impact on headcount poverty is markedly lower for South Africa than for Brazil. This can be explained to a large extent by the poorer diversification of income sources and the incidence of larger households in South Africa, with the implication that non-contributory pension income has to be spread more widely. Non-contributory pension income has a stronger impact upon the poverty gap in both countries. In Brazil, the absence of non-contributory pension income would make the poverty gap among older households, other things being equal, 40 percent larger, and the indigence gap almost 3 times larger. For South Africa, the absence of non-contributory pension income would increase the poverty gap, other things being equal, by 81 percent, but would have a much smaller effect upon the indigence gap, increasing it by just over one fifth. These are estimates of the impact of non-contributory pension income at the mean of the sample, but it is also important to identify the impact of pension income at other points in the distribution. Table 2 below shows the poverty and indigence headcounts disaggregated by quintile of adult equivalent household income per capita.
Table 2. Poverty headcount with and without pension income, by quintiles of adult
equivalent household income per capita
Brazil (n=3523) South Africa (n=5560) with n-c
pensionwithout n-c
pension with n-c pension
without n-c pension
per capita household income quintiles
poverty headcount
1 100.0 100.0 100.0 100.02 100.0 100.0 93.5 94.23 86.9 88.8 13.0 20.74 18.4 34.8 0.0 0.55 0.0 3.1 0.0 0.0 indigence headcount 1 87.8 87.8 83.3 84.62 17.1 37.2 2.0 9.1

10
3 0.0 17.5 0.0 3.44 0.0 10.1 0.0 0.05 0.0 0.3 0.0 0.0
Own calculations using household datasets for Brazil and South Africa The figures in Table 2 show that the impact of non-contributory pension income on poverty headcount is restricted to some quintiles. For Brazil, the impact of ignoring non-contributory pension income is stronger for the fourth quintile, where the probability of poverty would almost double. In South Africa, the impact is stronger for the third quintile. Elsewhere, the impact is marginal in both countries. In terms of the indigence headcount, the impact of non-contributory pension income is stronger, and distributed more widely. Table 3 shows poverty and indigence gap measures with and without taking account of non-contributory pension income. The impact of the pension programmes on the extent of poverty is stronger. In the case of Brazil, and focusing on the poverty gap as a proportion of the poverty line, non-contributory pension income has effects on the poverty gap across the full distribution, although these are stronger in the middle quintiles. The same applies to the indigence gap calculated as a proportion of the indigence line. This rises for the four lower quintiles in Brazil. For South Africa, the impact of non-contributory pension income is observable for the lower three quintiles only.
Table 3. Poverty and Indigence gaps with and without pension income, by quintiles of
adult equivalent household income per capita
Brazil (n=3523) South Africa (n=5560) with n-c
pensionwithout n-c
pension with n-c pension
without n-c pension
per capita household income quintiles
poverty gap as % of poverty line
1 60.0 61.1 67.3 69.32 38.2 49.4 21.5 29.03 10.6 24.5 0.9 4.54 0 9.6 0 05 0 0.6 0 0
indigence gap as % of indigence line
1 21.6 31.6 36.7 40.62 0.2 14.8 0 3.33 0 9.9 0 1.44 0 3.5 0 05 0 0 0 0
Own calculations using household datasets for Brazil and South To recap the main conclusions from this section, a comparison of poverty measures calculated on full household income, and household income excluding non-

11
contributory pension income indicate that these programmes have an important impact on poverty among households with older people in Brazil and South Africa. Their impact on poverty and indigence gaps is stronger than that on poverty and indigence headcount measures. In South Africa, in particular, the presence of extended households together with poorer income diversification means that the old age pension is not sufficient, by itself to lift households our of poverty or indigence. In Brazil, the impact of non-contributory pension programmes is more widely felt across the distribution of households, and their impact upon the extent of poverty is strong. 3. NON-CONTRIBUTORY PENSIONS AND THE PROBABILITY OF BEING POOR As a second step in identifying the impact of non-contributory pension income on poverty, this section reports on probit regressions of the determinants of the probability that a household member is poor. A multivariate setting enables the identification of the impact of having a non-contributory pension beneficiary on the probability that household members are poor, having controlled for the influence of household and individual characteristics, as well as other income sources. The model to be estimated is of the poverty profile type. In poverty profiles, it is postulated that the ratio of individual or household income to the poverty line is a function of a vector X of individual and household characteristics, more specifically yi/z = β’Xi + ei , where e is ~N[0,σ2]. This can be estimated by regressing the individual or household poverty measure yi/z on a range of individual, household and environmental characteristics. As for each individual the poverty headcount measure P0 is a binary indicator with a value of 1 if yi/z ≤ 1 and 0 otherwise, the probability that an individual i will be found to be poor is given by:
where Φ [.] is the cumulative density function of the standard normal. Separating out the variables of interest, the model to be estimated is:
)4(''X']|1Pr[ 0 iiiiiii ISNCPXP εθλβα ++++== where Xi is a vector of household and individual characteristics, NCPi is a dummy variable indicating whether someone in the household receives a non-contributory pension benefit, ISi is a vector of dummy variables indicating whether the household receives a range of income sources other than from non-contributory pension. The parameter of interest is λ, providing an estimate of the impact of non-contributory pension receipt on the probability of poverty. A number of issues associated with this specification have been examined in the relevant literature (Glewwe 1991; Diamond, Simon et al. 1999; Dieden 2003). In a sense, income sources cannot be taken as exogenous to the individual and household. Some studies for South Africa have considered whether receipt of the pension encourages other relatives to co-reside with pensioners, as a means of avoiding poverty or destitution, or as an insurance against frequent unemployment spells or
)3(]'1[]'1Pr[]|1Pr[Pr 0 iiiiii XXXPob ββε −Φ=−<===

12
variable income (Edmonds, Mammen et al. 2001). There are other complications that arise from the juxtaposition of income source variables and variables indicating characteristics which enable or disable access to income sources, such as labour earnings and schooling. And, to an important extent, income levels may help determine the income sources of households, as it is the case where a means test is applied for the determination of non-contributory pension entitlement. It can be argued that these issues are less important in the context of older people and their households. Especially as regards older people themselves, it can be argued that whatever choices may have led to the presence of current income sources, these can be taken to be predetermined and irreversible. The labour supply effects of pension receipts, for example, are likely to be smaller for older people than for middle age adults by an order of magnitude. Nonetheless, issues of endogeneity remain important for other members of the household. Regarding the feedback effects of income levels on income sources, the model estimated below uses dummy variables indicating the presence of income sources rather than the amounts received. While exercising considerable care, it is possible to interpret the parameters estimated by the model as reflecting a statistical association between the different sources of income on the one hand and poverty on the other, controlling for a number of household and individual characteristics. The variables included in the model reflect individual characteristics, such as age, marital and work status, which have been found to determine poverty in similar studies (May 2000; May, Woolard et al. 2000; Bhorat, Leibbrandt et al. 2001; Leibbrandt 2001; Woolard and Leibbrandt 2001; Woolard and Klasen 2003). The same goes for household characteristics, such as the number of household members, whether the household is located in a rural area, the number of rooms and durables, and the presence of extraordinary expenses and recent death of household members. In addition, income sources have been grouped in meaningful categories, and dummy variables indicate their presence within the household, including non-contributory pension receipt. The full list of variable definitions can be found in Appendix One. Tables 4 and 5 report on the estimates for the Brazil and South Africa samples respectively. The reported parameters are marginal effects computed at the mean of the regressors. Broadly, the probit regression results are in line with expectations. Members of larger households in rural areas have a higher probability of being poor. Household members in work who belong to households with more durables are less likely to be poor. Households with labour earnings are emphatically less likely to be poor.11 Private transfers have a significant negative impact upon poverty probabilities in the Brazil and South Africa samples. Some parameter estimates have different signs in the two countries. Members of households receiving state transfers other than pensions are more likely to be poor in the Brazil sample, but less likely to be poor in the South Africa sample. This can be explained in the context of the different social protection systems in these countries. As non-contributory pensions are almost universal in South Africa, other state transfers complement pension income, but in Brazil, and especially for urban
11 See (Woolard and Klasen 2003)
13
households unable to access non-contributory pensions, other state transfers can the only lifeline and could be an indicator of acute poverty.
Table 4. Probit regression results for the Brazil sample Dependent variable is poverty indicator (poor = 1; non-poor = 0)
Variable Marginal s.e. t-stat Mean of XConstant 1.300 * .07 18.1 Widow -.020 .03 -.63 .12Age -.002 .004 -.58 43.19Age2 .00002 .00009 .28 2540.02Age3 -.0000002 .0000006 -.37 168044.85Number in household .075 * .005 14.80 4.76Rural .221 * .02 10.75 .26Number of rooms -.056 * .008 -6.66 4.28Durables -.118 * .007 -15.15 5.58Work -.148 * .02 -5.11 .24Expenditure shock -.050 .03 -1.55 .11Death in the household -.081 *** .04 -1.77 .05N-c Pension -.182 * .03 -5.72 .23Public transfers .058 ** .01 1.95 .14Private transfers -.068 * .02 -2.60 .19Labour earnings -.322 * .02 -15.63 .65Private Pension .096 .09 1.05 .006Public pension -.311 * .02 -14.80 .66Rent -.359 * .05 -6.70 .03NGO transfers .031 .11 .27 .004*significant at 1%; ** significant at 5%; *** significant at 10% N=3253; P1 = 0.389; P0 = 0.610; LogL = -1424.02 ; LogL(0) = -2174.68 Estrella = 0.432; Efron = 0.400 ; McFadden = 0.345; Ben/Lerman = 0.712; Cramer = 0.396; Veall/Zim = 0.551
Table 5. Probit regression results for the South Africa sample Dependent variable is poverty indicator (poor = 1; non-poor = 0)
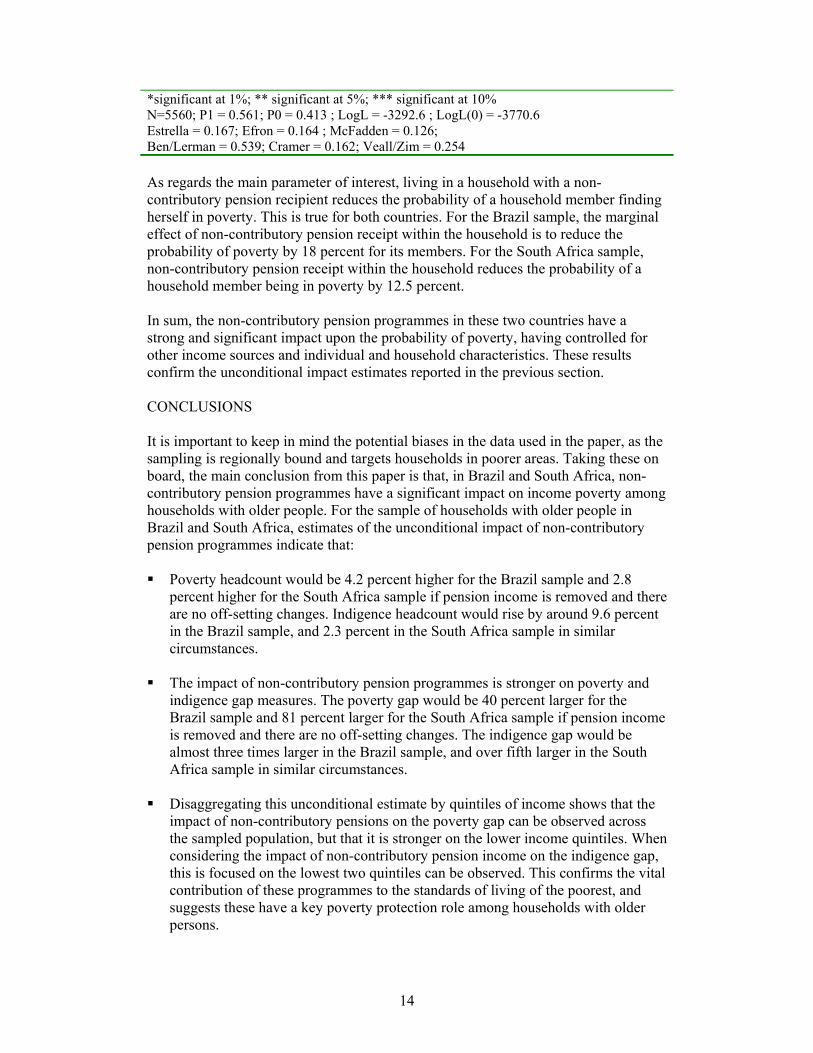
Variable Marginal s.e. t-stat Mean of XConstant -.186 * .036 -5.08 Widow .022 .064 .35 .01Age .004 .0025 1.58 31.96Age2 -.00009 .00007 -1.29 1555.51Age3 .0000006 .0000006 1.06 90331.24Number in household .044 * .002 17.93 6.69Rural -.0007 .021 -.035 .36Number of rooms .013 * .004 3.12 3.88Durables -.017 * .004 -4.33 3.86Work -.042 *** .023 -1.82 .13Expenditure shock .095 * .019 4.97 .19Death in the household .035 ** .018 1.96 .23N-c Pension -.125 * .016 -7.53 .63Public transfers -.067 * .016 -4.15 .31Private transfers -.074 * .019 -3.81 .13Labour earnings -.249 * .016 -14.87 .48Private Pension -.160 * .024 -6.54 .07Rent -.142 .091 -1.57 .004
14
*significant at 1%; ** significant at 5%; *** significant at 10% N=5560; P1 = 0.561; P0 = 0.413 ; LogL = -3292.6 ; LogL(0) = -3770.6 Estrella = 0.167; Efron = 0.164 ; McFadden = 0.126; Ben/Lerman = 0.539; Cramer = 0.162; Veall/Zim = 0.254 As regards the main parameter of interest, living in a household with a non-contributory pension recipient reduces the probability of a household member finding herself in poverty. This is true for both countries. For the Brazil sample, the marginal effect of non-contributory pension receipt within the household is to reduce the probability of poverty by 18 percent for its members. For the South Africa sample, non-contributory pension receipt within the household reduces the probability of a household member being in poverty by 12.5 percent. In sum, the non-contributory pension programmes in these two countries have a strong and significant impact upon the probability of poverty, having controlled for other income sources and individual and household characteristics. These results confirm the unconditional impact estimates reported in the previous section. CONCLUSIONS It is important to keep in mind the potential biases in the data used in the paper, as the sampling is regionally bound and targets households in poorer areas. Taking these on board, the main conclusion from this paper is that, in Brazil and South Africa, non-contributory pension programmes have a significant impact on income poverty among households with older people. For the sample of households with older people in Brazil and South Africa, estimates of the unconditional impact of non-contributory pension programmes indicate that: Poverty headcount would be 4.2 percent higher for the Brazil sample and 2.8
percent higher for the South Africa sample if pension income is removed and there are no off-setting changes. Indigence headcount would rise by around 9.6 percent in the Brazil sample, and 2.3 percent in the South Africa sample in similar circumstances.
The impact of non-contributory pension programmes is stronger on poverty and
indigence gap measures. The poverty gap would be 40 percent larger for the Brazil sample and 81 percent larger for the South Africa sample if pension income is removed and there are no off-setting changes. The indigence gap would be almost three times larger in the Brazil sample, and over fifth larger in the South Africa sample in similar circumstances.
Disaggregating this unconditional estimate by quintiles of income shows that the
impact of non-contributory pensions on the poverty gap can be observed across the sampled population, but that it is stronger on the lower income quintiles. When considering the impact of non-contributory pension income on the indigence gap, this is focused on the lowest two quintiles can be observed. This confirms the vital contribution of these programmes to the standards of living of the poorest, and suggests these have a key poverty protection role among households with older persons.

15
A multivariate analysis of the impact of non-contributory pension programmes on the probability of a members of a household being poor finds that belonging to a household with a pension recipient reduces this probability by 18 percent for the Brazil sample and 12.5 percent for the South African sample. It is hoped that the evidence presented in this paper adds to the wider case for the desirability and feasibility of non-contributory old age pension programmes in developing countries. Non-contributory pension programmes could make a significant contribution to poverty reduction and prevention in these countries, and are an indispensable instrument in achieving the MDGs.

16
Appendix One. Variable definitions Variable Variable definition
AEHY Adult equivalent per capita household income, constructed by adding up household income from all sources, and including private transfers, and value of own produce
WIDOW Dummy indicating widowhood (yes=1; no=0) AGE Age in completed years AGE2 Age x Age AGE3 Aged x Age x Age NUMBER OF HOUSEHOLD MEMBERS
Number of household members
RURAL Dummy indicating whether household lives in rural area (yes=1; no=0)
NUMBER OF ROOMS Number of rooms including kitchen but excluding bathroom
DURABLES Number of durable goods in working order (max=10; individual items are: telephone, gas or electric stove, electricity, television, radio or stereo, refrigerator/deep freeze, sewing machine, car, bicycle, motorcycle)
WORK Whether person is working or looking for work EXPENDITURE SHOCKS Whether the household has had extraordinary
expenses in the last 12 months (yes=1; no=0)
DEATH IN THE HOUSEHOLD
Whether a member of the household died in the last 2 years (yes=1; no=0)
N-C PENSION Dummy indicating whether a member of the household receives a non-contributory pension (yes=1; no=0)
PUBLIC PENSION Dummy indicating whether the household receives income from public pensions (yes=1; no=0)
PRIVATE PENSION Dummy indicating whether the household receives a private pension (yes=1; no=0)
PUBLIC TRANSFERS Dummy indicating whether the household receives state benefits other than non-contributory pensions (yes=1; no=0)
PRIVATE TRANSFERS Dummy indicating whether the household receives income from a person outside the household, including remittances and goods, valued by respondent (yes=1; no=0)
NGO TRANSFERS Dummy indicating whether the household receives transfers from Church or NGOs (yes=1; no=0)
LABOUR EARNINGS Dummy indicating whether the household receives labour income (yes=1; no=0)
RENT Dummy indicating whether the household receives income from savings, property rental, or lodgers (yes=1; no=0)

17
REFERENCES Ardington, E. and F. Lund (1995), Pensions and development: social security as complementary to programmes of reconstruction and development, Development Southern Africa, 12, (4), 557-577. Barrientos, A. (2002), Old age, poverty, and social investment, Journal of International Development, 14, (8), 1133-1142. Barrientos, A. (2003a), Non-contributory pensions and the well-being of older people: Evidence on Multidimensional Deprivation from Brazil and South Africa, mimeo, Manchester: IDPM, University of Manchester. Barrientos, A. (2003b), Pensions and development in the South, Geneva Papers on Risk and Insurance, 28, (4). Barrientos, A.; M. Gorman and A. Heslop (2003), Old age poverty in developing countries: contributions and dependence in later life, World Development, 3, (3), 555-570. Barrientos, A. and P. Lloyd-Sherlock (2003), Non-contributory pensions and social protection, mimeo, Geneva: ILO. Bertranou, F.; C. Solorio and W. van Ginneken (2002), Pensiones no-contributivas y asistenciales. Argentina, Brazil, Chile, Costa Rica y Uruguay, Santiago: ILO. Bhorat, H.; M. Leibbrandt; M. Maziya; S. van der Berg and I. Woolard (2001), Fighting poverty. Labour markets and inequality in South Africa, Cape Town: UCT Press. Boltvinick, J. (n.d.), Poverty in Latin America: A critical analysis of three studies, mimeo, Santiago: ECLAC. Brumer, A. (2002), Gender Relations and Rural Social Security in Southern Brazil, in C. Abel and C. Lewis (eds.), Exclusion and Engagement: Social Policy in Latin America, London: Institute of Latin American Studies. Camarano, A. A. and M. T. Pasinato (2002), Envelhecimento, condicoes de vida e politica previdenciaria. Como ficam as mulheres?, Discussion Paper 833, Rio de Janeiro: IPEA. Carvalho, I. (2000a), Elderly Women and their Living Arrangements, mimeo, Cambridge MA: MIT. Carvalho, I. (2000b), Old-Age Benefits and the Labour Supply of Rural Elderly in Brazil, mimeo: MIT. Case, A. (2001), Does Money Protect Health Status? Evidence from South African Pensions, mimeo, Princeton: Princeton University.
18
Case, A. and A. Deaton (1998), Large Scale Transfers to the Elderly in South Africa, Economic Journal, 108, (450), 1330-1261. Case, A. and F. Wilson (2000), Health and well-being in South Africa: evidence from the Langeberg Survey, mimeo, Princeton: Princeton University. Committe of Inquiry into a Comprehensive System of Social Security for South Africa (2002), Transforming the present- Protecting the future, Draft Consolidated Report, Pretoria: Committe of Inquiry into a Comprehensive System of Social Security for South Africa. Deaton, A. (2001), Counting the World's poor: Problems and possible solutions, World Bank Research Observer, 16, (2), 125-147. Deaton, A. and C. Paxson (1997), Poverty among children and the elderly in developing countries, mimeo, Princeton: Research Program in Development Studies, Princeton University. Delgado, G. C. and J. C. Cardoso (2000a), Condicões de reproducão econômica e combate à pobreza, in G. C. Delgado and J. C. Cardoso (eds.), A Universalização de Direitos Sociais no Brazil: a Prêvidencia Rural nos anos 90, Brasilia: IPEA. Delgado, G. C. and J. C. Cardoso (2000b), Principais Resultados da Pesquisa Domiciliar sobre a Providência Rural na Região Sul do Brasil, Texto para Discussao 734, Rio de Janeiro: Instituto de Pesquisa Econômica Aplicada. Delgado, G. C. and J. C. Cardoso, eds.) (2000c), A Universalização de Direitos Sociais no Brazil: a Prêvidencia Rural nos anos 90. Brasilia: IPEA. Devereux, S. (2001a), Can social safety nets reduce chronic poverty?, mimeo, Falmer: IDS, University of Sussex. Devereux, S. (2001b), Social Pensions in Namibia and South Africa, IDS Discussion Paper 379, Falmer: IDS. Diamond, C. A.; C. J. Simon and J. T. Warner (1999), A Multinomial Probability Model of Size Income Distribution, Journal of Econometrics, 43, 43-61. Dieden, S. (2003), Levels of poverty and income sources among South African households - a multinomial approach, mimeo. Duflo, E. (2000), Grandmothers and granddaughters: old age pension and intra-household allocation in South Africa, Working Paper 8061, Cambridge MA: National Bureau of Economic Research. Edmonds, E.; K. Mammen and D. Miller (2001), Rearranging the family? Household composition responses to large pension receipts, mimeo, Hanover NH: Darmouth College.

19
Ferreira, M. (1999), The generosity and universality of South Africa's pension system, The EU Courier, 176. Foster, J. E.; J. Greer and E. Thorbecke (1984), A class of decomposable poverty measures, Econometrica, 52, (3), 761-766. Fultz, E. and B. Pieris (1999), Social Security Schemes in Southern Africa, Discussion Paper 11, Geneva: ILO/SAMAT. Glewwe, P. (1991), Investigating the determinants of household welfare in Côte d'Ivoire, Journal of Development Economics, 35, 307-337. James, E. (2001), Coverage under Old Age Social Security Programs and Protection for the Uninsured: What are the Issues?, in N. C. Lustig (ed.) Shielding the Poor. Social Protection in the Developing World, Washington DC: Brookings Institution Press and InterAmerican Development Bank, 149-174. Jensen, R. (2002), Do private transfers 'displace' the benefits of public tranfers? Evidence from South Africa, Journal of Public Economics, in print. Kanbur, R. (2002), Conceptual challenges in poverty and inequality: One development economist's perspective, mimeo, Ithaca: Cornell University. Klasen, S. (2000), Measuring poverty and deprivation in South Africa, Review of Income and Wealth, 46, (1), 33-58. Leibbrandt, M. (2001), Household incomes, poverty and inequality in a multivariate framework, in H. Bhorat; M. Leibbrandt; M. Maziya; S. van der Berg and I. Woolard (eds.), Fighting poverty. Labour markets and inequality in South Africa, Cape Town: UCT Press, 130-154. Lund, F. (1993), State social benefits in South Africa, International Social Security Review, 46, (1), 5-25. Lund, F. (1995), Changing social policy in South Africa, Social Policy Review, 7. Lund, F. (1999), Understanding South African social security through recent household surveys: new opportunities and continuing gaps, Development Southern Africa, 16, (1), 55-67. Lund, F. (2002), 'Crowding in' care, security, and macro-enterprise formation - revisiting the role of the state in poverty reduction, and in development, Journal of International Development, 14, (6), 681-694. May, J. (2000), Poverty and inequality in South Africa: Meeting the challenge, London: Zed Books. May, J.; I. Woolard and S. Klasen (2000), The nature and measurement of poverty and inequality, in J. May (ed.) Poverty and inequality in South Africa: Meeting the challenge, London: Zed Press.
20
Møller, V. and Sotshangaye (1996), "My family eats this money too": pension sharing and self-respect among Zulu grandmothers, Southern African Journal of Gerontology, 5, (2), 9-19. Saad, P. M. (1999), Transferências de apoio entre geracões do Brasil: um studio para São Paulo e Fortaleza, in A. Caramano (ed.) Muito além dos 60. Os novos odiosos brasilieros, Rio de Janeiro: IPEA. Sagner, A. and R. Mtati (1999), Politics of pension sharing in urban South Africa, Ageing and Society, 19, (4), 393-416. Schwarzer, H. (2000), Impactos socioeconômicos do sistema de aposentadorias rurais no Brazil - Evidências empíricas de un estudio de caso no estado de Pará, Discussion Paper 729, Rio de Janeiro: IPEA. Schwarzer, H. and A. C. Querino (2002), Non-contributory pensions in Brazil: The impact on poverty reduction, ESS Paper 11, Geneva: Social Security Policy and Development Branch. ILO. Treas, J. and B. Logue (1976), Economic Develoment and the Older Population, Population and Development Review, 12, 645-673. van der Berg, S. (2001), Social policy to address poverty, in H. Bhorat; M. Leibbrandt; M. Maziya; S. van der Berg and I. Woolard (eds.), Fighting poverty. Labour markets and inequality in South Africa, London: Zed Press, 171-204. Weaver, K. R. (2003), The Politics of Public Pension Reform, CRR Working Paper CRR WP 2003-06, Chestnut Hill, MA: Center for Retirement Research at Boston College. Werneck Vianna, M. L. T. (2003), Seguridade social e combate à pobreza no Brazil: O papel dos beneficios não-contributivos, mimeo, Rio de Janeiro: Universidade Federal do Rio de Janeiro. Willmore, L. (2001), Universal Pensions in Low-Income Countries, mimeo, Washington DC: Department for Economics and Social Affairs, United Nations. Willmore, L. (2003), Universal pensions in Mauritius: Lessons for the rest of us, DESA Discussion Paper 32, New York: United Nations Department of Economic and Social Affairs. Woolard, I. and S. Klasen (2003), Income Mobility and Household Dynamics in South Africa, Conference Paper - CPRC Conference on 'Staying Poor: Chronic Poverty and Development Policy', Manchester: IDPM, University of Manchester. Woolard, I. and M. Leibbrandt (2001), Measuring poverty in South Africa, in H. Bhorat; M. Leibbrandt; M. Maziya; S. van der Berg and I. Woolard (eds.), Fighting poverty. Labour markets and inequality in South Africa, Cape Town: UCT Press, 41-73.

21
World Bank (1994), Averting the Old Age Crisis, London: Oxford University Press. World Bank (2002), World Development Indicators 2002, Washington DC: The World Bank.