Embed Size (px)
Citation preview
WHAT IS HOT IN GPC
1
Sue D’Antonio

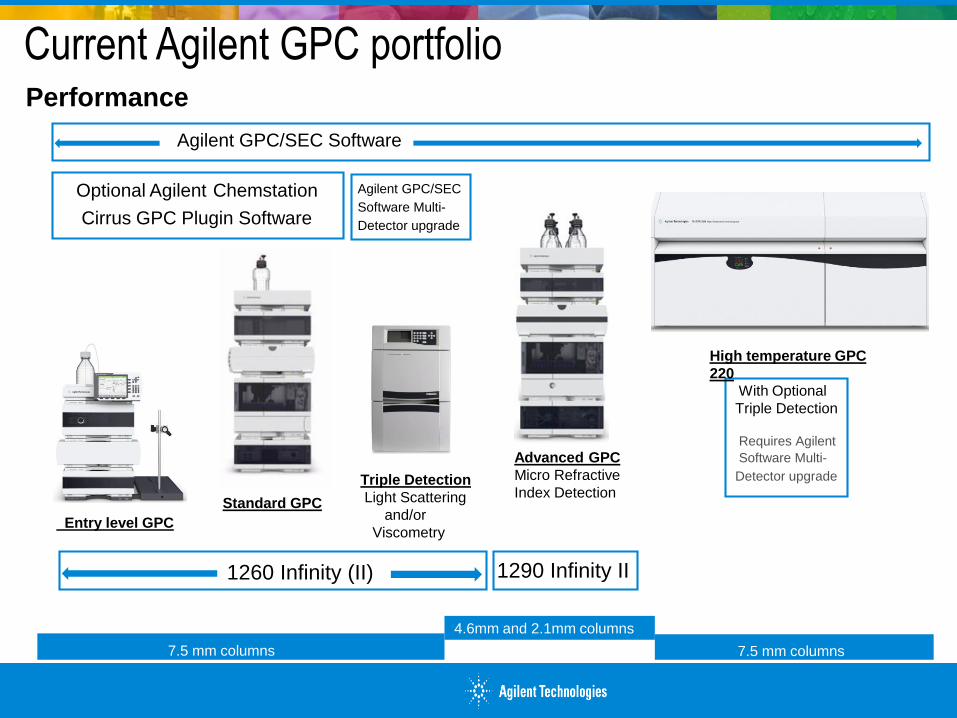
7.5 mm columns
Agilent GPC/SEC Software
Agilent GPC/SEC
Software Multi-
Detector upgrade
Performance
Current Agilent GPC portfolio
Standard GPC
Triple Detection
Light Scattering
and/or
ViscometryEntry level GPC
4.6mm and 2.1mm columns
7.5 mm columns
Advanced GPC
Micro Refractive
Index Detection
1290 Infinity II 1260 Infinity (II)
High temperature GPC
220
With Optional
Triple Detection
Requires Agilent
Software Multi-
Detector upgrade
Optional Agilent Chemstation
Cirrus GPC Plugin Software
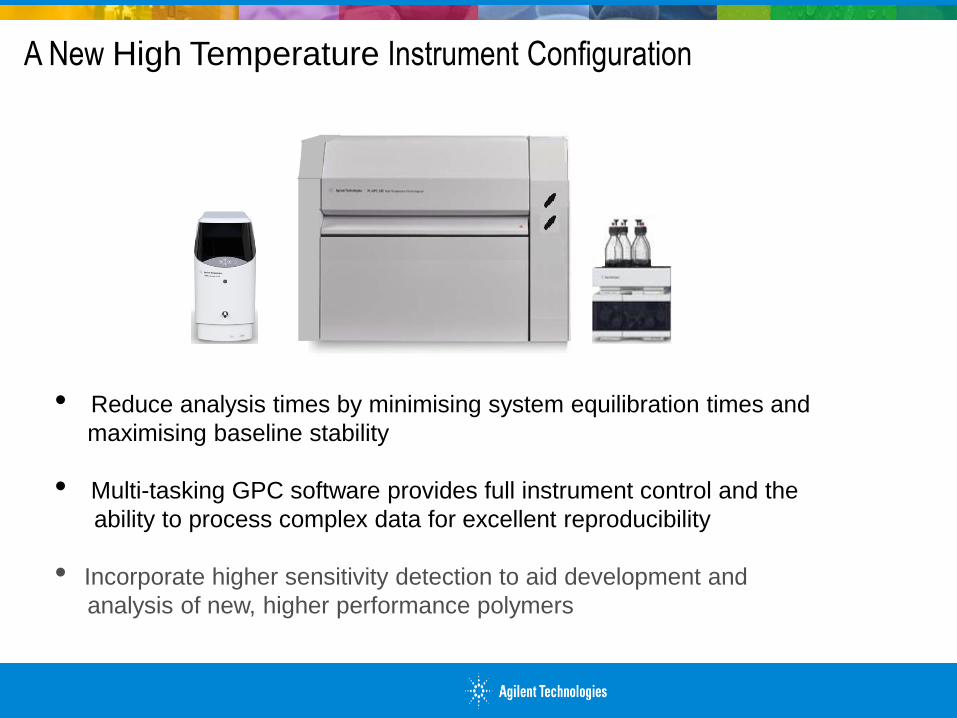
A New High Temperature Instrument Configuration
• Reduce analysis times by minimising system equilibration times and
maximising baseline stability
• Multi-tasking GPC software provides full instrument control and the
ability to process complex data for excellent reproducibility
• Incorporate higher sensitivity detection to aid development and
analysis of new, higher performance polymers
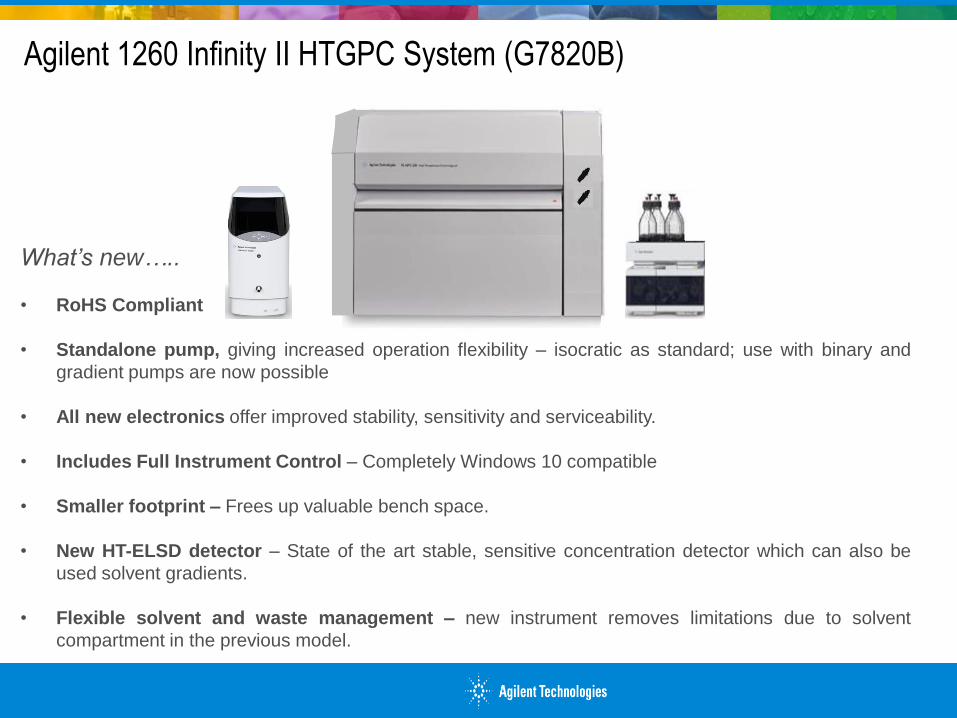
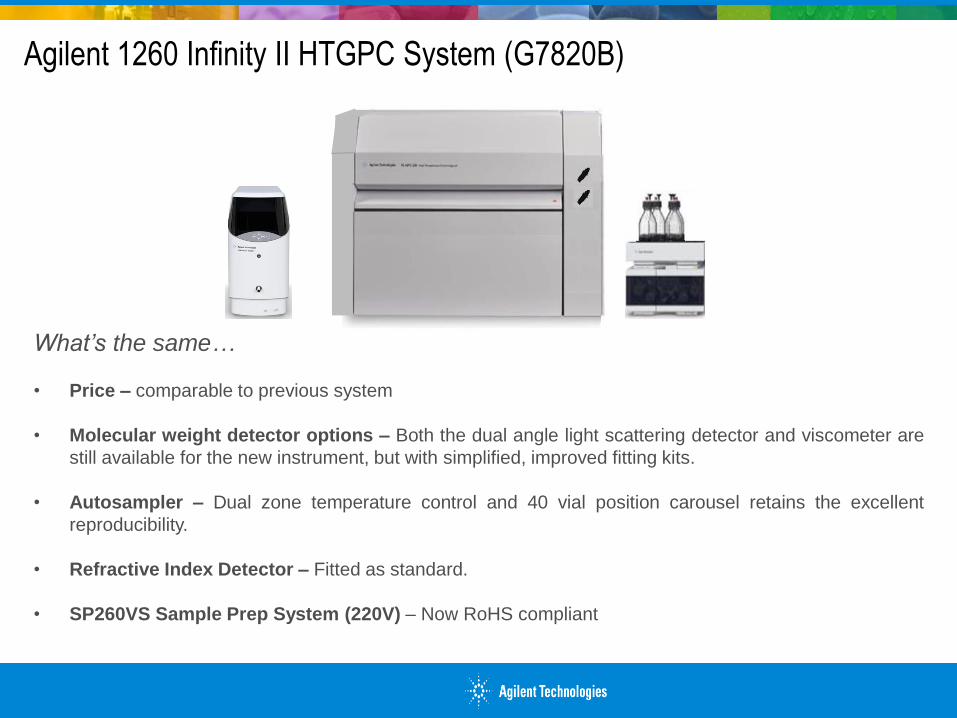
Agilent 1260 Infinity II HTGPC System (G7820B)
What’s new…..
• RoHS Compliant
• Standalone pump, giving increased operation flexibility – isocratic as standard; use with binary and
gradient pumps are now possible
• All new electronics offer improved stability, sensitivity and serviceability.
• Includes Full Instrument Control – Completely Windows 10 compatible
• Smaller footprint – Frees up valuable bench space.
• New HT-ELSD detector – State of the art stable, sensitive concentration detector which can also be
used solvent gradients.
• Flexible solvent and waste management – new instrument removes limitations due to solvent
compartment in the previous model.
Agilent 1260 Infinity II HTGPC System (G7820B)
What’s the same…
• Price – comparable to previous system
• Molecular weight detector options – Both the dual angle light scattering detector and viscometer are
still available for the new instrument, but with simplified, improved fitting kits.
• Autosampler – Dual zone temperature control and 40 vial position carousel retains the excellent
reproducibility.
• Refractive Index Detector – Fitted as standard.
• SP260VS Sample Prep System (220V) – Now RoHS compliant
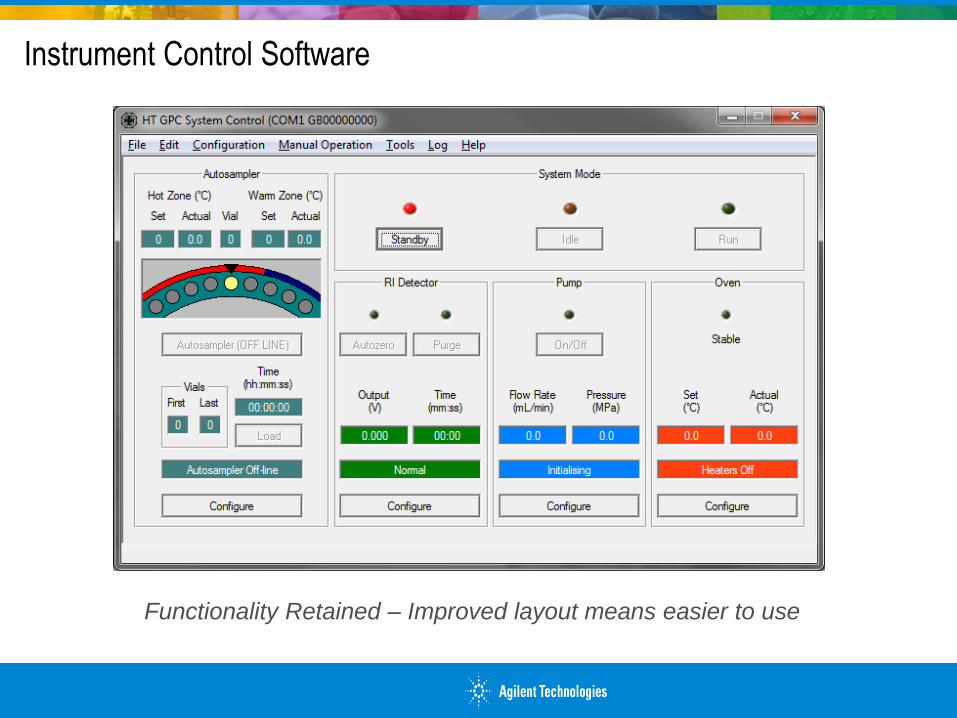
Instrument Control Software
Functionality Retained – Improved layout means easier to use
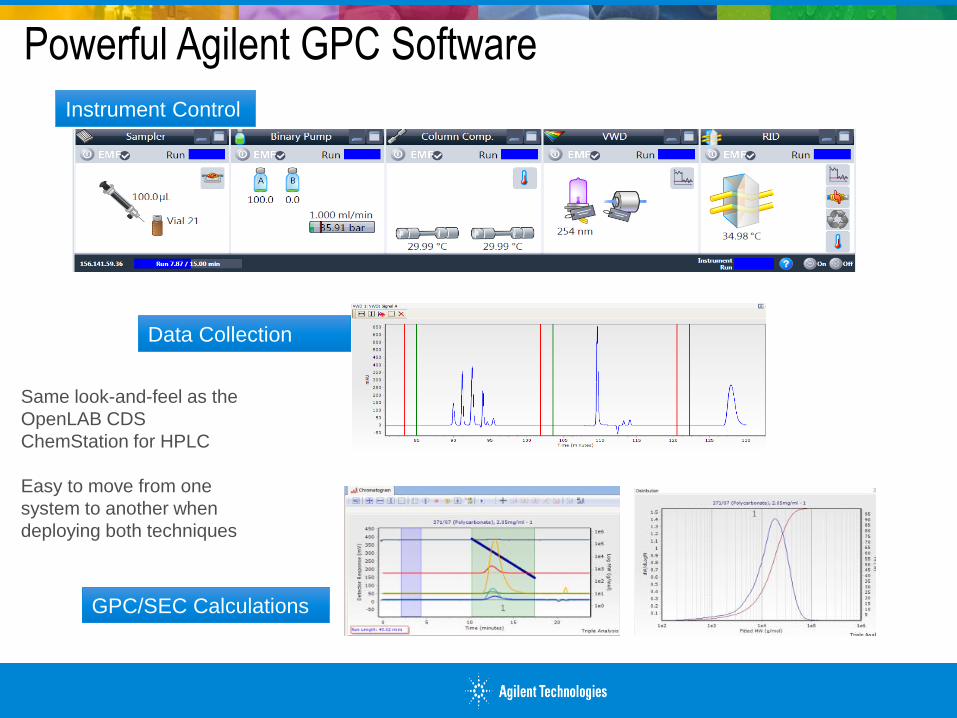
Instrument Control
Data Collection
GPC/SEC Calculations
Same look-and-feel as the
OpenLAB CDS
ChemStation for HPLC
Easy to move from one
system to another when
deploying both techniques
Powerful Agilent GPC Software
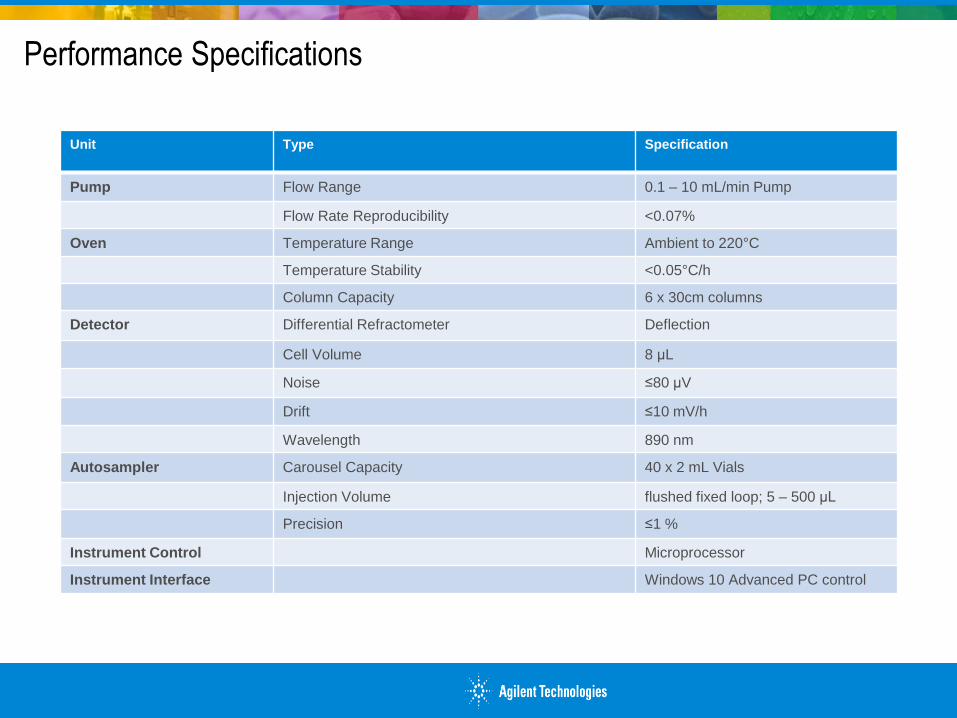
Performance Specifications
Unit Type Specification
Pump Flow Range 0.1 – 10 mL/min Pump
Flow Rate Reproducibility <0.07%
Oven Temperature Range Ambient to 220°C
Temperature Stability <0.05°C/h
Column Capacity 6 x 30cm columns
Detector Differential Refractometer Deflection
Cell Volume 8 μL
Noise ≤80 μV
Drift ≤10 mV/h
Wavelength 890 nm
Autosampler Carousel Capacity 40 x 2 mL Vials
Injection Volume flushed fixed loop; 5 – 500 μL
Precision ≤1 %
Instrument Control Microprocessor
Instrument Interface Windows 10 Advanced PC control
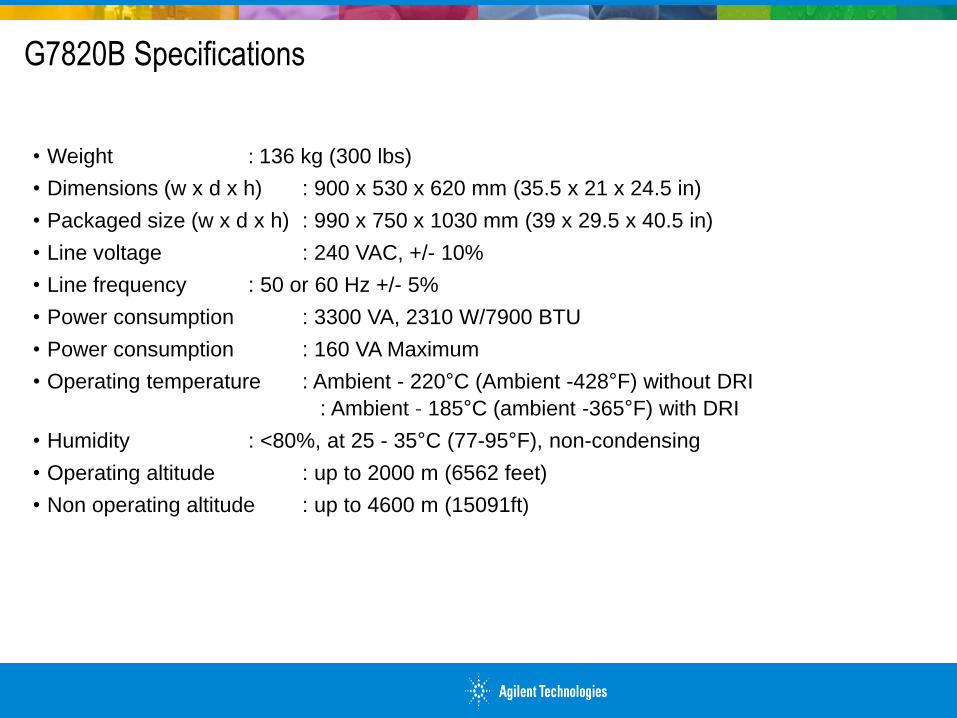
G7820B Specifications
• Weight : 136 kg (300 lbs)
• Dimensions (w x d x h) : 900 x 530 x 620 mm (35.5 x 21 x 24.5 in)
• Packaged size (w x d x h) : 990 x 750 x 1030 mm (39 x 29.5 x 40.5 in)
• Line voltage : 240 VAC, +/- 10%
• Line frequency : 50 or 60 Hz +/- 5%
• Power consumption : 3300 VA, 2310 W/7900 BTU
• Power consumption : 160 VA Maximum
• Operating temperature : Ambient - 220°C (Ambient -428°F) without DRI
: Ambient - 185°C (ambient -365°F) with DRI
• Humidity : <80%, at 25 - 35°C (77-95°F), non-condensing
• Operating altitude : up to 2000 m (6562 feet)
• Non operating altitude : up to 4600 m (15091ft)
Agilent Material Seminar 2016
July 12/15 2016
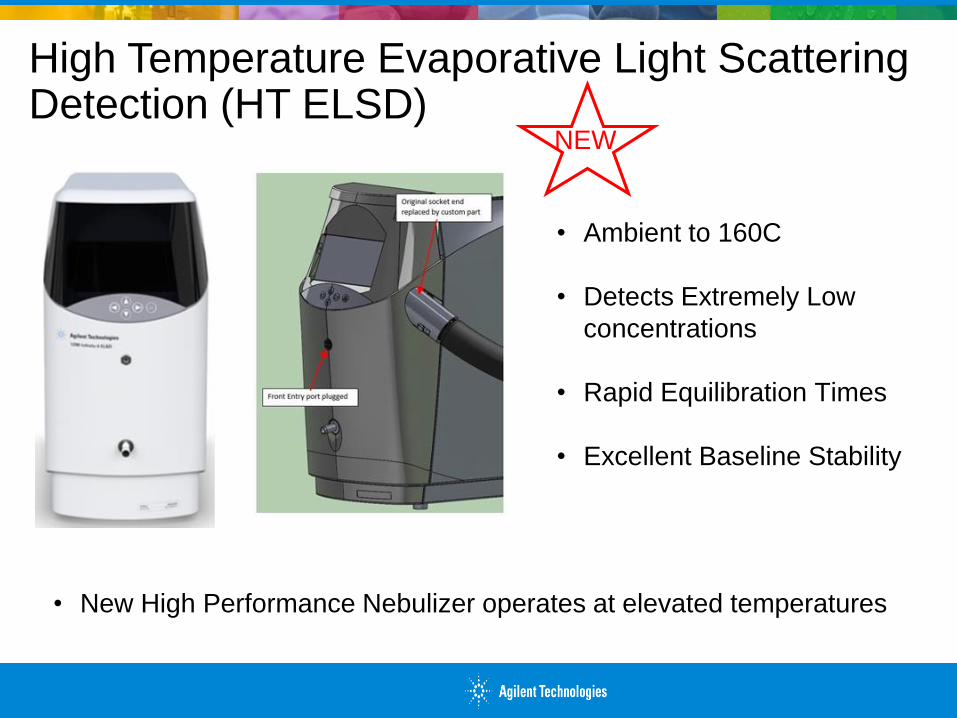
High Temperature Evaporative Light Scattering Detection (HT ELSD)
NEW
• New High Performance Nebulizer operates at elevated temperatures
• Ambient to 160C
• Detects Extremely Low
concentrations
• Rapid Equilibration Times
• Excellent Baseline Stability
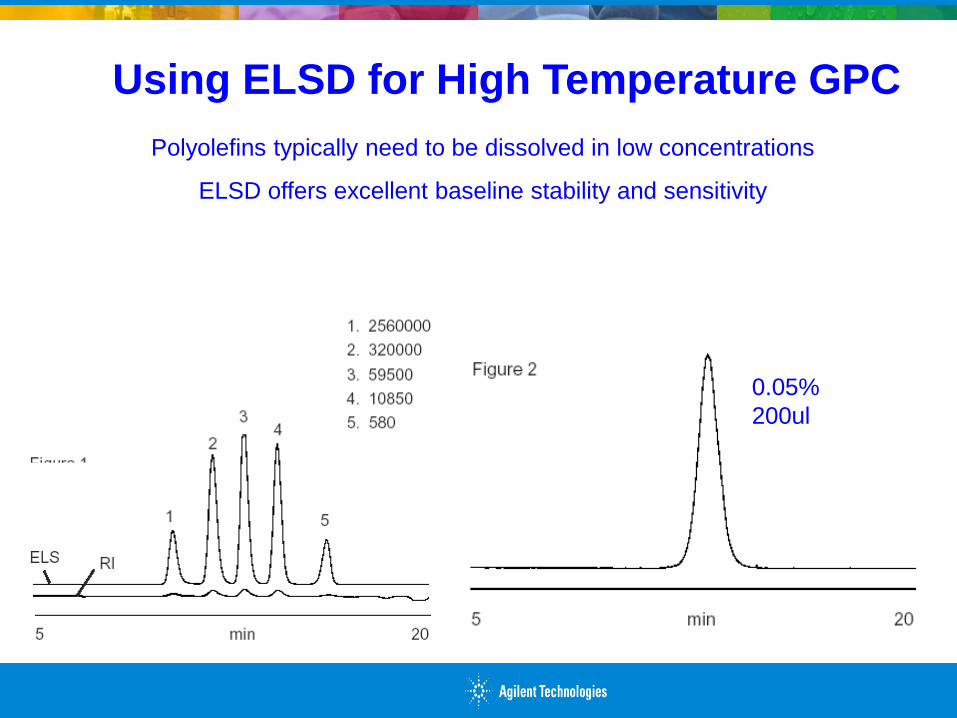
Using ELSD for High Temperature GPC
Polyolefins typically need to be dissolved in low concentrations
ELSD offers excellent baseline stability and sensitivity
0.05%
200ul
Agilent Material Seminar 2016
July 12/15 2016
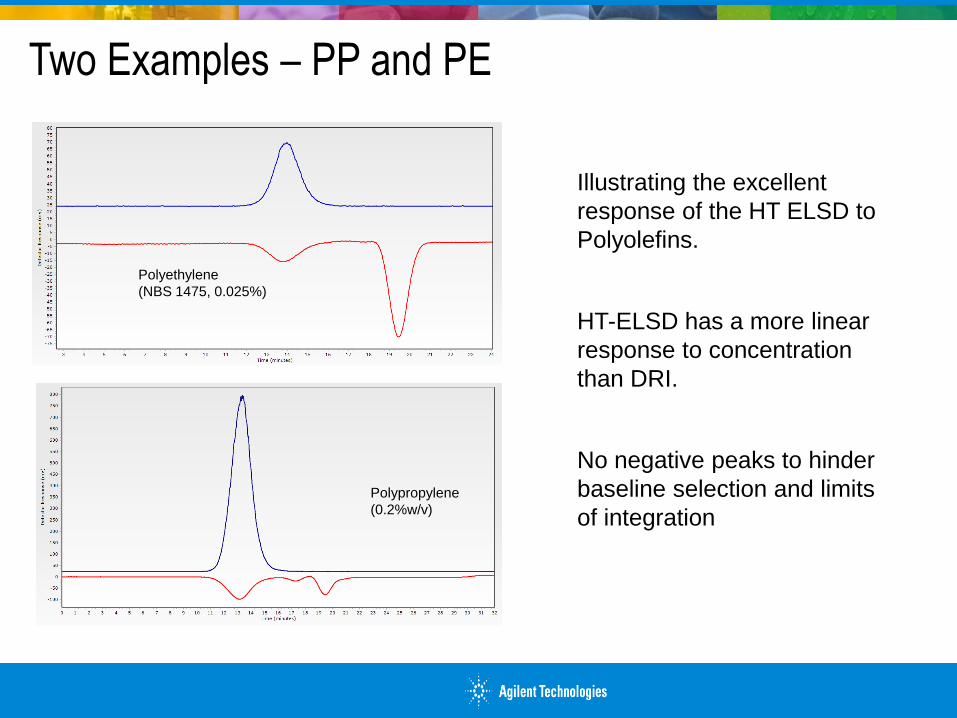
Polyethylene
(NBS 1475, 0.025%)
Polypropylene
(0.2%w/v)
Two Examples – PP and PE
Illustrating the excellent
response of the HT ELSD to
Polyolefins.
HT-ELSD has a more linear
response to concentration
than DRI.
No negative peaks to hinder
baseline selection and limits
of integration
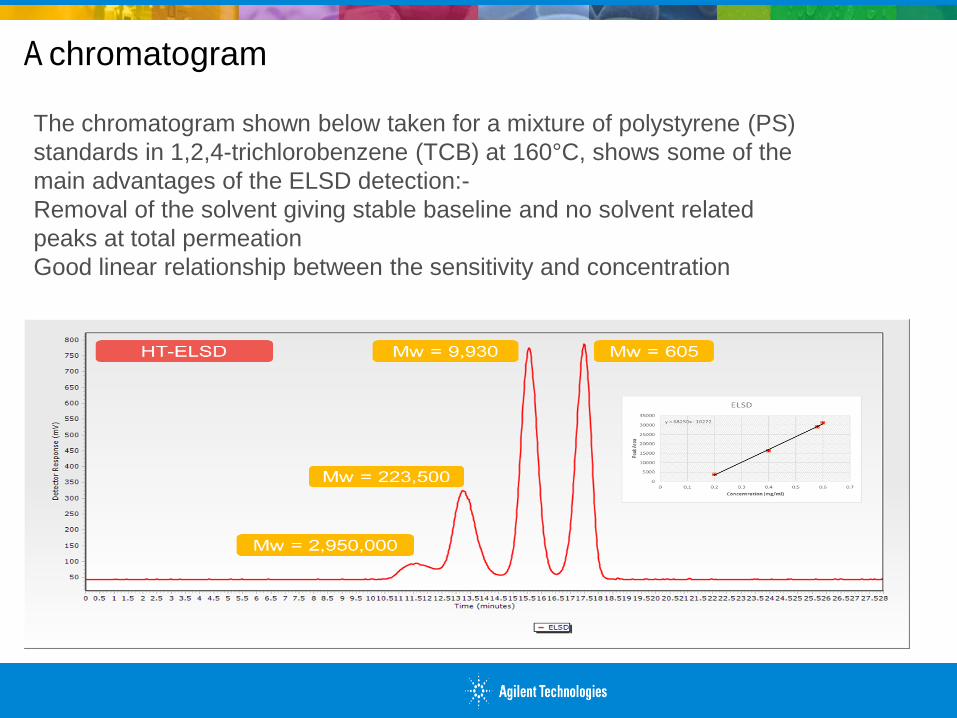
A chromatogram
The chromatogram shown below taken for a mixture of polystyrene (PS)
standards in 1,2,4-trichlorobenzene (TCB) at 160°C, shows some of the
main advantages of the ELSD detection:-
Removal of the solvent giving stable baseline and no solvent related
peaks at total permeation
Good linear relationship between the sensitivity and concentration
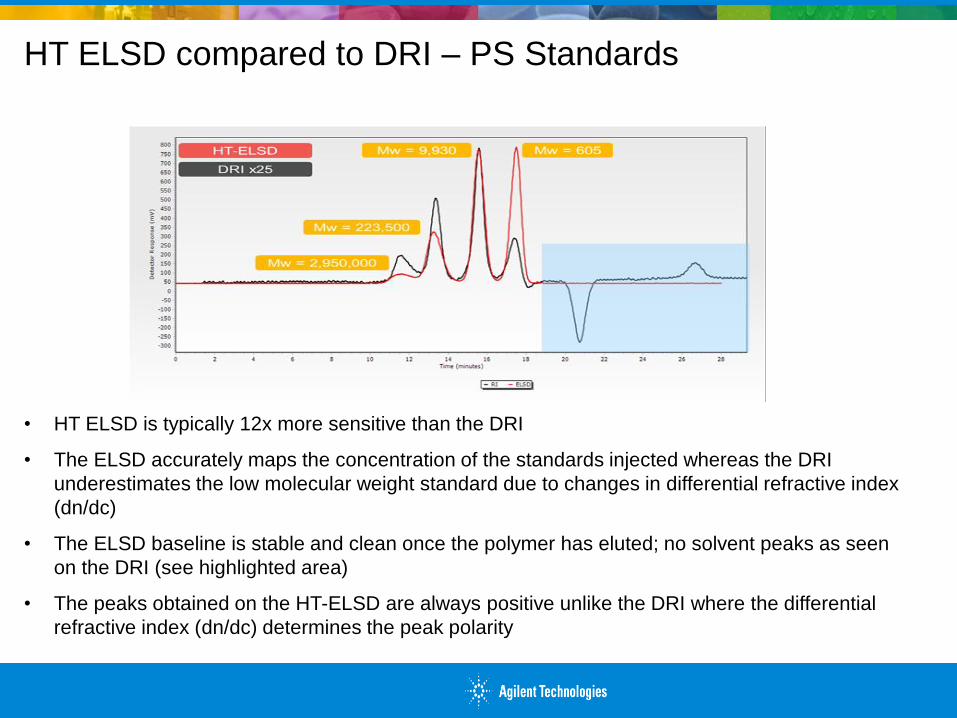
HT ELSD compared to DRI – PS Standards
• HT ELSD is typically 12x more sensitive than the DRI
• The ELSD accurately maps the concentration of the standards injected whereas the DRI
underestimates the low molecular weight standard due to changes in differential refractive index
(dn/dc)
• The ELSD baseline is stable and clean once the polymer has eluted; no solvent peaks as seen
on the DRI (see highlighted area)
• The peaks obtained on the HT-ELSD are always positive unlike the DRI where the differential
refractive index (dn/dc) determines the peak polarity
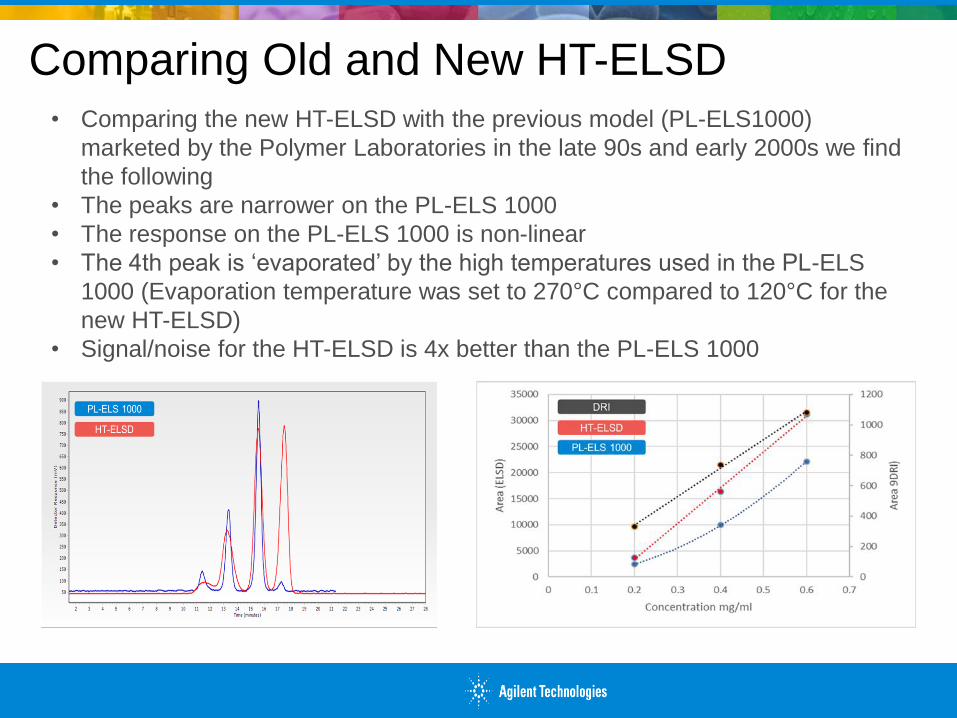
• Comparing the new HT-ELSD with the previous model (PL-ELS1000)
marketed by the Polymer Laboratories in the late 90s and early 2000s we find
the following
• The peaks are narrower on the PL-ELS 1000
• The response on the PL-ELS 1000 is non-linear
• The 4th peak is ‘evaporated’ by the high temperatures used in the PL-ELS
1000 (Evaporation temperature was set to 270°C compared to 120°C for the
new HT-ELSD)
• Signal/noise for the HT-ELSD is 4x better than the PL-ELS 1000
Comparing Old and New HT-ELSD
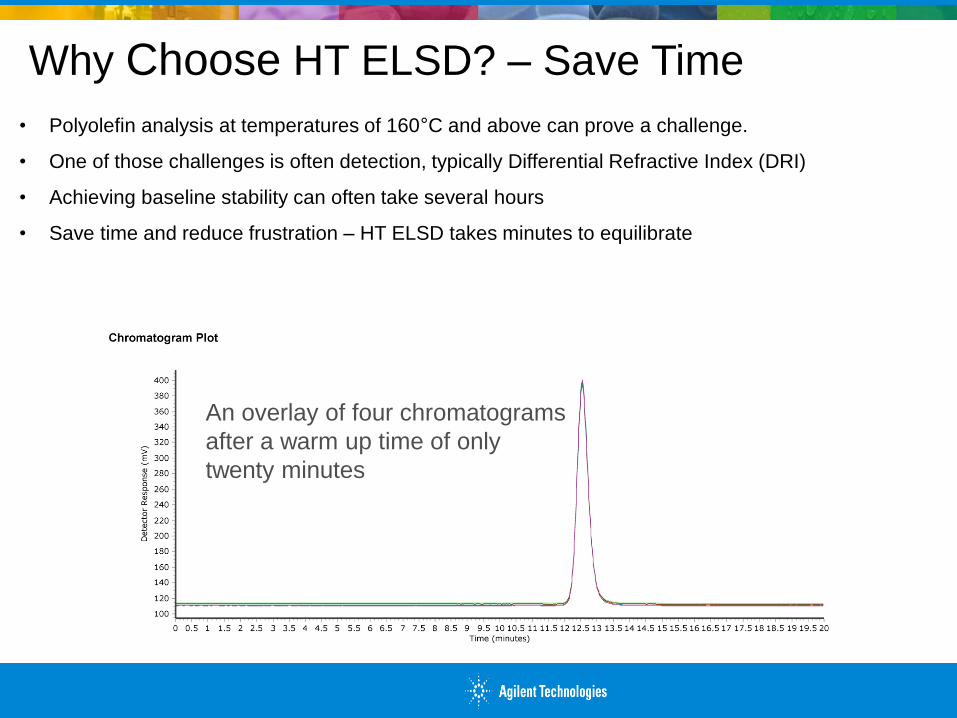
• Polyolefin analysis at temperatures of 160°C and above can prove a challenge.
• One of those challenges is often detection, typically Differential Refractive Index (DRI)
• Achieving baseline stability can often take several hours
• Save time and reduce frustration – HT ELSD takes minutes to equilibrate
Why Choose HT ELSD? – Save Time
An overlay of four chromatograms
after a warm up time of only
twenty minutes
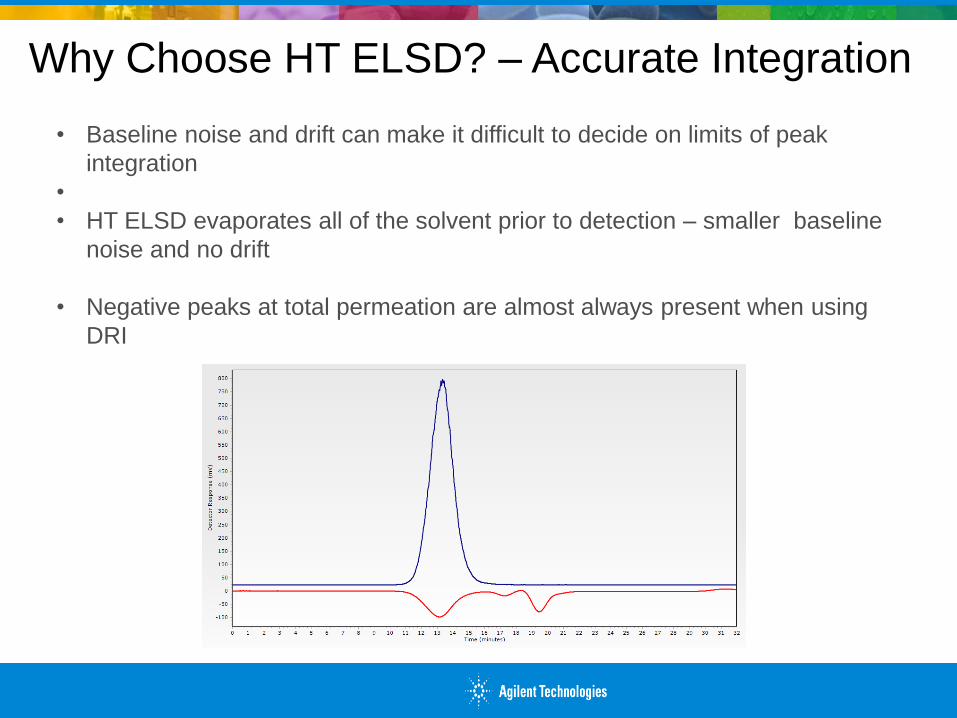
Why Choose HT ELSD? – Accurate Integration
• Baseline noise and drift can make it difficult to decide on limits of peak
integration
•
• HT ELSD evaporates all of the solvent prior to detection – smaller baseline
noise and no drift
• Negative peaks at total permeation are almost always present when using
DRI
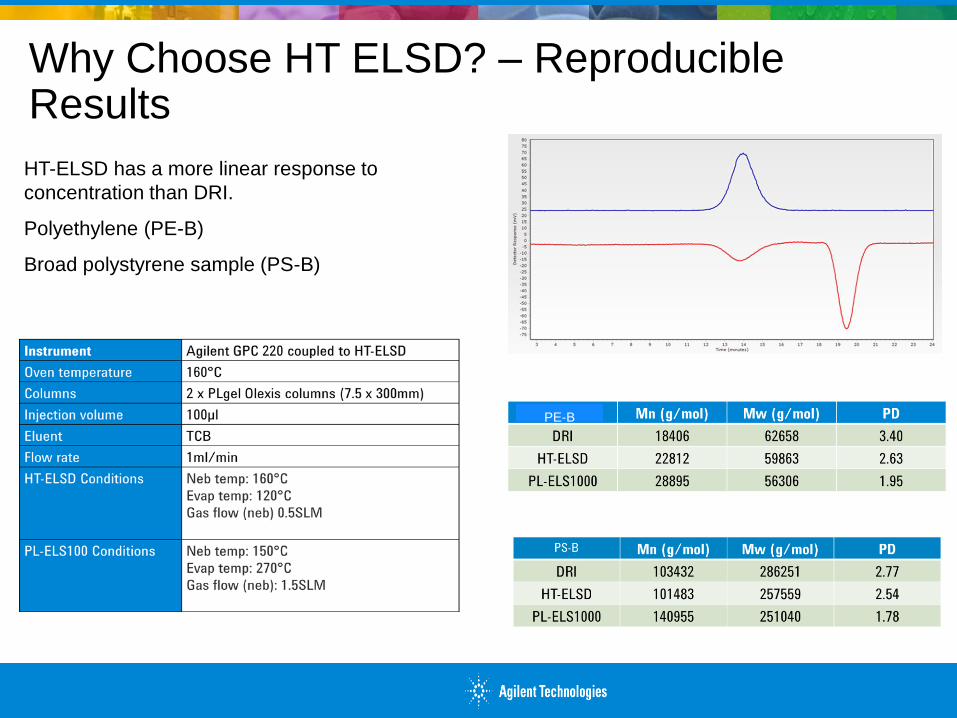
Why Choose HT ELSD? – Reproducible Results
HT-ELSD has a more linear response to
concentration than DRI.
Polyethylene (PE-B)
Broad polystyrene sample (PS-B)
PE-B
Why Choose HT ELSD? - UHMWPE
• Very broad distribution
• Low concentrations at both low and high molecular weight
• Low dn/dc (differential refractive index) of the polymer/solvent combination
• Low sample concentration needed to eliminate potential viscosity and
overloading issues
In this case the high sensitivity of ELSD makes the detector ideal for low
dn/dc polymer/solvent combinations and also gives a positive response for all
non-volatile solutes.
Availability of a high temperature ELSD would offer considerable advantages
when looking at such types of polymer. In this presentation we introduce a
new HTELSD in development and evaluate the advantages it will bring to the
analysis of UHMWPE.
Summary
The new HT-ELSD demonstrates some great advantages for use as a concentration
detector for high temperature GPC and the analysis of polyolefin including:-
• Superior sensitivity compared to a DRI, making it preferable for UHMWPE samples
that require very low concentration for dissolution and analysis
• Stable baseline, the removal of solvent peaks, and suitability for high temperature
gradient chromatography
• Improved linearity and integrity in the determination of molecular weights due to the
lower operating temperatures
• Unlike DRI, there is the possibility to run solvent gradients at elevated temperatures.
GPC for OpenLAB CDSAt-a-glance
A modern, compliant, scalable GPC/SEC solution
Provides conventional GPC/SEC functionality
Fully integrates into OpenLAB CDS (v2.2 or above)
Able to process any concentration detector signal collected or imported into OpenLAB CDS
GPC for OpenLAB CDS
Key Features
Processing Method Development
Create / Modify a GPC processing method
GPC Calibration
Generate a new GPC calibrations
Review an existing GPC calibration
GPC Analysis
Generate new GPC results
Review existing GPC results
Generating Reports
Generate a GPC report from results
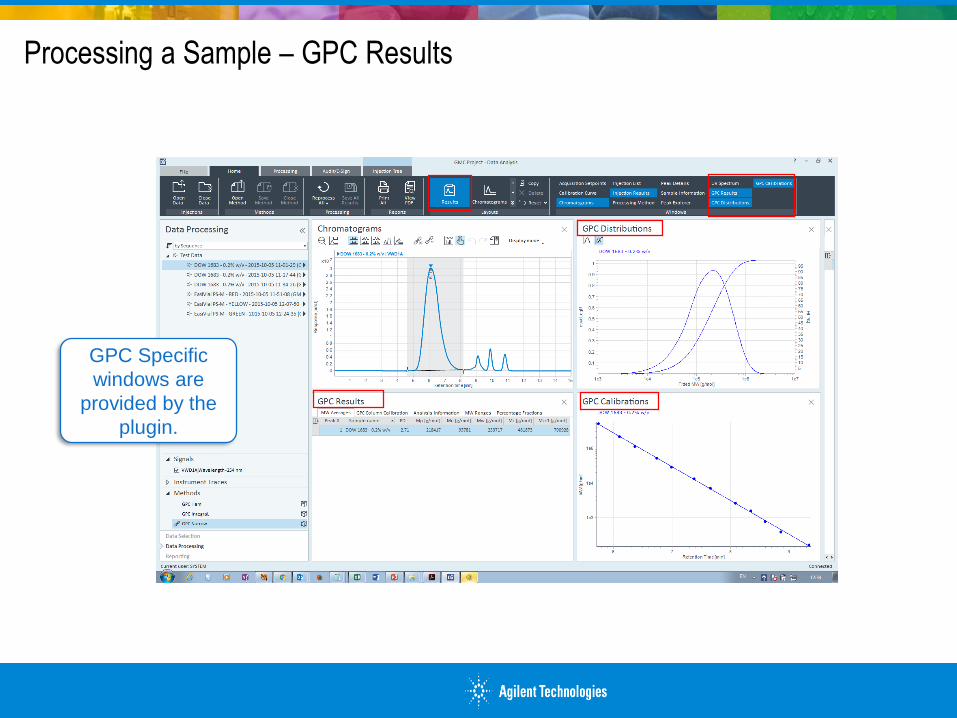
Processing a Sample – GPC Results
GPC Specific
windows are
provided by the
plugin.
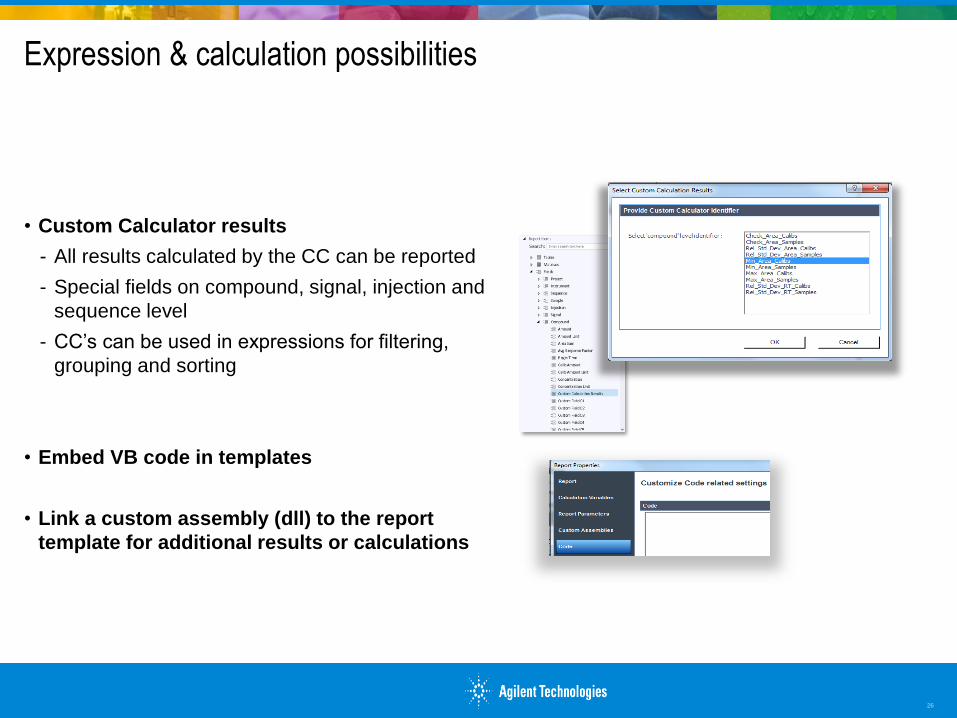
Expression & calculation possibilities
• Custom Calculator results
- All results calculated by the CC can be reported
- Special fields on compound, signal, injection and
sequence level
- CC’s can be used in expressions for filtering,
grouping and sorting
• Embed VB code in templates
• Link a custom assembly (dll) to the report
template for additional results or calculations
26

GPC Master Class coming to our town
Week of September 11, 2017 at the
Quantum site in the Woodlands