Embed Size (px)
Citation preview
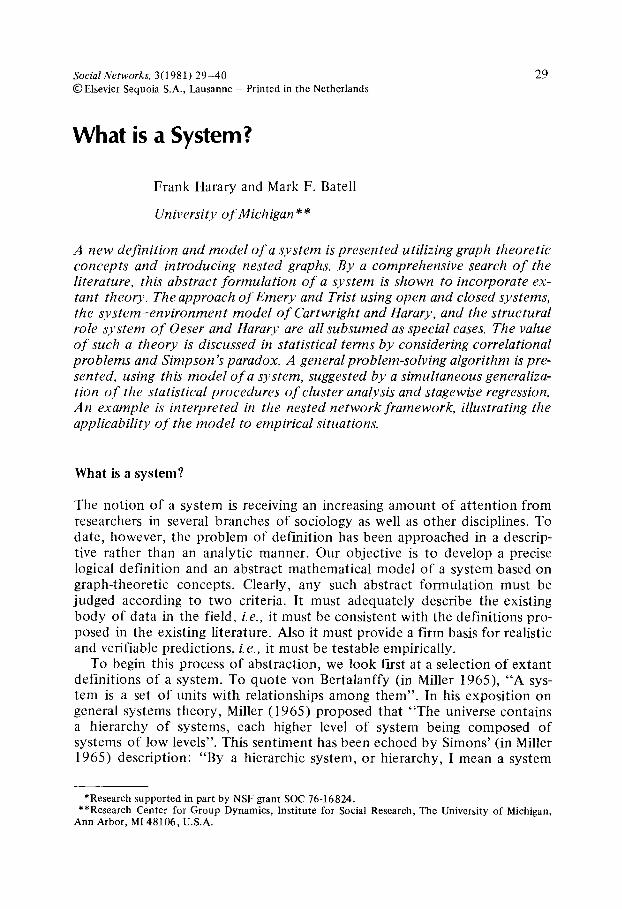
Social Networks, 3(1981) 29-40
@Elsevier Sequoia S.A., Lausanne - Printed in the Netherlands
25,
What is a System?
Frank Harary and Mark F. Bate11
University of Michigan **
A new definition and model of a system is presented utilizing graph theoretic concepts and introducing nested graphs. By a comprehensive search of the literature, this abstract formulation of a system is shown to incorporate ex- tant theory. The approach of Emery and Trist using open and closed systems, the system-environment model of Cartwright and Harary, and the structural role system of Oeser and Harary are all subsumed as special cases. The value of such a theory is discussed in statistical terms by considering correlational problems and Simpson’s paradox. A general problem-solving algorithm is pre- sented, using this model of a system, suggested by a simultaneous generaliza- tion of the statistical procedures of cluster analysis and stagewise regression. An example is interpreted in the nested network framework, illustrating the applicability of the model to empirical situations.
What is a system?
The notion of a system is receiving an increasing amount of attention from researchers in several branches of sociology as well as other disciplines. To date, however, the problem of definition has been approached in a descrip- tive rather than an analytic manner. Our objective is to develop a precise logical definition and an abstract mathematical model of a system based on graph-theoretic concepts. Clearly, any such abstract formulation must be judged according to two criteria. It must adequately describe the existing body of data in the field, i.e., it must be consistent with the definitions pro- posed in the existing literature. Also it must provide a firm basis for realistic and verifiable predictions, i.e., it must be testable empirically.
To begin this process of abstraction, we look first at a selection of extant definitions of a system. To quote von Bertalanffy (in Miller 1965), “A sys- tem is a set of units with relationships among them”. In his exposition on general systems theory, Miller (1965) proposed that “The universe contains a hierarchy of systems, each higher level of system being composed of systems of low levels”. This sentiment has been echoed by Simons’ (in Miller 1965) description: “By a hierarchic system, or hierarchy, I mean a system
*Research supported in part by NSF grant SOC 76-16824. **Research Center for Group Dynamics, Institute for Social Research, The University of Michigan,
Ann Arbor, MI 48106, U.S.A.

30 b1 Hararlj and M. I? Bate11
that is composed of interrelated subsystems, each of the latter being, in turn, hierarchic in structure until we reach some lowest level of elementary sub- system”. On the other hand, McConnell (1977) states, “Anything that is it- self alive - or that is made up of living things - can be thought of as a living system of some kind. You are alive; so you are a living system. But your fam- ily is made up of living organisms, hence your family is also considered a living system”.
In each of the ideas presented above, two common themes emerge. First, all conceptions of ‘system’ involve a set of units and their interrelationships. Since any binary relation has a natural representation as a graph or digraph, the points being the units (people, groups, or larger aggregations) and the lines the relations between them, a graph-theoretic approach immediately suggests itself. Secondly, systems are viewed in all of the above quotations as possessing a hierarchical or nested structure. These two ideas are precisely the motivating forces of our approach.
Following Harary ( 1969), a graph consists of a finite nonempty collection of objects called points (or vertices) together with a collection of unordered pairs of points called &es (or edges). Letting the points represent people and the lines stand for recognized genealogical relationships, we obtain a conve- nient diagrammatic expression for a kinship system. A diugraph is a set of points, with ordered pairs of points called urcs. A communication system can be illustrated with digraphs by letting the points stand for people and the arcs for the flow of interpersonal communication. By attaching a positive or negative sign to each line of a graph, a signed graph is obtained. Signed graphs have been fruitfully utilized in a representation of Heider’s balance theory in an interpersonal relations system. In addition to the three examples of the types of graphs mentioned above, we allow any combination of these types in a single model which we group under the generic term ‘graph’.
To accommodate the desired hierarchical structure we define a ‘nested graph’ in which the points of a graph at a given level are graphs of lower levels.
This notion of hierarchically nested structure is prevalent throughout the literature. In Table 1 we have present a few illustrations indicative of the range and variety of the occurrence of this idea.
The theory of sets provides an exceptionally clear picture of this type of structure. In his pioneering work, Bertrand Russell was prompted to endow sets with a similar structure to avoid the ‘Spanish barber paradox’. (In a cer- tain small Spanish town, usually called Seville, the only barber shaves all those and only those people who do not shave themselves. Who shaves the barber?) Russell developed the theory of types of sets to resolve in general all paradoxes of this type. According to Russell:
A set of type 0 is just a single element of a nonempty set of elements U, V f..> > .‘.> sometimes called points.
A set of type 1 is a nonempty set of points, i.e., of sets of type 0. A set of type 2 is a nonempty set whose elements are sets of type 1. In general, the members of a set of type i are themselves sets of type i - 1.

Tab
le 1
. Ex
ampl
es o
f a
nest
ed s
truc
ture
Lev
els
Phys
ics
Bio
logy
A
stro
nom
y R
usse
ll B
lau(
1977
) M
cCon
nell
(197
7)
Mill
er (
1965
)
0 1 2 3 4 5 6 7 8 9 10
11
12
13
14
quar
ks
part
icle
s at
oms
mol
ecul
es
spec
ies
genu
s fa
mily
or
der
clas
s ph
ylum
ki
ngdo
m
mat
ter
star
s ga
laxi
es
clus
ters
su
perc
lust
ers
O-s
ets
i-se
ts
Z-s
ets
posi
tions
co
mm
unity
so
ciet
y
cells
or
gans
or
gani
sm
grou
ps
orga
niza
tions
part
icle
s at
oms
mol
ecul
es
crys
tals
an
d or
gane
lles
crys
talli
zing
vi
ruse
s ce
lls
orga
ns a
nd t
issu
es
orga
nism
s
grou
ps
orga
niza
tions
so
ciet
ies
supr
anat
iona
l sy
stem
pl
anet
s so
lar
syst
ems
gala
xies
32 E Harary and M. E Bate11
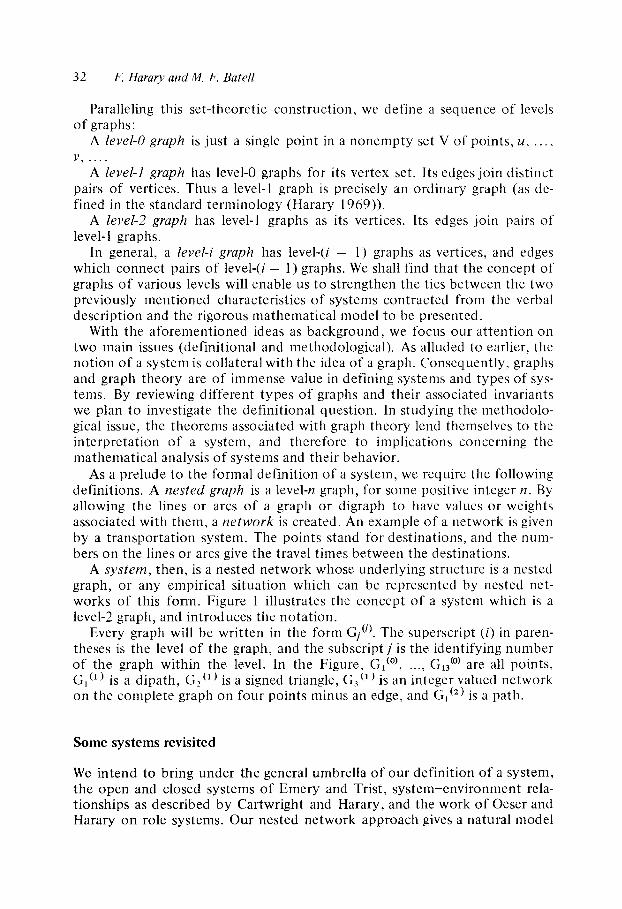
Paralleling this set-theoretic construction, we define a sequence of levels of graphs:
A level-0 graph is just a single point in a nonempty set V of points, u, . . , v, . . . .
A level-1 graph has level-O graphs for its vertex set. Its edges join distinct pairs of vertices. Thus a level-l graph is precisely an ordinary graph (as de- fined in the standard terminology (Harary 1969)).
A level-2 graph has level-l graphs as its vertices. Its edges join pairs of level-l graphs.
In general, a level-i graph has level-(i - 1) graphs as vertices, and edges which connect pairs of level-(i - 1) graphs. We shall find that the concept of graphs of various levels will enable us to strengthen the ties between the two previously mentioned characteristics of systems contracted from the verbal description and the rigorous mathematical model to be presented.
With the aforementioned ideas as background, we focus our attention on two main issues (definitional and methodological). As alluded to earlier, the notion of a system is collateral with the idea of a graph. Consequently, graphs and graph theory are of immense value in defining systems and types of sys- tems. By reviewing different types of graphs and their associated invariants we plan to investigate the definitional question. In studying the methodolo- gical issue, the theorems associated with graph theory lend themselves to the interpretation of a system, and therefore to implications concerning the mathematical analysis of systems and their behavior.
As a prelude to the formal definition of a system, we require the following definitions. A nested graph is a level-n graph, for some positive integer n. By allowing the lines or arcs of a graph or digraph to have values or weights associated with them, a network is created. An example of a network is given by a transportation system. The points stand for destinations, and the num- bers on the lines or arcs give the travel times between the destinations.
A system, then, is a nested network whose underlying structure is a nested graph, or any empirical situation which can be represented by nested net- works of this form. Figure 1 illustrates the concept of a system which is a level-2 graph, and introduces the notation.
Every graph will be written in the form Cl (‘I. The superscript (i) in paren- theses is the level of the graph, and the subscript j is the identifying number of the graph within the level. In the Figure, Gl(0), . . . . G13(0) are all points, G,(l) is a dipath, G, Cl ) is a signed triangle, G3 (I) is an integer valued network on the complete graph on four points minus an edge, and G,(*) is a path.
Some systems revisited
We intend to bring under the general umbrella of our definition of a system, the open and closed systems of Emery and Trist, systern-environment rela- tionships as described by Cartwright and Harary, and the work of Oeser and Harary on role systems. Our nested network approach gives a natural model

What is a system? 33
Figure 1. A level-2 network.
of each of these in a way which emphasizes the common underlying struc- ture.
Emery and Trist (1965) discussed the internal processes of organizations as being handled by a closed-system model. The internal workings of an orga- nization consist of several parts (level-O graphs) and their interrelationships within the whole. This closed system, then, can be represented by a level-l graph in our definitional model. As Emery and Trist noted, often the organi- zational whole had to be related to the environment. These expanded open systems are simply an extension to the higher level-2 graphs within the nest- ed network formulation. In this way, both open and closed systems can be modeled by nested networks.
In a similar manner, the system-environment relationships discussed by Cartwright and Harary (1977) can be expressed in terms of nested networks. There ‘system’ corresponds to a level-l graph. The environment is also a level-l graph in its own right. The relationships between systems and their environments can be considered to be the arcs of the corresponding level-2 graph. Thus, system-environment relations are subsumed under the nested network formulation.
With these general interpretations in mind, we shall explore the role model of Oeser and Harary (1962, 1964) in greater detail according to our system
34 F. Harary and M. t? Bate11
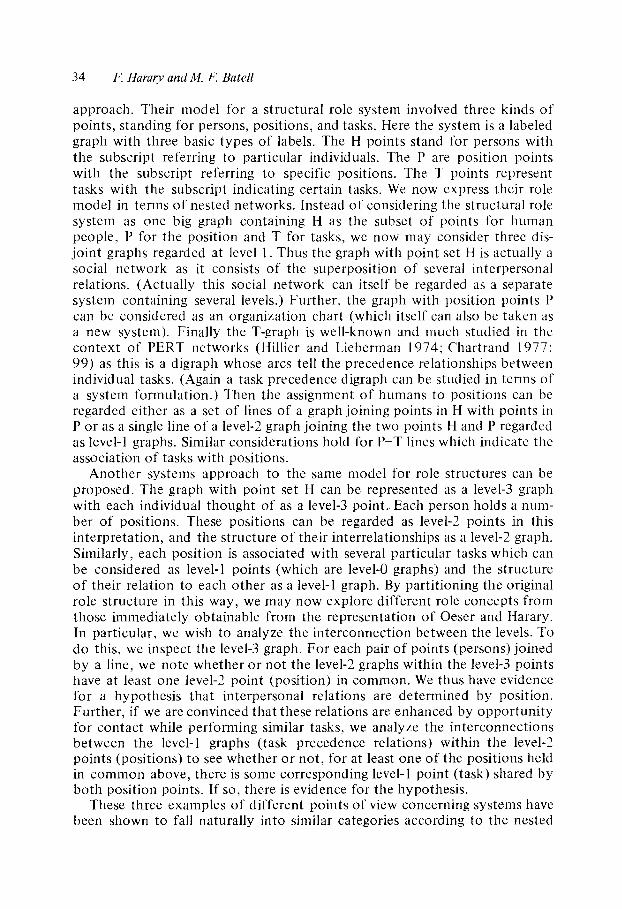
approach. Their model for a structural role system involved three kinds of points, standing for persons, positions, and tasks. Here the system is a labeled graph with three basic types of labels. The H points stand for persons with the subscript referring to particular individuals. The P are position points with the subscript referring to specific positions. The T points represent tasks with the subscript indicating certain tasks. We now express their role model in terms of nested networks. Instead of considering the structural role system as one big graph containing H as the subset of points for human people, P for the position and T for tasks, we now may consider three dis- joint graphs regarded at level 1. Thus the graph with point set H is actually a social network as it consists of the superposition of several interpersonal relations. (Actually this social network can itself be regarded as a separate system containing several levels.) Further, the graph with position points P can be considered as an organization chart (which itself can also be taken as a new system). Finally the T-graph is well-known and much studied in the context of PERT networks (Hillier and Lieberman 1974; Chartrand 1977: 99) as this is a digraph whose arcs tell the precedence relationships between individual tasks. (Again a task precedence digraph can be studied in terms of a system formulation.) Then the assignment of humans to positions can be regarded either as a set of lines of a graph joining points in H with points in P or as a single line of a level-2 graph joining the two points H and P regarded as level-l graphs. Similar considerations hold for P-T lines which indicate the association of tasks with positions.
Another systems approach to the same model for role structures can be proposed. The graph with point set H can be represented as a level-3 graph with each individual thought of as a level-3 point.. Each person holds a num- ber of positions. These positions can be regarded as level-2 points in this interpretation, and the structure of their interrelationships as a level-2 graph. Similarly, each position is associated with several particular tasks which can be considered as level-l points (which are level-O graphs) and the structure of their relation to each other as a level-l graph. By partitioning the original role structure in this way, we may now explore different role concepts from those immediately obtainable from the representation of Oeser and Harary. In particular, we wish to analyze the interconnection between the levels. To do this, we inspect the level-3 graph. For each pair of points (persons) joined by a line, we note whether or not the level-2 graphs within the level-3 points have at least one level-2 point (position) in common. We thus have evidence for a hypothesis that interpersonal relations are determined by position. Further, if we are convinced that these relations are enhanced by opportunity for contact while performing similar tasks, we analyze the interconnections between the level-l graphs (task precedence relations) within the level-2 points (positions) to see whether or not, for at least one of the positions held in common above, there is some corresponding level-l point (task) shared by both position points. If so, there is evidence for the hypothesis.
These three examples of different points of view concerning systems have been shown to fall naturally into similar categories according to the nested

What is a system? 35
network formulation. In each case, the concept of a system in terms of nest- ed graphs has been shown to abstract the underlying structure. This fact helps demonstrate that our model does, in fact, meet the first criterion of judgement in that it accurately describes the existing theory in the field, i.e., it can be made to accommodate the definitions of system used by other re- searchers.
Thus far we have been primarily concerned with concrete systems. Our formulation may be fruitfully applied to the abstract research setting as well. Consider the following research paradigm similar to that of Harary (1971). We begin by defining some primitive concepts (level-O graphs) such as sets of elements and specified binary relations. Axioms (level-l graphs) can be created by combining the primitive concepts in different ways, e.g., transi- tivity, connectivity, antisymmetry, and countability. By manipulating the relationships among the axioms, theorems (level-2 graphs) can be constructed as in measurement theory (Krantz et al. 1971). At this point, empirical phe- nomena may be tested with respect to some theory (level-3 graph) which is concerned with the interrelationships between the theories and the data. If in fact the data do not support the theory, our formulation is of great value in pinpointing the precise location of the failure. Experiments may be run which test each of the theorems separately (a level-2 test). Once a failure at this level is observed, further experiments which test the axioms may be run (level-l tests). In this way, perhaps, violations of the theory may be traced to problems with specific theorems and, even more fundamentally, specific axi- oms.
Some statistical considerations
McConnell (1977) has argued that general systems theory provides us with a good problem solving technology. We shall demonstrate that incorrect con- clusions can be drawn if a stratification into levels is not made. Consider the
Figure 2. Conflicting results of the correlational problem.

36 F: Hurury and M. F. Bate11
following correlational problem depicted in Fig . 7. In this case, the computed correlation of the entire data set produced a perfectly positive result. while when the data are segregated into two subgroups, each subgroup has a per- fectly negative correlation, which is the exact opposite of the previous find- ing.
Similar in idea is the famous Simpson’s paradox which can be expressed mathematically as
&A/B) < P(/I/B’) but &l/K) > P(.4/B’C)
and P(A/BC’) > P(R/B’C’)
In words, the paradox can be paraphrased simply as: The conclusion drawn by considering the data as a whole, can be in marked contrast to the results obtained by an examination of the data separately for some set of subgroups.
From these results we see the implication for a failure to stratify with respect to the important variables, i.e., an insufficient breakdown into nested levels. In many cases, an error of this type can result in conclusions exactly contrary to the true nature of the system under investigation. By consider- ing systems in terms of nested networks. mistakes such as these are avoidable. Herein lies one of the major values of our interpretation, and serves to help fulfill the second criterion of judgement. The nested approach identifies the circumstances under which faulty conclusions, like those mentioned, may occur.
Systematic approach to problem solving
The nested network formulation of a system parallels some accepted statis- tical procedures currently in use. In particular, cluster analysis performs much the same operation on a set of data as would a description in nested graph terms. Stagewise regression is also similar in that it first explains the effect on one level, and then proceeds to the next level below to explain the effect on the residual, and so on. In a sense, these procedures have utilized our interpretation and provided valuable information as a result.
As a direct consequence of the above statistical investigation, an algorith- mic approach to systems analysis suggests itself. In particular, the heuristic is as follows:
( 1) Determine tke target set off the hypothesis. For example, the hypothe- sis that the opportunity for contact, presented by performing similar tasks as part of the requirements of position within a company, promotes social inter- action has certain people as its target set.
(2) Determine the levels in the structure. In our example, there are four levels. First, corresponding to people we have level-O graphs. With their inter- relationships they form level-l graphs. A position can be regarded as a level- 2 point consisting of its holders and their level-l subgraphs. Then the inter- relationships between positions give level-2 graphs. The tasks are level-3
What is a system? 37
points composed of those positions and their level-2 subgraphs needed to perform them. Finally, the interrelationship between the tasks are level-3 graphs.
(3) Analyze the structure of the highest level. In our example, we wish to use graph theory to determine the ‘cohesiveness’ of the tasks (Akiyama et al., to appear). Perhaps other structural features explain the social interaction between people. These other properties merit examination as well. If all social interaction is explained by these structural properties, we need go no further. If not, we proceed to Step (4).
(4) Analyze the structure of the next highest level. In the same manner, we search this next level (position) for a relationship with the hypothesis (social interactions). The procedure is the same as in Step (3), and continues until we reach the lowest level (which is where many procedures begin and end). If there is still no pattern bearing on the hypothesis, the advantage of this formulation becomes apparent.
(5) Examine the interconnection between the levels. Is there structure to the set of relations among particular level-i graphs and level-(i + 1) graphs? Are there particular sets of positions which are common to particular sets of tasks? The answers to these questions potentially provide an explanation of the structure of the phenomenon.
In this manner, we have refined the procedure of hypothesis testing beyond the initial search of the entire structure by breaking it down into various levels which may be analyzed separately in order to pinpoint precise- ly the interesting aspects of the hypothesis. We have presented a method for further analyzing the data which at its worst will reduce to the identical method and at its best result in a more refined analysis. If this procedure were to be undertaken in a more general fashion, using not only particular aspects of the hypothesis, but any grouping inherent in the data, the dis- covery of an existing relationship could lead to the prediction of new hypo- theses, or at least a further delineation of the existing hypothesis.
An example employing the nested network approach
Consider the following situation. Graduate students in psychology from dif- ferent departmental areas do not associate with one another. A graphical re- presentation of this phenomenon might bear out the fact by displaying several mutually disjoint clusters of people, which are actually connected components. Why is this? It could be because of animosity due to conflict- ing ideologies. This may well be the case since the groups are partitioned precisely by content area. The researcher who stopped his analysis here, might be guilty of jumping to inaccurate conclusions. Following the syste- matic approach presented here, alternative hypotheses leading to testable predictions can be uncovered. Taken as a whole, the interpersonal network of a large group of students is unwieldly. So the first step might begin on a higher level by noticing that partitioning the students according to their uni-
38 t;. Harary and M. F Bate11
versity also preserves the separation. A different conclusion presents itself, namely that graduate students from one university don’t interact with stu- dents from other universities. This might occur bccausc of the intense rival- ry between schools. Again, the researcher who stops at this level is in danger of drawing faulty conclusions. We now drop down one level and partition according to the buildings which house the offices of the students. If this also preserves the separation, we might conclude that restrictions caused by the location of the buildings cause the lack of interaction. At the next lower level, we notice that within a building, the people don’t interact between floors. However, at this new level, we see that people do interact with others in different offices on the same floor. It may be an artifact that the students in one departmental area are assigned one tloor in a building, and students in other areas another. Now we have a testable hypothesis. We hypothesize that physical distance affects social interaction. This approach suggests some further tests, namely, ( 1 ) drop one more level and see if all those within an office interact. (2) in other situations where students have offices on differ- ent floors, see if they interact, and (3) try to find situations in which students of different areas all have offices on the same floor and see if the separation between areas still holds.
It can be seen from this example that the nested network approach can provide a reinterpretation of data leading to alternative hypotheses and, in addition, suggest the type of data needed to test the new hypotheses. In this way, the value of an approach to systems as presented here is illustrated in terms of providing a basis for realistic and verifiable predictions in the real world.
Summary
Systems have been described in a variety of manners by a number of rcsearch- ers. Common to all their formulations art‘ the ideas that a system involves units and their interrelationships and possesses some sort of hierarchical struc- ture. A consideration of these commonalities has led us to the formulation of a definition and model for a general system in graph-theoretic terms. Spe- cifically, we propose that a system be taken as a nested network. with the underlying structure of a nested graph.
Two criteria are proposed as means by which to judge any abstract formu- lation, i.e., a mathematical model. First, does the model accurately charac- terize the empirical phenomena ? In response to this question, a reinterpreta- tion of open and closed systems, of system-environment relationships, and of role systems is presented according to the nested network approach. It is shown that all three are adequately represented by this model. The second criterion relates to the empirical worth of the formulation. It is shown how not utilizing the model can result in faulty analyses, the implication being that viewing a problem in a nested network frame of reference can lead to more accurate conclusions. In this regard, an algorithm is presented describ-

What is a system? 39
ing the basic steps in taking this approach. It is shown that an application of this algorithm may lead to predictions regarding new or more finely discrim- inated hypotheses, and an example is described in terms of nested networks.
In addition to providing a methodology for problem solving research, the systems model presented opens new horizons for research. For example, the invariants and structural features of a graph can be defined on any level of the system. It might prove fruitful to investigate the effects of an invariant on one level with respect to a graph on another. Under what conditions is a property universal across levels? Do certain features appear or disappear at some level of a nested graph? What are the effects of perturbations at one given level on the parts of the system at higher and lower levels?
References
Akiyama, J., F. Boesch, H. Era, F. Harary and R. Tindell
To appear “The cohesiveness of a set of points of a graph”. Networks.
Baker, J. and G. Allen
1977 The Study of Biology. Reading: Addison-Wesley.
von Bertalanffy, L.
1950 “An outline of general system theory”. British Journal for Philosophy of Science 1: 1344 165.
von Bertalanffy, L.
1956 “General systems theory”. General Systems I : l-10.
Blau, P. M.
1977 “A macrosociological theory of social structure”. American Journal of Sociology 83: 26-54.
Boulding, K.
1956 “General systems theory - the skeleton of science”. General Systems I : 1 l-l 7.
Cartwright, D. and F. Harary
1977 “A graph theoretic approach to the investigation of system-nvironment relationships”.
Journal of Mathematical Sociology 5:87-l 11.
Chartrand, G.
1977 Graphs as Mathematical Models, Boston: Prindle, Weber and Schmidt.
Enery, F. E. and E. L. Trist
1965 “The causal texture of organizational environments”. Human Relations 18121-32. Groth, J., T. E. Peebles, M. Seldner and R. M. Soneira
1977 “The clustering of galaxies”. Scientific American 237:76-98. Hall, A. D. and R. E. Fagen
1956 “Definition of system”. General Systems I : 18-28.
Harary, F.
1969 Graph Theory. Reading: Addison-Wesley.
Harary, F., R. Norman and D. Cartwright
1965 Structural Models. New York: Wiley. Hillier, F. S. and G. J. Lieberman
1974 Operations Research. San Francisco: Holden-Day, 2nd edn.
Krantz, D. H., R. D. Lute, P. Suppes and A. Tversky
1971 Foundations of Measurement. New York: Academic Press. McConnell, J. V.
1977 Understanding Human Behavior. New York: Holt, Rinehart and Winston. Miller, J. G.
1965 “Living systems: basic concepts”. Behavioral Science 10: 193-23 1.

40 E;. Harary and M. 1.: Bate11
Nambu, Y.
1976 “The confinement of quarks”. Scierrtifi’c Anzrrican 236:48-60. Oeser, 0. A. and 1:. Harary
1962 “A mathematical model for structural role theory 1”. Ifutuman Helarions 15:89-109.
Oeser, 0. A. and F. Harary
I964 “A mathematical model for structural role theory II”. fff~rmzn Relations 17:3 17.
Wilder, R. L.
1956 htroductiori to tl7c Ebundations ofMathrmarics. New York: Wiley.