Embed Size (px)
Citation preview
What is a business market?
In its most basic form, a business market is a network of
transactions and relationshipsamong buyers and sellers.
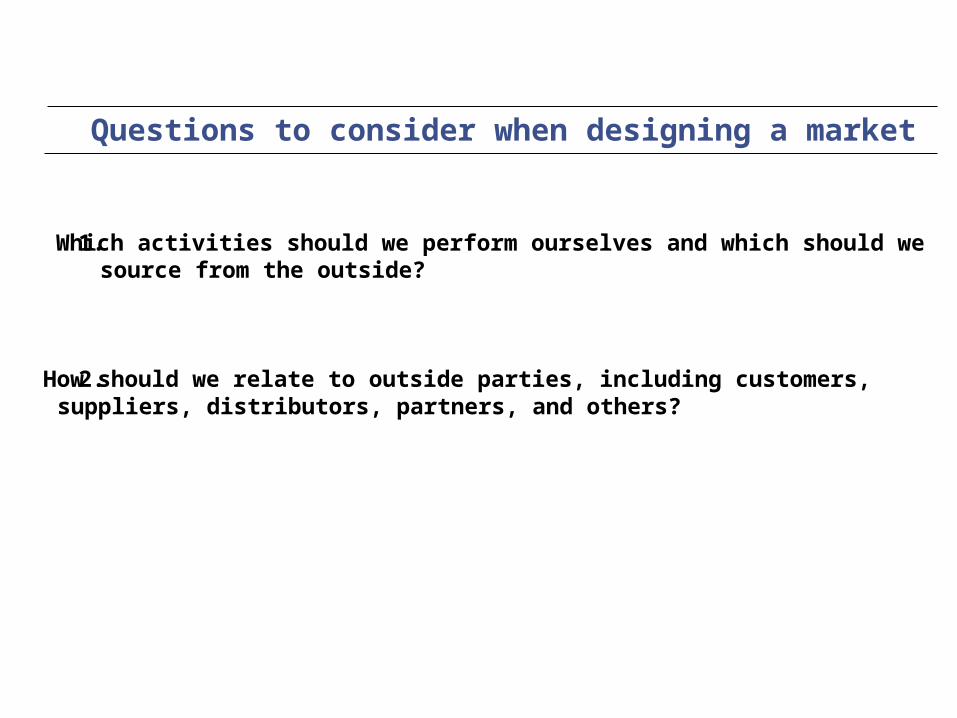
Questions to consider when designing a market
1. Which activities should we perform ourselves and which should wesource from the outside?
2. How should we relate to outside parties, including customers, suppliers, distributors, partners, and others?
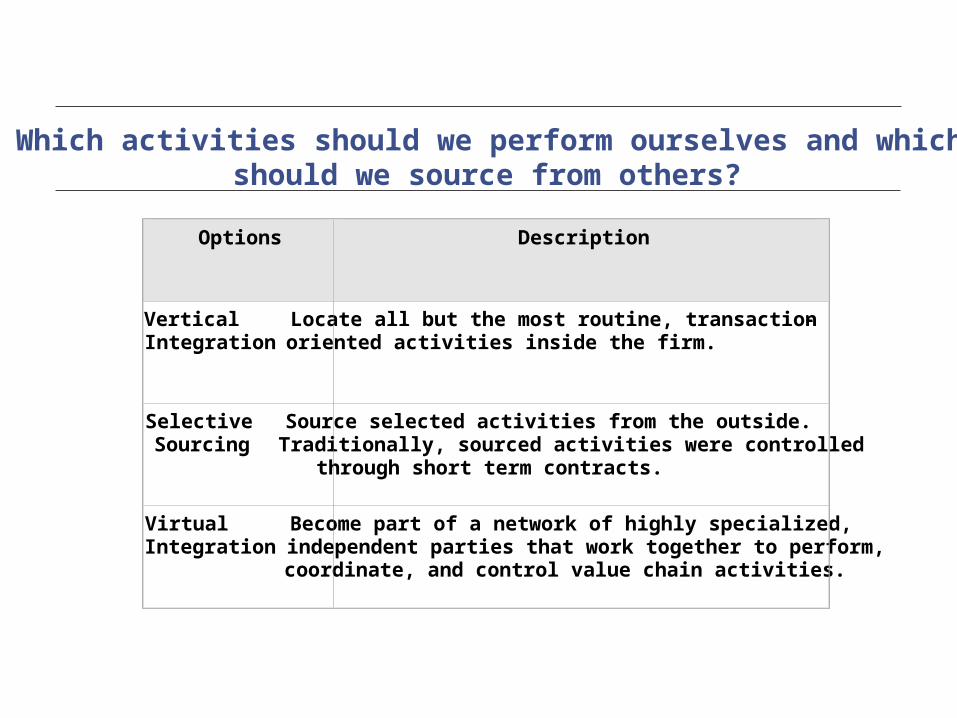
Which activities should we perform ourselves and which should we source from others?
Options Description
Vertical Integration
Locate all but the most routine, transaction -oriented activities inside the firm.
Selective Sourcing
Source selected activities from the outside. Traditionally, sourced activities were controlled through short term contracts.
Virtual Integration
Become part of a network of highly specialized, independent parties that work together to perform, coordinate, and control value chain activities.
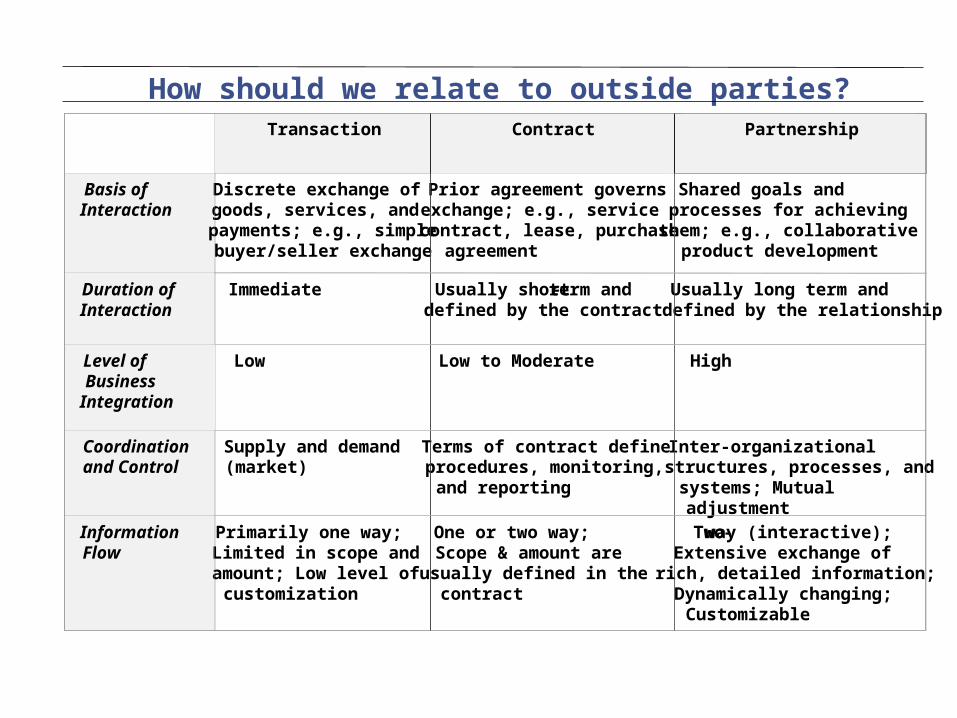
How should we relate to outside parties?Transaction Contract Partnership
Basis of Interaction
Discrete exchange of goods, services, and payments; e.g., simple buyer/seller exchange
Duration of Interaction
Immediate
Level of Business Integration
Low
Coordination and Control
Supply and demand (market)
Information Flow
Primarily one way;Limited in scope and amount; Low level of customization
Prior agreement governs exchange; e.g., service contract, lease, purchase agreement
Usually short-term and defined by the contract
Low to Moderate
Terms of contract define procedures, monitoring, and reporting
One or two way; Scope & amount are usually defined in the contract
Shared goals and processes for achieving them; e.g., collaborative product development
Usually long term and defined by the relationship
High
Inter-organizationalstructures, processes, and systems; Mutual adjustment
Two-way (interactive); Extensive exchange of rich, detailed information; Dynamically changing; Customizable
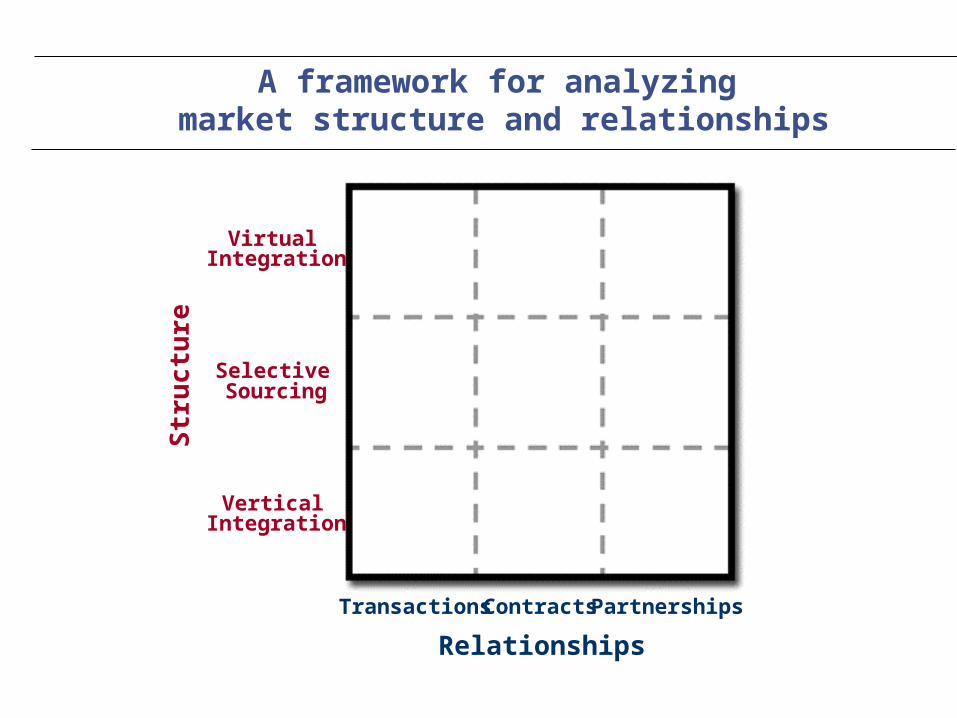
Relationships
TransactionsContractsPartnerships
Str
uctu
re
Virtual Integration
Selective Sourcing
Vertical Integration
A framework for analyzing market structure and relationships

How will markets organize in the Network Economy?
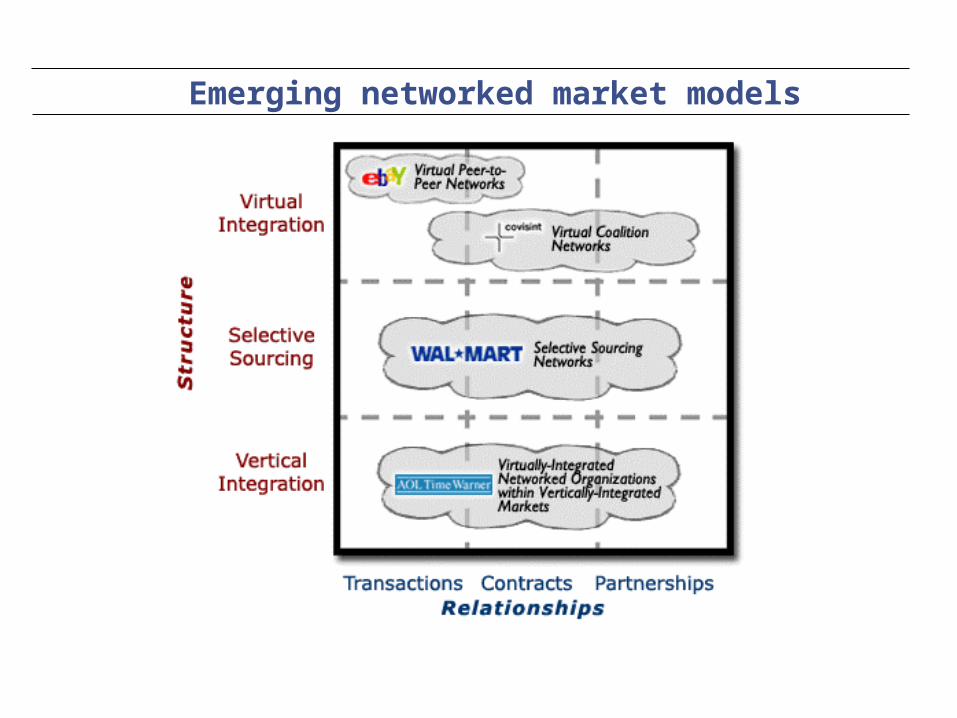
Emerging networked market models

Components of a Business Model
Components of a Business Model (continued)
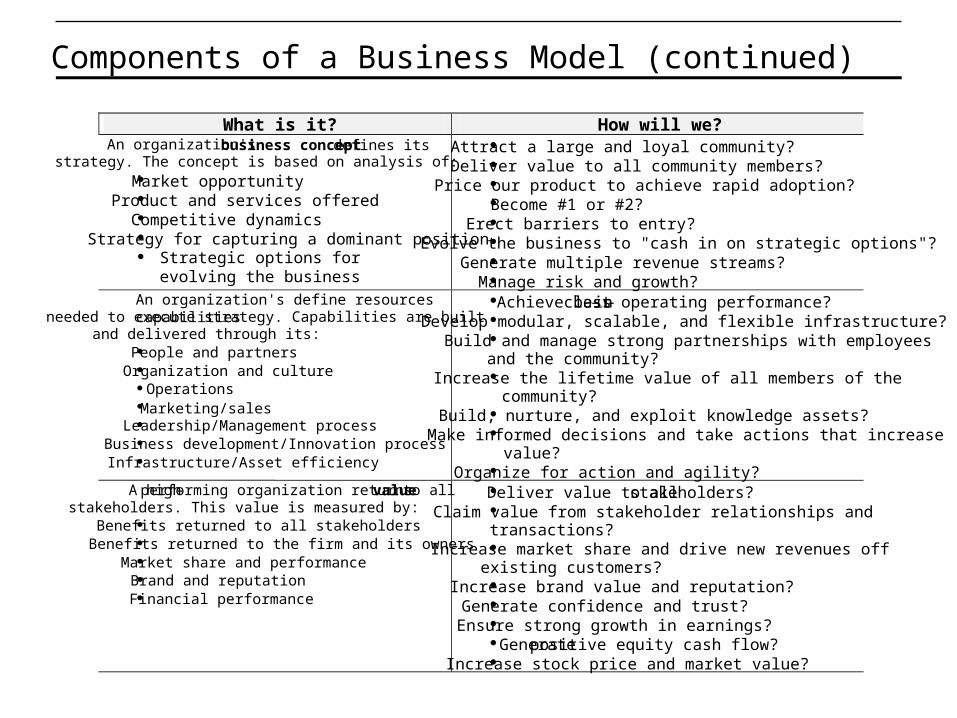
What is it? How will we? An organization's business concept defines its
strategy. The concept is based on analysis of: Market opportunity Product and services offered Competitive dynamics Strategy for capturing a dominant position Strategic options for evolving the business
Attract a large and loyal community? Deliver value to all community members? Price our product to achieve rapid adoption? Become #1 or #2? Erect barriers to entry? Evolve the business to "cash in on strategic options"? Generate multiple revenue streams? Manage risk and growth?
An organization's capabilities define resources needed to execute strategy. Capabilities are built and delivered through its: People and partners Organization and culture Operations Marketing/sales Leadership/Management process Business development/Innovation process Infrastructure/Asset efficiency
Achieve best-in-class operating performance? Develop modular, scalable, and flexible infrastructure? Build and manage strong partnerships with employees
and the community? Increase the lifetime value of all members of the
community? Build, nurture, and exploit knowledge assets? Make informed decisions and take actions that increase
value? Organize for action and agility?
A high -performing organization returns value to all stakeholders. This value is measured by: Benefits returned to all stakeholders Benefits returned to the firm and its owners Market share and performance Brand and reputation Financial performance
Deliver value to all stakeholders? Claim value from stakeholder relationships and
transactions? Increase market share and drive new revenues off
existing customers? Increase brand value and reputation? Generate confidence and trust? Ensure strong growth in earnings? Generate positive equity cash flow? Increase stock price and market value?

Stocks are traded on a physical trading floor using the open-outcry auction method. Until recently, investors placed orders through stockbrokers who then communicate those orders to floor brokers who completed the trades at the booth of a specialist. In 2000, 30% of orders were transmitted electronically directly to the specialist at his/her booth on the physical trading floor. Specialists are members of the NYSE who act as auctioneers for their assigned stocks. Each stock is assigned to one specialist.
New York Stock Exchange market model in 12/2000
• Screen-based trading enables complete view of orders
• High levels of transparency within global markets
• Limited sources of capital
• Floor-based trading of over 3025 securities
• Specialists maintain a central order book – order-driven system
• Average daily trading volume was 1.0 billion shares per day and the # of listings was 2,862
• Average market value was $US 12.4 trillion
-
SpecialistActs as Agent
BUY SELL
Auction Market Model
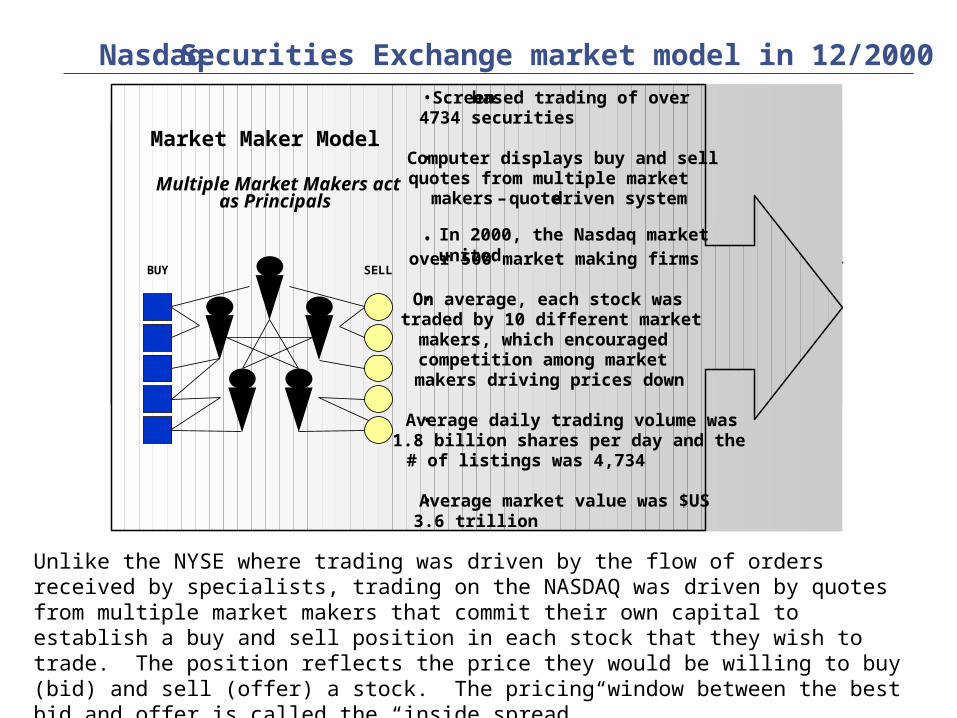
Unlike the NYSE where trading was driven by the flow of orders received by specialists, trading on the NASDAQ was driven by quotes from multiple market makers that commit their own capital to establish a buy and sell position in each stock that they wish to trade. The position reflects the price they would be willing to buy (bid) and sell (offer) a stock. The pricing window between the best bid and offer is called the “inside spread.”
Nasdaq Securities Exchange market model in 12/2000
• Screen-based trading enables complete view of orders
• High levels of transparency within global markets
• Limited sources of capital
• Screen-based trading of over 4734 securities
• Computer displays buy and sell quotes from multiple market makers – quote-driven system
• In 2000, the Nasdaq market united
over 500 market making firms
• On average, each stock was traded by 10 different market makers, which encouraged competition among market makers driving prices down
• Average daily trading volume was 1.8 billion shares per day and the # of listings was 4,734
• Average market value was $US 3.6 trillion
Multiple Market Makers act as Principals
Market Maker Model
BUY SELL

ECN market model in 12/2000
• Screen-based trading enables complete view of orders
• High levels of transparency within global markets
• Limited sources of capital
• Screen-based automated trading
• Computer acts as a specialist attempting to match orders from individuals and market makers –order-driven system
• In 2001, the oldest and largest ECN, Instinet, had over 21,000 subscribers and accounted for over 12% of Nasdaq daily volume
• Unlike exchanges, ECNs were not required to divulge the identity of individuals and firms trading on its network and could charge a subscription fee of its members
• In 2001, ECNs charged $2-$5 per trade vs $50-$60 per trade by a human broker
Computer System acts as Agent
Automated Trading Market Model
BUY SELL
Like the NYSE, Electronic Communication Network (ECN) trading was driven by the continuous flow of buy and sell orders, rather than by the competitive quote-driven trading as seen on the Nasdaq. But, unlike the NYSE, orders traded without the human intervention of a specialist. When a buyer or seller submitted an order to an ECN, the computer first attempted to match the order within the ECN market; in 2001 ECNs were able to match about 50% of their orders internally. If the order did not match within seconds, the ECN assumed the role of a Nasdaq market maker and the order was submitted to Nasdaq. In 2Q2001, ECNs accounted for 29% of Nasdaq market volume, up from less than 3% in 2Q 1998.
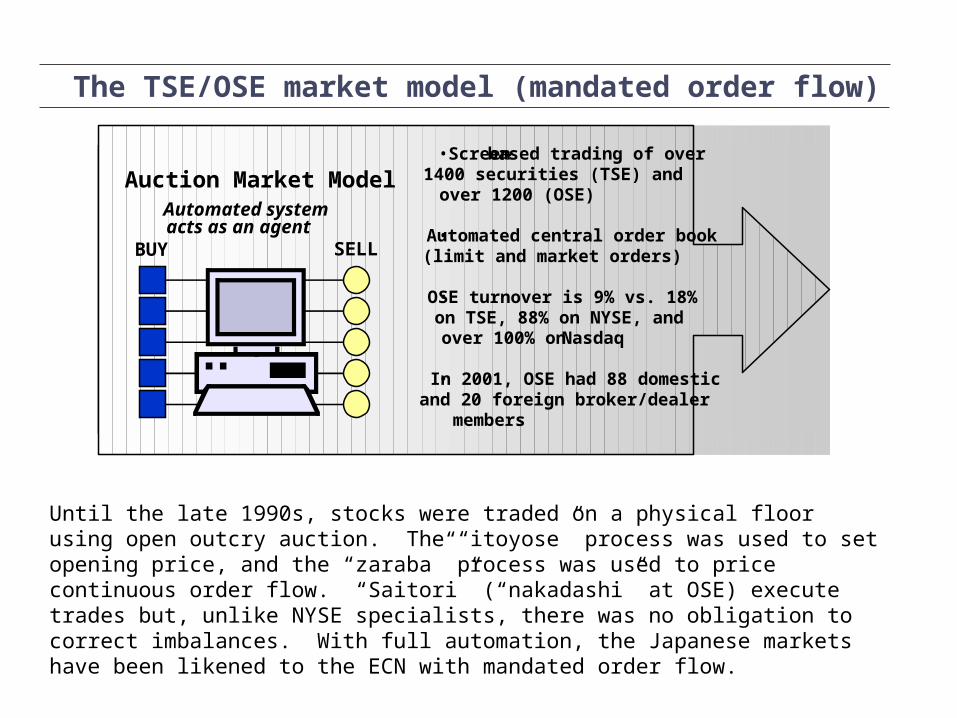
Until the late 1990s, stocks were traded on a physical floor using open outcry auction. The “itoyose” process was used to set opening price, and the “zaraba” process was used to price continuous order flow. “Saitori” (“nakadashi” at OSE) execute trades but, unlike NYSE specialists, there was no obligation to correct imbalances. With full automation, the Japanese markets have been likened to the ECN with mandated order flow.
• Screen-based trading enables complete view of orders
• High levels of transparency within global markets
• Limited sources of capital
ECN Market SpecialistAutomated System
Acts as AgentBUY SELL
• Screen-based trading of over 1400 securities (TSE) and over 1200 (OSE)
• Automated central order book (limit and market orders)
• OSE turnover is 9% vs. 18% on TSE, 88% on NYSE, and over 100% on Nasdaq
• In 2001, OSE had 88 domestic and 20 foreign broker/dealer members
Auction Market ModelAutomated systemacts as an agent
BUY SELL
The TSE/OSE market model (mandated order flow)
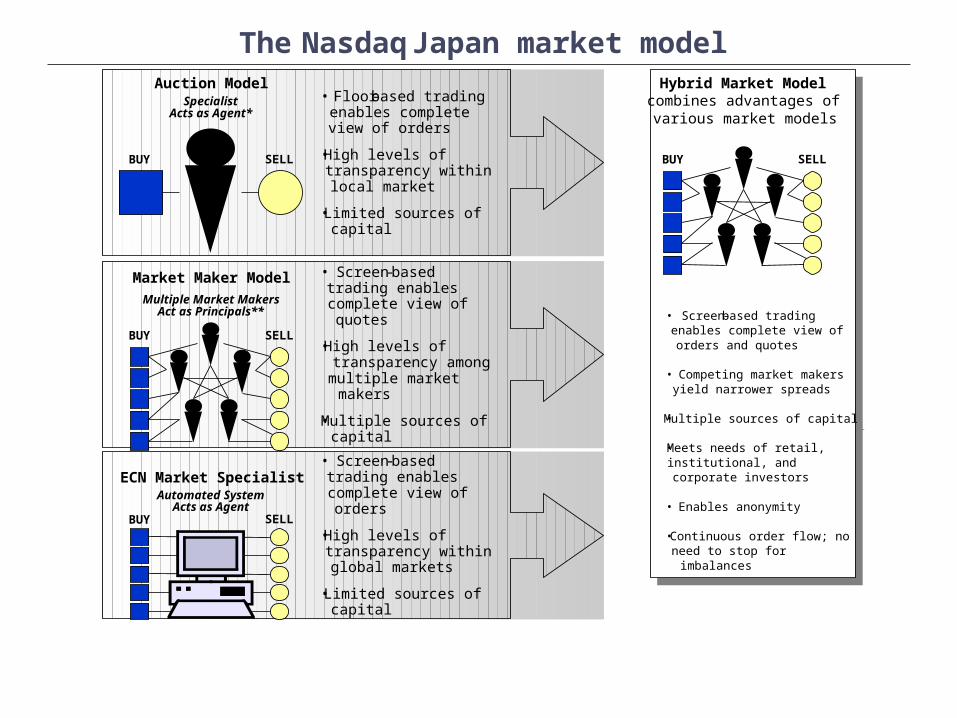
The Nasdaq Japan market model
• Screen-based trading enables complete view of orders
• High levels of transparency within global markets
• Limited sources of capital
• Screen-based trading enables complete view of orders and quotes
• Competing market makers yield narrower spreads
• Multiple sources of capital
• Meets needs of retail, institutional, and corporate investors
• Enables anonymity
• Continuous order flow; no need to stop for imbalances
• Screen-based trading enables complete view of orders and quotes
• Competing market makers yield narrower spreads
• Multiple sources of capital
• Meets needs of retail, institutional, and corporate investors
• Enables anonymity
• Continuous order flow; no need to stop for imbalances
Hybrid Market Model combines advantages of various market models
ECN Market SpecialistAutomated System
Acts as AgentBUY SELL
Auction Market• Floor-based trading
enables complete view of orders
• High levels of transparency within local market
• Limited sources of capital
Market Market Specialist
BUY SELL
SpecialistActs as Agent*
BUY SELL
• Screen-based trading enables complete view of quotes
• High levels of transparency among multiple market makers
• Multiple sources of capital
Multiple Market MakersAct as Principals**
BUY SELL
Market Maker Model
Auction Model

Nasdaq Japan
Nasdaq JapanIssuer Size
& Maturity
TSE and OSE
Section 1
TSE and OSE
Section 1
JasdaqOTC
JasdaqOTC
TSEMothers
TSEMothers
Slow20 - 25 years
Fast3 - 5 years
Small/Young
Large/Established
TSEand OSESection 2
TSEand OSESection 2
Nasdaq Japan
Nasdaq JapanIssuer Size
& Maturity
Average Time to Public Offering
TSE and OSE
Section 1
TSE and OSE
Section 1
JasdaqOTC
JasdaqOTC
TSEMothers
TSEMothers
Slow20 - 25 years
Fast3 - 5 years
Small/Young
Large/Established
TSEand OSESection 2
TSEand OSESection 2
Comparison of Japanese securities markets
TSE accounts for 70% of shares listed, 80% of trading value, and 90% of trading volume

Nasdaq Japan market entry strategy
June 19, 2000
Phase 1
Enter Quickly Using OSE Market Platform
Early 2002
Phase 2
Launch Hybrid Market Model
???
Phase 3
Link Global Pools of Liquidity
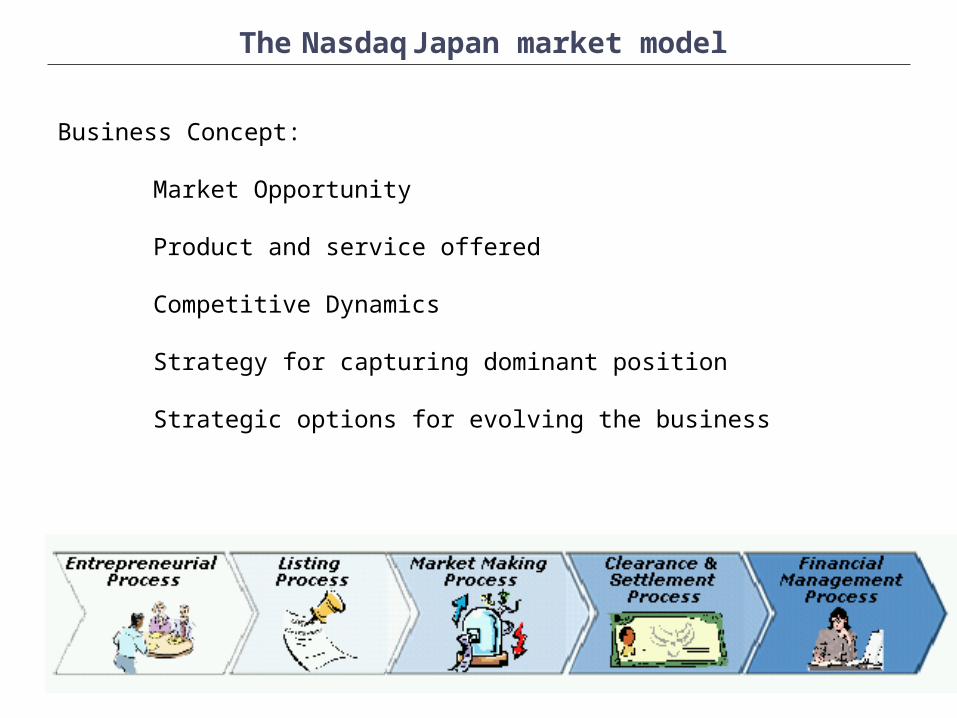
The Nasdaq Japan market model
Business Concept:
Market Opportunity
Product and service offered
Competitive Dynamics
Strategy for capturing dominant position
Strategic options for evolving the business
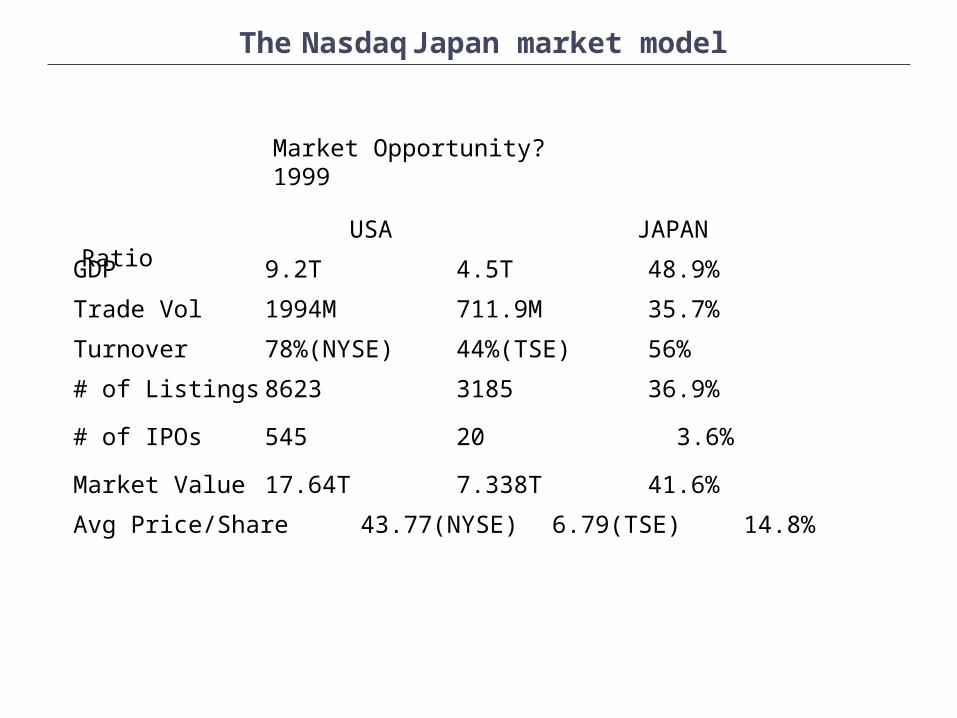
The Nasdaq Japan market model
GDP 9.2T 4.5T 48.9%
Trade Vol 1994M 711.9M 35.7%
Turnover78%(NYSE) 44%(TSE) 56%
# of Listings 8623 3185 36.9%
# of IPOs 545 20 3.6%
Market Value 17.64T 7.338T 41.6%
Avg Price/Share 43.77(NYSE) 6.79(TSE) 14.8%
USA JAPAN Ratio
Market Opportunity? 1999
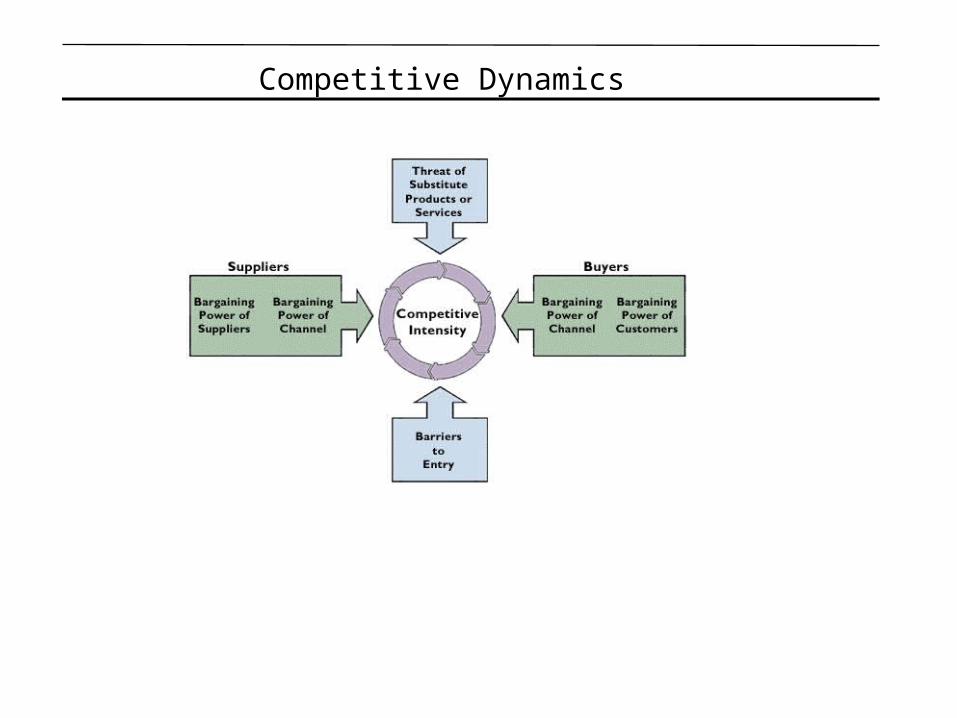
Competitive Dynamics
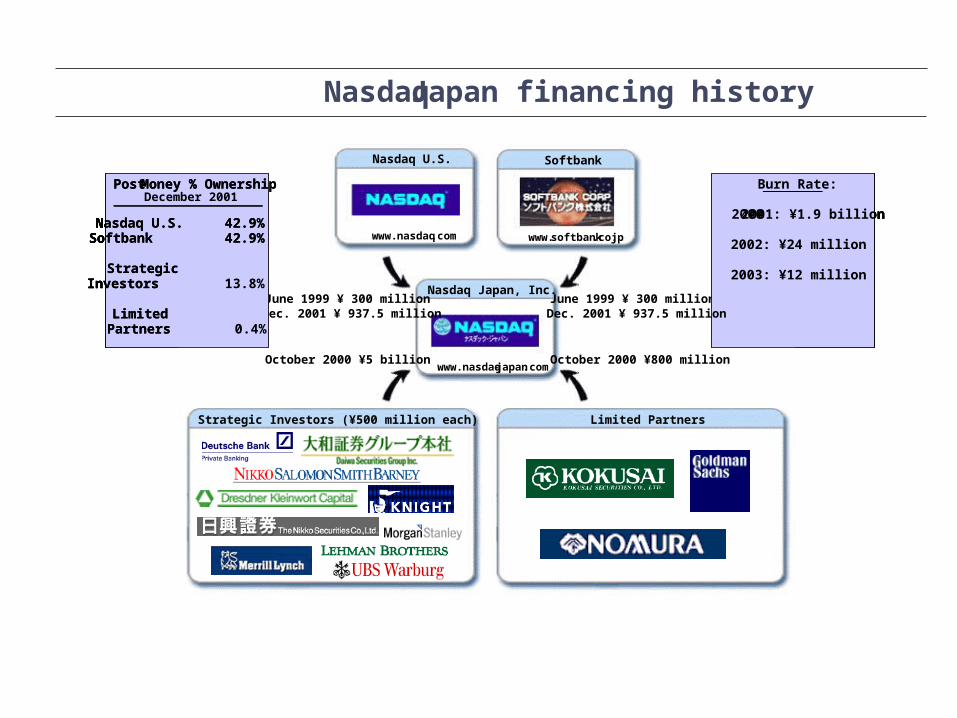
NasdaqJapan financing history
Softbank
www.softbank.co.jp
Nasdaq Japan, Inc.
www.nasdaq-japan.com
Nasdaq U.S.
www.nasdaq.com
Strategic Investors (¥500 million each) Limited Partners
October 2000 ¥800 millionOctober 2000 ¥5 billion
June 2001 ¥ 937.5 million June 2001 ¥ 937.5 million
Burn Rate:
2000-2001: ¥1.9 billion
2002: ¥24 million
2003: ¥12 million
Softbank
www.softbank.co.jp
Nasdaq Japan, Inc.
www.nasdaq-japan.com
Nasdaq U.S.
www.nasdaq.com
Strategic Investors (¥500 million each) Limited Partners
October 2000 ¥800 millionOctober 2000 ¥5 billion
June 1999 ¥ 300 million June 1999 ¥ 300 million
Burn Rate:
2000-2001: ¥1.9 billion
2002: ¥24 million
2003: ¥12 million
Dec. 2001 ¥ 937.5 million Dec. 2001 ¥ 937.5 million
Post-Money % Ownership
Nasdaq U.S. 42.9%Softbank 42.9%
StrategicInvestors
LimitedPartners
Post-Money % Ownership
Nasdaq U.S. 42.9%Softbank 42.9%
StrategicInvestors
LimitedPartners
13.8%
0.4%
December 2001
Softbank
www.softbank.co.jp
Nasdaq Japan, Inc.
www.nasdaq-japan.com
Nasdaq U.S.
www.nasdaq.com
Strategic Investors (¥500 million each) Limited Partners
October 2000 ¥800 millionOctober 2000 ¥5 billion
June 2001 ¥ 937.5 million June 2001 ¥ 937.5 million
Burn Rate:
2000-2001: ¥1.9 billion
2002: ¥24 million
2003: ¥12 million
Softbank
www.softbank.co.jp
Nasdaq Japan, Inc.
www.nasdaq-japan.com
Nasdaq U.S.
www.nasdaq.com
Strategic Investors (¥500 million each) Limited Partners
October 2000 ¥800 millionOctober 2000 ¥5 billion
June 1999 ¥ 300 million June 1999 ¥ 300 million
Burn Rate:
2000-2001: ¥1.9 billion
2002: ¥24 million
2003: ¥12 million
Dec. 2001 ¥ 937.5 million Dec. 2001 ¥ 937.5 million
Post-Money % Ownership
Nasdaq U.S. 42.9%Softbank 42.9%
StrategicInvestors
LimitedPartners
Post-Money % Ownership
Nasdaq U.S. 42.9%Softbank 42.9%
StrategicInvestors
LimitedPartners
13.8%
0.4%
December 2001

Nasdaq Japan Key Challenges
Nasdaq Japan is quickly running out of cash
.
.
Failure to attract high liquidity stocks from Nasdaq US
Competing interest of powerful stakeholders: widelydivergent and complex cultural norms has impactedability to launch and grow company