Embed Size (px)
Citation preview

Prepared for:Dr Andrew Barber, SARDI
Prepared by:
Dr Hervé Remaud and Dr Nick DanenbergSenior Research Associates
T. +33 6 76 55 58 60 and (08) 8302 9167
and Kimberley Peters, Research Associate
Date of Issue: 8th of April 2010
What Influences Consumer Choice in a Restaurant Context?

EXECUTIVE SUMMARYThis report presents the results of the research “What influences Consumer Choice in a Restaurant Context”, conducted by the Ehrenberg-Bass Institute on behalf of Marine innovation South Australia (MISA) for the South Australian seafood industry.
The project surveyed 1208 Australian restaurant patrons regarding the factors that influence their food and seafood purchase behaviour in the contexts of both casual and fine-dining restaurants (places where people can sit in and order lunch/dinner from a menu). Focus groups were conducted in August 2009, followed by an online quantitative survey distributed for a period of one week during September 2009.
The ultimate aim of the project was to explore the decision-making processes underlying restaurant patrons’ menu item choices, in order to identify barriers and determine potential opportunities to direct consumers’ attention towards the purchase of seafood products when patronising a full-service restaurant.
There were 5 objectives in this research.
Objective 1
The first objective aimed to describe the Consumers’ restaurant experience at casual and fine-dining restaurants during the past 4 and 8 weeks respectively.
Specifically this section investigated:
• Consumers’ restaurant experience in the last 4 weeks, for people who visited a casual restaurant, and in the last 2 months for people who visited a fine-dining restaurant: number of casual and fine-dining restaurants visited; what was purchased and average expenditure for a meal; barriers preventing the increased consumption of fish and shellfish in casual and fine-dining restaurants.
• Where they consumed seafood during the last four weeks.
• Consumers’ perception of various menu items in each restaurant context (casual and fine-dining).
The key findings are outlined below:
• Generally, there is a very low percentage of restaurant patrons who are exclusively loyal to one establishment type (i.e. casual or fine-dining restaurant).
• Majority of casual-dining restaurant patrons had also visited a fine-dining restaurant (at least once) during the last 8 weeks.
• Casual-dining restaurant patrons spend an average of $22.50 on a fish dish in

comparison to fine-dining restaurant patrons who spend an average of $27.00.
• Casual-dining restaurant patrons spend an average of $25.50 on a shellfish dish in comparison to fine-dining restaurant patrons who spend an average of $32.00.
• Regardless of the species both casual and fine-dining restaurant patrons are generally light buyers of seafood.
• Fine-dining patrons visited on average about twice a fine-dining restaurant during a 2 month-period. The chances for these clients to order seafood when visiting such a restaurant are low, less than 0.5 time out of these two visits.
• Prawns are the most frequently ordered seafood species at both casual and fine-dining restaurants.
• There is a clear distinction in relation to consumers’ perception of seafood and meat in a restaurant context.
• Consumers perceive seafood as being less versatile and considered to be a “special occasion food” in comparison to meat dishes.
• In comparison to meat, seafood is considered as being more healthy and lower in fat.
• There is no particular perceptual barrier that needs to be overcome to increase consumers’ consumption of seafood at casual and fine-dining restaurants.
• The proportion of respondents’ total seafood consumption increases slightly with respondents’ income level.
• Respondents with an undergraduate and/or postgraduate qualification consume a larger proportion of seafood at restaurants than other locations (i.e., at home, fish and chip outlets etc) and visit restaurants more frequently on average.
• Most seafood is consumed at home (about 47%) and then in a restaurant (33%). Fish and Chips outlets represent about 16% of the total seafood consumption in Australia. And only about 6.5% of seafood is finally consumed at a friends / relatives’ home.
Objective 2
The second objective was to explore the primary influencing factors that determine consumers' choice on restaurant menus, and the relative importance of (seafood) menu item attributes at the point of selection. Specifically, this objective investigated the factors that (most and least) influence consumers’ menu item choice in a restaurant context.
The key findings are outlined below:

• Both segments of consumers (casual and fine-dining) consider “the combination of ingredients” and ordering “a dish that I could not / would not want to prepare at home” as the most important attributes influencing menu item selection in a restaurant context.
• Both segments of consumers (casual and fine-dining) consider “the core ingredient of the dish is sustainably produced” to be the least important attribute influencing menu item selection in a restaurant context.
• The inclusion of “local produce” and “a dish representing a healthy option” were more important for fine-dining patrons than casual-dining restaurant patrons.
• The price of a dish and “the method of preparation” were considerd more important for casual-dining restaurant patrons than fine-dining restaurant patrons.
• The relative importance of menu item attributes is not significantly different between casual and fine-dining restaurant patrons.
• Many more attributes are considered important when selecting a seafood dish from a restaurant menu in comparison to the selection of a dish not containing seafood when dining-out at a restaurant.
Objective 3
Section 3 explored the factors that may affect or moderate consumers’ choice of (sea)food items from a restaurant menu according to a patron’s level of involvement and social context. These factors included:
• Consumers’ involvement with regards to food;
• The effect of social context on consumers’ choice of (sea)food items from a menu.
The key findings are outlined below:
• The relative importance of menu item attributes differ significantly among restaurant patrons with a low and high level of involvement with food.
• The main attributes that most strongly influence the menu item choices of consumers with a low level of food involvement are associated with the concept of value.
• Restaurant patrons with a high level of involvement with food place a greater emphasis on hedonic ‘pleasure-seeking’ and sensory evaluations stemming from the dining experience.
• A dish ‘representing a healthy option’ exerts a much greater influence on the menu item choice of consumers with a low level of involvement with food

• Contrary to much current anecdotal information, the reference to local and sustainable produce are relatively unimportant attributes influencing casual and fine-dining restaurant patrons menu item choices, whatever their involvement for food or the effect of the social context.
• Consumers who are rather highly influenced by the social context effect when dining at a restaurant do place greater importance on all attributes in the dining environment when selecting a menu item compared to consumers with a low social influence.
Objective 4
This section investigated consumers’ likely purchase behaviour with regards to prawns, and the likelihood of consumers ordering prawns in a restaurant context depending on various situations.
In the first instance, consumers were asked their likelihood of purchasing prawns in the next 4 weeks at a restaurant. Then, introducing various claims associated with the consumption of prawns, we sought to estimate the extent consumers would be less or more likely to purchase prawns compared to the base line situation.
The key findings are outlined below:
• Whatever the scenario, there was no significant difference in the responses provided between the casual and fine-dining restaurant contexts nor between prawns for an entrée and prawns for a main plate.
• The chances for casual and fine-dining patrons of ordering prawns at a restaurant in the next 4 weeks are about 1 chance out of 2 (score of 5 out of 10).
• Two situations would slightly increase the chances of ordering prawns: if there was a greater variety of dishes including prawns (new recipes / innovative way to have prawns in the dish) (score of 5.6); and if the prawns were local (score of 5.5).
• Knowing that the prawns are frozen on the boat (score 3.7) and knowing that prawns are imported (score of 3) would clearly decrease the chances of a consumer ordering prawns for an entrée in the next 4 weeks in a restaurant.
• Overall, females gave slightly higher scores to almost all questions (in general, females are more likely to order prawns at a restaurant).
• People in NSW have the highest likelihood of ordering prawns in a restaurant in the next 4 weeks and would also have the highest chance of ordering prawns whatever the scenario (except for Spencer Gulf prawns in SA).

• The older the respondent, the greater the likelihood of ordering prawns whatever the scenario.
Objective 5
The final objective sought to determine consumers’ (stated) willingness to pay for (sea)food dishes, taking into consideration various claims and descriptors that would typically generate a price premium for consumers in a restaurant context. The descriptors were chosen arbitrarily, through discussions with MISA and the Institute. The items were selected to represent a broad range of the types of menu item descriptions that are found on restaurant menus—from the simple addition of a species name, up to a preparation described using fancy, French terms. Respondents were presented a baseline situation including a seafood dish that could be available in a restaurant as well as its price. Then, using various claims or descriptors for the dish, we asked consumers how much they would be willing to pay for the dish, and lastly, which one(s) they would consider ordering at a restaurant.
The key findings are outlined below:
• For a Fish and Chips (served with green salad) dish priced at $15, people would pay an extra price premium of $1.80 if the dish is presented as ‘Cooper’s beer battered fish and chips (served with green salad)’, and about $1.40 more if the dish is presented as ‘Grilled fish and baked potatoes (served with green salad and low fat sour cream)’.
• For a dish of “half a dozen of Oysters (served with lemon and vinaigrette)” priced at $10, people would pay a price premium of about $4.20 if the dish is presented as ‘Tasmanian Barilla Bay Oysters – Natural’, and of about $3.70 more if the dish is presented as ‘Coffin Bay Freshly shucked oysters (served with lemon juice and shallot vinaigrette)’. For ‘Freshly shucked oysters', the extra price premium is about $2.70.
• For a dish of “Garlic Prawns - main course” priced at $25, people would pay a price premium of about $1.40 more if the dish is presented as ‘Prawns from the Spencer Gulf with native garlic and sage’, and $1.10 more if the dish is presented as ‘Jumbo Prawns from the Spencer Gulf with garlic’.
• For a dish of “Blue Eye Trevalla with a julienne of vegetables” priced at $25, people would pay about $1.70 extra if the dish is presented as ‘Trevalla en papillotte served with potato dauphinoise and a beurre blanc sauce’, and about $1.30 more if the dish is presented as ‘South Australian line-caught blue eye trevalla on a bed of risotto’. If presented as ‘Fresh deep sea blue eye trevalla with a sauce of native green olive and vernaccia’, the price premium is about $1.20.

• For a dish of “Yellowtail Kingfish with roasted capsicum and mashed potatoes” priced at $25, people would pay very little more (only up to $0.60 cents) for any other descriptions that were suggested.
There is a fine-dining effect—in a fine-dining scenario, people generally expect to pay more for a given dish and to pay incrementally more for variations to the dish. In a fine-dining scenario, basic offerings are also generally less favoured than they are in a casual dining context. This implies that at a fine-dining restaurant, to some extent diners do expect to be and want to be ‘wowed’ by the meals on offer.
Fine and casual diners who would purchase both the baseline situation and one of the menu variations would pay (in most cases) a greater price premium compared to the respondents not willing to purchase one of the variations. Fine diners willing to buy both the baseline situation and one of the menu variations would pay a greater price premium compared to casual diners.

CONTENTS............................................................................................................................................Introduction 3
.................................................................................................................................Research objectives 5................................................................................................................Objective 1: Consumers’ restaurant experiences 5
..........................Objective 2: The primary influencing factors that determine consumers’ choices from restaurant menus 5
Objective 3: The relative importance of menu item attributes according to consumers’ level of food involvement, social .......................................................................................................context and establishment type (casual vs. fine-dining) 6
..................................Objective 4: Consumers’ future behaviour with regards to prawns depending on various situations 6................................................................Objective 5: Consumers’ (stated) willingness to pay for various seafood dishes 6
............................................................................................................................................Methodology 7..........................................................................................................Differences between sub-samples 9
..............................................................................................................................Sample description 10................................................................................Objective 1: Consumers’ restaurant experience 11
...........................................................................................................Duplication of restaurants visit 11..........................................................................................................................Dining-out frequency 13
..........................................Seafood consumption frequency when dining-out in a casual restaurant 16..............................................................................................................................................................Loyalty varies little 18
....................................Seafood consumption frequency when dining-out at a fine-dining restaurant 19..............................................................................................................................................................Loyalty varies little 22
........................................................................................................................Money spent for a dish 23Number of red/white meat, shellfish, fish and vegetarian dishes ordered at a casual-dining
............................................................................................................................................restaurant 29Number of red/white meat, shellfish, fish and vegetarian dishes ordered at a fine-dining restaurant............................................................................................................................................................. 34
...........Reasons for people to stop ordering fish and shellfish in casual and fine-dining restaurants 39.........................................................................................................................................Reasons for not eating shellfish 39
................................................................................................................................................Reasons for not eating fish 41
.....................................Shellfish and fish consumption trends in casual and fine-dining restaurants 43.................................................................................Seafood consumption in-home and out of home 44
............................................................................................Food perceptions in a restaurant context 48...............................................................................................................Guidelines for interpretation of Perceptual Maps 49
.........................................................................................................................Guidelines for interpretation of Deviations 50
.......................................................................................Perceptual map – casual restaurant context 50.................................................................................Deviations analysis—casual restaurant context 52.................................................................................Meats key perceptual strengths and weaknesses 53
....................................................................................................................................................Core Meats comparison: 53
............................................................................Seafoods key perceptual strengths and weaknesses 54..................................................................................................................................Core Seafood products comparison: 56
................................................................................Perceptual map – fine-dining restaurant context 58..........................................................................Deviations analysis—fine-dining restaurant context 59
.................................................................................Meats key perceptual strengths and weaknesses 60....................................................................................................................................................Core Meats comparison: 60
............................................................................Seafoods key perceptual strengths and weaknesses 61..................................................................................................................................Core Seafood products comparison: 63
...........................................................................................Perceptual maps – casual vs. fine-dining restaurant contexts 64
Objective 2: The primary influencing factors that determine consumers' choice on restaurant .....................................................................................................................................................menus 65
The primary influencing factors that determine consumers’ choice on casual vs. fine-dining ................................................................................................................................restaurant menu’s 66
......................................................................................................................................................................Sustainability 67
................................................................................................Choice variety, difference between casual and fine diners 67........................................................................................Importance of price, difference between casual and fine diners 68
Influences on Consumer Choices in Restaurants 1 Ehrenberg-Bass Institute—2010

............................................................................................................................................................................Summary 68
The primary influencing factors that determine consumers’ choices of a regular dish vs. seafood .................................................................................................................dish from restaurant menus 69
The primary influencing factors that determine consumers’ choice of a dish vs. seafood dish from a ...............................................................................................casual vs. fine-dining restaurant menu 70
............................................................................................................................................Seafood dish at casual dining 71
............................................................................................................................................Regular Dish at casual dining 72
................................................................Comparison of a regular dish vs a seafood dish in a casual restaurant context 72.................................................................................................................................................Seafood dish at fine-dining 72
..................................................................................................................................................Regular dish at fine-dining 73..........................................................Comparison of a regular dish vs a seafood dish in a fine-dining restaurant context 73
Objective 3: the relative importance of menu item attributes according to consumers’ level of ...................................................................................................food involvement and social context 74
The relative importance of menu item attributes for consumers with a low vs. high level of food .........................................................................................................................................involvement 74
.....................................................................................................................................................Food involvement scale 74.................The relative importance of menu item attributes for consumers with a low vs. high level of food involvement 75
The relative importance of menu item attributes for consumers with a low vs. high effect of social .................................................................................................................................................context 79
...............................................................................................................................Social context (opinion-seeking) scale 79......................The relative importance of menu item attributes for consumers with a low vs. high effect of social context 81
................................................Objective 4: Consumers’ future behaviour with regards to prawns 82.......................................Chances to order prawns for an entrée at a restaurant in the next 4 weeks 84
...............................Chances to order prawns for a main course at a restaurant in the next 4 weeks 85...........................................Chances to order prawns for a meal at a restaurant in the next 4 weeks 86
............................Objective 5: Consumers’ (stated) willingness to pay for various seafood dishes 90....................................................................................................................................Fish and Chips 90
.................................................................................................................................................Oysters 94
.................................................................................................................................................Prawns 97.............................................................................................................................................Trevalla 101
............................................................................................................................Yellowtail Kingfish 104..........................................................................................................................Summary of findings 108
...........................................................................................................................................Conclusion 110........................................................................................................................................Objective 1 110........................................................................................................................................Objective 2 111........................................................................................................................................Objective 3 112........................................................................................................................................Objective 4 113........................................................................................................................................Objective 5 113
................................................................................................Appendix 1: Focus group transcripts 116....................................................................................................................................Casual-dining 116
........................................................................................................................................Fine-dining 125........................................................................................................Appendix 2: Best-Worst Scaling 133
................................................................................................................Appendix 3: Questionnaire 134
Influences on Consumer Choices in Restaurants 2 Ehrenberg-Bass Institute—2010

INTRODUCTIONThis report presents the results of research conducted with the broad objective of identifying “what influences consumer choices in a restaurant context?”, conducted by the Ehrenberg-Bass Institute for Marketing Science on behalf of Marine Innovation South Australia (MISA). The overall objective of the research was to better understand what influences consumers’ menu item choices when dining at a casual or fine-dining restaurant. Given that a significant quantity of shellfish and seafood products are sold to the food-service sector, we believe that the seafood industry would benefit from a greater understanding of consumer behaviour in the restaurant context.
A restaurant is defined as a place where people can sit and have lunch or dinner. A restaurant can be Premium Class (5 stars), High Class or a Standard Restaurant (2-4 stars), and also include Bistros, Cafes, Pubs, and dine-in Fish & Chips. To date, very little research has been carried out (or, at least published in the public domain) to systematically understand consumers’ purchase decisions regarding food in general and seafood products in particular in the food service sector. This report follows on from research conducted in 2009 by the Institute on behalf of MISA, that surveyed key food purchase decision makers in the South Australian food service sector about their seafood purchase behaviour (in order to increase the Australian food service sector’s purchase of SA seafood products).
For the purpose of this research, we focus on casual and fine-dining restaurants only, excluding fish and chips and take-away outlets.
Casual and fine-dining restaurants are classified under the umbrella of full-service restaurants. A full-service restaurant includes, “all sit-down establishments where the focus is on food rather than on drink…characterised by table service and a relatively higher quality of food offering to quick-service units” (Euromonitor, 2009). For the purpose of this report, fine-dining patrons were defined as individuals who purchased a main course between AU$30.00 and AU$50.00 at a fine-dining restaurant (at least once) within the last 8 weeks. Casual-diners were classified as individual’s who purchased a main course between AU$15.00 and AU$30.00 at a casual-dining restaurant (at least once) within the last four weeks.
This research investigated:
• Consumers’ stated behaviour when selecting menu items at a casual/fine-dining restaurant, as well as their perception of various protein products in this restaurant dining context.
• The factors that determine consumers’ menu item choices at casual/fine-dining
Influences on Consumer Choices in Restaurants 3 Ehrenberg-Bass Institute—2010

restaurants, including a particular emphasis on menu item choices involving seafood.
• The relative importance of (seafood) menu item attributes at the point of selection.
• The relative importance of menu item attributes and differences (if any) that exist according to the type of restaurant (casual vs. fine-dining), as well as between restaurant patrons’ level of involvement with food and social contexts.
• Consumers’ future purchase behaviour with regards to prawns depending on various situations.
• Consumers’ (stated) willingness to pay for various seafood dishes.
The main methodology used for this research was a quantitative survey conducted online with 1,208 respondents across all regions of Australia. Prior to the conduct of the quantitative survey, two focus groups were conducted in Adelaide in order to better understand (from a qualitative perspective) how consumers select an item from a menu. The two focus groups were conducted on the 26th of August 2009. The quantitative survey was conducted between the 23rd and the 30th of September 2009.
Influences on Consumer Choices in Restaurants 4 Ehrenberg-Bass Institute—2010

RESEARCH OBJECTIVESIn June 2009, we reported on chefs’ seafood purchase behaviour, with the aim of better understanding their requirements in order to increase the Australian food service sector’s purchase and consumption of SA seafood products. Interestingly, SA chefs highlighted the importance and potential benefits associated with exploring the factors that influence consumers’ menu item choice when dining-out at a restaurant. A comprehensive understanding of how such factors impact the choices and selection of menu items in the restaurant would help the food service sector and the seafood industry to better satisfy consumers’ expectations from a restaurant dining occasion.
The objectives of this research include:
Objective 1: Consumersʼ restaurant experiences This section describes how consumers behave in a restaurant context. The research investigates:
• Consumers’ restaurant experience in the last 4 weeks, for people who visited a casual restaurant, and in the last 2 months for people who visited a fine-dining restaurant:
• Number of casual and fine-dining restaurants visited;
• What was purchased and the average expenditure for a meal;
• Barriers preventing the increased consumption of fish and shellfish in the restaurant industry;
• Location where seafood was consumed during the last four weeks;
• Consumers’ perceptions of various food items in each restaurant context (casual and fine-dining).
Objective 2: The primary influencing factors that determine consumersʼ choices from restaurant menusSection 2 explores the primary influencing factors that determine consumers’ choices from restaurant menus, and the relative importance of (seafood) menu item attributes at the point of selection. Specifically, this section investigates:
• The factors that (most) influence consumers’ menu item choice in a restaurant context;
• The factors that (least) influence consumers’ menu item in a restaurant context.
Influences on Consumer Choices in Restaurants 5 Ehrenberg-Bass Institute—2010

Objective 3: The relative importance of menu item attributes according to consumersʼ level of food involvement, social context and establishment type (casual vs. fine-dining)Section 3 investigates the extent to which potential factors may affect or moderate consumers’ choice of items from a restaurant menu. These factors include:
• Consumers’ involvement with regards to food;
• The effect of social context on consumers’ choice of (sea)food items from a menu.
Objective 4: Consumersʼ future behaviour with regards to prawns depending on various situationsThis section investigates consumers’ likely purchase behaviour with regards to prawns, and the likelihood of consumers ordering prawns in a restaurant context depending on various situations. In the first instance, consumers were asked their likelihood of purchasing prawns in the next 4 weeks at a restaurant. Then, introducing various claims associated with the consumption of prawns, we sought to estimate the extent to which consumers would be more or less likely to purchase prawns compared to the base-line condition.
Objective 5: Consumersʼ (stated) willingness to pay for various seafood dishesThe final section looks at the impact that various claims and descriptors of food items would have in generating a price premium among consumers in a restaurant context. Again, respondents were presented a baseline situation of a seafood dish that can be available in a restaurant as well as its price. Then, using various claims or descriptors for the dish, we asked consumers how much they would be willing to pay for the dish, and lastly, which one(s) they would actually consider ordering at a restaurant.
Influences on Consumer Choices in Restaurants 6 Ehrenberg-Bass Institute—2010
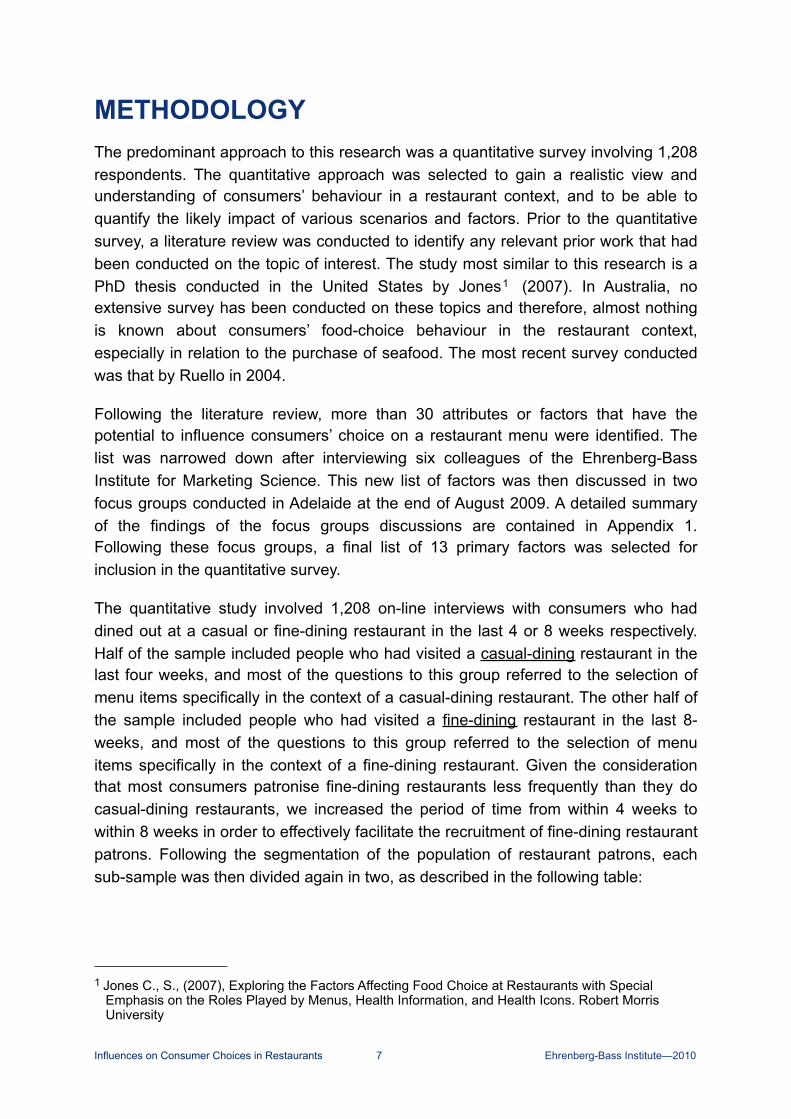
METHODOLOGYThe predominant approach to this research was a quantitative survey involving 1,208 respondents. The quantitative approach was selected to gain a realistic view and understanding of consumers’ behaviour in a restaurant context, and to be able to quantify the likely impact of various scenarios and factors. Prior to the quantitative survey, a literature review was conducted to identify any relevant prior work that had been conducted on the topic of interest. The study most similar to this research is a PhD thesis conducted in the United States by Jones1 (2007). In Australia, no extensive survey has been conducted on these topics and therefore, almost nothing is known about consumers’ food-choice behaviour in the restaurant context, especially in relation to the purchase of seafood. The most recent survey conducted was that by Ruello in 2004.
Following the literature review, more than 30 attributes or factors that have the potential to influence consumers’ choice on a restaurant menu were identified. The list was narrowed down after interviewing six colleagues of the Ehrenberg-Bass Institute for Marketing Science. This new list of factors was then discussed in two focus groups conducted in Adelaide at the end of August 2009. A detailed summary of the findings of the focus groups discussions are contained in Appendix 1. Following these focus groups, a final list of 13 primary factors was selected for inclusion in the quantitative survey.
The quantitative study involved 1,208 on-line interviews with consumers who had dined out at a casual or fine-dining restaurant in the last 4 or 8 weeks respectively. Half of the sample included people who had visited a casual-dining restaurant in the last four weeks, and most of the questions to this group referred to the selection of menu items specifically in the context of a casual-dining restaurant. The other half of the sample included people who had visited a fine-dining restaurant in the last 8-weeks, and most of the questions to this group referred to the selection of menu items specifically in the context of a fine-dining restaurant. Given the consideration that most consumers patronise fine-dining restaurants less frequently than they do casual-dining restaurants, we increased the period of time from within 4 weeks to within 8 weeks in order to effectively facilitate the recruitment of fine-dining restaurant patrons. Following the segmentation of the population of restaurant patrons, each sub-sample was then divided again in two, as described in the following table:
Influences on Consumer Choices in Restaurants 7 Ehrenberg-Bass Institute—2010
1 Jones C., S., (2007), Exploring the Factors Affecting Food Choice at Restaurants with Special Emphasis on the Roles Played by Menus, Health Information, and Health Icons. Robert Morris University

Table 1: Structure of the sample
People having visited a Casual restaurant in
the last 4 weeks
People having visited a Fine-dining restaurant
in the last 8 weeks
Total
Primary factors influencing your choice of a dish on the menu
&Scenarios for Prawns as a main course
301 300 601
Primary factors influencing your choice of a seafood dish on the menu
&Scenarios for Prawns as an entrée
302 305 607
Total 603 605 1208
With regards to Objective 2, we wanted to investigate the primary influencing factors that determine consumers’ choices on restaurant menus and whether this differed for dishes containing seafood and dishes that do not. Therefore, for each sub-sample of casual and fine-dining respondents, we split each sample in two, resulting in approximately 300 participants in each group. The first group responded to the following question: “Imagine that you are in a casual/fine-dining restaurant for dinner with other people…What attribute would most influence and which would least influence your choice when selecting a dish from the menu?”. Those in the second group responded to the following question: “Imagine that you are in a casual/fine-dining restaurant for dinner with other people…What attribute would most influence and which would least influence your choice when selecting a seafood dish from the menu?”.
With regards to Objective 4, we wanted to investigate consumers’ likely purchase behaviour with regards to prawns as an entrée dish versus as a main course dish (and whether there were differences between the two); and how likely consumers would be to order prawns in a restaurant context depending on various claims associated with the consumption of prawns. Therefore, for each sub-sample of casual and fine-dining respondents, we split each sample in two with approximately 300 participants in each group. The first group responded to the question: “What are the chances that you will order prawns for an entrée at a casual/fine-dining restaurant in the next 4 weeks?” While those in the second group responded to the question: “What are the chances that you will order prawns for a main course at a casual/fine-dining restaurant in the next 4 weeks?”.
Influences on Consumer Choices in Restaurants 8 Ehrenberg-Bass Institute—2010

The primary influencing factors that determine consumers’ menu item choices were measured using a method called Best-Worst Scaling (also known as Max-Diff Scaling). A full description of the approach is presented in Appendix 2. Briefly, the key advantage of this approach against other approaches such as with Likert Scale measurement is the fact that respondents are forced to make a trade off between what is perceived as most important in regards to a specific question and what is perceived as least important. This results in a realistic comparison of the factors that are most (and least) likely to influence consumers’ menu item choice in a restaurant context.
The focus groups were moderated by Dr Hervé Remaud and Kimberley Peters of the Institute.
For the quantitative research, a questionnaire was developed (which is reproduced in Appendix 3) for administration via an online survey. The survey was conducted between 23rd and the 30th of September 2009.
Respondents were randomly selected from all Australian states and territories, ensuring a good representation of Australian casual and fine-dining restaurant patrons. The sample is further described hereafter. The results were analysed using a range of statistical techniques using the data analysis application SPSS 17 and Excel.
The average questionnaire length over all interviews was approximately 20 minutes.
Differences between sub-samplesBy default, all findings are presented split between the ‘Casual’, ‘Fine-dining’ and ‘Total’ groups. When the differences that exist between the dining groups in respect of the factors that influence their menu item choices are statistically significant, the results are indicated by an ‘*’. When comparing scale data, an analysis of variance (ANOVA) was performed. When comparing nominal data, a Chi-Square test was conducted.
Influences on Consumer Choices in Restaurants 9 Ehrenberg-Bass Institute—2010
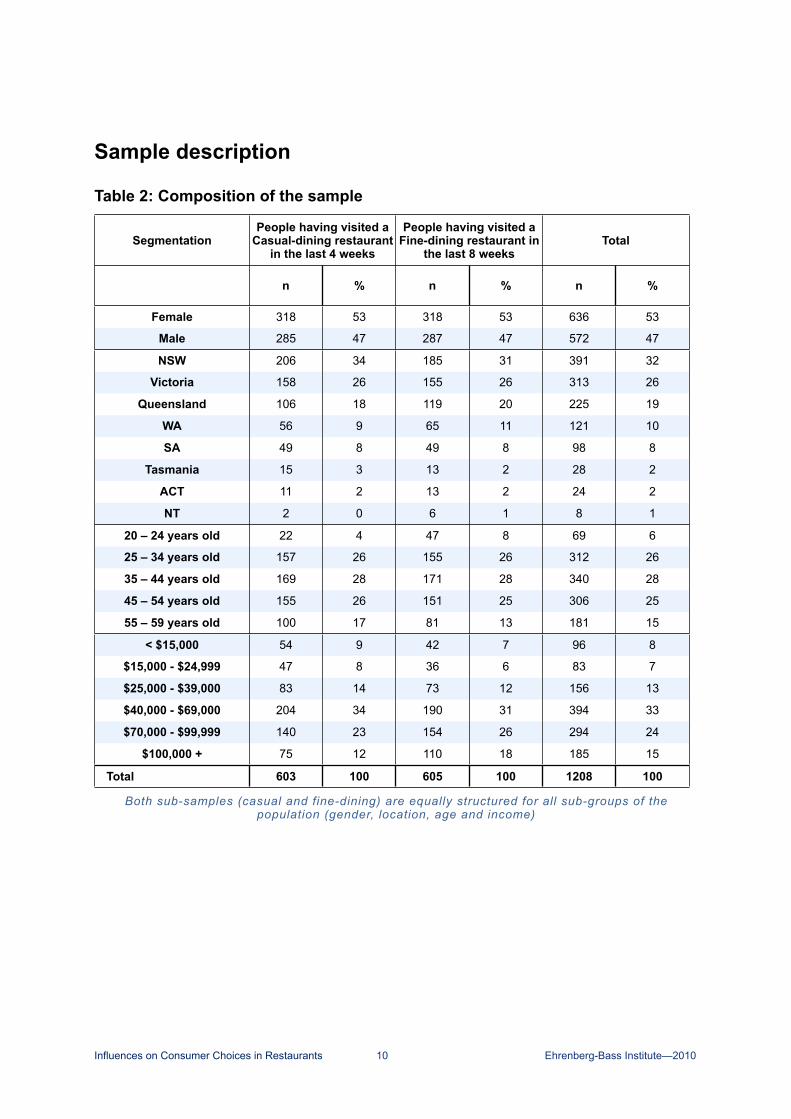
Sample description
Table 2: Composition of the sample
SegmentationPeople having visited a
Casual-dining restaurant in the last 4 weeks
People having visited a Casual-dining restaurant
in the last 4 weeks
People having visited a Fine-dining restaurant in
the last 8 weeks
People having visited a Fine-dining restaurant in
the last 8 weeksTotalTotal
n % n % n %
Female 318 53 318 53 636 53
Male 285 47 287 47 572 47
NSW 206 34 185 31 391 32
Victoria 158 26 155 26 313 26
Queensland 106 18 119 20 225 19
WA 56 9 65 11 121 10
SA 49 8 49 8 98 8
Tasmania 15 3 13 2 28 2
ACT 11 2 13 2 24 2
NT 2 0 6 1 8 1
20 – 24 years old 22 4 47 8 69 6
25 – 34 years old 157 26 155 26 312 26
35 – 44 years old 169 28 171 28 340 28
45 – 54 years old 155 26 151 25 306 25
55 – 59 years old 100 17 81 13 181 15
< $15,000 54 9 42 7 96 8
$15,000 - $24,999 47 8 36 6 83 7
$25,000 - $39,000 83 14 73 12 156 13
$40,000 - $69,000 204 34 190 31 394 33
$70,000 - $99,999 140 23 154 26 294 24
$100,000 + 75 12 110 18 185 15
Total 603 100 605 100 1208 100
Both sub-samples (casual and fine-dining) are equally structured for all sub-groups of the population (gender, location, age and income)
Influences on Consumer Choices in Restaurants 10 Ehrenberg-Bass Institute—2010

OBJECTIVE 1: CONSUMERS’ RESTAURANT EXPERIENCEThis section describes consumers’ restaurant patronage behaviour in a restaurant context within the time period of the last 4-weeks for the casual restaurant patrons and of the last 8-weeks for fine-dining restaurant patrons.
Table 3: Penetration of restaurants visit
Food service outlet
PenetrationPenetrationFood service outlet n %
Casual 1126 93
Fast food 965 80
Take-away 939 78
Fine-dining* 848 70
Average 80
Casual-dining has a higher penetration rate than fine-dining restaurants
* Penetration measured over 8-weeks
Casual-dining has a higher penetration rate (93% of the respondents visited a casual-dining restaurant in the last 4 weeks) than fine-dining restaurants—70% of the sample respondents reported to have visited such an outlet during the last 8 weeks.
Duplication of restaurants visitIn this section, we examine the sharing of customers between the main categories of restaurants and eateries. We examine this by cross-tabulating the customers of each eatery type (i.e., casual restaurant) with the customers of every other eatery type (i.e., fast food) and examine the overlaps, or duplications; that is the proportion of people who bought both. Each category is listed in the first column, followed by a percentage which indicates the penetration of that category amongst the total sample.
The table can be interpreted as follows: Of the 93% of people who ate at a casual restaurant in the last month, 81% also ate at a fast food restaurant. Of the 80% of people who ate at a fast food restaurant in the last month, 95% also ate at a casual restaurant and so on. Of course, the diagonals total 100% (those who ate at a casual restaurant who ate at a casual restaurant), and thus these figures are shown in the table in a way so as to detract attention from these figures.
The key observation from duplication of purchase tables such as these is the comparison of figures down each column. In markets where customers divide their purchases among competing ‘brands’ (or, restaurant types in this example) freely,
Influences on Consumer Choices in Restaurants 11 Ehrenberg-Bass Institute—2010

that is, treating each brand as a substitute for every other, then the column figures will be extremely similar, or the same. And furthermore, the figures in each column will reflect the penetration of the brand, which are the figures in the first column from left.
This then means that the same proportion of each brand’s customers are dividing their purchases with each competitive brand, solely in line with the overall popularity of those competitive brands in each case. The implication of this then is that each brand is perfectly substitutable with each other, and the sharing is based only on the popularity (penetrations) of the brands.
Almost every product market or category exhibits this pattern of duplication of purchase. When there are discrepancies away from this overall pattern of equal figures within each column, this is an indication that sharing between two or more restaurant types might be higher (or, conversely lower), thus indicating that these restaurant types are closer (or more distant) competitors than they are with other eateries in the same market. Indeed, in certain of these situations, this can provide evidence that the market is not just one holistic market, but are in fact a number of somewhat separate markets.
The table below presents this information for the main restaurant types in the market. Inspecting them in this way therefore implies that we are initially treating them as if they are directly substitutable products with one another. Adherence to (or deviation from) this pattern will give us some evidence to say one way or the other whether this is a justified assumption.
The duplication of restaurant visits by casual and fine-dining patrons (shown in the Table below) indicates that of the respondents who visited a casual-dining restaurant during the last 4 weeks (93%), approximately 81% of those respondents also visited a fast-food outlet, approximately 79% of them also visited a Take-away outlet, and 68% of them also visited a fine-dining restaurant during the 4-week period. These results are very much in line with the average penetration rate of patrons visiting casual and fine-dining restaurants.
Influences on Consumer Choices in Restaurants 12 Ehrenberg-Bass Institute—2010
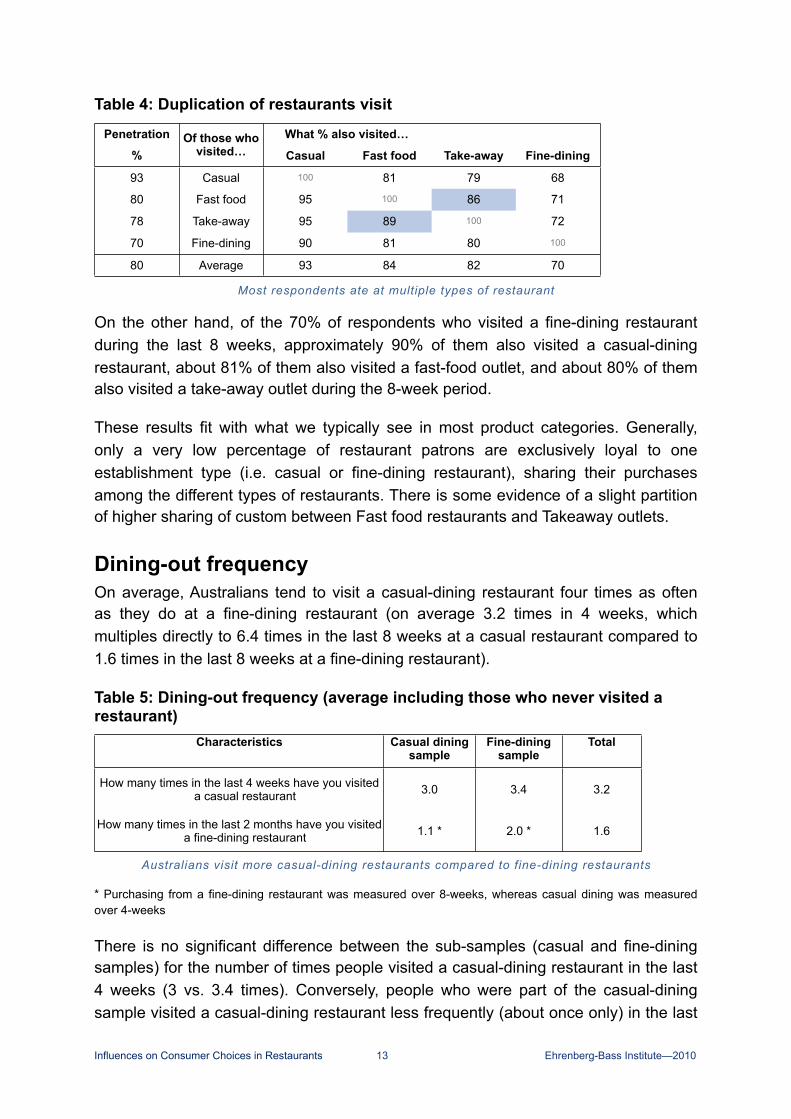
Table 4: Duplication of restaurants visit
Penetration
%Of those who
visited…What % also visited…What % also visited…What % also visited…What % also visited…Penetration
%Of those who
visited… Casual Fast food Take-away Fine-dining
93 Casual 100 81 79 68
80 Fast food 95 100 86 71
78 Take-away 95 89 100 72
70 Fine-dining 90 81 80 100
80 Average 93 84 82 70
Most respondents ate at multiple types of restaurant
On the other hand, of the 70% of respondents who visited a fine-dining restaurant during the last 8 weeks, approximately 90% of them also visited a casual-dining restaurant, about 81% of them also visited a fast-food outlet, and about 80% of them also visited a take-away outlet during the 8-week period.
These results fit with what we typically see in most product categories. Generally, only a very low percentage of restaurant patrons are exclusively loyal to one establishment type (i.e. casual or fine-dining restaurant), sharing their purchases among the different types of restaurants. There is some evidence of a slight partition of higher sharing of custom between Fast food restaurants and Takeaway outlets.
Dining-out frequencyOn average, Australians tend to visit a casual-dining restaurant four times as often as they do at a fine-dining restaurant (on average 3.2 times in 4 weeks, which multiples directly to 6.4 times in the last 8 weeks at a casual restaurant compared to 1.6 times in the last 8 weeks at a fine-dining restaurant).
Table 5: Dining-out frequency (average including those who never visited a restaurant)
Characteristics Casual dining sample
Fine-dining sample
Total
How many times in the last 4 weeks have you visited a casual restaurant 3.0 3.4 3.2
How many times in the last 2 months have you visited a fine-dining restaurant 1.1 * 2.0 * 1.6
Australians visit more casual-dining restaurants compared to fine-dining restaurants
* Purchasing from a fine-dining restaurant was measured over 8-weeks, whereas casual dining was measured over 4-weeks
There is no significant difference between the sub-samples (casual and fine-dining samples) for the number of times people visited a casual-dining restaurant in the last 4 weeks (3 vs. 3.4 times). Conversely, people who were part of the casual-dining sample visited a casual-dining restaurant less frequently (about once only) in the last
Influences on Consumer Choices in Restaurants 13 Ehrenberg-Bass Institute—2010

8 weeks compared to the people who comprised the fine-dining sample (twice in the last 8 weeks).
When thinking of the frequency of consumers’ casual-dining restaurant patronage (approximately 3 times in the last 4 weeks), it is logical to estimate that the average is comprised of people with a range of different frequencies of eating out: some people might not eat out at all in the 4 weeks; some eating out once; others twice; and so on. Plotting a histogram of the frequency of each eating occasion results in a distribution—the distribution of such purchase frequencies is typically the Negative Binomial Distribution (the NBD), rather than the Normal Distribution (a bell-shaped curve). The most obvious characteristic of the NBD is the bunching up of responses towards the left-hand end of the chart—the high proportion of people making low numbers of visits, 0, 1 or 2 purchases—and the corresponding long tail of small numbers of people making a higher number of purchases.
The majority of respondents reported visiting a casual-dining restaurant less than 3 times each month (see Figure 1). Similarly, most of the respondents who visited a fine-dining restaurant did so less frequently than the average (between once or twice depending of the subsample).
Figure 1: Distribution of casual-restaurant visits in the last 4 weeks
0%
23%
34%
14% 13%
5% 4% 1% 2%
0% 1% 0% 1% 0% 0% 1% 0% 0% 0%
5%
19%
26%
15% 16%
6% 5%
1%
4%
0% 1% 0% 0% 0% 0% 1% 0% 0% 0%
0% 0 1 2 3 4 5 6 7 8 9 10 11 12 13 14 15 18 20 30
Num
ber o
f res
pond
ent
Number of visit done in a casual restaurant in the last 4 weeks
How many times in the last 4 weeks have you visited a casual restaurant (excluding food court and fish & chips outlets)?
Casual Dining Sample
Fine Dining sample
Influences on Consumer Choices in Restaurants 14 Ehrenberg-Bass Institute—2010

Because a requirement to participate in the survey was to have visited a casual-dining restaurant at least once (for the casual dining sample) and a fine-dining restaurant at least once (for the fine-dining sample), the penetration rates for both are rather high; higher than we would expect in the population as a whole—only a few respondents had not visited one or the other type of restaurant in each sub-sample (casual vs. fine-dining).
The distribution (bunching up on the left, declining to a long tail on the right) is very similar in comparison to the frequency of patrons reporting to have visited a fine-dining restaurant (Figure 2), but even more pronounced, due to the lower penetration and purchase frequency of fine dining.
Figure 2: Distribution of fine-dining restaurant visits in the last 8 weeks
48%
28%
14%
4% 2% 1% 1% 0% 1% 1% 0% 0%
56%
26%
8% 5%
1% 1% 0%
2% 0% 1% 0%
0 1 2 3 4 5 6 7 8 10 20+
Num
ber o
f res
pond
ent
Number of visit done in a fine-dining restaurant in the last 8 weeks
How many times in the last 2 months have you visited a fine-dining restaurant?
Casual Dining Sample
Fine Dining sample
Most people dine at a fine dining restaurant very infrequently
Influences on Consumer Choices in Restaurants 15 Ehrenberg-Bass Institute—2010

Seafood consumption frequency when dining-out in a casual restaurantRespondents who reported visiting a casual-dining restaurant in the last 4 weeks (1,175 in total) were asked to estimate the number of times they ordered various seafood species in a casual-dining restaurant during the 4-week time period. We start to describe the results of this question with a presentation of the distribution for each species, followed by the presentation of the average number of times those species have been ordered compared to the average number of visits to a casual-dining restaurant.
Table 6: Distribution of purchase frequencies for seafood species within the last 4 weeks at a casual restaurant (excluding food court and fish & chip outlets)
Frequency Prawn Calamari Squid
Fresh Salmon
Barra mundi Scallop Oyster Snapper Fresh
Tuna Lobster Sardine
0 461 620 851 890 910 939 970 1022 1082 1127
1 521 413 249 244 210 182 176 113 78 33
2 133 92 47 28 38 38 23 24 14 11
3 28 26 13 6 7 7 3 7 1 2
4 18 14 7 4 6 4 2 2 0 0
5 8 6 7 1 2 3 1 5 0 0
6 3 2 1 1 1 1 0 1 0 0
7 0 0 0 0 0 0 0 0 0 1
8 0 0 0 0 0 0 0 0 0 0
9 1 0 0 0 0 0 0 0 0 1
10 2 2 0 1 1 1 0 1 0 0Penetration
(%)61 47 28 24 23 20 17 13 8 4
Based on these figures, one can calculate the penetration (i.e. the number of times each species was ordered at least once during the time period) of each species in the casual restaurant context for the last 4 weeks. Prawns appear to be by far the most popular seafood species to be ordered at a casual-dining restaurant with a penetration of 61%. On the other hand, sardines have the lowest penetration, with approximately only 4% of respondents who visited a casual-dining restaurant in the last 4 weeks having ordered them.
Based on the number of people who visited a casual-dining restaurant in the last 4 weeks, we can estimate the average number of visits and compare that figure with the average number of times a species was ordered (Figure 3). People visited a
Influences on Consumer Choices in Restaurants 16 Ehrenberg-Bass Institute—2010

casual-dining restaurant an average 3 times in the last 4 weeks. In line with the penetration rate of each species, the average number of times each species was ordered decreased from the penetration rate of prawns (ordered on average just under once in the last 4 weeks) to lobster and sardines with an average order of only 0.1 in the last 4 weeks. The average number of orders for each species does include people who never order the species as well as those who ordered a particular species at least once.
Figure 3: Average number of times a seafood species was ordered in a casual restaurant in the last 4 weeks
3.3
0.9
0.7
0.4 0.3 0.3 0.3 0.2 0.2 0.1 0.1
0.0
0.5
1.0
1.5
2.0
2.5
3.0
3.5
# of visit Prawn Calamari/Squid Fresh Salmon Barramundi Scallop Oyster Snapper Fresh Tuna Lobster Sardine
Mea
n
Visit and species
Average number of order of seafood species in a casual restaurant in the last 4 weeks (of those who consumed or not the species and visited at least once a casual restaurant)
Prawns and Squid are the most popularly ordered species at casual restaurants.
The previous chart shows the average number of purchases across all respondents, including the people who did not buy the species at all in the previous 4 weeks (their purchase rate was 0). Therefore, much of the difference between species is likely to be due to the high number of non-purchasers, especially for those species that had a low penetration.
Therefore, in order to separate the effect of the non-purchasers, we can analyse the average purchase rate for each species but only for those people who had bought the species in the previous 4 weeks; therefore, omitting in each case the non-purchasers. This is shown in the following table.
Influences on Consumer Choices in Restaurants 17 Ehrenberg-Bass Institute—2010

Table 7: Average number of orders of each species in last 4 weeks, of those who ordered each species at least once (at a casual restaurant)
Species Penetration%
Average number of
ordersPrawns 61 1.4
Calamari Squid 47 1.4
Fresh Salmon 28 1.4
Barra mundi 24 1.3
Scallops 23 1.4
Oysters 20 1.4
Snapper 17 1.2
Fresh Tuna 13 1.5
Lobster 8 1.2
Sardines 4 1.6
AverageAverage 1.4
Loyalty varies little: penetration matters most, as there’s not much difference between the purchase rates of species
On average, restaurant patrons who ordered prawns at least once, ordered prawns approximately 1.4 times during a 4-week period. The highest score is obtained for sardines, but which was only slightly higher, with an average number of times of only 1.6 times. This indicates that despite having a very low penetration rate (only 4 percent of people bought sardines in the 4-week period), those who did so ordered them about the same number of times as did buyers of other seafood species.
Loyalty varies littleWhen considering the responses of people who consumed each of the species at least once, the average number of times each was ordered now is very similar across all species—all are about 1.4 times. Despite the very large difference in penetration rates—about 15-fold, from 60% down to 4%—the average number of purchases (or, orders at the restaurant) of each species made by those people who bought the species at all hardly varied at all—a maximum of 1.6 to a minimum of 1.2.
This pattern—where the number of buyers varies a great deal, while purchase rates hardly vary at all—is not at all unique. In fact, this pattern holds in every competitive market where there’s repeat purchasing, wherever it has been examined. What this means is that loyalty (or, purchase rates in this instance) does not differ appreciably between brands (or, species in this instance), whereas the number of people who buy each species at all is the biggest difference between species—only 40% of people did not buy a restaurant meal including prawns in the last 4 weeks, compared to 96% of people who did not buy any sardines.
Influences on Consumer Choices in Restaurants 18 Ehrenberg-Bass Institute—2010

As is the case with all products in any industry around the world, the biggest marketing challenge facing the industry (collectively, but also individually within species industry groups) is how to build penetration. In order to grow, it is penetration that must move the most, and therefore getting more people to buy the species is a much bigger challenge than trying to get existing buyers to buy more or at a higher rate. But also, lifting the consumption of seafood in total, will lift the consumption of all species—‘a rising tide will lift all boats’.
Seafood consumption frequency when dining-out at a fine-dining restaurantRespondents who reported visiting a fine-dining restaurant during the prior 8 weeks (919 in total) were asked to estimate the number of times they ordered various seafood species in a fine-dining restaurant during that period of time. We start to describe the results of this question with a presentation of the distribution for each seafood species, and then present the average number of times those species had been ordered compared to the average number of visits to a fine-dining restaurant during the 8-week time period.
Table 8: Distribution of purchase frequencies for seafood species within the last 8 weeks at a fine-dining restaurant
Frequency Prawn Calamari Squid
Fresh Salmon
Scallop Oyster Barra mundi
Lobster Snapper Fresh Tuna
Sardine
0 479 666 686 706 711 729 785 810 838 897
1 349 200 199 178 173 172 120 90 60 16
2 62 31 18 24 17 11 5 11 13 1
3 16 1 6 4 9 1 7 4 4 2
4 4 6 5 3 3 3 1 0 2 0
5 4 1 2 2 3 1 0 1 1 2
6 3 1 1 0 2 1 0 1 0 0
7 0 0 0 0 0 0 0 0 0 0
8 0 0 0 0 0 0 0 0 0 0
9 0 0 0 0 0 0 0 0 0 0
10+ 2 3 2 2 2 1 1 2 1 1Penetration
(%)48 28 25 23 23 21 15 12 9 2
Prawns are (still) the most popular seafood species ordered at fine-dining restaurants with a penetration of 48%, followed again by squid (28%). Conversely, sardines has the lowest level of penetration, with approximately 2% of respondents who visited a fine-dining restaurant ordering sardines in the last 8 weeks.
Influences on Consumer Choices in Restaurants 19 Ehrenberg-Bass Institute—2010

Table 9: Comparison of penetrations of species between casual and fine-dining restaurants
Species Penetration%
Casual
Penetration%
Fine-diningPrawns 61 48↓
Calamari Squid 47 28↓
Fresh Salmon 28 25
Barramundi 24 21
Scallops 23 23
Oysters 20 23
Snapper 17 12↓
Fresh Tuna 13 9↓
Lobster 8 15↑
Sardines 4 2
Except for lobster, penetration is generally lower in fine-dining than in casual restaurants
Despite the longer period of time investigated (8 weeks for fine-dining versus 4 weeks for casual), the penetration rate of each species in fine-dining is generally lower in comparison to its penetration at casual–dining restaurants. Lobster is the biggest exception to this, where its penetration doubles for fine-dining; an issue primarily of availability, where lobster is typically unavailable in casual restaurants. However, oysters and scallops also have high penetrations in fine-dining restaurants; and are both higher than for Barramundi.
This general lower level of penetration of each species is mainly just a reflection of the lower penetration of fine dining compared to the penetration of casual dining: penetration of casual dining was 3.2 times in 4 weeks, c.f. 1.6 times for fine dining in 8 weeks.
As for the casual-dining restaurant patrons, the penetration rate for consumption of all seafood species should be interpreted keeping in mind the physical availability of particular species in casual-dining restaurants. In other words, sardines have the lowest penetration rate because they are not very popular from a consumer perspective but also because they are not widely available in a restaurant context. Therefore, if the species is not available on the menu, consumers cannot purchase it.
Based on the number of people who visited a fine-dining restaurant during the last 8 weeks (919), it is possible to estimate the average patronage of fine-dining restaurant patrons and compare that figure with the average number of times a particular seafood species was ordered (Figure 5). The sample of restaurant patrons visited a fine-dining restaurant an average of just over 2 times during the last 8 weeks.
Influences on Consumer Choices in Restaurants 20 Ehrenberg-Bass Institute—2010

Again for fine-dining restaurants, in line with the penetration rate for each seafood species, the average number of times that each species was ordered decreased from the most popular species, prawns (ordered on average just under once during the last 8 weeks), to fresh tuna and sardines with an average order of 0.1 during the last 8 weeks. The average number of orders shown below in figure 5 again includes non-purchasers.
Figure 4: Average number of times seafood species were ordered at a fine-dining restaurant during the last 8 weeks
2.1
0.7
0.4 0.4 0.3 0.3 0.3 0.2 0.2 0.1
0.1 0.0
0.5
1.0
1.5
2.0
2.5
# of visit Prawn Calamari/Squid
Fresh Salmon
Scallop Oyster Barramundi Lobster Snapper Fresh Tuna Sardine
Mea
n
Visit and species
Average number of order of seafood species in a fine-dining restaurant in the last 8 weeks
(of those who consumed or not the species and visited at least once a fine-dining restaurant)
However, when we consider only the responses of restaurant patrons who consumed each of the seafood species at least once during the 8-week period, the average number of times a particular species was ordered again becomes very similar across all species.
Influences on Consumer Choices in Restaurants 21 Ehrenberg-Bass Institute—2010

Table 10: Average number of orders of each species in last 8 weeks, of those who ordered each species at least once (at a fine-dining restaurant)
Species Penetration%
Average number of
ordersPrawns 48 1.4
Calamari/Squid 28 1.5
Fresh Salmon 25 1.5
Scallops 23 1.4
Oysters 23 1.4
Barramundi 21 1.2
Lobster 15 1.3
Snapper 12 1.9
Fresh Tuna 9 1.5
Sardines 2 2.2
AverageAverage 1.5
Again, penetration matters most. There is not much difference in purchase rates of species.Snapper and Sardines have higher rates of purchase than other species
On average, patrons who ordered prawns at least once at a fine-dining restaurant, ordered prawns approximately 1.4 times during an 8-week period (the same as for casual-dining restaurant patrons during the last 4 weeks). As can be seen in the table above, sardines again were ordered at a high rate by the few people who did order it at all in fine-dining restaurants. Similarly, Snapper has a low level of penetration, but a higher average purchase rate among those consumers who purchased Snapper at least once during the 8-week period. Furthermore, whereas Snapper was purchased below the average of other species in casual restaurants, in fine-dining restaurants, it was purchased above the average of other species; indicating that it is more popular as a meal in fine-dining restaurants than in casual restaurants.
Loyalty varies littleAgain, just as was the case with casual dining, the average number of times each was ordered now is very similar across all species—all are about 1.5 times. Despite the very large difference in penetration rates—over 20-fold, from 48% down to 2%—the average number of purchases of each species made by those people who bought the species at all varied very little—from a maximum of 2.2 to a minimum of 1.2. Clearly, sardines, and to a lesser extent snapper, are exceptions to this. Perhaps it is the small size of sardines that results in the species having such a high average order rate; or it could be due to the unique preparation or taste of sardines in comparison to other seafood.
Again, this pattern—where the number of buyers varies a great deal, while purchase rates hardly vary at all—is common to every competitive market where there’s repeat purchasing. And what this means is that loyalty does not differ appreciably between
Influences on Consumer Choices in Restaurants 22 Ehrenberg-Bass Institute—2010

species, whereas the number of people who buy each species at all is the biggest difference between species—only 52% of people did not buy a prawns meal at a fine-dining restaurant in the last 8 weeks, compared to 98% of people who did not buy any sardines meals.
Therefore, the biggest marketing challenge facing the industry remains the necessity of building penetration. In order to grow, it is penetration that must move the most, and therefore getting more people to buy seafood is a much bigger challenge than trying to get existing buyers to buy more or at a higher rate.
Money spent for a dishRespondents were asked to indicate the amount of money that they would usually spend on various dishes (a red meat dish; a white meat dish; a shellfish dish; a fish dish and a vegetarian dish) at a restaurant. Respondents were asked to consider the context of eating at either a casual restaurant or at a fine-dining restaurant.
Figure 5: Money spent for a red meat dish in a casual vs. fine-dining restaurant
3% 2%
10%
31% 30%
18%
4%
1% 1%
3%
1%
4%
12%
25%
31%
11%
8%
4%
0%
5%
10%
15%
20%
25%
30%
35%
0 $10 or less $11-$15 $16-$20 $21-$25 $26-$30 $31-$35 $36-$40 >$40
% re
spon
dent
s
Price tiers
How much would you usually spend for a Red Meat dish (for yourself and excluding beverages)?
Casual Dining Sample
Fine Dining Sample
Most people will usually pay $16-25 for a red meat dish at a casual restaurant; $26-30 from a fine-dining restaurant
The distributions for the usual expenditure on a red meat dish from casual and fine-dining restaurants are both normally distributed (bell-shaped). The majority of the casual-dining sub-sample would usually spend between $16 and $25 on a red-meat dish. On the other hand, most respondents of the fine-dining sub-sample would usually spend between $26 and $30 for a red meat dish.
Influences on Consumer Choices in Restaurants 23 Ehrenberg-Bass Institute—2010

In looking at those respondents who spent $15 or more for a main meal in both types of restaurant, on average casual-dining patrons usually spend $24 on a red meat dish, compared to $29 form a fine-dining restaurant.
Figure 6: Money spent for a white meat dish in a casual vs. fine-dining restaurant
2% 3%
19%
42%
21%
9%
2% 0% 1% 1% 1%
8%
25% 27%
25%
7%
4%
2%
0%
5%
10%
15%
20%
25%
30%
35%
40%
45%
0 $10 or less $11-$15 $16-$20 $21-$25 $26-$30 $31-$35 $36-$40 >$40
% o
f res
pond
ents
Price tiers
How much would you usually spend for a White Meat dish (for yourself and excluding beverages)?
Casual Dining Sample
Fine Dining Sample
Again, the distributions of the usual expenditures on white meat dishes from both casual-dining and fine-dining restaurants were approximately normally distributed. Most respondents usually spending $16-20 on a white meat dish in a casual restaurant and $21-25 from a fine-dining restaurant. However, there was larger variation around this average expenditure in fine-dining restaurants than for red-meat.
In looking at those respondents who spent $15 or more for a main meal2 in both types of restaurant, on average casual-dining patrons usually spend $22 on a red meat dish, compared to $25 from a fine-dining restaurant.
Influences on Consumer Choices in Restaurants 24 Ehrenberg-Bass Institute—2010
2 Because we stated during the interview that a main plate in a casual restaurant would cost about $15 to $30 and about $30 to $50 in a fine dining restaurant, we focus the analysis on the responses above $15.

Figure 7: Money spent for a shellfish dish in a casual vs. fine-dining restaurant
9%
1%
8%
25%
28%
19%
5% 3%
6%
11%
1%
4%
8%
18%
24%
13%
11%
20%
0%
5%
10%
15%
20%
25%
30%
0 $10 or less $11-$15 $16-$20 $21-$25 $26-$30 $31-$35 $36-$40 >$40
% o
f res
pond
ents
Price tiers
How much would you usually spend for a Shellfish dish (for yourself and excluding beverages)?
Casual Dining Sample (n=603) Fine Dining Sample (n=605)
‘Lobster effect’: a large number of people are willing to pay high amounts on shellfish (presumably lobster) at fine dining restaurants. There’s also a number not willing to buy any shellfish.
While the dominant feature of the distributions of expenditures on shellfish is the normal distribution, there are some unique characteristics in comparison to what was seen in red and white meats. In both the casual and fine-dining contexts, we see a group of people who will not buy any shellfish at all—some of this will be due to people having an allergy to shellfish. However, we also see a pronounced ‘kick-up’ in the tail at the right hand of the chart, indicating a group of people willing to pay more than $40 for a meal with shellfish. This is much more pronounced in the case of fine-dining restaurants than in casual restaurants—the ‘lobster effect’.
The average expenditures that people would usually make for shellfish from both casual and fine-dining restaurants were higher than for either of the meats. On average, among those who spent $15 or more for a main meal in both types of restaurant, we found that casual-dining patrons usually spend $26 for a shellfish dish, c.f., $32 for fine-dining patrons.
Influences on Consumer Choices in Restaurants 25 Ehrenberg-Bass Institute—2010

Figure 8: Money spent for a fish dish in a casual vs. fine-dining restaurant
2% 3%
17%
37%
25%
11%
2% 1% 1% 3%
1%
6%
18%
24%
29%
10%
5%
8%
0%
5%
10%
15%
20%
25%
30%
35%
40%
0 $10 or less $11-$15 $16-$20 $21-$25 $26-$30 $31-$35 $36-$40 >$40
% o
f res
pond
ents
Price tiers
How much would you usually spend for a Fish dish (for yourself and excluding beverages)?
Casual Dining Sample (n=603) Fine Dining Sample (n=605)
Fish has broader appeal than does shellfish
In comparison to shellfish, there are fewer people with an aversion to fish; most are willing to buy fish at the restaurant as the number of people who do not order fish at all is quite low. The difference between the usual expenditures from casual to fine-dining restaurants is more pronounced for fish dishes than for meats and for shellfish; with most casual diners paying $16-20 versus $26-30 for fine-dining patrons. Furthermore, whereas there is a pronounced ‘kick-up’ in the tail among the fine-dining patrons here in relation to fish, as there was for shellfish previously, this is not evident among the casual diners—casual diners don’t usually pay more than $30 for a fish meal.
On average, among those who spent $15 or more for a main meal in both types of restaurant, casual-dining patrons usually spend $22 for a fish dish, c.f., $27 for fine-dining patrons.
Influences on Consumer Choices in Restaurants 26 Ehrenberg-Bass Institute—2010

Figure 9: Money spent for a vegetarian dish in a casual vs. fine-dining restaurant
24%
12%
30%
27%
5%
1% 1% 0% 0%
24%
6%
20%
26%
14%
7%
1% 1% 0%
0%
5%
10%
15%
20%
25%
30%
35%
0 $10 or less $11-$15 $16-$20 $21-$25 $26-$30 $31-$35 $36-$40 >$40
% o
f res
pond
ents
Price tiers
How much would you usually spend for a Vegetarian dish (for yourself and excluding beverages)?
Casual Dining Sample (n=603) Fine Dining Sample (n=605)
Many people are unwilling to buy a vegetarian meal
Given the large proportion of respondents who reported an unwillingness to spend their money on a vegetarian dish, there is evidence to suggest that a large majority of both casual and fine-dining restaurant patrons avoid the consumption of vegetarian dishes when dining out. We again see that fine-dining sample respondents spend more on average in comparison to casual-dining restaurant patrons. However, both groups usually expect to spend less for vegetarian meals than for meals with other proteins. The majority of the casual-dining sample respondents spend approximately $11 to $20 on a vegetarian dish, whereas fine-dining restaurant patrons spent $16 to $20 on average.
On average, among those who spent $15 or more for a main meal in both types of restaurant, casual-dining patrons usually expect to spend $19 for a vegetarian dish, c.f., $21 for fine-dining patrons.
Influences on Consumer Choices in Restaurants 27 Ehrenberg-Bass Institute—2010

Figure 10: Average expenditure for a dish in a casual vs. fine-dining restaurant (for a dish valued $15 or more)
24
21.5
25.5
22.5
18.6
29
25.3
32
27
21
0
5
10
15
20
25
30
35
Red meat White meat Shellfish Fish Vegetarian
$
Main ingedient of meal
Average expenditure for a dish in casual vs. fine-dining restaurant Casual Dining Sample (n=603)
Fine Dining Sample (n=605)
People expect to pay more at fine-dining than casual restaurants.People expect to pay most for shellfish dishes.
Overall, one can assume that when dining out, people are only willing to spend slightly more for a shellfish dish compared to all other dishes (Figure 12). And people would spend slightly more for a red meat dish than for a fish dish.
Influences on Consumer Choices in Restaurants 28 Ehrenberg-Bass Institute—2010

Number of red/white meat, shellfish, fish and vegetarian dishes ordered at a casual-dining restaurantThis section describes the number of red/white meat, shellfish, fish and vegetarian dishes that casual-dining restaurant patrons ordered during a 4-week period.
Figure 11: Number of red meat dishes ordered at a casual restaurant during the last 4 weeks
75
65
17 11 3
1 1 1 2
54
92
41
29
9
7
0
5
1
5
41
17
24
11
8
3
1
4
3 4
7
7 3
2
4
0
3
1 1 2
6 3
3 0
4
1
0 0 0 0 0
2
0 1
1
1 1 2 3 0 0
1 1
8
0%
10%
20%
30%
40%
50%
60%
70%
80%
90%
100%
1 2 3 4 5 6 7 8 9+
# an
d %
of r
espo
nden
ts
Number of visit to a casual restaurant in the last 4 weeks
Number of people having ordered a red meat meal * Number of time they visited a casual restaurant in the last 4 weeks
6+ orders
5 orders
4 orders
3 orders
2 orders
1 order
0 order
Most respondents had ordered a red meat dish only once at a casual-dining restaurant during the 4-week period
The majority of respondents reported to have visited a casual-dining restaurant between 1 to 4 times during the 4-week period. Of those respondents reported to have visited a casual-dining restaurant only once during the 4-week period (139 respondents), more than half did not order a red meat dish when patronising a casual-dining restaurant.
Influences on Consumer Choices in Restaurants 29 Ehrenberg-Bass Institute—2010

Figure 12: Number of white meat dishes ordered at a casual-dining restaurant during the last 4 weeks
88
88
23 21
3 1
1 2
2
48
90
49
28
14
6
3
2
1
2
20 11
24
5
10
4
5
4
1 3 2
4
4 3
1
2
3
0 0 0
1
1 1
0
1
1
0 1 0 1 1 2
0
0
1
0 2 1 1 1 0 0
1
8
0%
10%
20%
30%
40%
50%
60%
70%
80%
90%
100%
1 2 3 4 5 6 7 8 9+
# an
d %
of r
espo
nden
ts
Number of visit to a casual restaurant in the last 4 weeks
Number of people having ordered a white meat meal * Number of time they visited a casual restaurant in the last 4 weeks
6+ orders
5 orders
4 orders
3 orders
2 orders
1 order
0 order
Most respondents had ordered a white meat dish only once at a casual-dining restaurant during the 4-week period
Of those respondents who reported to have visited a casual-dining restaurant only once during the 4-week period , more than 60% of respondents did not order a dish containing white meat when patronising a casual-dining restaurant.
Influences on Consumer Choices in Restaurants 30 Ehrenberg-Bass Institute—2010

Figure 13: Number of shellfish dishes ordered at a casual-dining restaurant during the last 4 weeks
71
76
25 21
5 5
0
5
0
63
90
39 40
9
7
3
4
6
4
30
14 12
9
7
2
3
5
0 2
5 3
2 1
3
0
1
1 3 2 4
2 2
1 0
1
0 1 0 0
1 0
0
1
4
0 2 1 0 1 1
0 0
3
0%
10%
20%
30%
40%
50%
60%
70%
80%
90%
100%
1 2 3 4 5 6 7 8 9+
# an
d %
of r
espo
nden
ts
Number of visit to a casual restaurant in the last 4 weeks
Number of people having ordered a shellfish meal * Number of time they visited a casual restaurant in the last 4 weeks
6+ orders
5 orders
4 orders
3 orders
2 orders
1 order
0 order
Most respondents had ordered a shellfish dish only once at a casual-dining restaurant during the 4-week period
Of those respondents who reported to have visited a casual-dining restaurant only once during the last 4 weeks, 50% of respondents did not order a dish containing shellfish when patronising a casual-dining restaurant.
Influences on Consumer Choices in Restaurants 31 Ehrenberg-Bass Institute—2010

Figure 14: Number of fish dishes ordered at a casual-dining restaurant during the last 4 weeks
87
100
24 21 9
5
3
6
4
48
92
43 42 14
9 2
2
4
1 11
15 9
2
6
1
4
4
1 0 2
4 3 1
2
0
2
0 1 0
2 0 1 1
0
0
1 0 0 1
0 1 0
1
4
1 0 2 1 1 0 0 0
2
0%
10%
20%
30%
40%
50%
60%
70%
80%
90%
100%
1 2 3 4 5 6 7 8 9+
# an
d %
of r
espo
nden
ts
Number of visit to a casual restaurant in the last 4 weeks
Number of people having ordered a fish meal * Number of time they visited a casual restaurant in the last 4 weeks
6+ orders
5 orders
4 orders
3 orders
2 orders
1 order
0 order
Most respondents had ordered a fish dish once or not at all from a casual-dining restaurant during the 4-week period
Of those respondents who reported to have visited a casual-dining restaurant only once during the last 4 weeks, close to two-thirds did not order a dish containing fish when patronising a casual-dining restaurant.
Influences on Consumer Choices in Restaurants 32 Ehrenberg-Bass Institute—2010

Figure 15: Number of vegetarian dishes ordered at a casual-dining restaurant during the last 4 weeks
123 175
63 64
17
16
7
5
12
14 21
13
10
8
6 1
4
3
1 6
3
3
1
1 1
2 0
0 0
5 1
1
0 0
1
1
0 2 0 1
1
0 0
0
1
0 0 1 0
0 0 0
0
1
1 0 1 1 1 0 0
1 2
0%
10%
20%
30%
40%
50%
60%
70%
80%
90%
100%
1 2 3 4 5 6 7 8 9+
# an
d %
of r
espo
nden
ts
Number of visit to a casual restaurant in the last 4 weeks
Number of people having ordered a vegetarian meal * Number of time they visited a casual restaurant in the last 4 weeks
6+ orders
5 orders
4 orders
3 orders
2 orders
1 order
0 order
Most respondents had ordered no vegetarian dishes from a casual-dining restaurant
Of the respondents who reported to have visited a casual-dining restaurant only once during the last 4 weeks, almost 90% did not order a vegetarian dish when patronising a casual-dining restaurant.
Influences on Consumer Choices in Restaurants 33 Ehrenberg-Bass Institute—2010

Number of red/white meat, shellfish, fish and vegetarian dishes ordered at a fine-dining restaurantThis section describes the number of red/white meat, shellfish, fish and vegetarian dishes ordered by fine-dining restaurant patrons during the last 8 weeks.
Figure 16: Number of red meat dishes ordered at a fine-dining restaurant during the last 8 weeks
121
39
6
1 0 0
3
168
71
12
8 1
1
1
32
39
24
10
2
4
4
7 1
4
6
0
2
1
8 9 2
8 1 2
7
0%
10%
20%
30%
40%
50%
60%
70%
80%
90%
100%
1 2 3 4 5 6 7+
# an
d %
of r
espo
nden
ts
Number of visit to a fine-dining restaurant in the last 8 weeks
Number of people having ordered a red meat meal * Number of time they visited a fine-dining restaurant in the last 8 weeks
4+ orders
3 orders
2 orders
1 order
0 order
Most fine-dining patrons ordered a dish containing red meat once or twice during a typical 8-week period
The majority of respondents reported to have visited a fine-dining restaurant once or twice during the last 8-weeks. Of those respondents who reported to have visited a fine-dining restaurant only once during the last 8 weeks (336 respondents), 64% ordered a red meat dish when patronising a fine-dining restaurant.
Influences on Consumer Choices in Restaurants 34 Ehrenberg-Bass Institute—2010

Figure 17: Number of white meat dishes ordered at a fine-dining restaurant during the last 8 weeks
206
60
11 7 1 2
2
100
72
19
10 1 3
4
16 23
10
10
1
2
4
3 2
3 1
0 0
2
11 2
5 5
1 2 4
0%
10%
20%
30%
40%
50%
60%
70%
80%
90%
100%
1 2 3 4 5 6 7+
# an
d %
of r
espo
nden
ts
Number of visit to a fine-dining restaurant in the last 8 weeks
Number of people having ordered a white meat meal * Number of time they visited a fine-dining restaurant in the last 8 weeks
4+ orders
3 orders
2 orders
1 order
0 order
Most fine-dining patrons ordered a dish containing white meat only once during a typical 8-week period
Of those who reported to have visited a fine-dining restaurant only once during the last 8 weeks, more than 60% did not order a white meat dish when patronising a fine-dining restaurant.
Influences on Consumer Choices in Restaurants 35 Ehrenberg-Bass Institute—2010
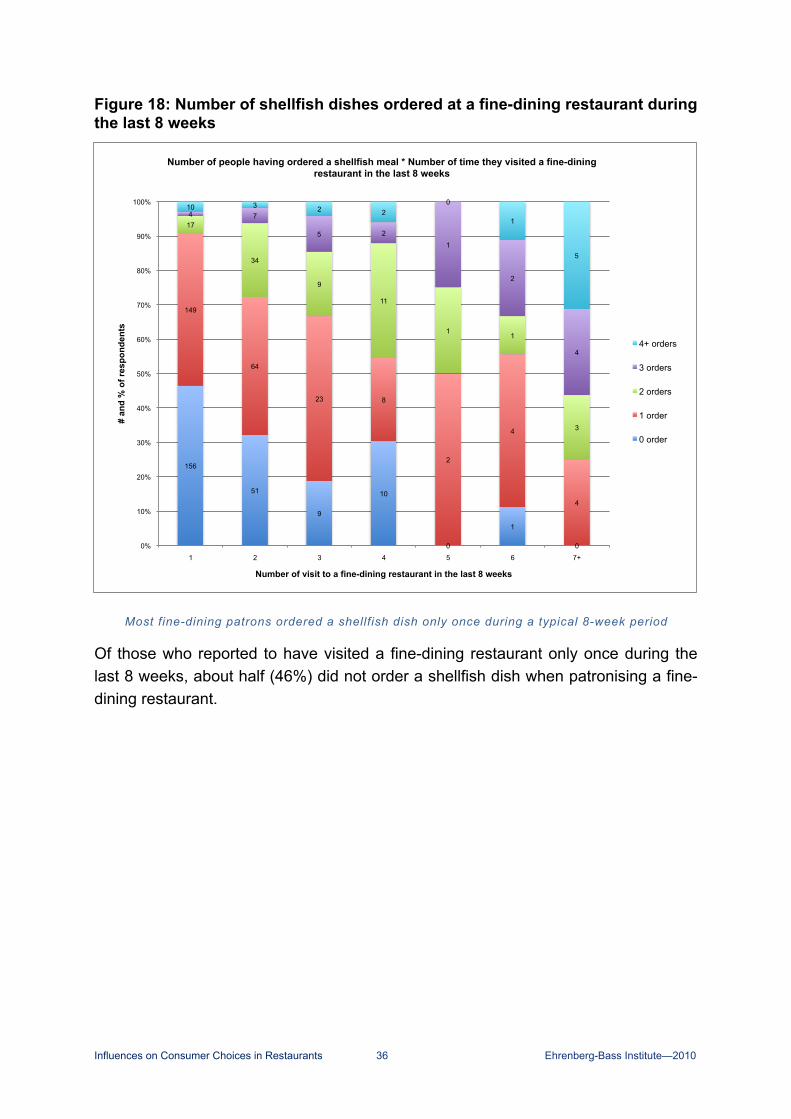
Figure 18: Number of shellfish dishes ordered at a fine-dining restaurant during the last 8 weeks
156
51
9
10
0
1
0
149
64
23 8
2
4
4
17
34
9
11
1 1
3
4 7
5 2 1
2
4
10 3 2 2 0
1
5
0%
10%
20%
30%
40%
50%
60%
70%
80%
90%
100%
1 2 3 4 5 6 7+
# an
d %
of r
espo
nden
ts
Number of visit to a fine-dining restaurant in the last 8 weeks
Number of people having ordered a shellfish meal * Number of time they visited a fine-dining restaurant in the last 8 weeks
4+ orders
3 orders
2 orders
1 order
0 order
Most fine-dining patrons ordered a shellfish dish only once during a typical 8-week period
Of those who reported to have visited a fine-dining restaurant only once during the last 8 weeks, about half (46%) did not order a shellfish dish when patronising a fine-dining restaurant.
Influences on Consumer Choices in Restaurants 36 Ehrenberg-Bass Institute—2010

Figure 19: Number of fish dishes ordered at a fine-dining restaurant during the last 8 weeks
165
38 11 7
0
1 2
152
79
17
16
2 3
6
11
34
17 6
1 3 3
5 4 2
2
0
1
2
3 4 1 2
1
1
3
0%
10%
20%
30%
40%
50%
60%
70%
80%
90%
100%
1 2 3 4 5 6 7+
# an
d %
of r
espo
nden
ts
Number of visit to a fine-dining restaurant in the last 8 weeks
Number of people having ordered a fish meal * Number of time they visited a fine-dining restaurant in the last 8 weeks
4+ orders
3 orders
2 orders
1 order
0 order
Most fine-dining patrons ordered a fish dish only once during a typical 8-week period
Of the respondents who reported to have visited a fine-dining restaurant only once during the last 8 weeks, also about 50% did not order a fish dish when patronising a fine-dining restaurant.
Influences on Consumer Choices in Restaurants 37 Ehrenberg-Bass Institute—2010

Figure 20: Number of vegetarian dishes ordered at a fine-dining restaurant during the last 8 weeks
286
121 36 24
4
4
9
42
24 11
7
0
2
2
5
10
1 1
0
0
2
0 1 0
0 0
1
1
3 3 0 1
0
2
2
0%
10%
20%
30%
40%
50%
60%
70%
80%
90%
100%
1 2 3 4 5 6 7+
# an
d %
of r
espo
nden
ts
Number of visit to a fine-dining restaurant in the last 8 weeks
Number of people having ordered a vegetarian meal * Number of time they visited a fine-dining restaurant in the last 8 weeks
4+ orders
3 orders
2 orders
1 order
0 order
Very few fine-dining patrons ordered any vegetarian dishes during a typical 8-week period
As with the casual dining patrons, very few fine-dining patrons ordered a vegetarian meal in the 8 week period: only about 15% did order any vegetarian meals when patronising a fine-dining restaurant.
Influences on Consumer Choices in Restaurants 38 Ehrenberg-Bass Institute—2010

Reasons for people to stop ordering fish and shellfish in casual and fine-dining restaurantsThis section describes the reasons given by casual and fine-dining restaurant patrons for not ordering fish and shellfish when dining-out at a restaurant. These are drawn from those respondents who reported to have not consumed fish or shellfish (at least once) during the last 4 and 8 weeks, for casual and fine dining respectively.
Reasons for not eating shellfishWith regards to shellfish dishes ordered at casual and fine-dining restaurants, we found that 35% of casual-dining restaurant patrons did not order shellfish at all during the last 4 weeks, and 38% of fine-dining restaurant patrons did not order any shellfish during the last 8 weeks.
Approximately one third of these respondents (33% of casual-diners and 36% of fine-diners), reported that there was no particular barrier in relation to ordering shellfish in a restaurant context. Thus, there is more of a problem of simply not being considered at the time of ordering, or that other menu items seem more appealing. Therefore, there is a degree of low mental availability in many diners’ minds that hinders them selecting shellfish in the restaurant.
In total, the responses ‘no particular barrier’, ‘poor availability of good quality shellfish’ and ‘don’t know’, equate to 46% of respondents who could potentially order shellfish in a restaurant if actions were taken to increase the appeal of shellfish dishes to restaurant patrons. In fact, only a very small proportion of the respondents (who didn’t order shellfish during the last 4-8 weeks) reported to be allergic to shellfish (about 6% of all respondents).
In summary, there is room to increase the consumption of shellfish in casual and fine-dining restaurants for people who reported to have not ordered shellfish when dining at a restaurant during the last 4-8 weeks. This will require significant effort outside of the restaurant, in building the mental availability of shellfish in order to stimulate the desire of consuming it so that once inside the restaurant, when presented with a shellfish option, it will be more likely to be chosen.
Later in this report we recommend some actions that could be taken for chefs in restaurants to produce seafood dishes more in-line with consumers’ expectations.
Influences on Consumer Choices in Restaurants 39 Ehrenberg-Bass Institute—2010

Figure 21: Main reason that stopped people ordering shellfish in a casual vs. fine-dining restaurant
33%
27%
21%
7% 5%
4%
1%
36%
13%
32%
6% 5% 4%
0% 0%
5%
10%
15%
20%
25%
30%
35%
40%
No particular barrier
Too expensive Do not like shellfish Allergic-health reasons
Poor availability of good quality
shellfish
Don't know We are in a remote area
Num
ber o
f res
pond
ents
What is the main reason that stopped you ordering shellfish?
Casual Dining Sample (n=208)
Fine Dining Sample (n=227)
Most people have no particular barrier to eating shellfish. However, there is a considerable number who simply do not like eating it.
Whereas being ‘too expensive’ is a considerable barrier to eating shellfish in a casual dining restaurant, with almost a third of people (27%) reporting this as the main reason that stops them from ordering shellfish at a casual dining restaurant; it is half as important in relation to ordering at a fine-dining restaurant, with only 13% of the fine-dining segment indicating this as their main barrier. In the fine-dining segment however, it is the dislike of shellfish that is a more prominent barrier, with close to one third (32%) of fine-diners specifying their dislike of shellfish as the main barrier. This reflects the focus of the fine-dining segment on the pleasure seeking aspect of dining whereas the context of casual dining is more to do with value seeking.
Influences on Consumer Choices in Restaurants 40 Ehrenberg-Bass Institute—2010

Reasons for not eating fish
Figure 22: Main reason that stopped people ordering fish in a casual vs. fine-dining restaurant
55%
14% 12%
8% 7%
3% 1%
60%
11% 13%
3%
8%
0% 2%
0%
10%
20%
30%
40%
50%
60%
70%
No particular barrier Poor availability of good quality fish
Do not like fish Too expensive Don't know We are in a remote area Influence of someone else in the table
Number of respondents What is the main reason that stopped you ordering fish?
Casual Dining Sample (n=259)
Fine Dining Sample (n=224)
As with shellfish, most people have no particular barrier to ordering fish at the restaurant. And there are few people who report that they don’t like it.
With regards to fish dishes ordered at casual and fine-dining restaurants, 43% of casual-dining restaurant patrons did not order fish at all during the last 4 weeks and 37% of fine-dining restaurant patrons did not order fish during the last 8 weeks. The results for reasons for not eating fish are much more congruent between the casual and fine-dining segments than we previously saw with shellfish. Nevertheless, again, the importance of being too expensive is a stronger barrier for casual diners than it is for fine-diners. However, for both groups, it is then main barrier for only less than 10% of respondents, indicating that it is not at all a principal barrier.
The dominant feature of the above chart is the prominence of there being no particular barrier against ordering fish at a restaurant, in either casual or fine-dining restaurants. For both groups of diners, well over half of respondents (55% of casual diners c.f. 60% of fine diners) have no particular barrier at all against ordering fish. The next most important reasons are only a quarter as prevalent, with between 10-15% of responses, which are the poor availability of good quality fish and also simply the dislike of fish.
Therefore, as with shellfish, having no particular barrier to ordering fish in a restaurant context was again the most prevalent. However, in fact, the problem of low
Influences on Consumer Choices in Restaurants 41 Ehrenberg-Bass Institute—2010

mental availability is even more pronounced in relation to fish as it was with shellfish. Combining the responses of ‘no particular barrier’, ‘poor availability of good quality fish and ‘don’t know’, equate to approximately three-quarters of respondents respectively who could potentially order fish in a restaurant if actions were taken to increase the appeal of fish dishes to restaurant patrons.
In summary, there is ample scope to increase the consumption of fish in casual and fine-dining restaurants for respondents who reported to have not ordered fish when dining at a restaurant during the last 4-8 weeks.
Influences on Consumer Choices in Restaurants 42 Ehrenberg-Bass Institute—2010

Shellfish and fish consumption trends in casual and fine-dining restaurantsThis section describes the major trends in relation to respondents’ current seafood consumption behaviour in comparison to their consumption behaviour 6 months ago. This question did not refer to casual or fine-dining restaurants.
Table 11: Would you say that you are eating more, or less shellfish when dining-out at restaurants compared to 6 months ago?
Shellfish consumption trendCasual diners
(n = 603)%
Fine diners(n = 605)
%
Total(n = 1,208)
%
Eating more than 6 months ago 10 9 10
About the same 68 72 70
Eating less than 6 months ago 19 16 18
Don’t know 3 3 3
Most respondents (over two-thirds) reported that they currently consume approximately the same quantity of shellfish in a restaurant context compared to 6 months ago.
There is no significant difference between the two sub-samples. The majority of the respondents report eating about the same amount of shellfish in restaurants now as compared to 6 months ago. On the other hand, more people report that they are eating less shellfish now than eating more. In other words, the shellfish consumer base in restaurant is decreasing.
Table 12: Would you say that you are eating more, or less fish when dining-out at restaurants compared to 6 months ago?
Fish consumption trendCasual diners
(n = 603)%
Fine diners(n = 605)
%
Total(n = 1,208)
%
Eating more than 6 months ago 13 17 15
About the same 67 69 68
Eating less than 6 months ago 18 12 15
Don’t know 2 2 2
Again 2/3 of people report eating about the same amount of fish in a restaurant. But more people report that they’re eating more fish in fine-dining now than they are shellfish.
There is a significant difference between casual and fine diners with regards to eating more or less fish compared to 6 months ago.
As for shellfish, the majority of the respondents (68%) did not change their fish consumption habit in restaurants today compared to 6 months ago.
Influences on Consumer Choices in Restaurants 43 Ehrenberg-Bass Institute—2010

In casual restaurants, fewer people claim to be eating more fish (13%) than those who claim to be eating less fish (18%). In fine-dining restaurants, however, there are more people who claim to be eating more fish (17%) than there are people who claim to be eating less fish (12%).
In other words, the fish consumer base in a casual restaurant is decreasing whereas this consumer base is increasing in fine-dining restaurants.
Seafood consumption in-home and out of homeThis section describes the seafood consumption behaviour of restaurant patrons when dining in and out of home.
Table 13: Proportion of seafood consumed at home
Proportion of seafood eaten at home
Casual diners(n = 585)
%
Fine diners(n = 590)
%
Total(n = 1,175)
%
0% 15 11 13
1–25% 18 16 17
26–50% 30 32 31
51–75% 16 21 19
76–99% 15 17 16
100% 6 3 4
Over 10% of people consume none of their seafood at home. And almost 2/3 consume less than half of their seafood at home.
Over 10% of respondents (13% of all respondents) consumed none of their seafood in the home; all seafood is consumed at restaurants or fish and chips outlets. And close to two-thirds (63% of casual-dining and 60% of fine-dining restaurant patrons) consume less than half of their total seafood consumption at home.
Table 14: Proportion of seafood consumed in a restaurant
Proportion of seafood eaten in restaurant
Casual diners(n = 577)
%
Fine diners(n = 592)
%
Total(n = 1,169)
%
0% 13 7 10
1–25% 40 46 43
26–50% 29 31 30
51–75% 8 5 6
76–99% 5 6 5
100% 5 5 5
Over 80% of people consume less than half of their seafood at restaurants.
Influences on Consumer Choices in Restaurants 44 Ehrenberg-Bass Institute—2010

82% of casual-dining and 84% of fine-dining restaurant patrons consumed less than half of their total seafood consumption in a restaurant. Overall, only about 10% of the respondents consume more than three-quarters of their seafood at a restaurant.
Table 15: Proportion of seafood consumed in Fish and Chip Outlets
Proportion of seafood eaten at a fish and chip shop
Casual diners(n = 567)
%
Fine diners(n = 507)
%
Total(n = 1,137)
%
0% 37 31 34
1–25% 42 50 46
26–50% 16 16 16
51–75% 3 1 2
76–99% 1 0 0
100% 1 1 1
Most people are eating very little seafood from a fish and chip outlet
95% of casual-dining and 97% of fine-dining restaurant patrons consumed less than half of their total seafood consumption in a restaurant.
Table 16: Proportion of seafood consumed in a friend’s or relatives’ home
Proportion of seafood eaten at a fish and chip shop
Casual diners(n = 541)
%
Fine diners(n = 541)
%
Total(n = 1,082)
%
0% 71 61 66
1–25% 24 34 29
26–50% 4 4 4
51–75% 0 0 0
76–99% 0 0 0
100% 1 0 1
Even more so, most people are eating very little seafood from friends’ and relatives’ places
About 99% of casual-dining and fine-dining restaurant patrons consumed less than half of their total seafood consumption in a friend’s or a relative’s place, and 71% consumed none at all. This suggests that seafood is not a favourite dish prepared for guests when entertaining friends and relatives.
Influences on Consumer Choices in Restaurants 45 Ehrenberg-Bass Institute—2010

Figure 23: Proportion of seafood consumed in various locations in the last 4 and 8 weeks (casual vs. fine dining sub-samples)
46
33
17
6
48
33
15
7
Thinking over the last 4 / 8 weeks, what proportion of the total seafood you have consumed was ...
In your home In a restaurant
In / From a fish and chips In friends / relative's place
Casual Diner
Fine Diner
In summary, there is no significant difference in relation to the location of seafood consumption behaviour between casual and fine-dining restaurant patrons. At the aggregated level, most seafood is consumed at home (about 47%) and then in a restaurant (33%). Fish and Chips outlets represent about 16% of the total seafood consumption in Australia. And only about 6.5% of seafood is finally consumed at a friends / relatives’ home.
The results outlined in the above section did not differ between males and females, suggesting that differences in gender do not serve to explain the location of seafood consumption for casual and fine-dining restaurant patrons. Likewise, there was no significant difference evident between the proportion of seafood consumed at various outlets according to the geographic location (states) of respondents (casual vs. fine-dining restaurant patrons).
However, the older the age of the respondent, the more likely that a larger proportion of their total seafood consumption will occur at home. For example, respondents aged 55+ reported to consume 53% of their total seafood consumption at home, in comparison to the 25-34 year old age group who consumed only 43% of their total seafood consumption at home. Furthermore, the 25-34 year old age group reported
Influences on Consumer Choices in Restaurants 46 Ehrenberg-Bass Institute—2010

to consume a larger proportion of their total seafood consumption at a friend’s/relative’s place (9%), in comparison to older respondents (5%).
The proportion of respondents’ total seafood consumption in a restaurant context increased slightly with a respondents’ income level. Respondents earning less than $69,000 per annum consumed approximately 30% of their seafood at a casual or fine-dining restaurant, in comparison to patrons earning more than $69,000 per annum, who reported that 37% of their total seafood consumption during the last 4-8 weeks was in a restaurant.
Furthermore, respondents who reported to have attained an education at the undergraduate or postgraduate level consumed a larger proportion of seafood at restaurants (38%) compared to respondents with lower levels of education who consumed only 30% of their total seafood consumption at a restaurant. This result is correlated with the overall frequency of dining-out at restaurants. And those who had attained an undergraduate or postgraduate level of education consumed less seafood at fish and chip outlets than did respondents with other levels of education.
Influences on Consumer Choices in Restaurants 47 Ehrenberg-Bass Institute—2010
Food perceptions in a restaurant contextIn this section we examine the perceptions of respondents in relation to the consumption of meats and fish in a casual and fine-dining restaurant context. The available protein types offered by competitors include: Beef, Chicken (for meats) and Prawns, Salmon (not smoked), Barramundi, Oysters, Sardines, Tuna (for seafood).
Respondents were presented with a list of the aforementioned protein types. Respondents were also provided with a list of attributes and asked to indicate which of the protein types, if any, are associated with a particular attribute. The available attributes include:
• Generally rather expensive (§ a negative attribute)
• Healthy to eat, • Tends to vary in quality (§ a negative attribute)
• Good value• Natural• Low in fat• Good for a light meal• Good for special occasion• Good for a meal at the restaurant• Boring (§ a negative attribute)
• A luxury food (§† a negative attribute)
• Widely available• Always safe to eat
§ For some attributes, having fewer than expected associations with protein types can be a positive, e.g., the attribute ‘expensive’: if fewer people than expected perceive a food as being ‘expensive’, then this is a good situation. We refer to these kinds of attributes as being ‘negative’ attributes. Other attributes (the majority) are positive attributes, where more than expected is a positive and fewer than expected is a negative situation.
† ‘Luxury food’ is a negative in this case, not because it is inherently negative for a person to hold this perception of a food, but rather due to the limiting nature of a food that is considered a luxury. This therefore would reinforce the notion that a food is for occasional purchases only, and out of the reach for many people. This therefore limits the food’s ability to have a large penetration base.
The purpose of this analysis was to examine the perceived similarities and differences between the protein types offered by competitors in relation to specific attributes. To do this, we used Correspondence Analysis based Perceptual Mapping, which produces a perceptual map (P:map), which provides a two-dimensional graphical representation of the market’s perceptions in relation to the eight protein types and 13 attributes selected.
Influences on Consumer Choices in Restaurants 48 Ehrenberg-Bass Institute—2010

The result of the perceptual mapping and subsequent analysis is explained using the P:maps that appear in this section of this report. The perceptual mapping technique is a quick and easy way to visually locate on a map where both food-related attributes and protein types are positioned in relation to one another. In particular, it allows one to estimate the relationship between food-related attributes and protein types.
A complementary approach to perceptual mapping is that of Analysis of Deviations (or, Deviations Analysis for short). This is where we use existing marketing knowledge about patterns in perceptual data to determine the expected level of response to perceptual survey questions. This allows us to determine if the response levels obtained for each protein type and attribute are higher than, lower than, or as expected. This technique was developed at the Institute and has been published in the International Journal of Market Research.
The Deviations Analysis is a simplified, yet accurate variant of the P:map analysis. Both Analysis of Deviations and Perceptual Mapping are based on similar analytical methods. The major difference between the two methods is that the perceptual mapping approach seeks to reduce the multiple dimensions of possible data down to 2 in a 2D, X-Y plot, whereas Deviations Analysis does not seek to reduce the data into two dimensions, so the relationships between each protein type and each perceptual attribute are analysed individually.
With such individual-level reporting, the Deviations Analysis allows one to examine the unique strengths and weaknesses of each protein type. Thus, the Deviations Analysis approach is complementary to that of perceptual mapping, as it has the ability to highlight more clearly certain aspects of the relationships, free of the interaction between all attributes at the same time (as the P:map does). It therefore provides a clear and accurate representation of the correlation between a particular protein type and food-related attributes.
Guidelines for interpretation of Perceptual MapsThe guidelines for interpretation are as follows:
• P:maps can be read similarly to any 2 dimensional maps (i.e. like road maps). • The most important interpretation to make from the maps is the relative distance
between attributes and between protein types, and how close protein types are to these attributes.
• It does not matter in which quadrant attributes or protein types are placed (just like a road map, you can turn the map around and it can still be read with the same meaning).
• Protein types (and attributes) that are closer to each other are perceived to be
Influences on Consumer Choices in Restaurants 49 Ehrenberg-Bass Institute—2010

somewhat similar.
• The centre point of the map tends to describe the industry, as this is the point on the map that is closest to every other point. Therefore, the attributes that are closest to the centre tend to be the attributes that are most commonly associated with all protein types, and therefore describe all protein types equally.
• Also, protein types that are closer to the centre are therefore less differentiated, and hold fewer unique attribute associations.
Guidelines for interpretation of Deviations• In the Analysis of Deviations, we report on the deviations (from expected values)
that are 10 percentage points or greater in size. It is important to note that these results are relative, in that they show how each of the protein types are perceived in comparison to the other protein types. Therefore, it is not that Salmon is not ‘widely available’ (for example), just that fewer customers associate that item with this attribute given the size of Salmon and the greater association between other protein types with the attribute ‘widely available’.
• When the strengths and weaknesses are listed to summarise the deviations analysis results, positive deviations are listed by their name under strengths and under weaknesses. So, a weakness of, say, ‘low in fat’ means that fewer than expected people associated that protein type with the attribute ‘low in fat’. It does not mean that the attribute ‘low in fat’ is associated with that protein type and that this is a bad thing.
• With negative attributes, when these are listed as strengths, the attribute is prefaced with “fewer said”, to indicate that the strength was that the protein type was perceived as not being associated with that particular attribute. As an example, if a protein scored fewer than expected responses for a negative attribute like “boring”, then this is a strength. In the section containing a summary of the results, this has been written as “fewer said ‘boring’”. As a weakness, the attribute is prefaced with “more said”.
Perceptual map – casual restaurant contextThe P:map presented below visually depicts the perceptions of all eight protein types in a casual restaurant context.
Overall, there was a clear distinction between the two core meats and the core seafoods. On the map, the meats are located in the bottom-right quadrant of the map, while the seafoods are on the left hand-side and the top of the map. This demonstrates the clear distinction in people’s minds regarding how they think about seafoods in comparison to other meats in a casual restaurant context.
Influences on Consumer Choices in Restaurants 50 Ehrenberg-Bass Institute—2010

From the P:map we can see if and how the various protein types are perceived by respondents as being different from one another in the context of a casual-dining restaurant.
Figure 24: Food perception in a casual restaurant context
Generally rather expensive
Healthy to eat
Tends to vary in quality Good value
Natural
Low in fat
Good for a light meal
Good for a special occasion
Good for a meal at the restaurant
Boring
A luxury food
Widely available
Always safe to eat
Beef
Chicken
Prawns
Oysters
Sardines
Tuna
Barramundi Salmon (not smoked)
The key points from the map in Figure 27 can be summarised as:
• There are two major axes in the map: one that proceeds from the bottom-left quadrant diagonally to the top-right quadrant which ranges from ‘luxury’ at one end to ‘boring’ at the other; the second axis proceeds from the bottom-right quadrant to the top-left quadrant, ranging from ‘safe / available’ at one end to ‘health / natural’ at the other.
• The Meats (beef and chicken) are located distinctly differently from the Seafoods, with the meats being located towards ‘safe / available’ in the bottom-right quadrant, whereas most seafoods located towards ‘luxury’ and ‘health / natural’.
• As such, both Meats are seen as being more closely associated with all of the attributes on the right bottom hand of the map, while Seafoods, closely associated with those on the top left of the map. The core Meats are therefore associated with
Influences on Consumer Choices in Restaurants 51 Ehrenberg-Bass Institute—2010

‘always safe to eat’, ‘good for a meal at the restaurant’, ‘widely available’, and ‘good value’.
• The core Seafoods are closely associated with all of the attributes on the top left-hand side of the map: ‘natural’, ‘is healthy to eat’, ‘good for a light meal’, ‘low in fat’, but also ‘generally rather expensive’, ‘a luxury food’, ‘good for a special occasion’ and ‘tends to vary in quality’.
• With regards to the core Fish, Fresh Salmon and Barramundi are perceived in quite a similar way. Both are closely associated with being ‘natural’ and ‘healthy to eat’.
• Oysters and Prawns are perceived in a similar way to Fresh Salmon and Barramundi, but are more closely associated with ‘a luxury food’, ‘generally rather expensive’, ‘good for a special occasion’, and ‘tends to vary in quality’ (for prawns mainly).
• Sardines are perceived rather uniquely amongst the other seafoods as seen as being ‘boring’.
• Tuna is most closely associated with ‘Good for a light meal’ but also ‘Low in fat’. It also tends towards the ‘boring’ end of the scale more so than other seafoods. Therefore, the association towards ‘boring’ as with Sardines is likely influenced by the canning product format that both are commonly available in.
Deviations analysis—casual restaurant context
Table 17: Deviations analysis—Casual restaurant context
Beef Chicken Prawns Oysters Sardines Tuna Barra mundi
Salmon (not
smoked)Generally rather expensive* -15 -37 15 35 -14 -12 14 14
Healthy to eat -13 -17 -19 11 18
Tends to vary in quality* 21 -14 12
Good value 18 45 -14 -19 -14 -13
Natural -13 -18 12
Low in fat -33 21 12
Good for a light meal -28 17 13 10
Good for special occasion -11 -26 21 24 -14 -14 11
Good for a meal at the restaurant 25 -14 -14 -13
Boring* -15 -10 27 10 -12
A luxury food* -26 -32 12 43 -12 -12 13 15
Widely available 38 38 -19 -23 -16
Always safe to eat 39 11 -16 -18
The perceived distinction between meats and seafoods evident in the P:map above, can also be seen in the table above. Positive deviations are in green (the darker the
Influences on Consumer Choices in Restaurants 52 Ehrenberg-Bass Institute—2010

stronger the positive deviation) whereas negative deviations are in red (the darker the stronger the positive deviation).
The key points from the deviation analysis are summarised in the following tables:
Meats key perceptual strengths and weaknesses
Table 18: Beef Perceptual Strengths and Weaknesses
Strengths Weaknesses
Always safe to eat Low in fat
Widely available Good for a light meal
Fewer said ‘A luxury food’ More said ‘tends to vary in quality’
Good for a meal at the restaurant Healthy to eat
Good value Natural
Fewer said ‘generally rather expensive’ Good for a special occasion
Table 19: Chicken Perceptual Strengths and Weaknesses
Strengths Weaknesses
Good value Good for a special occasion
Widely available Natural
Fewer said ‘generally rather expensive’
Fewer said ‘A luxury food’
Good for a light meal
Fewer said ‘tends to vary in quality’
Always safe to eat
Core Meats comparison:Beef and chicken are perceived as sharing similar attributes: ‘generally rather inexpensive’, ‘natural’, ‘good for a special occasion’, ‘a luxury food’, ‘widely available’, ‘always safe to eat’. However, the main perceptual differences between them are:
• Beef is not seen as ‘healthy to eat’ whereas chicken is as expected;
Influences on Consumer Choices in Restaurants 53 Ehrenberg-Bass Institute—2010

• Beef is seen to ‘vary in quality’ compared to chicken that is not seen as varying in quality;
• Beef is seen as being not ‘low in fat’ whereas Chicken is as expected;
• Chicken is seen as ‘good for a light meal’ whereas beef is not seen as ‘good for a light meal’;
• Beef is seen as ‘good for a meal at the restaurant’ whereas Chicken scores as expected;
Seafoods key perceptual strengths and weaknesses
Table 20: Prawns Perceptual Strengths and Weaknesses
Strengths Weaknesses
Good for a special occasion Healthy to eat
Fewer said ‘boring’ Always safe to eat
Good for a light meal More said ‘generally rather expensive’
Good value
More said ‘A luxury food’
More said ‘tends to vary in quality’
Table 21: Oysters Perceptual Strengths and Weaknesses
Strengths Weaknesses
Good for a special occasion More said ‘A luxury food’
Fewer said ‘boring’ More said ‘generally rather expensive’
Healthy to eat
Good value
Widely available
Always safe to eat
Good for a meal at a restaurant
Influences on Consumer Choices in Restaurants 54 Ehrenberg-Bass Institute—2010

Table 22: Sardines Perceptual Strengths and Weaknesses
Strengths Weaknesses
Fewer said ‘generally rather expensive’ More said ‘boring’
Fewer said ‘A luxury food’ Good for a special occasion
Natural Good for a meal at a restaurant
Healthy to eat
Table 23: Tuna Perceptual Strengths and Weaknesses
Strengths Weaknesses
Low in fat Good for a special occasion
Healthy to eat Good for a meal at a restaurant
Fewer said ‘generally rather expensive’ More said ‘boring’
Fewer said ‘A luxury food’
Good for a light meal
Table 24: Barramundi Perceptual Strengths and Weaknesses
Strengths Weaknesses
Fewer said ‘boring’ Widely available
Low in fat More said ‘generally rather expensive’
Natural Good value
Healthy to eat More said ‘A luxury food’
Influences on Consumer Choices in Restaurants 55 Ehrenberg-Bass Institute—2010

Table 25: Salmon Perceptual Strengths and Weaknesses
Strengths Weaknesses
Good for a special occasion Widely available
More said ‘A luxury food’
More said ‘generally rather expensive’
Good value
Core Seafood products comparison:The summary tables confirm what was also evident from the P:map: in the casual restaurant context consumers do have very different perceptions of Seafoods than they do of Meats. Another overarching observation is that seafoods generally tend to have more perceptual weaknesses than strengths, which certainly limits consumers’ consideration and consumption of them, generally and specifically in the restaurant.
The other key points are:
• Prawns, Oysters, Barramundi and Salmon are perceived as being rather expensive, whereas Tuna and Sardines are not.
• Interestingly, Prawns and Oysters are both seen as being not healthy to eat, as opposed to Sardines and Tuna which are strongly perceived as being healthy to eat and Barramundi and Salmon which are perceived about as expected.
• Prawns are the only seafood that is perceived as ‘tends to vary in quality’, whereas all other seafoods are perceived as expected. Beef, on the other hand, is much more strongly associated with tending to vary in quality.
• Prawns, Oysters, Barramundi, and Salmon are not perceived as being good value whereas Sardines and Tuna are perceived as expected.
• Sardines are the only seafood that is strongly perceived as being natural whereas all others are perceived as expected.
• Tuna and Barramundi are more strongly perceived as ‘low in fat’ whereas the other seafoods are perceived as expected.
• Prawns and Tuna are both strongly perceived as ‘good for a light meal’ whereas other seafoods are perceived as expected.
• Prawns, Oysters and Salmon are perceived as ‘good for a special occasion’ whereas Sardines and Tuna are not, and Barramundi is perceived as expected.
• Oysters, Sardines and Tuna are all perceived as being not ‘good for a meal at the restaurant’ whereas Prawns, Barramundi and Salmon are perceived as expected.
Influences on Consumer Choices in Restaurants 56 Ehrenberg-Bass Institute—2010

• Sardines and Tuna are both strongly perceived as boring, whereas Prawns, Oysters, Barramundi are perceived as not boring, and Salmon is perceived as expected.
• Oysters, Prawns, Salmon and Barramundi are perceived as being a ‘luxury food’ , whereas Sardines and Tuna are not.
• Oysters, Barramundi and Salmon are perceived as being not ‘widely available’ whereas Prawns, Sardines and Tuna are perceived as expected.
• Prawns and Oysters are perceived as not being ‘always safe to eat’ in a casual restaurant whereas other seafoods are perceived as expected.
Influences on Consumer Choices in Restaurants 57 Ehrenberg-Bass Institute—2010

Perceptual map – fine-dining restaurant contextThe P:map presented below visually depicts the perceptions of all eight protein types in a fine-dining restaurant context.
Overall and similarly to the casual restaurant context, there is a clear distinction between the two core Meats and the core Seafoods perception in a fine-dining context. On the map, the meats are all located on the right bottom-hand side of the map, while the Seafoods are on the left hand-side and the top of the map. This demonstrates the clear distinction in people’s minds regarding how they think about seafoods in comparison to other meats in a fine-dining restaurant context.
Figure 25: Food perception in a fine-dining restaurant context
Generally rather expensive!
Healthy to eat!
Tends to vary in quality!
Good value!
Natural!
Low in fat! Good for a light meal!
Good for a special occasion!
Good for a meal at the restaurant!
Boring!
A luxury food!
Widely available!
Always safe to eat!
Beef!
Chicken!Prawns!
Oysters!
Sardines!
Tuna!
Barramundi!Salmon (not smoked)!
The most striking observation from the P:map is the similarity of the P:map between the two customer groups (casual diners and fine-diners). The two maps are virtually identical, with there again being two dominant axes of ‘luxury’ to ‘boring’ and ‘safe / available’ to ‘health / natural’.
Influences on Consumer Choices in Restaurants 58 Ehrenberg-Bass Institute—2010
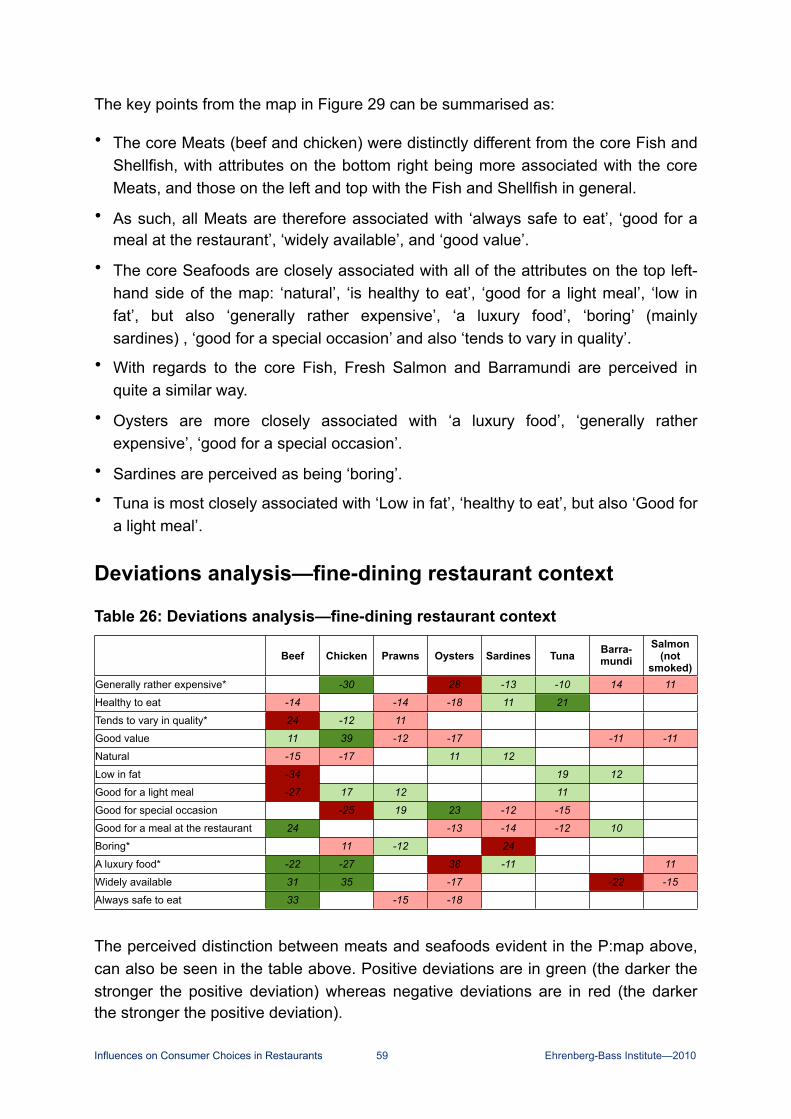
The key points from the map in Figure 29 can be summarised as:
• The core Meats (beef and chicken) were distinctly different from the core Fish and Shellfish, with attributes on the bottom right being more associated with the core Meats, and those on the left and top with the Fish and Shellfish in general.
• As such, all Meats are therefore associated with ‘always safe to eat’, ‘good for a meal at the restaurant’, ‘widely available’, and ‘good value’.
• The core Seafoods are closely associated with all of the attributes on the top left-hand side of the map: ‘natural’, ‘is healthy to eat’, ‘good for a light meal’, ‘low in fat’, but also ‘generally rather expensive’, ‘a luxury food’, ‘boring’ (mainly sardines) , ‘good for a special occasion’ and also ‘tends to vary in quality’.
• With regards to the core Fish, Fresh Salmon and Barramundi are perceived in quite a similar way.
• Oysters are more closely associated with ‘a luxury food’, ‘generally rather expensive’, ‘good for a special occasion’.
• Sardines are perceived as being ‘boring’.• Tuna is most closely associated with ‘Low in fat’, ‘healthy to eat’, but also ‘Good for
a light meal’.
Deviations analysis—fine-dining restaurant context
Table 26: Deviations analysis—fine-dining restaurant context
Beef Chicken Prawns Oysters Sardines Tuna Barra-mundi
Salmon (not
smoked)Generally rather expensive* -30 28 -13 -10 14 11
Healthy to eat -14 -14 -18 11 21
Tends to vary in quality* 24 -12 11
Good value 11 39 -12 -17 -11 -11
Natural -15 -17 11 12
Low in fat -34 19 12
Good for a light meal -27 17 12 11
Good for special occasion -25 19 23 -12 -15
Good for a meal at the restaurant 24 -13 -14 -12 10
Boring* 11 -12 24
A luxury food* -22 -27 38 -11 11
Widely available 31 35 -17 -22 -15
Always safe to eat 33 -15 -18
The perceived distinction between meats and seafoods evident in the P:map above, can also be seen in the table above. Positive deviations are in green (the darker the stronger the positive deviation) whereas negative deviations are in red (the darker the stronger the positive deviation).
Influences on Consumer Choices in Restaurants 59 Ehrenberg-Bass Institute—2010

The key points from the deviation analysis are summarised in the following tables:
Meats key perceptual strengths and weaknesses
Table 27: Beef Perceptual Strengths and Weaknesses
Strengths Weaknesses
Always safe to eat Low in fat
Widely available Good for a light meal
Good for a meal at the restaurant More said ‘tends to vary in quality’
Fewer said ‘A luxury food’ Natural
Good value Healthy to eat
Table 28: Chicken Perceptual Strengths and Weaknesses
Strengths Weaknesses
Good value Good for a special occasion
Widely available Natural
Fewer said ‘generally rather expensive’ More said ‘boring’
Fewer said ‘A luxury food’
Good for a light meal
Fewer said ‘tends to vary in quality’
Core Meats comparison:Beef and chicken are perceived as sharing similar attributes: ‘natural’, not ‘a luxury food’, ‘widely available’, and ‘good value’. However, the main perceptual differences between them are:
• Chicken is seen as being not ‘generally rather expensive’ whereas beef is as expected’;
• Beef is seen as being not ‘healthy to eat’ whereas chicken is as expected;
• Beef is seen to ‘vary in quality’ compared to chicken that is seen as not varying in quality;
• Beef is seen as being not ‘low in fat’ whereas Chicken is as expected;
Influences on Consumer Choices in Restaurants 60 Ehrenberg-Bass Institute—2010

• Chicken is seen as ‘good for a light meal’ whereas beef is seen as being not ‘good for a light meal’;
• Beef is seen as ‘good for a meal at the restaurant’ whereas Chicken scores as expected;
• Chicken is perceived as being ‘boring’ whereas beef is as expected;• Beef is perceived as being ‘always safe to eat’ whereas chicken is as expected.
Seafoods key perceptual strengths and weaknesses
Table 29: Prawns Perceptual Strengths and Weaknesses
Strengths Weaknesses
Good for a special occasion Always safe to eat
Fewer said ‘boring’ Healthy to eat
Good for a light meal Good value
More said ‘tends to vary in quality’
Table 30: Oysters Perceptual Strengths and Weaknesses
Strengths Weaknesses
Good for a special occasion More said ‘A luxury food’
Natural More said ‘generally rather expensive’
Always safe to eat
Healthy to eat
Good value
Widely available
Good for a meal at a restaurant
Influences on Consumer Choices in Restaurants 61 Ehrenberg-Bass Institute—2010

Table 31: Sardines Perceptual Strengths and Weaknesses
Strengths Weaknesses
Fewer said ‘generally rather expensive’ More said ‘boring’
Natural Good for a meal at a restaurant
Fewer said ‘A luxury food’ Good for a special occasion
Healthy to eat
Table 32: Tuna Perceptual Strengths and Weaknesses
Strengths Weaknesses
Healthy to eat Good for a special occasion
Low in fat Good for a meal at a restaurant
Good for a light meal
Fewer said ‘generally rather expensive’
Table 33: Barramundi Perceptual Strengths and Weaknesses
Strengths Weaknesses
Low in fat Widely available
Good for a meal at a restaurant More said ‘generally rather expensive’
Good value
Influences on Consumer Choices in Restaurants 62 Ehrenberg-Bass Institute—2010

Table 34: Salmon Perceptual Strengths and Weaknesses
Strengths Weaknesses
Widely available
More said ‘A luxury food’
More said ‘generally rather expensive’
Good value
Core Seafood products comparison:Consumers do not share similar perceptions for all Seafoods in a fine-dining restaurant context. The key points of difference are:
• Oysters, Barramundi and Salmon are perceived as being ‘rather expensive’, whereas Tuna and Sardines are perceived as being not ‘rather expensive’. Prawns scores as expected.
• Prawns and Oysters are seen as not being healthy to eat, as opposed to Sardines and Tuna that are perceived healthy to eat. Barramundi and Salmon are perceived as expected.
• Prawns is the only seafood that is perceived as ‘tends to vary in quality’ whereas all other seafoods are perceived as expected. Again, this association is even more strong for Beef than for prawns.
• None of the seafoods are perceived strongly as being ‘good value’. Prawns, Oysters, Barramundi, and Salmon are perceived as being not ‘good value’ whereas Sardines and Tuna are perceived as expected.
• Sardines and Oysters are the only seafood that are strongly perceived as being ‘natural’ whereas all others are perceived much as expected.
• Tuna and Barramundi are perceived as being ‘low in fat’ whereas other seafoods are perceived as expected.
• Prawns and Tuna are the seafoods that are strongly perceived as being ‘good for a light meal’ whereas other seafoods are perceived as expected.
• Prawns and Oysters are perceived as being ‘good for a special occasion’ whereas Sardines and Tuna are perceived as being not ‘good for a special occasion’. Barramundi and Salmon are perceived as expected.
• Barramundi is the only seafood that is perceived strongly as being ‘good for a meal at the restaurant’. Whereas Oysters, Sardines and Tuna are perceived as being not ‘good for a meal at the restaurant’. Prawns and Salmon are perceived as
Influences on Consumer Choices in Restaurants 63 Ehrenberg-Bass Institute—2010

expected.
• Prawns are the only seafood that are perceived as not being ‘boring’ compared to Sardines which is the only seafood that is strongly perceived as ‘boring’ . The other seafoods are perceived as expected.
• Oysters and Salmon are both perceived as being ‘luxury foods’ whereas Sardines are perceived as being not a luxury food, while Prawns, Tuna, and Barramundi are perceived as expected.
• Oysters, Barramundi and Salmon are perceived as being not ‘widely available’ , whereas Prawns, Sardines and Tuna are perceived as expected.
• Prawns and Oysters are perceived as being not ‘always safe to eat’ in a fine-dining restaurant, whereas the other seafoods are perceived as expected.
Perceptual maps – casual vs. fine-dining restaurant contextsOverall, consumers don’t make that much difference in their perception of various meats and seafoods when visiting a casual or a fine-dining restaurant. Though Meat and Seafood remain being clearly seen as different animal proteins. Seafoods generally appear to be perceived less as luxury foods in the fine-dining context than they do under the casual dining situation. And Chicken is seen more as being boring in the fine-dining context than it is in casual dining. To some extent, it appears that people’s perceptions of canned fish (tuna and sardines, for instance) transfer to their perceptions of these fish in the restaurant context. The relatively low penetration of consumption of these species in restaurants is most likely responsible for this situation, as most people have a low level of direct experience with these species in restaurants, much lower than their experience of it as a canned product.
From a seafood industry perspective as well as a hospitality perspective, some aspects have to be improved to change people’s perception of seafood. These aspects are the weaknesses mentioned above for each seafood species.
Influences on Consumer Choices in Restaurants 64 Ehrenberg-Bass Institute—2010

OBJECTIVE 2: THE PRIMARY INFLUENCING FACTORS THAT DETERMINE CONSUMERS' CHOICE ON RESTAURANT MENUSIn this section, we explore the primary influencing factors that determine consumers’ choices on restaurant menus, and the relative importance of (seafood) menu item attributes at the point of selection. Specifically, the second objective of this study investigates:
• The factors that (most and least) influence consumers’ menu item choice in a restaurant context.
We investigated the importance of factors when considering any dish at a restaurant as well as those factors that are important specifically when ordering seafood dishes. For each sub-sample (casual vs. fine-dining), we split the sample in two, with about half responding to the following question: “What attribute would most and least influence your choice when selecting a dish from the menu?”; and the other half responding to the following question: “What attribute would most and least influence your choice when selecting a seafood dish from the menu?”
The section begins with a presentation of the findings for each restaurant type (casual vs. fine-dining) and then explores the extent to which different attributes influence consumers’ choices for a dish (in general) compared to a seafood dish from a restaurant menu.
Influences on Consumer Choices in Restaurants 65 Ehrenberg-Bass Institute—2010

Figure 26: Most vs. least important influencers of consumers’ choice when selecting a (seafood) dish from the menu at a casual vs. fine-dining restaurant
38
38
56
56
64
65
66
67
68
78
79
86
100
31
32
46
53
76
64
51
77
65
78
76
84
100
0 10 20 30 40 50 60 70 80 90 100
The core ingredient of the dish is sustainably produced
Avoidance of certain foods
A dish that features local produce
A dish representing a healthy option
The price of the dish
The way a dish is written on the menu tempts my palate
A dish I’ve never tried before
A dish that I have tried before and I know that I will like the taste
The accompaniments that come with the dish
A sufficient portion size that will satisfy my appetite
The method of preparation
A dish that I could not/would not want to prepare at home
The combination of ingredients complements each other well
Relative importance
What attribute would most and least influence your choice when selecting a (seafood) dish from the menu at a casual vs. fine-
dining restaurant?
Casual (n=603)
Fine dining (n=605)
A dish containing a combination of ingredients that complements each other well and ‘a dish that I could not / would not want to prepare at home’ are the attributes most likely to influence the menu
item selection of casual and fine-dining restaurant patrons
The primary influencing factors that determine consumers’ choice on casual vs. fine-dining restaurant menu’sBoth the casual and fine-dining groups of consumers consider “the combination of ingredients” and “a dish that I could not / would not want to prepare at home” as being the most important attributes influencing menu item selection.
Unlike other attributes, “the combination of ingredients” is a subjective judgement that is likely to be strongly based on previous and direct sensory exposure. “A dish that I could not / would not want to prepare at home” however, is not necessarily related to previous experience;. Rather, it assumes that the consumer considers the dish difficult to prepare and would rather out-source the risk associated with preparing that item to a chef in a restaurant that possesses culinary expertise. This may be an underlying benefit that consumers seek in dining out, in comparison to cooking at home, as part of the experience worth paying the higher price for. In a sense, they do
Influences on Consumer Choices in Restaurants 66 Ehrenberg-Bass Institute—2010

not consider a dish that they are capable of preparing at home as worthy of expending their monetary resources on3.
Generally, restaurant patrons consider “a sufficient portion size”, “the price of the dish” and “the method of preparation” as important, while “a dish I’ve never tried before” and “a dish that features local produce” are considered less important (especially for casual-diners).
Sustainability“The core ingredient of the dish is sustainably produced” and the “avoidance of certain foods” on the other hand are the least important attributes influencing the menu item selection of casual and fine-dining restaurant patrons. Clearly, consumers at this stage do not value product labelled as sustainable at the restaurant (although other extant research indicates that this feeling also extends to food purchases more generally, at the supermarket, for instance). It could be that consumers do not have an understanding of sustainable consumption, or do understand it but are not that interested in it, or for some reason do not trust or simply do not place much value on such labelling. At this stage, it seems that sustainable consumption is pertinent to only a very small minority of restaurant patrons. Of course, the concept of listing products as being sustainably produced is a relatively newly adopted trend in full-service restaurants. Therefore, consumers may consider the trial of “sustainable” menu items as a novel choice guided by enthusiastic attempts to operationalise the trend towards sustainable consumption.
Although it appears likely that consumer interest in sustainability issues is increasing (albeit from an as yet very small base), and consumer attitudes are mainly positive towards sustainable consumption, the results of this study suggest that consumers’ behavioural patterns are not consistent with these attitudes. Thus, there is a gap between favourable attitudes towards sustainable produce and the choice behaviour of casual and fine-dining restaurant patrons4. Therefore, it is not surprising that these attitudes remain somewhat incongruent with the attribute-based preferences of casual and fine-dining restaurant patrons.
Choice variety, difference between casual and fine dinersThe results provide some support for the contention that fine-dining patrons are more likely to seek choice variety (e.g., over a sequence of dining occasions) than are casual-dining restaurant patrons. While both groups did express a relatively low
Influences on Consumer Choices in Restaurants 67 Ehrenberg-Bass Institute—2010
3 It can be noted that these results are novel in that they are inconsistent with previous studies, which suggest that price, quality and convenience are the most important decision criteria (Urala & Lähteenmäk, 2003; Weatherell et al., 2003).
4 This assumption is consistent with the general consensus in the consumer behaviour literature, which suggests that attitudes are often a poor indicator of consumer choice behaviour (Kraus, 1995).
importance to selecting an unfamiliar dish (for instance, for trying something new or for variety), “a dish I’ve never tried before” was one of the attributes that exhibited the biggest difference between the casual and fine diners (51% for casual diners c.f. 66% for fine diners). This appears to be related to the perceived risk that all consumers place on their restaurant purchases. In this case, the selection of a menu item consumed previously reduces the risks associated with uncertainty, leading consumers to select an item on the menu that they are familiar with. However, the difference between casual and fine diners suggests that fine diners do seek greater exploration and pleasure seeking in their dining than just merely risk reduction or value seeking, which tends to be more important in casual dining.
Importance of price, difference between casual and fine dinersThe other attribute that showed a distinct difference between casual and fine diners was “the price of the dish”. Not surprisingly, “the price of the dish” is much more important to casual-diners than it was to fine-diners, with an importance of 76% and 64% respectively. However, somewhat surprisingly, the analysis of Best-Worst scores indicate that “the way a dish is written on the menu” and the selection of “a dish representing a healthy option” did not seem to exert a large influence on the menu item choice of casual or fine-dining restaurant patrons5. Moreover, given that description has a relatively small influence on the menu item choice of casual and fine-dining restaurant patrons, the ability for the elaborate description of a dish to influence perceptions of food quality, expected price and the likelihood of selection6 appears unlikely. However, to some extent this is an attribute which is likely to exert some effect on patrons at a sub-conscious (almost irrational) level, rather than at the highly rational, conscious level.
SummaryTo summarise, the analysis of Best-Worst scores revealed that the relative importance of the attributes considered to “most” and “least” influence menu item selection is similar among casual and fine-dining restaurant patrons for most attributes. This result contradicts the findings of prior studies, which have assumed differences in the attribute-based preferences and choice behaviour of casual and fine-dining patrons.
The ranked importance of menu item attributes was not significantly different among casual and fine-dining restaurant patrons. Therefore, it is unlikely that the level of attribute-importance would change very dramatically depending on the different restaurant dining contexts. Of course, since the majority of fine-dining patrons will
Influences on Consumer Choices in Restaurants 68 Ehrenberg-Bass Institute—2010
5 This result is in contrast with the findings of several studies that emphasise the importance of menu item descriptions and consumer preference for healthy food-choices (Myung et al., 2008; Wansink et al., 2005).
6 As advocated by McCall and Lynn, 2008

also frequently visit casual-dining restaurants during a given period, it is the same people dining in both contexts. Therefore, we might expect that an individual would be unlikely to change the attribute-based criteria that influences their menu item selection. However, when visiting a fine-dining restaurant the patron may order a different ‘calibre’ of meal, expect service levels to be of a higher standard and that they relax the importance of seeking low prices.
The primary influencing factors that determine consumers’ choices of a regular dish vs. seafood dish from restaurant menusAs mentioned before, we asked 601 respondents the most and least important factors when selecting a dish at a restaurant whereas we asked 607 respondents the most and least important factors when selecting a seafood dish at a restaurant.
Figure 27: Most vs. least influencers of consumers’ choice when selecting a dish/seafood dish from the menu
37
37
58
58
60
66
71
75
79
80
90
92
100
33
32
45
51
57
68
59
65
66
75
81
65
100
0 10 20 30 40 50 60 70 80 90 100
Avoidance of certain foods
The core ingredient of the dish is sustainably produced
A dish that features local produce
A dish representing a healthy option
A dish I’ve never tried before
The accompaniments that come with the dish
The way a dish is written on the menu tempts my palate
The price of the dish
A dish that I have tried before and I know that I will like the taste
A sufficient portion size that will satisfy my appetite
A dish that I could not/would not want to prepare at home
The method of preparation
The combination of ingredients complements each other well
Relative importance
What attribute would most and least influence your choice when selecting a dish /
seafood dish from the menu?
Dish (n=601)
Seafood dish (n=607)
For both sub-samples of consumers, “The combination of ingredients complements each other well” is viewed as the most important attributes influencing menu item selection. “The core ingredient of the dish is sustainably produced” and the “Avoidance of certain foods” are the least important attributes influencing consumers menu item selection.
Influences on Consumer Choices in Restaurants 69 Ehrenberg-Bass Institute—2010

With the exception of these two similarities at the extremes (most and least important attributes), we can notice some distinct differences between the two sub-samples. People who responded to the seafood dish situation generally gave higher scores to more attributes compared to people who responded to the dish situation. In other words, many more attributes are seen as most important when selecting a seafood dish compared to selecting a non-seafood dish when dining at a restaurant.
When considering a seafood dish from the menu, the following attributes are more important to consumers than when considering just any dish:
• the method of preparation: importance of 92% for seafood c.f. 65%;
• a dish that I could not / would not want to prepare at home: 90% for a seafood dish c.f. 81% for a regular dish;
• a sufficient portion size that will satisfy my appetite: 80% for a seafood dish c.f. 75% for a regular dish;
• a dish that I have tried before and know that I will like the taste: 79% for seafood c.f. 66%;
• the price of the dish: 75% for seafood c.f. 65%;
• the way a dish is written on the menu tempts my palate: 71% for seafood c.f. 59%;
• a dish representing a healthy option: 58% for seafood c.f. 51%;
• a dish that features local produce: 58% for seafood c.f. 45%
The primary influencing factors that determine consumers’ choice of a dish vs. seafood dish from a casual vs. fine-dining restaurant menuThe difference in importance that consumers associate with the various attributes between seafood dishes and regular dishes is not necessarily uniform between the dining context either. There are four possible combinations of dining context and type of dish: 2 dining contexts crossed with 2 types of dish. The following table indicates the number of people who responded to each of the possible scenarios. For example, 301 people were asked the following question: “Imagine that you are in a casual-dining restaurant for dinner with other people… What attribute would most and least influence your choice when selecting a dish from the menu?”
Influences on Consumer Choices in Restaurants 70 Ehrenberg-Bass Institute—2010

Table 35: Respondents per scenario
Restaurant type Dish scenario Seafood dish scenario Total
Casual-dining 301 302 603
Fine-dining 300 305 605
Total 601 607 1208
The following figure presents the relative importance of each attribute for these four situations: Seafood dish/Casual dining; Dish/Casual dining; Seafood dish/Fine-dining; Dish/Fine-dining. Data has been ranked using the Seafood dish/Fine-dining scenario in mind.
Figure 28: The attributes that Most vs. Least influence consumers’ choice when selecting a dish/seafood dish from a menu at a casual/fine-dining restaurant
35
36
54
51
66
69
62
58
62
74
86
69
100
40
40
58
61
66
67
67
73
73
82
87
90
100
28
31
48
39
48
66
69
60
70
76
76
62
100
34
34
59
54
55
65
84
69
84
79
93
93
100
0 10 20 30 40 50 60 70 80 90 100
The core ingredient of the dish is sustainably produced
Avoidance of certain foods
A dish representing a healthy option
A dish that features local produce
A dish I’ve never tried before
The accompaniments that come with the dish
The price of the dish
The way a dish is written on the menu tempts my palate
A dish that I have tried before and I know that I will like the taste
A sufficient portion size that will satisfy my appetite
A dish that I could not/would not want to prepare at home
The method of preparation
The combination of ingredients complements each other well
Relative importance
What attribute would most and least influence your choice when selecting a dish / seafood dish from
the menu at a casual / fine-dining restaurant
Seafood dish / Casual-dining
(n=302)
Dish / casual-dining (n=301)
Seafood dish / Fine-dining
(n=305)
Dish / fine-dining (n=305)
Seafood dish at casual diningFor this sub-sample of consumers, “The combination of ingredients complements each other well”, “The method of preparation” and “A dish that I could not / would not want to prepare at home” are viewed as the most important attributes influencing menu item selection with respective importance levels of 100%, 93% and 93%. Other attributes that are seen as important were: “A dish that I have tried before and I know
Influences on Consumer Choices in Restaurants 71 Ehrenberg-Bass Institute—2010

that I will like the taste”, 84%; “The price of the dish”, 84%; and “A sufficient portion size that will satisfy my appetite”, with an importance of 79%.
All other attributes are viewed with a lower level of importance. “The core ingredient of the dish is sustainably produced” and the “Avoidance of certain foods” are the least important attributes influencing consumers menu item selection for a seafood dish in a casual restaurant context.
Regular Dish at casual diningFor this sub-sample of consumers, “The combination of ingredients complements each other well” is viewed as the most important attribute influencing menu item selection with a relative importance of 100%. The following other attributes are seen as of lower importance: “A dish that I could not / would not want to prepare at home”;, 76%; “A sufficient portion size that will satisfy my appetite”, 76%; and “A dish that I have tried before and I know that I will like the taste”, 70%.
Attributes that are viewed with a very low level of importance in influencing casual diners’ menu item selections for a regular dish include: “The core ingredient of the dish is sustainably produced” , 28%; the “Avoidance of certain foods”, 31%, and “A dish that feature local produce”, 39%.
Comparison of a regular dish vs a seafood dish in a casual restaurant contextThe key difference between these two sub-samples of consumers mainly relates to the most important influencers of menu item selection. For a seafood dish, consumers tend to consider more attributes as being of importance. About 6 attributes are viewed as important when selecting a seafood dish whereas only one is seen as very important and three others as important for a regular dish. The three attributes that a casual restaurant should also focus on when serving a seafood dish are “the method of preparation”, “something different compared to what people could cook at home” and “the price of the dish”.
Seafood dish at fine-diningFor this sub-sample of consumers, “The combination of ingredients complements each other well” and “The method of preparation” are viewed as the most important attributes influencing menu item selection in a fine-dining context with respective levels of importance of 100% and 90%. Two other attributes can be seen as also being important: “A dish that I could not / would not want to prepare at home”, 87%; and “A sufficient portion size that will satisfy my appetite”, 82%.
“The core ingredient of the dish is sustainably produced” and the “Avoidance of certain foods” that are seen as the least important attributes influencing fine-dining
Influences on Consumer Choices in Restaurants 72 Ehrenberg-Bass Institute—2010
consumers’ selections for seafood dishes. All other attributes are viewed with a medium level of importance to this segment.
Regular dish at fine-diningFor this sub-sample of diners, two attributes are mainly viewed as important influencers of menu item selections in a fine-dining restaurant for any regular dish: “The combination of ingredients complements each other well”, with importance of 100%; and “A dish that I could not / would not want to prepare at home”, 86%.
“The core ingredient of the dish is sustainably produced”, 35% and the “Avoidance of certain foods”, 36% are seen as being the least important attributes influencing fine-dining consumers’ menu item selections for regular dishes. All other attributes are viewed with a medium level of importance.
Comparison of a regular dish vs a seafood dish in a fine-dining restaurant contextAs for the casual restaurant context, the key difference between the two situations of a regular dish versus a seafood dish mainly relates to the most important influencers of menu item selection. For a seafood dish, diners tend to consider more attributes as being of importance. About 4 attributes are viewed as being of high importance when selecting a seafood dish whereas only two are seen as important for a regular dish. The two attributes that a fine-dining restaurant should also focus on when serving a seafood dish are “the method of preparation”, “something different compared to what people could cook at home”, and “a dish of sufficient portion size that will satisfy my appetite”.
Overall, method of preparation can be seen as the key difference with regards to the attributes of importance between a dish (in general) and a seafood dish.
Influences on Consumer Choices in Restaurants 73 Ehrenberg-Bass Institute—2010

OBJECTIVE 3: THE RELATIVE IMPORTANCE OF MENU ITEM ATTRIBUTES ACCORDING TO CONSUMERS’ LEVEL OF FOOD INVOLVEMENT AND SOCIAL CONTEXTThis section explores the relative importance of the factors that may influence consumer menu item choice and describes how a consumer’s level of involvement and social context moderates menu item choice in the context of a casual and fine-dining restaurant. Specifically, this section investigates:
• Consumers’ involvement with regards to (sea)food;
• The effect of social context on consumers’ choice of (sea)food items from a restaurant menu.
This section begins with the exploration of the factors that influence menu item choice at casual and fine-dining restaurants according to a consumers’ level of involvement with food. Subsequently, the relative importance of menu item attributes is investigated with reference to restaurant patrons’ effect of social context in the context of a casual or fine-dining restaurant.
The relative importance of menu item attributes for consumers with a low vs. high level of food involvement
Food involvement scaleBell and Marshall7 (2003) developed a multi-item measure in order to gauge an individuals’ level of food involvement. The food involvement scale (FIS) measures on a continuum an individual’s level of involvement based on activities related to the acquisition, preparation, cooking, eating and disposal of food. Previous research has shown that the FIS discriminates well between individuals, with those with higher levels of food involvement (as measured by the FIS) exhibiting greater differences in hedonic ratings of enjoyment.
To measure respondents’ level of food involvement, we used the “Preparation and Eating” scale items of the the FIS, which together focuses on actions related to thinking about, preparing and consuming food. Together, these dimensions represent activities that are likely to involve sensory exposure and evaluation, which are therefore considered relevant to the dining context in a restaurant:
Influences on Consumer Choices in Restaurants 74 Ehrenberg-Bass Institute—2010
7 Bell, R & Marshall, D 2003 ‘The Construct of Food Involvement in Behavioral Research: Scale Development and Validation’, Appetite, vol. 40, no. 3, pp. 235-244

1. I don’t think much about food each day;2. Cooking is not much fun;3. Talking about what I ate or am going to eat is something I like to do;4. Compared with other daily decisions, my food choices are not very important;5. When I travel, one of the things I anticipate most is eating the food there;6. I enjoy cooking for others and myself;7. When I eat out, I don’t think or talk much about how the food tastes;8. I do not like to mix or chop food;9. I do most or all of my own food shopping.
A total involvement score for each respondent was calculated based on their agreement to the above questions, measured on a 7-point Likert scale, with scores ranging from 1 to 7. To score the scale, negatively worded items (1, 2, 4, and 8) were reversed. Individual scores could theoretically range from a minimum of 9 (low involved) to a maximum score of 63 (highly involved). The sample was then divided into three groups based on an individual’s total score. Respondents’ with scores 39 points or below were classified as ‘‘low involved’’, from 40 to 48 points ‘‘medium involved’’ and above 49 points as “highly involved” with food. For the purpose of this study, respondents classified in the “medium involved” category were removed from analysis in order to compare the attribute-based preferences among restaurant patrons with a “low” and “high” level of food involvement. In total, approximately 63% of the sample population occupied these categories.
The relative importance of menu item attributes for consumers with a low vs. high level of food involvementThe results from the Best-Worst analysis revealed that the two groups of consumers (high involved and low involved) do exhibit distinct and significant differences in terms of the relative importance of menu item attributes that would influence their restaurant meal choices.
Similar to the previously discussed findings, the most important attribute influencing menu item selection among high food involvement respondents was “the combination of ingredients complements each other well”. However, this was in quite stark contrast to those with a low level of food involvement, for whom “a sufficient portion size that will satisfy my appetite” more important than “the combination of ingredients” (Figure 33).
Influences on Consumer Choices in Restaurants 75 Ehrenberg-Bass Institute—2010

Figure 29: Relative Importance of menu item attributes for the low and high food involvement segments
46
38
62
94
87
77
49
100
56
60
83
83
89
26
32
45
46
48
54
55
55
61
66
71
81
100
0 10 20 30 40 50 60 70 80 90 100
Avoidance of certain foods
The core ingredient of the dish is sustainably produced
A dish representing a healthy option
A dish that I have tried before and I know that I will like the taste
The price of the dish
The accompaniments that come with the dish
A dish that features local produce
A sufficient portion size that will satisfy my appetite
A dish I’ve never tried before
The way a dish is written on the menu tempts my palate
The method of preparation
A dish that I could not/would not want to prepare at home
The combination of ingredients complements each other well
Relative importance
Relative importance of menu-item attributes for the low and high food
involvement segments
High
Low
High-involved consumers value the importance of menu attributes quite differently to low-involved consumers
The table below summarises the results by splitting the attributes into those that are of greater importance to high-involved consumers and those results that are of greater importance to low-involved consumers. Each column is ordered by the extent of the difference between the two groups; so, the items lower in the top rows are those where the difference between the high- and low-involved consumers are the greatest, and those in the bottom rows are where the importance between the two groups are the most similar.
Influences on Consumer Choices in Restaurants 76 Ehrenberg-Bass Institute—2010

Table 36: Summary table of differences between high- and low-food involved consumers
Attributes of greater importance to high-involved Attributes of greater importance to low-involved
The combination of ingredients complements each other well
A sufficient portion size that will satisfy my appetite
The way a dish is written tempts my palate A dish that I’ve tried before and know that I’ll like the taste
A dish I’ve never tried before The price of the dish
A dish that features local produce The accompaniments that come with the dish
A dish representing a healthy option
Avoidance of certain food
The method of preparation
The core ingredient of the dish is sustainably produced
A dish that I could not / would not want to prepare at home
It appears that consumers with a low level of involvement exhibit more utilitarian-based preferences. The three attributes of menu item choice that are of most importance to consumers with a low level of food involvement are linked to the concept of value and risk reduction, rather than hedonic enjoyment: “a sufficient portion size that will satisfy my appetite”, “a dish that I have tried before and I know I will like the taste” and “the price of the dish”. On the contrary, highly involved patrons are more sensitive to the attribute indicative of sensory characteristics and food enjoyment, such as “the combination of ingredients”.
The relative importance of the two attributes “a dish that I have tried before and I know I will like the taste” and “a dish representing a healthy option” is similar among highly involved consumers (46% and 45% respectively); however they are quite distinctly different among the low involved consumers, for whom the importance of “a dish that I have tried before and I know I will like the taste” is of extreme importance (94% vs 46%).
Previous studies (though mostly qualitative) have tended to suggest a direct relationship between healthy food choices and a consumer’s level of food involvement: more highly food involved consumers would place a higher importance on healthy food choices. However, our results contradict the notion that higher levels
Influences on Consumer Choices in Restaurants 77 Ehrenberg-Bass Institute—2010

of involvement are associated with healthy food choices. The importance is actually higher for the low involved consumers.
Again, this result seems to be attributed to the utilitarian-based preferences of low involved restaurant patrons. In this case, the low involved consumers care more about the base, functional attribute (healthiness of the meal) than do consumers who are highly food involved who place a greater emphasis on the fulfilment of hedonic and sensory sensations stemming from the dining experience.
Most consumers with a low level of food involvement consider “a dish that I have tried before and know that I’ll like the taste” as important, however it assumes a far lesser importance for the highly food involved segment, (94% for low c.f. 46% for high-involved). Thus, the low-involved consumers seem to care more for risk reduction in their menu choice, rather than exploration of something new. Therefore not surprisingly, we also see that high food involved consumers actually rather highly value the importance of “a dish I’ve never tried before” whereas low-involved consumers do less (61% for high-involved c.f. 56% for low-involved); which directly taps into this notion of exploration or variety-seeking behaviour. Furthermore, the low-involved consumers express some importance towards the “avoidance of certain foods”, whereas this is of very little importance to the high-involved consumers (46% for low-involved c.f. 26% for high-involved).
The recent trend towards the consumption of local and sustainable produce driven by the agendas of government and aggregate environmental pressures is a concept eagerly adopted by food-service operators. The aggregate results, above, revealed that there was indeed a very low level of importance placed on the attribute of “the core ingredient of the dish is sustainably produced”8. And this low level of importance was consistent across restaurant context (fine vs casual dining) as well as meal type (regular vs seafood dish). When investigating the results based on the level of food involvement, we do see a small difference: the sustainability of the produce is more unimportant to high-involved consumers compared to the low-involved consumers (32% for low-involved c.f. 38% for high-involved). The marketing of local and sustainable produce is unlikely on its own to attract new customers, nor encourage repeat patronage at casual restaurants as menu items containing local and/or sustainable produce may be perceived as a novel selection. If there is to be some effect at all, it is more likely to be so in fine-dining restaurants, however, here too, it is likely to be only a weak stimulus in the light of many other much more potent attributes that guide diners’ choices.
Influences on Consumer Choices in Restaurants 78 Ehrenberg-Bass Institute—2010
8 This result is consistent with other preference-based studies, which have demonstrated that, although consumer interest in sustainable and local produce may be increasing, ethical factors are only taken into account by a minority of consumers (Vermeir & Verbeke, 2006; Zepeda & Leviten-Reid, 2004).

Based on the results of this study, there is sufficient evidence to suggest that the ranking of the importance of various menu item attributes do vary significantly between consumers with low and high levels of food involvement. In addition, the results of this study highlight the importance of food involvement as mediator of consumer choice behaviour in the restaurant context.
The relative importance of menu item attributes for consumers with a low vs. high effect of social context
Social context (opinion-seeking) scaleWe measured the extent to which social context would likely impact on consumers’ choices. To do so, we examined the extent to which an individual would actively seek out the advice of others prior to making a menu item choice, as this tendency to engage in opinion-seeking behaviour during the decision-making and item selection process can be considered an effect of the the immediate social context.
A measurement instrument has not yet been developed to specifically measure social context in a restaurant setting. Therefore, we adapted the opinion-seeking scale developed by Flynn et al.9, (1996) to the specific restaurant context. The scale takes into account the extent to which group influence moderates an individual’s ability to make menu item choices in a restaurant context.
1. When I consider selecting a menu item I ask other people for advice;2. I don’t need to talk to others before I select a menu item;3. I rarely ask other people what menu item to select;4. I like to get others’ opinions before I select a menu item;5. I feel more comfortable selecting a menu item when I have obtained other people’s
opinions on it; and6. When choosing a menu item, other people’s opinions are not important to me.
To measure the effect of social context, a total score (index of Opinion Seeking) was calculated for each respondent based on their agreement to each of the above questions, measured on a 7-point Likert scale, with scores ranging from 1 to 7. Negatively worded items (2, 3 and 6) were reversed. Individual scores could theoretically range from a minimum of 6 (low social influence) to a maximum score of 42 (highly influenced by social context). The sample was then divided into three groups based on an individual’s total score. Respondents’ with scores 16 points or below demonstrated a “low” social influence effect, from 17 to 25 points “medium influence” and scores of 26 points and above were classified as a “high effect”.
Influences on Consumer Choices in Restaurants 79 Ehrenberg-Bass Institute—2010
9 Flynn, LR, Goldsmith, RE & Eastman, JK 1996, ‘Opinion Leaders and Opinion Seekers: Two Measurement Scales’, Journal of the Academy of Marketing Science, vol. 24, no.2, pp. 137-147

Respondents classified as having a “medium” social context effect were removed for the purpose of analysis in order to objectively discriminate between the attribute-based preferences of consumers with a “low” and “high” effect of social context. In total, approximately 59% of respondents were retained for subsequent analysis.
Figure 30: Relative importance of menu item attributes for the low and high social context segments
28
27
44
43
49
54
54
70
49
49
63
76
100
35
40
48
60
65
71
73
82
85
87
88
92
100
0 10 20 30 40 50 60 70 80 90 100
The core ingredient of the dish is sustainably produced
Avoidance of certain foods
A dish that features local produce
A dish representing a healthy option
A dish I’ve never tried before
The way a dish is written on the menu tempts my palate
The accompaniments that come with the dish
The method of preparation
A dish that I have tried before and I know that I will like the taste
The price of the dish
A sufficient portion size that will satisfy my appetite
A dish that I could not/would not want to prepare at home
The combination of ingredients complements each other well
Relative importance
Relative importance of menu-item attributes for the low and high social context
segments
High
Low
Highly influenced individuals place more importance on the consideration of the price of the dish, portion size, past experience, accompaniments and the description of the dish
The two groups are rather more similar to one another than were the two groups of food-involved consumers—the scores of the two groups are generally closer together.
Perhaps not surprisingly, the group who are more highly influenced by social context generally assign higher importance scores to all of the menu item attributes—their choices appear to be more influenced by external sources of information, generally. Thus, while they are more influenced by other people’s views, they are also influenced more by other external sources of information including prices etc. However, they also assign a much higher importance on their own past experience than do low socially influenced individuals.
Given that restaurant patrons who are more highly influenced by social context place a greater relative importance on menu item attributes, they are therefore more likely to actively seek out (and value) the opinion of others in relation to their choices of
Influences on Consumer Choices in Restaurants 80 Ehrenberg-Bass Institute—2010

items on a menu. Therefore, it appears that restaurant patrons who are highly socially influenced seek the opinion of others in the dining environment in order to reduce the risk associated with the trade-off between substitutable menu item alternatives. But they also rely on their own past experiences to do the same.
The relative importance of menu item attributes for consumers with a low vs. high effect of social contextRestaurant patrons with either a low or high influence of social context considered “the combination of ingredients complements each other well” as the most important attribute influencing their menu item choice, and to a lower extent, “a dish that I could not / would not want to prepare at home”. However, the highly socially influenced segment of consumers placed more importance on “a dish that I could/would not want to prepare at home” compared to the importance given by low socially influenced consumers.
Results indicate that both segments consider the “avoidance of certain foods” and “the core ingredient of the dish is sustainably produced” as extremely minor influences on their menu item selection.
The extent to which people are influenced by social influences can also be related to an individual’s tendency to engage in variety-seeking behaviour. Consumers who are highly socially influenced place considerably more importance on ordering a dish that they have tried (and they know they like the taste) than restaurant patrons with a low effect of social influence. The evidence of a relationship between social context and the tendency to seek variety on restaurant menus confirms the findings of previous studies, which suggest that variety-seeking in food-choice is influenced by contextual characteristics.
But curiously, the tendency to engage in variety-seeking behaviour (i.e., try a dish that they’ve never tried before) is also much greater among the highly influenced segment. A potential explanation is that individuals who are highly socially influenced may perceive it as a social norm to consume a variety of items, across and during consumption occasions.
The segment of consumers who are highly socially influenced also place a much greater relative importance on the “the price of the dish” and “a sufficient portion size”. Given that portion size exerts a significant influence on the menu item choice of restaurant patrons strongly affected by the social context, it is possible that a positive correlation exists between a patrons’ susceptibility to interpersonal influence and food intake.
In summary, the results indicate that the factors that influence menu item choice differ between the segment of consumers with a low and high effect of social context.
Influences on Consumer Choices in Restaurants 81 Ehrenberg-Bass Institute—2010

OBJECTIVE 4: CONSUMERS’ FUTURE BEHAVIOUR WITH REGARDS TO PRAWNSThis section investigates consumers’ likely purchase behaviour with regards to prawns, and how the likelihood of consumers ordering prawns in a restaurant context differs depending on various situations. In the first instance, consumers were asked their likelihood of purchasing prawns in the next 4 weeks at a restaurant, which established a baseline level of consumption. Then, through introducing various claims associated with the consumption of prawns, we sought to estimate the extent to which consumers would be more (or less) likely to purchase prawns compared to the baseline situation.
As described previously, we split the sample into two sub-samples related to the restaurant context: casual dining on the one hand and fine-dining restaurant on the other. For this analysis, we split again these two sub-samples into two sub-samples, with one presenting to the respondents the following situation: “We are interested in your future behaviour with regards to prawns, and how likely you will order prawns for an entrée at the restaurant in the next 4 weeks”; and the other presenting the situation of ordering prawns for a main course.
The following table indicates the number of people who responded to each of the possible scenarios. For example, 300 people were asked the following question: What are the chances that you will order prawns for a main course at a fine-dining restaurant in the next weeks?
Table 37: Respondents per scenario
Restaurant type Prawns for an entrée
Prawns for a main course Total
Casual-dining 302 301 603
Fine-dining 305 300 605
Total 607 601 1208
The different situations were presented to the respondents using the empirically validated Verbal Probability Scale as follows, using the fine-dining context as an example:
We are interested in your future behaviour with regards to prawns, and how likely you will order prawns at the restaurant in the next 4 weeks (assuming you will visit a fine-dining restaurant in that period of time) depending on various situations. We would like you to answer the following questions on a scale from 0 to 10.
Influences on Consumer Choices in Restaurants 82 Ehrenberg-Bass Institute—2010

If you are certain or practically certain that you will order prawns for the situation that is suggested, then you should choose the answer 10.
If you think that there is no chance or almost no chance, then the best answer would be 0.
If you are uncertain about the prospects, choose another number as close to 0 or 10 as you think it should be. You can think of the numbers as chances out of 10. For example, 3 would be 3 chances out of 10, while 7 would mean that there would be 7 chances out of 10 that you would order prawns at the restaurant in the next 2 months.
Respondents were presented with a baseline situation:
What are the chances that you will order prawns for an entrée at a fine-dining restaurant in the next 4 weeks?
And then, were asked to rate how likely they would order prawns for an entrée under various situations:
Now, what are the chances that you will order prawns at a fine-dining restaurant in the next 4 weeks if you were told that…:
• the prawns dish was prepared with native ingredients (bush tomato, lemon myrtle, saltbush, quandongs or muntries)?
• the prawns the restaurant sources are harvested sustainably and MSC accredited?
• the prawns of the dish were wild caught?
• the prawns of the dish were farmed?
• the prawns are sourced from the Spencer Gulf Prawn Fisherman’s Association?
• the prawns are local?• the Marine Stewardship Council accredits the prawns’ fisheries?
• the prawns are imported?
• the prawns are preservatives free?
• you were presented with a greater variety of dishes including prawns (new recipes / innovative way to have prawns in the dish)?
• the prawns had been frozen on the boat?
• the prawns of the dish were already peeled and de-headed?
Influences on Consumer Choices in Restaurants 83 Ehrenberg-Bass Institute—2010

Chances to order prawns for an entrée at a restaurant in the next 4 weeks
Figure 31: Chances to order prawns for an entrée in the next 4 weeks
5.0 5.7 5.5 5.2 5.1 5.0 5.0 4.9 4.9 4.8 4.7
3.7 3.1
5.2 5.6 5.6 5.2 4.9 5.0 4.9 4.9 5.0 4.7 4.5 3.6
2.9
0 1 2 3 4 5 6 7 8 9
10
Ord
er p
raw
ns in
the
next
4 w
eeks
Gre
ater
var
iety
Loca
l
Wild
cau
ght
Pres
erva
tive
free
Har
vest
ed s
usta
inab
ly a
nd M
SC
accr
edite
d
Mar
ine
Stew
ards
hip
Cou
ncil
accr
edits
the
praw
ns’ f
ishe
ries
From
the
Spen
cer G
ulf P
raw
n Fi
sher
man
’s A
ssoc
iatio
n
Peel
ed a
nd d
e-he
aded
Farm
ed
Nat
ive
ingr
edie
nts
Froz
en o
n th
e bo
at
Impo
rted
Chances to order prawns for an entrée at a restaurant in the next 4 weeks
Casual Fine-dining
There is no difference between the casual dining and fine dining contexts on what activities would influence greater prawns consumption
There are no significant differences between casual and fine-dining responses for ordering prawns for an entrée between the baseline situation and all the various situations suggested. The chances for casual and fine-dining patrons to order prawns for an entrée in the next 4 weeks are about 5 in 10, 50%. Two situations would slightly increase the chances to order prawns for an entrée: ‘if there was a greater variety of dishes including prawns, such as new recipes / innovative ways to have prawns in the dish’ (score of 5.6); and ‘if the prawns were local’ (score of 5.5).
Most of the other situations are more or less in line with the baseline situation: if the prawns were wild caught (score of 5.2); if the prawns were known as being preservative free (score of 5); if the prawns were harvested sustainably and MSC accredited (score of 5); if you knew that the Marine Stewardship Council accredits the prawns’ fisheries (score of 5); if consumers knew that prawns are from the Spencer Gulf Fisherman’s association (score of 4.9); if the prawns were peeled and de-headed (score of 5); if the prawns were farmed (score of 4.8), and if the prawns were prepared using native ingredients (score of 4.6).
Influences on Consumer Choices in Restaurants 84 Ehrenberg-Bass Institute—2010

However, two situations would decrease the likelihood of consumption of prawns: knowing that the prawns are frozen on the boat (score 3.7) and knowing that prawns are imported (score of 3).
Chances to order prawns for a main course at a restaurant in the next 4 weeks
Figure 32: Chances to order prawns for a main course in the next 4 weeks
5.0 5.7 5.3 5.3 5.1 5.0 5.0 5.0 4.9 4.7 4.3
3.6 3.0
4.9 5.8 5.5
5.0 5.1 5.0 4.9 4.9 4.8 4.6 4.7 3.9
2.9
0 1 2 3 4 5 6 7 8 9
10
Ord
er p
raw
ns in
the
next
4 w
eeks
Gre
ater
var
iety
Loca
l
Peel
ed a
nd d
e-he
aded
Wild
cau
ght
Har
vest
ed s
usta
inab
ly a
nd M
SC
accr
edite
d
Mar
ine
Stew
ards
hip
Cou
ncil
accr
edits
th
e pr
awns
’ fis
herie
s
Pres
erva
tive
free
From
the
Spen
cer G
ulf P
raw
n Fi
sher
man
’s A
ssoc
iatio
n
Farm
ed
Nat
ive
ingr
edie
nts
Froz
en o
n th
e bo
at
Impo
rted
Chances to order prawns for a main course at a restaurant in the next 4 weeks
Casual Fine-dining
St
As with the results for ordering prawns for an entrée, there are no significant differences between casual and fine-dining responses for ordering prawns for a main course between the baseline situation and all the various situations suggested. The chances for casual and fine-dining patrons to order prawns for a main course in the next 4 weeks are also about 5 in 10. Again, there are two situations which would slightly increase the chances of ordering prawns for a main course, which are the same as with the scenario or ordering prawns for an entrée: ‘if there was a greater variety of dishes including prawns, such as new recipes / innovative way to have prawns in the dish’ (score of 5.8); and ‘if the prawns were local’ (score of 5.4).
Most of the other situations are more or less in line with the baseline situation: if the prawns were peeled and de-headed (score of about 5.2); if the prawns were wild caught (score of 5.1); if the prawns were harvested sustainably and MSC accredited (score of 5); if you knew that the Marine Stewardship Council accredits the prawns’
Influences on Consumer Choices in Restaurants 85 Ehrenberg-Bass Institute—2010

fisheries (score of 5); if the prawns were known as being preservative free (score of 5); if consumers knew that prawns are from the Spencer Gulf Fisherman’s association (score of 4.9); if the prawns were farmed (score of 4.7), and if the prawns were using native ingredients (score of 4.5).
Again, the two situations which would decrease the chances of consumers ordering prawns were: ‘knowing that the prawns are frozen on the boat’ (score of 3.7) and ‘knowing that prawns are imported’ (score of 3).
Chances to order prawns for a meal at a restaurant in the next 4 weeksWhatever the scenario, there is no significant difference in the responses provided between the casual and fine-dining restaurant contexts as well as between prawns for an entrée and prawns for a main course dish.
Overall, there is 5 chances in 10 for consumers to order prawns at a restaurant in the next 4 weeks. Because of the competition between all animal proteins on a menu, one can state that such a score is good. Whatever the scenario, only two situations would slightly increase the chances to order prawns for meal: a greater variety of dishes including prawns such as new recipes / innovative way to have prawns in the dish and telling the consumers that prawns are locally sourced. However, most likely due to the low levels of consumer awareness, the use of a local denomination (such as ‘Spencer Gulf’ which was tested here) was not sufficient to attract the increased probability that merely specifying ‘locally sourced’ did.
We investigated the extent to which various socio-demographics influenced the chances to order prawns under the different scenarios.
When looking at the way males and females responded to the questions, one can observe that females, on average, gave slightly higher scores to almost all questions compared to males.
Influences on Consumer Choices in Restaurants 86 Ehrenberg-Bass Institute—2010

Table 38: Chances to order prawns for a meal at a restaurant in the next 4 weeks by gender
Situation Male Female * = sig. diff.
What are the chances that you will order prawns at a restaurant in the next 4 weeks? 4.8 5.2 *
…you were presented with a greater variety of dishes including prawns (new recipes / innovative way to have prawns in the dish) 5.5 5.8 *
…the prawns are local 5.2 5.7 *
…the prawns of the dish were wild caught 5.0 5.2 *
…the prawns of the dish were already peeled and de-headed 4.8 5.2 *
…the prawns the restaurant sources are harvested sustainably and MSC accredited 4.7 5.2 *
…the prawns are imported 4.8 5.1 *
…the Marine Stewardship Council accredits the prawns’ fisheries 4.7 5.0 *
... if the prawns dish was prepared with native ingredients (bush tomato, lemon myrtle, saltbush) 4.5 4.5 –
... if you were told that the prawns of the dish were farmed 4.5 4.7 –
... if you were told that the prawns are sourced from the Spencer Gulf Prawn Fisherman’s Association 4.9 4.7 –
... if you were told that the prawns are imported 3.0 2.8 –
…if you knew prawns had been frozen on the boat 3.8 3.5 *
There are also differences based on where people live (Figure 19).
• People in NSW have the highest likelihood of ordering prawns in a restaurant in the next 4 weeks and also the ones who have more chance to order prawns whatever the scenario (except for when they are listed as Spencer Gulf prawns in SA).
• People living in Queensland tend to slightly increase their chance of ordering prawns if they know that prawns are wild caught, local, and presented with a greater variety of dishes including prawns.
Influences on Consumer Choices in Restaurants 87 Ehrenberg-Bass Institute—2010

Table 39: Chances of ordering prawns for a meal at a restaurant in the next 4 weeks, by states
Situation NSW Vic. Qld WA SA Tas. ACT NT* = sig. diff.
What are the chances that you will order prawns at a restaurant in the next 4 weeks? 5.2 5.0 4.9 4.4 4.9 4.4 4.2 6.3 –
... if the prawns dish was prepared with native ingredients (bush tomato, lemon myrtle, saltbush)
4.9 4.5 4.4 3.7 4.5 3.4 4.0 5.2 *
…the prawns the restaurant sources are harvested sustainably and MSC accredited 5.2 5.0 4.8 4.3 5.0 4.7 4.1 5.8 *
…the prawns of the dish were wild caught 5.4 5.1 5.3 4.4 4.7 4.7 4.7 7.3 *
... if you were told that the prawns of the dish were farmed 5.0 4.6 4.5 4.0 4.4 3.9 3.5 6.5 *
... if you were told that the prawns are sourced from the Spencer Gulf Prawn Fisherman’s Association
5.0 4.8 4.8 4.2 5.2 4.5 3.7 7.1 *
…the prawns are local 5.6 5.5 5.5 4.9 5.5 4.7 4.9 7.8 *
…the Marine Stewardship Council accredits the prawns’ fisheries 5.2 5.1 4.8 4.2 4.6 4.5 3.7 6.3 *
... if you were told that the prawns are imported 3.2 3.2 2.2 2.6 3.2 2.0 2.2 1.6 *
…the prawns are preservative free 5.3 5.0 4.9 4.2 4.8 4.5 3.8 6.7 *
…you were presented with a greater variety of dishes including prawns (new recipes / innovative way to have prawns in the dish)
5.9 5.6 5.7 4.9 5.6 5.2 5.2 6.2 –
…if you knew prawns had been frozen on the boat 3.7 3.7 3.5 3.3 4.2 2.7 3.5 4.6 –
…the prawns of the dish were already peeled and de-headed 5.3 4.9 4.9 4.5 5.1 5.2 4.7 5.6 –
• People in SA tend to slightly increase their chance to order prawns if they know that prawns are sourced from the Spencer Gulf Fisherman’s Association, local, and presented with a greater variety of dishes including prawns.
• People living in Tasmania had a low likelihood of ordering prawns, responding an average score below 5 (out of 10) for almost all questions.
• People living in Victoria would only slightly increase if prawns are local and presented with a greater a variety of dishes including prawns.
• People living in Canberra have the lowest score in almost all situations.
Influences on Consumer Choices in Restaurants 88 Ehrenberg-Bass Institute—2010

• People living in WA are similar to the ones living in Victoria and would only slightly increase their chances of ordering prawns if prawns were local and presented with a greater a variety of dishes including prawns.
Age has an influence on the chances to order prawns at the restaurant. The older the person, the greater the chances to order prawns whatever the scenario.
Table 40: Chances of ordering prawns for a meal at a restaurant in the next 4 weeks, by age
Situation 20-24 25-34 35-44 45-54 55-59 * = sig. diff.
What are the chances that you will order prawns at a restaurant in the next 4 weeks? 4.8 4.5 5.1 5.2 5.3 *
... if the prawns dish was prepared with native ingredients (bush tomato, lemon myrtle, saltbush) 4.2 4.3 4.5 4.6 4.9 –
…the prawns the restaurant sources are harvested sustainably and MSC accredited 4.4 4.4 5.1 5.3 5.2 *
…the prawns of the dish were wild caught 4.7 4.7 5.2 5.3 5.4 *
... if you were told that the prawns of the dish were farmed 4.3 4.2 4.6 5.0 4.9 *
... if you were told that the prawns are sourced from the Spencer Gulf Prawn Fisherman’s Association 4.2 4.2 4.9 5.3 5.4 *
…the prawns are local 5.0 5.1 5.5 5.7 5.8 *
…the Marine Stewardship Council accredits the prawns’ fisheries 4.2 4.5 5.0 5.2 5.1 *
... if you were told that the prawns are imported 3.9 3.1 2.9 2.7 2.6 *
…the prawns are preservative free 4.6 4.5 5.0 5.2 5.2 *
…you were presented with a greater variety of dishes including prawns (new recipes / innovative way to have prawns in the dish)
5.3 5.3 5.6 5.8 6.1 *
…if you knew prawns had been frozen on the boat 3.7 3.4 3.7 3.6 3.9 –
…the prawns of the dish were already peeled and de-headed 4.9 4.6 5.1 5.2 5.2 –
Influences on Consumer Choices in Restaurants 89 Ehrenberg-Bass Institute—2010

OBJECTIVE 5: CONSUMERS’ (STATED) WILLINGNESS TO PAY FOR VARIOUS SEAFOOD DISHESThis section investigates consumers’ stated willingness to pay for various seafood dishes based on the way that each dish is written on the menu.
Respondents were first presented a seafood dish and its price, as a baseline condition. Then, other dishes were introduced for which we asked the respondents how much they would pay for it in a restaurant, given the baseline offering. Finally, we wanted to know which of these dishes they would actually order at the restaurant.
Five different dishes were investigated: Fish and Chips, Oysters, Prawns, Trevalla, and Kingfish.
We intentionally chose a baseline seafood dish described in a very simple way, for example, ‘Fish and Chips served with green salad’. Then, the three other dishes introduced what we perceived as being an added value to that dish: a healthy option (‘grilled’); a seafood with an (local) origin; a method of preparation (using French typical recipe words); a well known brand, etc.
Fish and ChipsRespondents were presented with the following situation:
If you saw on the menu the dish “Fish and Chips (served with green salad)” priced at $15, what would you expect to see the following dishes priced at on the menu?
• Cooper’s beer battered fish and chips (served with green salad)• Grilled fish and baked potatoes (served with green salad and low fat sour cream)• Hoki and chips (served with green salad)
Which of these dishes (if any) would you consider ordering at a restaurant?
We selected these three dishes based on the assumption that:
• Adding a well-known brand (Cooper’s beer) would greater value this popular dish• Adding a healthy way of cooking the fish and the potatoes (plus low fat cream)
would greater value the dish
Influences on Consumer Choices in Restaurants 90 Ehrenberg-Bass Institute—2010

• Telling the name of the fish (Hoki) would greater value the dish
First, people are willing to pay more for a Fish and Chips dish if it was presented in a more attractive way:
• About $1.80 more if the dish is presented as “Cooper’s beer battered fish and chips (served with green salad)”. Fine-diners are willing to pay a bit more for the dish as presented.
• About $1.40 more if the dish is presented as “Grilled fish and baked potatoes (served with green salad and low fat sour cream)”. Fine-diners are willing to pay a bit more for the dish as presented.
• About $0.20 more if the dish is presented as “Hoki and chips (served with green salad)”. There is no significant difference between fine-diners and casual-diners.
Table 41: Willingness to pay for Fish and Chips menu variations
DishCasual
dining
Fine
diningTotal
Baseline: Fish and Chips (served with green salad) $15$15$15
Cooper’s beer battered fish and chips (served with green salad) +$1.50 +$2.10 * +$1.80
Grilled fish and baked potatoes (served with green salad and low fat sour cream) +$1.10 +$1.60 * +$1.40
Hoki and chips (served with green salad) +$0.20 +$0.30 +$0.20
People are willing to pay the most for Cooper ’s Beer Battered Fish and Chips
A fine dining price premium is evident, with people, on average, willing to pay a slightly higher premium for the same dish when in the fine dining context.
When presented with the species name of Hoki, people did not value the dish significantly more than they did a fish and chips dish presented in the basic way. This would indicate that to most people, they would not value knowing that it was Hoki any more than just a nondescript species, and only a few would value it slightly higher.
Both of the other alternative presentations (Cooper’s battered and the grilled option) generated an approximately 10% incremental willingness to pay—slightly more for the Cooper’s battered alternative and slightly less for the grilled option.
Influences on Consumer Choices in Restaurants 91 Ehrenberg-Bass Institute—2010

When asking respondents the dishes they would consider ordering at a restaurant, we found about half of each sub-sample that would consider these dishes for order. The results are shown in the following table. The popularity of the baseline offering is shown in the first row, with the subsequent rows for each of the alternatives showing the incremental change in popularity from the baseline offering. The last row indicates the extent to which none of the offerings were chosen; a higher figure in the ‘none’ row indicates that all of the offerings were not very attractive.
Table 42: Selection of Fish and Chips dishes
DishCasual
dining
Fine
dining
Baseline: Fish and Chips (served with green salad) 53% 45%
Cooper’s beer battered fish and chips (served with green salad) –3 +1
Grilled fish and baked potatoes (served with green salad and low fat sour cream) +6 +10
Hoki and chips (served with green salad) –18 –17
None of these 7% 12%
The grilled fish option was the most popular item in both casual and fine-dining
We see that most people are willing to buy one (or more) of the offerings, either the baseline or one of the alternatives, with only about 10% not willing to buy any of the offerings.
The baseline, minimally-described offering is an attractive offering in its own right: in both the fine-dining and the casual dining contexts, close to half of all people would be willing to buy the baseline offering of Fish and Chips served with green salad. However, this minimally described option was more attractive in the casual dining context than in the fine-dining context. The fact that the proportion of respondents who would order none of these alternatives was higher in among the fine-dining segment than the casual dining segment indicates that to some extent people are seeking something more from a fine meal, rather than ‘just’ a fish and chips offering.
The most popular alternative was the grilled fish option with baked potato which yielded a reasonable improvement over the baseline offering, particularly among the fine dining segment, increasing the popularity of the dish from 45% to 55%. While this alternative did command a higher willingness to pay than for the baseline offering, it was not as high an increase as for the Cooper’s battered alternative. Therefore, while this style of dish is appealing to more people than the baseline
Influences on Consumer Choices in Restaurants 92 Ehrenberg-Bass Institute—2010

offering—probably due to the more healthy, grilled option—people expect to pay less of a premium for it than for a Cooper’s beer batter.
The Cooper’s beer battered fish, on the other hand, yielded no substantive change in popularity, though if anything a slightly lower popularity than did the baseline offering. However, this alternative did command the largest increase on the willingness to pay, commanding a price increase of approximately 10% over the baseline offering. So, people do expect to pay more for a Cooper’s Beer battered fish, though it appears to put some people off, due to the less healthy option than grilling.
The biggest variation in popularity from the baseline offering, however, was for the alternative which specifically mentioned ‘Hoki’. This wording substantially reduced the popularity in both the casual and fine-dining contexts by about a third. And it had no substantive change to the willingness to pay for the meal. So, those people who would be happy to order a meal of Hoki and Chips would be willing to pay only about the same as they would for a meal of a nondescript fish and chips.
Because willingness to pay for a Fish and Chips dish may change based on the willingness to purchase it, in the table below we present these figures for respondents who stated that they would purchase both the baseline situation (Fish and Chips, served with green salad) and the Fish and Chips menu variation.
Table 43: Willingness to pay for Fish and Chips menu variations of those willing to purchase both the baseline situation and the menu variation
DishCasual
dining
Fine
diningTotal
Baseline: Fish and Chips (served with green salad) $15$15$15
Cooper’s beer battered fish and chips (served with green salad) +$1.79 +$2.32 +$2.02
Grilled fish and baked potatoes (served with green salad and low fat sour cream) +$1.41 +$2.03 * +$1.69
Hoki and chips (served with green salad) +$0.23 +$0.88 +$0.52
People willing to purchase both the baseline situation and the menu variation would pay a greater price premium compared to the respondents not willing to purchase one or both options
As for all respondents, one can consider that fine diners who would purchase both the baseline situation and the menu variation would pay a price premium greater than the price premium paid by casual diners. Overall, people willing to buy both the baseline situation and the menu variation would pay a greater price premium compared to the respondents not willing to purchase one or both of the variations.
Influences on Consumer Choices in Restaurants 93 Ehrenberg-Bass Institute—2010

OystersRespondents were presented with the following situation:If you saw on the menu the dish “half a dozen of Oysters (served with lemon and vinaigrette)” priced at $10, what would you expect to see the following dishes priced at on the menu?
• Freshly shucked oysters (served with lemon and vinaigrette)• Coffin Bay Freshly shucked oysters (served with lemon juice and shallot
vinaigrette)• Tasmanian Barilla Bay Oysters – Natural
Which of these dishes (if any) would you consider ordering at a restaurant?
We selected these three dishes based on the assumption that:
• Telling clients that these oysters are freshly shucked would greater value a dish quite difficult to sell in restaurant
• Telling the clients that in addition to the fresh aspect of the oyster, these oysters are from a well known region (Coffin Bay) would greater value the dish
• And by opposition, the extent a region of origin itself (Tasmanian Barilla) would greater value the dish
First, people are willing to pay more for an Oyster dish if it was presented in a more attractive way:
• About $2.70 more if the dish is presented as “Freshly shucked oysters (served with lemon and vinaigrette)”. And fine-diners are willing to pay even more for the dish as presented (+$1.30 compared to the casual dining context).
• About $3.70 more if the dish is presented with the regional denomination “Coffin Bay Freshly shucked oysters (served with lemon juice and shallot vinaigrette)”. Fine-diners are willing to pay more for the dish as presented (+$1.10 compared to the casual dining context).
• About $4.20 more if the dish is presented with the regional denomination “Tasmanian Barilla Bay Oysters – Natural”. Fine-diners are willing to pay more for the dish as presented (+$0.90 compared to the casual dining context).
Influences on Consumer Choices in Restaurants 94 Ehrenberg-Bass Institute—2010

Table 44: Willingness to pay for Oyster menu variations
DishCasual
dining
Fine
diningTotal
Baseline: half a dozen of Oysters (served with lemon and vinaigrette) $10$10$10
Freshly shucked oysters (served with lemon and vinaigrette) +$2.00 +$3.30 * +$2.70
Coffin Bay Freshly shucked oysters (served with lemon juice and shallot vinaigrette) +$3.10 +$4.20 * +$3.70
Tasmanian Barilla Bay Oysters – Natural +$3.80 +$4.70 * +$4.20
Again, the fine dining price premium is evident, with people, on average, willing to pay a slightly higher premium for the same dish when in the fine dining context.
We wanted to test the extent people would value more oysters when knowing that they were freshly shucked. People would pay an extra price premium of $2.00 to $3.30 if it was presented as ‘freshly shucked’. We then wanted to test the extent that adding a geographical origin known for its oysters would add more value. Consumers would pay a bit more, indeed, when oysters are presented as ‘Coffin Bay Freshly shucked oysters (served with lemon juice and shallot vinaigrette)’ the premium is $3.10 for casual diners and $4.20 for fine diners. The last oyster dish included the word ‘natural’ with oysters sourced from the Tasmanian Barilla Bay region. This way of presenting the oyster dish generated the highest willingness to pay among the three scenarios with a price premium of $3.80 for the casual dining sample and $4.70 for the fine-dining sample.
When asking respondents the dishes they would consider ordering at a restaurant, we found that about half of each sub-sample would consider ordering each of these dishes. The results are shown in the following table. The popularity of the baseline offering is shown in the first row, and the subsequent rows for each of the alternatives showing the incremental change in popularity from the baseline offering. The last row indicates the extent to which none of the offerings were chosen; a higher figure in the ‘none’ row indicates that all of the offerings are not very attractive.
Influences on Consumer Choices in Restaurants 95 Ehrenberg-Bass Institute—2010

Table 45: Selection of Oyster dishes
DishCasual
dining
Fine
dining
Baseline: half a dozen of Oysters (served with lemon and vinaigrette) 29% 26%
Freshly shucked oysters (served with lemon and vinaigrette) +5 +6
Coffin Bay freshly shucked oysters (served with lemon juice and shallot vinaigrette) +5 +8
Tasmanian Barilla Bay Oysters – Natural +8 +11
None of these 43% 44%
Close to half of people would not order any oysters. Of those who would, Tasmanian Barilla Bay are the most popular.
In the table above, we see that in both the fine-dining and the casual dining context, close to half of all people would not order any of the oysters on offer—presumably these are people who have an aversion to oysters in general or at least from the restaurant.
All of the alternatives have a higher popularity than the baseline option, indicating the added value from more meaningful description of oysters on the menu which enhances their attractiveness.
Of the alternatives, the natural, Tasmanian Barilla Bay Oysters were the most popular, which is in line with the willingness to pay measures as well—so, more people are willing to order these oysters and would do so at a higher price as well.
Because willingness to pay for a Oyster dish may change based on the willingness to purchase it, in the table below we present these figures for respondents who stated that they would purchase both the baseline situation (Half a dozen of Oysters served with lemon and vinaigrette) and the Oyster menu variation.
Influences on Consumer Choices in Restaurants 96 Ehrenberg-Bass Institute—2010
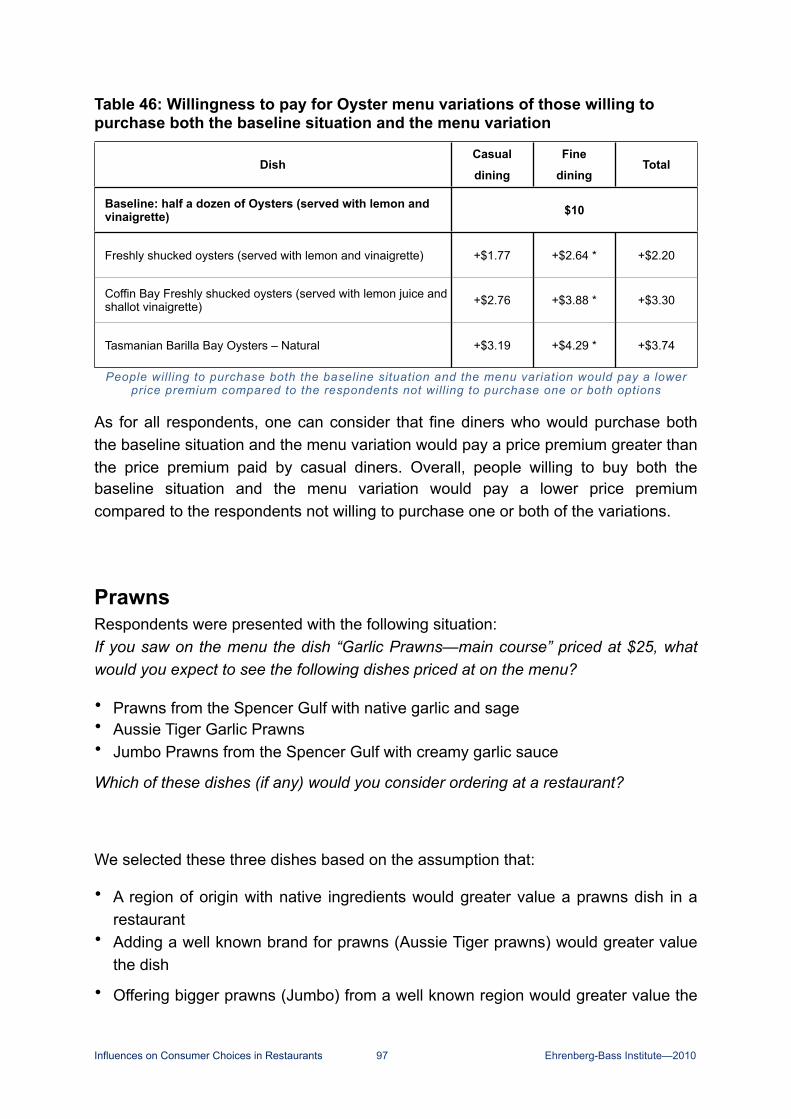
Table 46: Willingness to pay for Oyster menu variations of those willing to purchase both the baseline situation and the menu variation
DishCasual
dining
Fine
diningTotal
Baseline: half a dozen of Oysters (served with lemon and vinaigrette) $10$10$10
Freshly shucked oysters (served with lemon and vinaigrette) +$1.77 +$2.64 * +$2.20
Coffin Bay Freshly shucked oysters (served with lemon juice and shallot vinaigrette) +$2.76 +$3.88 * +$3.30
Tasmanian Barilla Bay Oysters – Natural +$3.19 +$4.29 * +$3.74
People willing to purchase both the baseline situation and the menu variation would pay a lower price premium compared to the respondents not willing to purchase one or both options
As for all respondents, one can consider that fine diners who would purchase both the baseline situation and the menu variation would pay a price premium greater than the price premium paid by casual diners. Overall, people willing to buy both the baseline situation and the menu variation would pay a lower price premium compared to the respondents not willing to purchase one or both of the variations.
PrawnsRespondents were presented with the following situation:If you saw on the menu the dish “Garlic Prawns—main course” priced at $25, what would you expect to see the following dishes priced at on the menu?
• Prawns from the Spencer Gulf with native garlic and sage• Aussie Tiger Garlic Prawns• Jumbo Prawns from the Spencer Gulf with creamy garlic sauce
Which of these dishes (if any) would you consider ordering at a restaurant?
We selected these three dishes based on the assumption that:
• A region of origin with native ingredients would greater value a prawns dish in a restaurant
• Adding a well known brand for prawns (Aussie Tiger prawns) would greater value the dish
• Offering bigger prawns (Jumbo) from a well known region would greater value the
Influences on Consumer Choices in Restaurants 97 Ehrenberg-Bass Institute—2010

dish
People are willing to pay slightly more for a Garlic Prawns dish if it was presented in a more attractive way. But there was no significant difference in premium between casual and fine-diners:
• About $1.40 more if the dish is presented as “Prawns from the Spencer Gulf with native garlic and sage”.
• About 20 cents more if the dish is presented as “Aussie Tiger Garlic Prawns”.
• About $1.10 more if the dish is presented as “Jumbo Prawns from the Spencer Gulf with garlic”.
Table 47: Willingness to pay for Prawns menu variations
DishCasual
dining
Fine
diningTotal
Baseline: Garlic Prawns—main course $25$25$25
Prawns from the Spencer Gulf with native garlic and sage +$1.20 +$1.60 +$1.40
Aussie Tiger Garlic Prawns +$0.10 +$0.40 +$0.20
Jumbo Prawns from the Spencer Gulf with creamy garlic sauce +$0.90 +$1.20 +$1.10
We wanted to test the extent people would value garlic prawns more if knowing that the prawns were sourced from the Spencer Gulf and from one of most well known brands selling prawns in Australia.
The use of the brand “Aussie Tiger Prawns” would generate very little (if any) premium. People would pay slightly more compared to the simple way to describe the main course ‘Garlic prawns’; just over an additional $1. The description of the dish referring to native garlic and sage would would generate a slightly higher price than without this description.
When asking respondents the dishes they would consider ordering at a restaurant, we found about half of each sub-sample would consider ordering these dishes. The results are shown in the following table. The popularity of the baseline offering is shown in the first row, whereas the subsequent rows for each of the alternatives shows the incremental change in popularity from the baseline offering. The last row
Influences on Consumer Choices in Restaurants 98 Ehrenberg-Bass Institute—2010

indicates the extent to which none of the offerings were chosen; a higher figure in the ‘none’ row indicates that all of the offerings are not very attractive.
Table 48: Selection of Prawns dishes
DishCasual
dining
Fine
dining
Baseline: Garlic Prawns—main course 47% 42%
Prawns from the Spencer Gulf with native garlic and sage –4 +6
Aussie Tiger Garlic Prawns +6 +11
Jumbo Prawns from the Spencer Gulf with creamy garlic sauce +6 +7
None of these 18% 18%
‘Aussie Tiger Garlic Prawns’ and ‘Jumbo Prawns from Spencer Gulf ’ are universally the most attractive alternatives. But Jumbo Spencer Gulf Prawns commanded the highest incremental price.
Again, most people are willing to buy one (or more) of the Prawns offerings, either the baseline or one of the alternatives, with about 20% not willing to buy any of the offerings.
And again, the baseline, minimally-described offering is an attractive offering in its own right: with close to half of both the fine-dining and the casual dining segments being willing to buy the baseline offering of Garlic Prawns. And as with the Fish and Chips and Oysters scenarios, this minimally described option was more attractive in the casual dining context than in the fine-dining context.
All of the alternatives had some level of additional demand overall than the baseline offering, although the Spencer Gulf prawns with native garlic and sage had a lower level of popularity than did the baseline offering.
Interestingly however, the casual dining segment did respond positively to the jumbo prawns from Spencer Gulf with creamy garlic sauce, though negatively to the other Spencer Gulf prawns alternative. This would indicate that the negative response was not due to the reference to the region of Spencer Gulf. Either the reference to sage put off the casual diners (and not the fine diners) or the reference to jumbo-sized prawns attracted them. Perhaps also, a reference to a regional source is always of value to a fine diner, but where the awareness of a region might be low, then it has little value to a casual diner. However, this option commanded the highest
Influences on Consumer Choices in Restaurants 99 Ehrenberg-Bass Institute—2010

incremental willingness to pay of all of the alternatives, so it could also be that fewer casual diners would be attracted to the dish at the expected higher price level.
While the most popular alternative was the Aussie Tiger Garlic Prawns, particularly for the fine dining segment, this alternative commanded a very low incremental willingness to pay. Therefore, this style of dish is appealing to more people than the baseline offering—which is most likely due to the reference to Australian prawns—but people expect to pay less of a premium than for other prawns from the Spencer Gulf. This either indicates that the brand ‘Aussie Tiger’ is worthless as an additional descriptor or that there is some recognition of a lower price for Tiger prawns or because the mention of specific regional origins is of greater value than a generic reference to Australian / Aussie prawns.
Because willingness to pay for a Prawns dish may change based on the willingness to purchase it, in the table below we present these figures for respondents who stated that they would purchase both the baseline situation (Garlic Prawns, main course) and the Prawns menu variation.
Table 49: Willingness to pay for Prawns menu variations of those willing to purchase both the baseline situation and the menu variation
DishCasual
dining
Fine
diningTotal
Baseline: Garlic Prawns—main course $25$25$25
Prawns from the Spencer Gulf with native garlic and sage +$1.27 +$1.65 +$1.45
Aussie Tiger Garlic Prawns +$0.51 +$1.12 +$0.80
Jumbo Prawns from the Spencer Gulf with creamy garlic sauce +$1.31 +$2.01 +$1.65
People willing to purchase both the baseline situation and the menu variation (except prawns from the Spencer Gulf option) would pay a greater price premium compared to the respondents not
willing to purchase one or both options
As for all respondents, one can consider that fine diners who would purchase both the baseline situation and the menu variation would pay a price premium greater than the price premium paid by casual diners. With regards to the dish ‘Prawns from Spencer Gulf with native garlic and sage’, there is no difference in the price premium that would be paid between all respondents and the respondents willing to purchase both options. With regards the dishes ‘Aussie Tiger Garlic Prawns’ and ‘Jumbo Prawns from the Spencer Gulf with creamy garlic sauce’, people willing to buy both the baseline situation and the menu variation would pay a greater price premium compared to the respondents not willing to purchase one or both of the variations.
Influences on Consumer Choices in Restaurants 100 Ehrenberg-Bass Institute—2010

TrevallaRespondents were presented with the following situation:If you saw on the menu the dish “Blue Eye Trevalla with a julienne of vegetables” priced at $25, what would you expect to see the following dishes priced at on the menu?
• Trevalla en papillotte served with potato dauphinoise and a beurre blanc sauce• Fresh deep sea blue-eye trevalla with a sauce of native green olive and vernaccia• South Australian line caught blue eye trevalla on a bed of risotto
Which of these dishes (if any) would you consider ordering at a restaurant?
We selected these three dishes based on the assumption that:
• Presenting the dish with French cooking recipe style (papillotte, dauphinoise, beurre blanc) would add value to the dish
• Telling the clients that the fish is caught in deep sea in addition to its fresh aspect would greater value the dish
• Telling the clients that the fish is line caught in South Australia, so adding a region of origin would greater value the dish
First, people are willing to pay slightly more for a Trevalla dish if it was presented in a more attractive way. But again, there was no significant difference between casual and fine-diners:
• About $1.70 more if the dish is presented as “Trevalla en papillotte served with potato dauphinoise and a beurre blanc sauce”.
• About $1.20 more if the dish is presented as “Fresh deep sea blue eye trevalla with a sauce of native green olive and vernaccia”.
• About $1.30 more if the dish is presented as ‘South Australian line caught blue eye trevalla on a bed of risotto’.
We wanted to test the extent people would value more Blue Eye Trevalla if presented with a ‘fancy’ French description (en papillotte, dauphinoise, beurre blanc), compared to the preparation with native ingredients, or sourced from SA in an ‘environmentally-friendly’ manner (line caught).
Influences on Consumer Choices in Restaurants 101 Ehrenberg-Bass Institute—2010

Table 50: Willingness to pay for Trevalla menu variations
DishCasual
dining
Fine
diningTotal
Baseline: Blue Eye Trevalla with a julienne of vegetables $25$25$25
Trevalla en papillotte served with potato dauphinoise and a beurre blanc sauce +$1.60 +$1.80 +$1.70
Fresh deep sea blue eye trevalla with a sauce of native green olive and vernaccia +$1.00 +$1.50 +$1.20
South Australian line caught blue eye trevalla on a bed of risotto +$1.00 +$1.50 +$1.30
People would pay more when the dish is presented in a French way compared to the two other recipes. Being sourced from South Australia and line caught would generate an extra price premium of about $1.30 compared to $1.20 if the fish is sourced from the fresh deep sea using native ingredients.
When asking respondents which of the dishes they would consider ordering at a restaurant, we found that under half of each sub-sample would consider ordering these dishes. The results are shown in the following table. The popularity of the baseline offering is shown in the first row, whereas the subsequent rows for each of the alternatives shows the incremental change in popularity from the baseline offering. The last row indicates the extent to which none of the offerings were chosen; a higher figure in the ‘none’ row indicates that all of the offerings are not very attractive.
Table 51: Selection of Trevalla dishes
DishCasual
dining
Fine
dining
Baseline: Blue Eye Trevalla with a julienne of vegetables 41% 38%
Trevalla en papillotte served with potato dauphinoise and a beurre blanc sauce –6 –2
Fresh deep sea blue eye trevalla with a sauce of native green olive and vernaccia –11 –5
South Australian line caught blue eye trevalla on a bed of risotto +2 +6
None of these 31% 30%
The dish specifying a regional origin had the greatest appeal of all alternatives
Influences on Consumer Choices in Restaurants 102 Ehrenberg-Bass Institute—2010

The Trevalla is not as popular as are the previous dishes, with about 30% (of both the casual and fine dining segments) not willing to buy any of the offerings. And the baseline offering, has only about 40% of both segments willing to buy it. Additionally, as we saw above, all of the alternatives yielded only a slight incremental improvement to willingness to pay for the alternatives. So, none of them appear to be overly attractive to diners, which would be due to a low familiarity with the species itself.
While the baseline option was again slightly more attractive in the casual-dining context than in the fine-dining context, the fine-dining segment was more responsive to all of the alternatives.
Both the ‘fancy’ French preparation alternative as well as the alternative that included native ingredients actually had a lower popularity than the baseline dish, and for both segments. So, both the French preparation as well as the use of native ingredients dissuaded some of the fine diners from purchasing these alternatives.
However, the dish that listed a regional origin and an ‘environmentally-friendly’ catch method had the greatest appeal of all alternatives and resulted in a higher popularity for both segments. Based on these results, we would expect that it is the specification of the regional origin more so than the environmentally-friendly harvest method that has the higher attractiveness. And as with the prawns dishes previously, the appeal of specifying regional origins in the dish description appear to be most attractive to the fine dining segment.
Because willingness to pay for a Blue Eye Trevalla dish may change based on the willingness to purchase it, in the table below we present these figures for respondents who stated that they would purchase both the baseline situation (Blue Eye Trevalla with a julienne of vegetables) and the Blue Eye Trevalla menu variation.
Influences on Consumer Choices in Restaurants 103 Ehrenberg-Bass Institute—2010

Table 52: Willingness to pay for Trevalla menu variations of those willing to purchase both the baseline situation and the menu variation
DishCasual
dining
Fine
diningTotal
Baseline: Blue Eye Trevalla with a julienne of vegetables $25$25$25
Trevalla en papillotte served with potato dauphinoise and a beurre blanc sauce +$2.14 +$3.24 * +$2.67
Fresh deep sea blue eye trevalla with a sauce of native green olive and vernaccia +$1.34 +$2.83 * +$2.09
South Australian line caught blue eye trevalla on a bed of risotto +$1.66 +$2.69 +$2.16
People willing to purchase both the baseline situation and the menu variation would pay a greater price premium compared to the respondents not willing to purchase one of the options
In line with the findings related to all respondents, fine diners who would purchase both the baseline situation and the menu variation would pay a price premium greater than the price premium paid by casual diners. Overall, people willing to buy both the baseline situation and one of the menu variations would pay a greater price premium compared to the respondents not willing to purchase one of the variations.
Yellowtail KingfishRespondents were presented with the following situation:If you saw on the menu the dish “Yellowtail Kingfish with roasted capsicum and mashed potatoes” priced at $30, what would you expect to see the following dishes priced at on the menu?
• Yellowtail Kingfish Carpaccio and Pomegranate, with frisée lettuce• Cleanseas Hiramasa Yellowtail Kingfish with pickled cucumber and yuzu• Grilled Yellowtail Kingfish on mashed potatoes with native parsley and lemon crust
Which of these dishes (if any) would you consider ordering at a restaurant?
We selected these three dishes based on the assumption that:
• Offering a light option would add value to the dish• Using a well known brand (Cleanseas Hiramasa) would greater value the dish
• Offering a healthy option (grilled) with native ingredients would add value to the dish
Influences on Consumer Choices in Restaurants 104 Ehrenberg-Bass Institute—2010

First, people are not willing to pay slightly more for a Yellowtail Kingfish dish if it was presented in a more attractive way. There is not significant difference between casual and fine-diners:
• About 60 cents less if the dish is presented as “Yellowtail Kingfish Carpaccio and Pomegranate, with frisée lettuce”.
• About 50 cents less if the dish is presented as “Cleanseas Hiramasa Yellowtail Kingfish with pickled cucumber and yuzu”.
• About 30 cents less if the dish is presented as “Grilled Yellowtail Kingfish on mashed potatoes with native parsley and lemon crust”.
Table 53: Willingness to pay for Yellowtail Kingfish menu variations
DishCasual
dining
Fine
diningTotal
Baseline: Yellowtail Kingfish with roasted capsicum and mashed potatoes $30$30$30
Yellowtail Kingfish Carpaccio and Pomegranate, with frisée lettuce –$0.60 –$0.20 –$0.40
Cleanseas Hiramasa Yellowtail Kingfish with pickled cucumber and yuzu –$0.70 –$0.30 –$0.50
Grilled Yellowtail Kingfish on mashed potatoes with native parsley and lemon crust –$0.70 $0.00 * –$0.30
We wanted to test the extent people would value more a slightly different recipe and then if the Cleanseas Hiramasa brand, with a corresponding Japanese method of preparation would add value to the dish, and finally if a different method of preparation would generate greater willingness to pay for such a meal.
People would pay slightly less whatever the other ways the dish was presented. This would most likely tend to indicate the low level of awareness for the fish species more so than the difference in alternatives per se.
When asking respondents which dishes they would consider ordering at a restaurant, we found that under half of each sub-sample would consider ordering these Yellowtail Kingfish dishes. The results are shown in the following table. The popularity of the baseline offering is shown in the first row, whereas the subsequent rows for each of the alternatives shows the incremental change in popularity from the baseline offering. The last row indicates the extent to which none of the offerings were chosen; a higher figure in the ‘none’ row indicates that all of the offerings are not very attractive.
Influences on Consumer Choices in Restaurants 105 Ehrenberg-Bass Institute—2010

Table 54: Selection of Yellowtail Kingfish dishes
DishCasual
dining
Fine
dining
Baseline: Yellowtail Kingfish with roasted capsicum and mashed potatoes 38% 41%
Yellowtail Kingfish Carpaccio and Pomegranate, with frisée lettuce –12 –13
Cleanseas Hiramasa Yellowtail Kingfish with pickled cucumber and yuzu –16 –19
Grilled Yellowtail Kingfish on mashed potatoes with native parsley and lemon crust +15 +10
None of these 29% 27%
The grilled fish option was the most popular item in both casual and fine-dining
As with the Trevalla, the Yellowtail Kingfish offerings were also not very popular, with about 30% (of both the casual and fine dining segments) not willing to buy any of the offerings. And the baseline offering, also has only about 40% of both segments willing to buy it. Furthermore, all of the alternatives yielded incremental decreases in the willingness to pay for the alternatives. So, none of the offerings appear to be very attractive to diners, which again could be due to a low familiarity with the species.
This was the only scenario in which the baseline offering was favoured by fine-diners more than by casual diners. This is likely because of the higher price for this dish ($30 vs $25 for the other main dishes) which could place it outside of the expected price level for a casual meal. But it could also perhaps be due to a slightly higher familiarity of the Yellowtail Kingfish species among fine diners.
The two unfamiliar preparation methods both had a quite strong negative appeal, decreasing the popularity by between –12 and –19 points; which is up to a halving of the popularity of the dish. Thus, the use of the Cleanseas Hiramasa brand added little attraction. Furthermore, unlike the other scenarios, the decrease in popularity was higher among the fine diners than among the casual diners.
As with the Fish and Chips scenario, the grilled option attracted the highest level of incremental appeal, pushing the popularity of the dish to above 50% overall.
Because willingness to pay for a Yellowtail Kingfish dish may change based on the willingness to purchase it, in the table below we present these figures for respondents who stated that they would purchase both the baseline situation
Influences on Consumer Choices in Restaurants 106 Ehrenberg-Bass Institute—2010

(Yellowtail Kingfish with roasted capsicum and mashed potatoes) and the Yellowtail Kingfish menu variation.
Table 55: Willingness to pay for Yellowtail Kingfish menu variations of those willing to purchase both the baseline situation and the menu variation
DishCasual
dining
Fine
diningTotal
Baseline: Yellowtail Kingfish with roasted capsicum and mashed potatoes $30$30$30
Yellowtail Kingfish Carpaccio and Pomegranate, with frisée lettuce +$0.12 +$0.56 +$0.36
Cleanseas Hiramasa Yellowtail Kingfish with pickled cucumber and yuzu +$0.12 +$1.02 +$0.58
Grilled Yellowtail Kingfish on mashed potatoes with native parsley and lemon crust –$0.18 +$0.60 +$0.22
People willing to purchase both the baseline situation and the menu variation would pay a greater price premium compared to the respondents not willing to purchase one of the options
Fine and casual diners who would purchase both the baseline situation and one of the menu variations would pay a price premium compared to the respondents not willing to purchase one of the variations. Fine diners willing to buy both the baseline situation and one of the menu variations would pay a greater price premium compared to casual diners.
Influences on Consumer Choices in Restaurants 107 Ehrenberg-Bass Institute—2010

Summary of findingsThese results indicate that it is possible for subtle differences between menu descriptions to have an effect on people’s choices in a restaurant situation. Wordings, descriptions, preparation methods, species, origin of ingredients and the accompaniments can all impact on diners’ choices.
• There is a fine-dining effect—in a fine-dining scenario, people generally expect to pay more for a given dish and to pay incrementally more for variations to the dish. In a fine-dining scenario, basic offerings are also generally less favoured than they are in a casual dining context. This implies that at a fine-dining restaurant, to some extent diners do expect to be and want to be ‘wowed’ by the meals on offer.
• Fine and casual diners who would purchase both the baseline situation and one of the menu variations would pay (in most cases) a greater price premium compared to the respondents not willing to purchase one of the variations. Fine diners willing to buy both the baseline situation and one of the menu variations would pay a greater price premium compared to casual diners.
• Specifying the region of origin (of seafood) can be of value to diners, but not universally so.
• A less familiar region of origin is less likely to be incrementally attractive to casual diners than it is to fine-diners. However, regions that are rather widely known for quality seafood are likely to have appeal across the board. This means that there is a pay off in the longer term to regional areas for building their ‘brands’. Though there will not necessarily be an immediate pay-off in the casual dining restaurants.
• However, the use of more expansive regions will have a broader appeal, so long as they are valued (e.g., Australian or even ‘Aussie’). Here, the value stems from the local versus imported product, which is of a universal appeal. Other state-based denominations are also likely to attract universal appeal. But once the region relies on specialised knowledge, or familiarity like ‘Spencer Gulf’ there is little further, incremental attraction amongst casual diners.
• Clearly, there are some species that are simply less favoured than others; the example here was ‘Hoki’. There is little that could be done if a restaurant was using an unpopular species or a species where the name itself is not favoured such as this; deliberately mis-labelling the species is obviously not an option. However, while species (and Country of Origin) labelling remain un-enforced in the food-service sector it would appear more profitable for restaurants to simply omit this potentially negative information and only provide it on demand to consumers who enquire.
• Specifying ‘grilling’ as the method of preparation for fish appears to be universally attractive to both the casual and fine-dining segments. Not only does it increase
Influences on Consumer Choices in Restaurants 108 Ehrenberg-Bass Institute—2010

the popularity of the dish, but it also commands a higher expected price. Offering an unpopular species through a grilled preparation might be one way of extracting a higher price and increasing its appeal, if it’s necessary to do so, instead of offering a different species.
• For Oysters (at least, but which would possibly likely extend to other shellfish) any embellishment over the mere “dozen oysters” appears to be valuable; not only increasing the popularity but also the expected price that a person is willing to pay. And the incremental willingness to pay is rather substantial—an average +20% in price for merely specifying (but also actually sourcing and providing) “freshly shucked” oysters. It appears that the diners’ need for risk reduction, of any level, when buying oysters from a restaurant is great and they are willing to pay for it. It may be the case that this need would extend to other shellfish as well. So, other adjectival descriptions that specify or connote freshness like “freshly caught”, “freshly shelled” or “caught today”10 are likely to also be well received.
• The use of native ingredients appears to have a muted effect, with there being an expectation of paying slightly more for meals with these ingredients. However, the attraction of the dishes drops off, likely in response to the higher expected price.
• Increasing the profitability of a meal is not as simple as just using a fancy (e.g., French) description or preparation method. While people’s price expectations for the meal are likely to increase, this brings with it a generally lower appeal. It could be that the more rich (i.e., heavy, fattening) sounding ingredients put some people off, or it could be that the higher price then restricts the dish’s appeal to some. Indeed, this fancifying approach is also likely to be somewhat off-putting to casual diners, who it seems tend to value more simple and straightforward meal descriptions.
• In a casual dining context, there also appears to be some value from specifying main ingredients in terms that suggest large size and hence value, like “jumbo”, although this needs further testing.
Influences on Consumer Choices in Restaurants 109 Ehrenberg-Bass Institute—2010
10 “Catch of the day” is not likely to attract much of a premium to diners, who probably no longer associate the term with being a marker of freshness, per se.

CONCLUSION
Objective 1
The first objective aimed to describe the Consumers’ restaurant experience at casual and fine-dining restaurants during the past 4 and 8 weeks respectively.
Specifically this section investigated:
• Consumers’ restaurant experience in the last 4 weeks, for people who visited a casual restaurant, and in the last 2 months for people who visited a fine-dining restaurant: number of casual and fine-dining restaurants visited; what was purchased and average expenditure for a meal; barriers preventing the increased consumption of fish and shellfish in casual and fine-dining restaurants.
• Where they consumed seafood during the last four weeks.
• Consumers’ perception of various menu items in each restaurant context (casual and fine-dining).
The key findings are outlined below:
• Generally, there is a very low percentage of restaurant patrons who are exclusively loyal to one establishment type (i.e. casual or fine-dining restaurant).
• Majority of casual-dining restaurant patrons had also visited a fine-dining restaurant (at least once) during the last 8 weeks.
• Casual-dining restaurant patrons spend an average of $22.50 on a fish dish in comparison to fine-dining restaurant patrons who spend an average of $27.00.
• Casual-dining restaurant patrons spend an average of $25.50 on a shellfish dish in comparison to fine-dining restaurant patrons who spend an average of $32.00.
• Regardless of the species both casual and fine-dining restaurant patrons are generally light buyers of seafood.
• Fine-dining patrons visited on average about twice a fine-dining restaurant during a 2 month-period. The chances for these clients to order seafood when visiting such a restaurant are low, less than 0.5 time out of these two visits.
• Prawns are the most frequently ordered seafood species at both casual and fine-dining restaurants.
• There is a clear distinction in relation to consumers’ perception of seafood and meat in a restaurant context.
Influences on Consumer Choices in Restaurants 110 Ehrenberg-Bass Institute—2010

• Consumers perceive seafood as being less versatile and considered to be a “special occasion food” in comparison to meat dishes.
• In comparison to meat, seafood is considered as being more healthy and lower in fat.
• There is no particular perceptual barrier that needs to be overcome to increase consumers’ consumption of seafood at casual and fine-dining restaurants.
• The proportion of respondents’ total seafood consumption increases slightly with respondents’ income level.
• Respondents with an undergraduate and/or postgraduate qualification consume a larger proportion of seafood at restaurants than other locations (i.e., at home, fish and chip outlets etc) and visit restaurants more frequently on average.
• Most seafood is consumed at home (about 47%) and then in a restaurant (33%). Fish and Chips outlets represent about 16% of the total seafood consumption in Australia. And only about 6.5% of seafood is finally consumed at a friends / relatives’ home.
Objective 2
The second objective was to explore the primary influencing factors that determine consumers' choice on restaurant menus, and the relative importance of (seafood) menu item attributes at the point of selection. Specifically, this objective investigated the factors that (most and least) influence consumers’ menu item choice in a restaurant context.
The key findings are outlined below:
• Both segments of consumers (casual and fine-dining) consider “the combination of ingredients” and ordering “a dish that I could not / would not want to prepare at home” as the most important attributes influencing menu item selection in a restaurant context.
• Both segments of consumers (casual and fine-dining) consider “the core ingredient of the dish is sustainably produced” to be the least important attribute influencing menu item selection in a restaurant context.
• The inclusion of “local produce” and “a dish representing a healthy option” were more important for fine-dining patrons than casual-dining restaurant patrons.
• The price of a dish and “the method of preparation” were considerd more important for casual-dining restaurant patrons than fine-dining restaurant patrons.
• The relative importance of menu item attributes is not significantly different between casual and fine-dining restaurant patrons.
Influences on Consumer Choices in Restaurants 111 Ehrenberg-Bass Institute—2010

• Many more attributes are considered important when selecting a seafood dish from a restaurant menu in comparison to the selection of a dish not containing seafood when dining-out at a restaurant.
Objective 3
Section 3 explored the factors that may affect or moderate consumers’ choice of (sea)food items from a restaurant menu according to a patron’s level of involvement and social context. These factors included:
• Consumers’ involvement with regards to food;
• The effect of social context on consumers’ choice of (sea)food items from a menu.
The key findings are outlined below:
• The relative importance of menu item attributes differ significantly among restaurant patrons with a low and high level of involvement with food.
• The main attributes that most strongly influence the menu item choices of consumers with a low level of food involvement are associated with the concept of value.
• Restaurant patrons with a high level of involvement with food place a greater emphasis on hedonic ‘pleasure-seeking’ and sensory evaluations stemming from the dining experience.
• A dish ‘representing a healthy option’ exerts a much greater influence on the menu item choice of consumers with a low level of involvement with food
• Contrary to much current anecdotal information, the reference to local and sustainable produce are relatively unimportant attributes influencing casual and fine-dining restaurant patrons menu item choices, whatever their involvement for food or the effect of the social context.
• Consumers who are rather highly influenced by the social context effect when dining at a restaurant do place greater importance on all attributes in the dining environment when selecting a menu item compared to consumers with a low social influence.
Influences on Consumer Choices in Restaurants 112 Ehrenberg-Bass Institute—2010

Objective 4
This section investigated consumers’ likely purchase behaviour with regards to prawns, and the likelihood of consumers ordering prawns in a restaurant context depending on various situations.
In the first instance, consumers were asked their likelihood of purchasing prawns in the next 4 weeks at a restaurant. Then, introducing various claims associated with the consumption of prawns, we sought to estimate the extent consumers would be less or more likely to purchase prawns compared to the base line situation.
The key findings are outlined below:
• Whatever the scenario, there was no significant difference in the responses provided between the casual and fine-dining restaurant contexts nor between prawns for an entrée and prawns for a main plate.
• The chances for casual and fine-dining patrons of ordering prawns at a restaurant in the next 4 weeks are about 1 chance out of 2 (score of 5 out of 10).
• Two situations would slightly increase the chances of ordering prawns: if there was a greater variety of dishes including prawns (new recipes / innovative way to have prawns in the dish) (score of 5.6); and if the prawns were local (score of 5.5).
• Knowing that the prawns are frozen on the boat (score 3.7) and knowing that prawns are imported (score of 3) would clearly decrease the chances of a consumer ordering prawns for an entrée in the next 4 weeks in a restaurant.
• Overall, females gave slightly higher scores to almost all questions (in general, females are more likely to order prawns at a restaurant).
• People in NSW have the highest likelihood of ordering prawns in a restaurant in the next 4 weeks and would also have the highest chance of ordering prawns whatever the scenario (except for Spencer Gulf prawns in SA).
• The older the respondent, the greater the likelihood of ordering prawns whatever the scenario.
Objective 5
The final objective sought to determine consumers’ (stated) willingness to pay for (sea)food dishes, taking into consideration various claims and descriptors that would typically generate a price premium for consumers in a restaurant context. The descriptors were chosen arbitrarily, through discussions with MISA and the Institute. The items were selected to represent a broad range of the types of menu item descriptions that are found on restaurant menus—from the simple addition of a
Influences on Consumer Choices in Restaurants 113 Ehrenberg-Bass Institute—2010

species name, up to a preparation described using fancy, French terms. Respondents were presented a baseline situation including a seafood dish that could be available in a restaurant as well as its price. Then, using various claims or descriptors for the dish, we asked consumers how much they would be willing to pay for the dish, and lastly, which one(s) they would consider ordering at a restaurant.
The key findings are outlined below:
• For a Fish and Chips (served with green salad) dish priced at $15, people would pay an extra price premium of $1.80 if the dish is presented as ‘Cooper’s beer battered fish and chips (served with green salad)’, and about $1.40 more if the dish is presented as ‘Grilled fish and baked potatoes (served with green salad and low fat sour cream)’.
• For a dish of “half a dozen of Oysters (served with lemon and vinaigrette)” priced at $10, people would pay a price premium of about $4.20 if the dish is presented as ‘Tasmanian Barilla Bay Oysters – Natural’, and of about $3.70 more if the dish is presented as ‘Coffin Bay Freshly shucked oysters (served with lemon juice and shallot vinaigrette)’. For ‘Freshly shucked oysters', the extra price premium is about $2.70.
• For a dish of “Garlic Prawns - main course” priced at $25, people would pay a price premium of about $1.40 more if the dish is presented as ‘Prawns from the Spencer Gulf with native garlic and sage’, and $1.10 more if the dish is presented as ‘Jumbo Prawns from the Spencer Gulf with garlic’.
• For a dish of “Blue Eye Trevalla with a julienne of vegetables” priced at $25, people would pay about $1.70 extra if the dish is presented as ‘Trevalla en papillotte served with potato dauphinoise and a beurre blanc sauce’, and about $1.30 more if the dish is presented as ‘South Australian line-caught blue eye trevalla on a bed of risotto’. If presented as ‘Fresh deep sea blue eye trevalla with a sauce of native green olive and vernaccia’, the price premium is about $1.20.
• For a dish of “Yellowtail Kingfish with roasted capsicum and mashed potatoes” priced at $25, people would pay very little more (only up to $0.60 cents) for any other descriptions that were suggested.
There is a fine-dining effect—in a fine-dining scenario, people generally expect to pay more for a given dish and to pay incrementally more for variations to the dish. In a fine-dining scenario, basic offerings are also generally less favoured than they are in a casual dining context. This implies that at a fine-dining restaurant, to some extent diners do expect to be and want to be ‘wowed’ by the meals on offer.
Fine and casual diners who would purchase both the baseline situation and one of
Influences on Consumer Choices in Restaurants 114 Ehrenberg-Bass Institute—2010

the menu variations would pay (in most cases) a greater price premium compared to the respondents not willing to purchase one of the variations. Fine diners willing to buy both the baseline situation and one of the menu variations would pay a greater price premium compared to casual diners.
Influences on Consumer Choices in Restaurants 115 Ehrenberg-Bass Institute—2010

APPENDIX 1: FOCUS GROUP TRANSCRIPTS
Casual-dining “Most places you go to you order a meal and that’s what you’ve got…but at the [Insert Restaurant Name], you can have whatever you want… you can have a little serve of everything and you have four or five assortments and it works out the same price as buying one meal, So there is a whole variety you can have for the same price as sitting down to one meal” 11:33-12:05
“A really good smorgasbord…really good. One thing I love, is a lamb shank… and when you sit down to one lamb shank after another for the same price, I love it”! 12:44-12:57
“The Indian spices are just beautiful, I love the lentils and rice and Dahl, its something I enjoy. The blend of Indian spices and the vegetables not cooked very…just right, sort of al dente vegetables, that always impresses me”. 14:30 – 14:56
From top-grade steak to fish and chips…so yeah, you could have anything you wanted, so that was quite good”. 16:05-16:10
“We got Tapas, they just had heaps of Tapas and that’s what they recommended. They recommended wines and stuff to go with your meals”. 16:38 – 16:45
“The meals were very cheap, considering it was such a fantastic restaurant, it was under $30.00”. 19:10 - 19:17
“Can I ask is the fish grilled or deep-fried”? 22:12 – 22:16
You can’t remove a sauce or something like that”? 22:21 – 22:28
I stopped going to one hotel because every time they serve Kangaroo it’s the same sauce and stuff 22:33 - 22:41
Menu Discussion
“ I like that it’s light and it’s quite healthy and I just really like the combination of Chicken, Salad and Parmesan cheese… So that’s something I always enjoy anyway” 25:32 - 25:44
Usually I don’t really like seafood, so it’s usually a steak or fish and chips. So I chose fish and chips, but then noticed it was actually Flake, so then I went for Steak…because I’d rather go for steak than eat shark” 25:50 -26:17
Influences on Consumer Choices in Restaurants 116 Ehrenberg-Bass Institute—2010

I picked the Smoked Salmon Tart [because] I do like Seafood, and that’s my source of protein I suppose being a vegetarian” 26:24 – 26:32
And I like the fact that it conjures up a taste… The Salmon, the salad, the herbs…everything just conjured up a really nice taste that I probably would enjoy”. 26:33 – 26:50
For the main course I chose fish but I couldn’t pick anything else really, because I couldn’t go for the Schnitzel, the burger or the squid and I wasn’t sure whether pasta of the day had meat in it, read meat in it or chicken… so that was the reason I picked fish and chips thinking I could have them grilled and make them a bit healthier” 26:52 – 27:16
27:23 – 27:29 “For the entrée I chose Cesar Salad because it’s healthy and I like salads
27:30 – 27:35 “For the mains I chose steak, because I don’t eat any meat”
27:45 – 27:55 “I’ve chosen the caesar salad, just coz I think it’s a great traditional dish…not too filling”
28:23 – 28:32 “I picked steak because I have always like porterhouse steak…I think it’s a nice cut of meat, obviously cooked well”
28:35 – 29:11 “I least preferred the squid because I catch it and eat it so often, that to me it’s massively overpriced for what it is…. I don’t dislike the dish, but to pay $18.90 for something I can catch is just insanity for me, you can get a steak for $20”!
29:15 – 29:30 “I chose the oysters for an entrée because I like seafood and I like oysters,
29:33 – 29:40 “I least preferred Bruschetta, because I believe it is easy to make and I can do it at home so why pay for it”?
29:42 – 30:00 ‘For the main I chose the squid because I haven’t had bad one yet and I’ve had steak that are too rare or overdone, it’s just an easy choice, easy to eat, they don’t really stuff it up”
30:01 – 30:15 “For the main, I least preferred the Schnitzel because it is easy to make at home and if you’ve got other choices [I’d] take them because Schnitzel’s just basic”
30:17 –30:28 "For the entrée I chose the Smoked Salmon mainly because the fish is always nice and fresh and you always get a good choice of salad that goes with it”
Influences on Consumer Choices in Restaurants 117 Ehrenberg-Bass Institute—2010

30:41 – 30:57 “Normally if you order a steak at a hotel it’s never the way you want it, you order it at half past and you don’t get it until the following hour because they take so long to cook it, it’s never right. Sometimes it’s like cooked boot leather or blood oozing out of it, so I usually just go with the fish”
30:59 – 31:10 “ I least preferred the fish because it is greasy and you usually get flake with it and that is a large eating fish”
31:33 – 31:42 “Another problem with a steaks is if you order steak and everybody else orders salads you’ve got to sit around waiting for 35 minutes to 45 for your steak to be done”
33:04 – 33:08 “I chose Oysters as my most preferred choice on the second menu (but not on the first) because I could have them Kilpatrick because I don’t like the raw”
33:09 - 33:22 I chose the Calamari, because I’ll pretty much try something different everywhere I go, unless there menu looks fairly unappealing, in which case I’ll default back to steak”
33:31 - 33:43 “I tried to combine my entrée and main course to suit each other and so I ended up having seriously seafood meals”
33:44 – 34:55 “I chose the Bruschetta mainly because it was the cheapest one and if I’m going to go out I don’t normally get entrees and mains”
35:03 – 35:12 “I chose the smoked salmon because it was the same price as everything else and it sounded really nice”
35:13 – 35:24 “My choice changed on the 2nd menu to calamari because it said local calamari and I don’t like the frozen ones that you get sometimes”
35:42 – 35:49 “I don’t look at price when I go out, if it looks like I might enjoy something, I’ll get it”
35:50 – 36:02“I chose the spring rolls, I don’t like bruschetta, oysters were natural…I prefer them Kilpatrick, Caesar salad we have at home, smoked salmon we have at home”
36:08 – 36:17 “On the other menu I chose Coffin Bay oysters Kilpatrick because I enjoy Kilpatrick oysters, always have”
36:54-37:01 “ I chose the local calamari because I enjoy the local stuff and it’ fresh”
Influences on Consumer Choices in Restaurants 118 Ehrenberg-Bass Institute—2010

39:01 – 39:15 “If I was taking out someone and I was paying, I would maybe go for something cheaper, but if they were paying I wouldn’t look at the price”
Herve’s Section
Any extra information?
39:30 – 39:41“In relation to the fish, I would like to know how it would be cooked” (Model)…the information would be important”
40:03 - 40:14 “I would like to know if things were variable, for example perhaps less chips and more salad”
Choice Process
41:29 – 41:33 “For me, I was looking for a healthy meal…some of them were too fatty for me”
41:38 – 41:48 “I wouldn’t normally have an entrée and a main course, but if I was having them, Id have to have something really tasty and delicious and that would go nicely with the next thing”
42:40 – 42:52 I think you come to a stage in your life where a little bit of something that is very tasty and a lot of something that is healthy for you is a really good balance in eating”
43:56 – 44:15 “I just order on personal choice of flavour and if something costs a bit more…I would still rather pay the extra $3 to get what I like or $4 or $5 then to buy something I sort of half want”
44:52 – 45:40 “The pricing was interesting…On the first menu, I didn’t look at prices, I just looked at the meal…The individual prices didn’t really make any impact on me, whereas the [fixed prices]…they’re kinder because they’re all clustered under a price [point], but it hit you more then seeing them individually…I was more interested in the food and to be honest with you I didn’t even see the prices”
46:10 – 46:50 “I look at the price…it is the first thing I look at on the menu, I guess because bruschetta was the cheapest, I probably picked it because it was the cheapest…I don’t normally go for the most expensive ones on the menu, so I probably didn’t even think of going for the steak because it was the most expensive probably”
48:05 – 48:26“ My choice of why I chose fish and chips as because it is quite a light meal and I also don’t cook it at home and I can’t cook it the way, however you get it in
Influences on Consumer Choices in Restaurants 119 Ehrenberg-Bass Institute—2010

a restaurant…So I don’t think I can cook it the same way. So it’s really a thing I only eat when I go out”
49:25 – 49:42 “When I go out I don’t drink umpteen glasses of wine…so what I’m spending [on food] I’m not going to drink”
What factors affect your food choice on the menu?
50:32-50:35 “What their signature dish is in the restaurant”
50:34-50:56 “How you’re feeling at the time…if it’s a special occasion you will dine differently…so that has a big bearing on it too”
50:57 – 51:10 “ One thing that is very important to me is the weather. I can’t stand having a steak or something really heavy on a hot day…I will have the salmon and fish & chips”
51:17 – 51:47 “ I don’t want something too heavy for lunch…for lunch I would order a lighter style meal and I would probably avoid the entree”
52:47 – 53:04 “ I would have a more substantial meal on a Saturday lunch or Sunday lunch with friends and a light dinner than I would mid-week…because I have to be on the go until the end of the day”
Meal Planning
54:15 – 54:36 “You’ve got to match [entrees and mains]…If you have seafood for an entrée you could still have a steak but maybe not seafood then chicken or something like that…keep it to a theme”
54:37 – 54:52 “ I couldn’t eat the smoked salmon and then have a beef burger for the main course…that’s so out of whack, I believe in matching to a certain extent…I think it’s quite important to match”
56:12 - 56:25“ I would go in [to a restaurant] and choose whatever made my taste buds water… I wouldn’t care whether it was the middle of the day or the end of the day”
Social Context
57:40 – 58:00 “The only thing that would effect me possibly if I was on a 45 minute lunch and everyone else has ordered fish & chips and you’ve ordered a steak…They’ve already gone back to work…S I’d probably order fish and chips as well as a courtesy thing”
Influences on Consumer Choices in Restaurants 120 Ehrenberg-Bass Institute—2010

58:45 - 59:02 “I always if I’m eating with my friends or my family, if they are ordering the same thing, I like to order something different so I can eat some of theirs and so I can get a bit of a different taste…but if I’m having it with work colleagues then I wouldn’t eat off there plate”
Prawns & Seafood
59:18 – 59:37 “There is only one place I’ll have prawns…because they are very nice prawns, one of the fish processors are 50 metres away and you get it straight from the processor…beautiful prawns. Other places steer clear”
59:40 – 59:44“ I avoid prawns because they are very high in cholesterol, I love them but I don’t eat them”
59:45 – 1:00:04 “I’ll only order them seasonally…I can tell where they come from. There’s a massive difference between something from the Spencer Gulf than something from the mekon delta”
1:00:16 – 1:00:21 “If you can see where it’s from…Locality is critical I think”
1:00:50 - 1:01:01“I love the taste, but I don’t know how much mercury is in them or where they’re from, so I’d resist. Because if they’re not healthy…”
Meat vs. seafood
101:29 – 101:33 “cut of the meat”
102:04 -102:50 “Definitely portion size…Size is very important to me with a steak, the cut, I’d rather pay $40 for 200g Wagyu sirloin than $29.95 for a 500g rump or a 600g T-bone…Quality not quantity”
102:56 – 103:01“grain-fed means the meat has not moved around, which means it’s high in fat”
Native seafood
103:53 -104:04 “olive oil is really beautiful…I like to have a nice brand of olive oil and dip the bread with the balsamic vinegar”
Frequency of visiting restaurants
106:57 – 107:03 “Convenience factor definitely, whereas if it’s myself and my wife, we’ll go to a nice restaurant and relax”
Dining Occasion
Influences on Consumer Choices in Restaurants 121 Ehrenberg-Bass Institute—2010

108:45 – 109:22 “Last night my family and I were celebrating my Birthday…So I ordered a banquet because it was convenient”
110:05 – 110:45 “The only thing that influences my order is if it is a certain function and I know the big boss is paying, I’m sure 99% of people that have been in that situation have ordered a top-shelf red, fillet mignon, a dozen oysters”
Food and wine
112:00 – 112:14 “The season plays a big part in what I drink…high summers definitely beer and crispy white wines and lately it’s just been good big reds and I’ll probably change in the next few months”
112:15 – 112-20 “It totally depends on the food for me, I could eat seafood in a big summer but I’m not going to have a bid red wine with it”
113:09 – 113:12 “I usually choose my drink first because I haven’t decided what I’m going to have to eat”
Variety vs. Habit
113:42 – 114:05 “I’ll try something different if it sounds good, otherwise I’ll just stay with what I know, just whatever sounds good I reckon, like the way the word it, just because of the way it sounded, if it sounded fresh”
114:06 – 114:14 “I’ll play it safe nearly every time…I’m a chicken, because there’s nothing worse than ordering meal and thinking I’ll have a crack and then you don’t like it”
115:09 – 115:30 “I think also when you’re sitting in a restaurant and you’re about to order or you’ve just had your drinks and you look across at what other people are eating…that’s when presentation comes into it…. you think that looks really nice, so being able to see it makes a big difference to me”
Recommendations
115:55 – 116:17 “I like to see it written…the more information the better”
116:34 – 116:43 “if everything else sounded good and there was just one thing there you didn’t understand…you would ask just to complete the picture you’re painting in your head”
Specials
Influences on Consumer Choices in Restaurants 122 Ehrenberg-Bass Institute—2010

117:13 – 117:19“ I don’t [consider specials] because I know quite often specials is often the stuff they want to clear out”
117:21 – 117:24 “[specials] would just be sitting there waiting to go”
117:37 - 117:47 “It is exciting to have a look at something different…. and seasonal…and consistency…and the quality
118:02 – 118:22 “I feel the reason why [restaurants] have specials is because they just like to introduce something…what I’ve noticed is something that was a special 6 months ago slowly filters into the main menu…so that might be a way of them testing out to see whether they should bring it into their main menu”
Sustainability
119:40 – 119:42 “It would influence it for sure”
119:43 – 120:00 “I think it [can influence choice] because if it’s a free-range thing it can increase circulation in the meat and you’re going to get the fat separated from the meat, rather than an animal that’s caged…that has some bearing”
Mood and emotions
121:47 – 121:55 “If I am very hungry, I would go for a steak…but if I’m not I would go for something smaller, like a salad”
122:38 –122: 45 “If I’m feeling really fat, I’ll go for a salad with no dressing”
Nutrition
122:32 – 122:36 “Definitely [would affect my choice] particularly with additives and preservatives”
123:59 –123:05 “If you know if it’s an organic salad, that nutritional information would make a huge difference”
Value for seafood
124:04 – 124:22 “You get Coorong mullet, it’s a fresh Coorong mullet, I’ll travel 8 miles because it tastes like its straight out of the water…fresh and local”
124:30 – 124:36“I think local for me too…local would mean fresh”
124:37 –124:44 “Not frozen or from Vietnam when you don’t know what’s in the water”
Influences on Consumer Choices in Restaurants 123 Ehrenberg-Bass Institute—2010

125:01 – 125:06 “I try and steer clear from any species coming in from overseas”
Regionality/Local
125:22 – 125:33 “I’ll pay more to get it [south Australian produce]”
126:29 – 126:31”I try and go local all the time”
Factors
Most important
127:38 – 127:44 “The information that is presented to you on the menu…how it’s explained”
127: 44 – 127:48 “What’s it served with”
127:48 – 128:06 ‘Flavour…[I could tell] if it’s the right information on the menu…I could tell you what the flavours going to be…If the correct information is there, I’ll know how it will taste”
128:13 – 128:18 “It’s got to have flavour and it’s got to have a vegetable content…something balanced”
128:23 – 128:38 “If somebody has been to a place and have said…I’ve had a really good meal…that can actually influence choice”
128:45 – 128:47 “Flavour but also price for me”
128:49 – 129:52 “What it sounds like on the menu”
Least important
129:01 – 129:02 “Price”
129:12 – 129:16 “Anything that sounded sort of fatty and not healthy for you”
130:08 – 130:15“I’d be more interested in the thing I’m going to eat than the place it’s at”
Influences on Consumer Choices in Restaurants 124 Ehrenberg-Bass Institute—2010

Fine-dining20:24 – 21:02 “On the first menu I went for prawns but on the second I went for oysters…I think what swayed me was the description, it was far more descriptive…I like the fact that it was local oysters, that swayed my opinion”
21:15 21:20 “I thought how does the entrée and the main work together”
21:27 – 22:01 “When I go out I’m a bit funny about the context…So if it’s prawns are they peeled…like oysters, who am I dining with and the context of it…So Snapper for me, things like was it a whole snapper…I didn’t have enough information there to make a decision”
22:16 – 22:33 “[I didn’t choose the vegetarian dish] because there was no meat]” and the Oysters…I like my Oysters cooked and I thought that they were probably going to be raw [So I didn’t choose them]. But my main consideration would have been the combination of flavours that was listed”
22:36 – 22:50“Being a diabetic one thing I look for on the menu is relatively healthy choices…so I tend to go for fairly simple foods”
23:33 – 24:18 “Mainly looking at the flavours that went with them and I tend to eat fish when I go out…because we try to cook it at home but it’s something I find a little tricky…[I changed my choice on the second menu because there was a bit more of a description…I couldn’t imagine [what that dish] would be like until it was described…and then it sounded much better…. The oysters were out for me because apple, parsley and sago wasn’t a particularly appealing combination”
25:25 – 25:33 “I guess the reason I chose this entrée is because the flavour is described...it looks and sounds very appealing”
25:25 – 26:12 “With the descriptions there it sounded like the ingredients I would like to put together myself…. I changed my choice on the second menu because I could see the description coming together as a dish, rather than just the random ingredients”
26:25 – 26:45 “I think the extra information [on the second menu] helped to confirm my decision. I didn’t choose the crab because I thought the combination of ingredients didn’t seem like a good fit”
27:20 – 27:24 “Telling you where it comes from and that it is likely produce is rather important”
28:45 – 28:51 “The cooking method would have affected my decision”
Influences on Consumer Choices in Restaurants 125 Ehrenberg-Bass Institute—2010

General Discussion
The role of the menu
29:09 – 29:30 “The ingredients and what goes with it and how it’s prepared and where it’s sourced from…If they’re a local [product] I’ll pick them”
29:34 – 29:47 “I think how you describe the dish makes a lot of difference…How well you describe and tell the ingredients…the more you describe the tastier it looks…the better chances of ordering it”
29:50 – 30:00 “The more indication of the size of the meals…so it’s more descriptive”
Choice Process
30:15 – 30:25 “If a restaurant’s known for something…like you go to an Italian restaurant, you’re more likely to get an Italian dish rather than trying something that they’re not necessarily known for”
31:00 - 31:26 I think that there are instances where you do select something where you don’t identify as a stereo-typical food when you go to a particular restaurant, just because it may have been prepared in some innovative way or with some particular combination that you haven’t tried before”
32:10 - 32:16“ When I go out I might order fish because I don’t like preparing fish at home”
33:20 – 33:25 “You could be persuaded by somebody else who has already picked what you want to order”
Factors
33:53 – 33:57 “How it is prepared and what it comes out with”
34:08 – 34:18 “ I think it could be how hungry you are as well…if you’re not hungry you have seafood, you think that’s a bit lighter”
34:48 – 35:03 “I don’t tend to choose things I would normally eat at home…I’ve got certain things I know I don’t like so I’ll exclude those, but I’ll think what’s the point of having pasta when we eat pasta at home”
37:00 – 37:08 “When going to a fine-dining restaurant your expectation is that the food will be well prepared”
What changes your mind about a menu item?
Influences on Consumer Choices in Restaurants 126 Ehrenberg-Bass Institute—2010
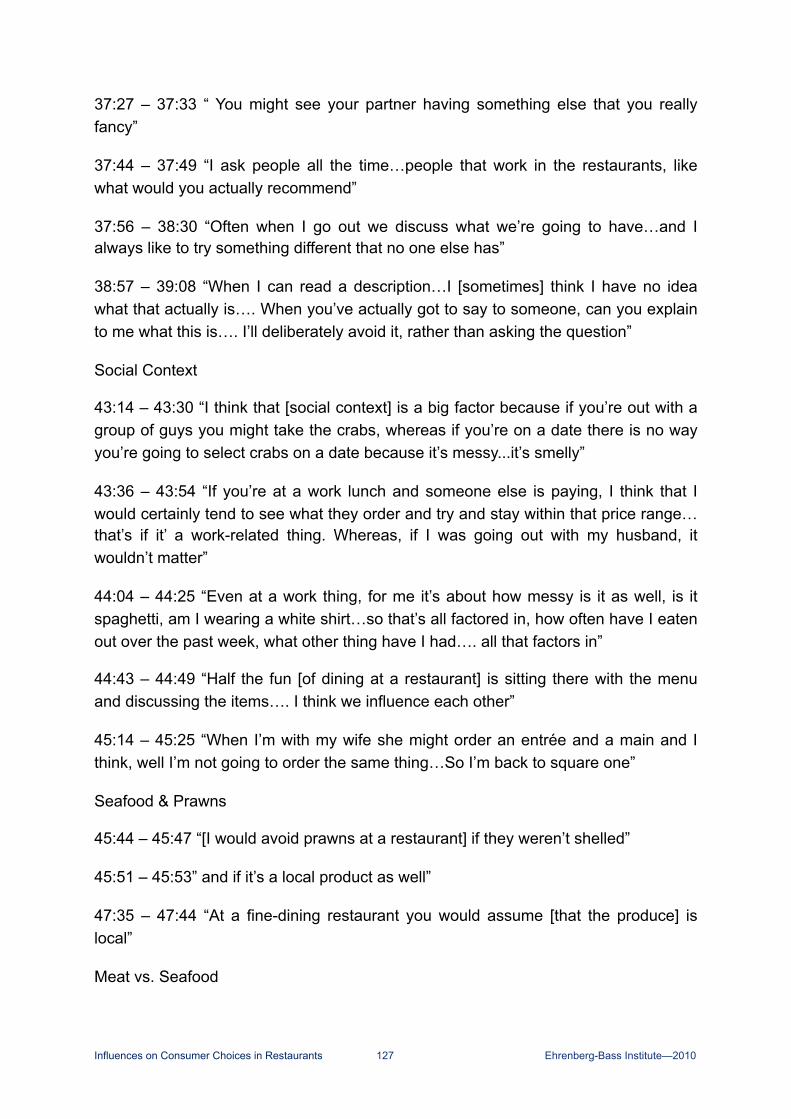
37:27 – 37:33 “ You might see your partner having something else that you really fancy”
37:44 – 37:49 “I ask people all the time…people that work in the restaurants, like what would you actually recommend”
37:56 – 38:30 “Often when I go out we discuss what we’re going to have…and I always like to try something different that no one else has”
38:57 – 39:08 “When I can read a description…I [sometimes] think I have no idea what that actually is…. When you’ve actually got to say to someone, can you explain to me what this is…. I’ll deliberately avoid it, rather than asking the question”
Social Context
43:14 – 43:30 “I think that [social context] is a big factor because if you’re out with a group of guys you might take the crabs, whereas if you’re on a date there is no way you’re going to select crabs on a date because it’s messy...it’s smelly”
43:36 – 43:54 “If you’re at a work lunch and someone else is paying, I think that I would certainly tend to see what they order and try and stay within that price range…that’s if it’ a work-related thing. Whereas, if I was going out with my husband, it wouldn’t matter”
44:04 – 44:25 “Even at a work thing, for me it’s about how messy is it as well, is it spaghetti, am I wearing a white shirt…so that’s all factored in, how often have I eaten out over the past week, what other thing have I had…. all that factors in”
44:43 – 44:49 “Half the fun [of dining at a restaurant] is sitting there with the menu and discussing the items…. I think we influence each other”
45:14 – 45:25 “When I’m with my wife she might order an entrée and a main and I think, well I’m not going to order the same thing…So I’m back to square one”
Seafood & Prawns
45:44 – 45:47 “[I would avoid prawns at a restaurant] if they weren’t shelled”
45:51 – 45:53” and if it’s a local product as well”
47:35 – 47:44 “At a fine-dining restaurant you would assume [that the produce] is local”
Meat vs. Seafood
Influences on Consumer Choices in Restaurants 127 Ehrenberg-Bass Institute—2010

48:44 – 49:03 “What day you’re dining…because if you’re selecting fish you want it to be a Friday, Saturday or Sunday for Fish, nothing later than that because you’d expect that they bought it on the Friday, so you don’t want to be buying fish on a Tuesday” 49: 14 – 49:22 “ I normally select a seafood dish for an entrée because it’s lighter…otherwise I can’t fit both in”
49: 31 – 49:38 “ [I use] the cut [to assess the quality of red meat]…the cut of meat is probably the first thing you’d look at”
Native Food
50:33 – 50:46 “You’ll try something different just for the sake of trying something different but you’ve go to be in that mood…There’s days where you’ll go in and think I’ll just try something totally different and there’s other day where you just want to stick to something that’s safe”
51:00 – 51:04, “It depends on how hungry you are…I would never experiment when I’m hungry”
51:20 – 51:30 “Generally, I’d prefer to stick to things I was familiar with and like, whereas I think sometimes the bush tucker foods can be a bit of a fad”
Other
52:16 - 52:39 “I find that with casual-dining there is not that much price difference at the end of the day from the fine-dining…A lot of the casual-dining have their prices pretty high up anyway, so I’d rather spend that little bit extra and have a really good meal than go somewhere and save $10 on it, but what’s $10 on an average meal…I might as well stay home and have a great meal”
Time of day
54:02 – 54:11“I think you want a lighter meal at lunch time…you don’t experiment as much”
54:23 – 54:35 “If I was only going out for lunch on a day, I would probably make that my big meal of the day, but if I was going out for lunch and dinner, I would always make lunch a lighter meal”
Occasion
55:37 – 55:51 “Only a work function would [change my choice]…Otherwise no other occasion would change it, it’s only if it’s work-related and that’s to do with who’s there”
Influences on Consumer Choices in Restaurants 128 Ehrenberg-Bass Institute—2010

55:55 - 56:00 “If we have a birthday or a special anniversary or something…We tend to lash out [on price] a little bit more than what we normally would”
Food and Wine
56:52 – 57:06 “I think if you were asked to choose the wine first, before you had a chance to look at the menu, then you’d probably try to match the meal more so with the wine, but if you look at a menu and have an idea of what you’re going to get you’d probably do it the other way around”
57:30 – 57:41 “Sometimes there might be a really excellent wine and you might match the other direction, but most of the time [it will be first the food]”
58:18 – 58:32 “It depends on whether you’re getting a glass of wine or bottle of wine to share…. If you’re getting a bottle of wine to share and it’s not necessarily one that stands out to you, I would be less inclined to match it with my meal”
Variety vs. Habit
59:30 – 59:32”I’d probably try something different”
100:36 – 100:50 “I’d rather not have too many surprises in a work setting, whereas with family and friends it’s a free-for-all”
Specials
101:18 – 101:24 “Maybe the junior chefs are cooking that meal…quite often that’s the case”
101:28 - 101:40 “I like specials, I always think perhaps they are more fresh because they are not on the general menu”
101:43 – 101:47 “Or it’s the ingredients they’ve been impressed with”
Sustainability
103:56 - 104:08 “I think we take a lot more notice of [sustainability issues] now than we ever used to, once upon a time it didn’t really matter where it came from, but we’re all pretty aware now, you support your state and you want to know where it’s come from and how its produced”
104:15 – 104:21 “I think you’ll do your recycling and everything else, but when it comes to food, it’s not going to make much of a difference, whether you pick this or that to the environment”
Influences on Consumer Choices in Restaurants 129 Ehrenberg-Bass Institute—2010

104:38 – 104:45 “Sometimes you will go to a chicken shop and pay $5 extra for a free-range chicken, but do you really know it’s organic”
106:15 – 106:20 “I do look at that when I make a decision
107:05 – 107:17 “If [organic] is written on the menu, I’ll trust it…If it says organic, I’ll take it as being organic and I would be more likely to choose that than if it didn’t say it was organic produce”
Mood and Emotions
108:30 - 108:58“Last week at the Kensington there was this kid who just kept banging a high-chair, and I was thinking, I had ordered the main to go dessert, but now dessert wasn’t even on the menu know…I just want to get out of there…So I guess the experience influences”
109: 35 – 109:45 “If I’m eating out for a special occasion and I’m not feeling 100%...It will effect me greatly, I will choose different things on the menu”
110:09 – 110:16 “you wouldn’t experiment so much [if you were in an unhappy mood], you’d go for something you know and safe”
Nutrition
111:48 – 11:57 “I think you kind of have an idea if you read something...I think you can tell that this is a lot healthier option than this”
112:26 –112:35 “You use words to put together what the meal is and from that you figure out whether it’s healthy”
112:50 – 112:54 “The more colour you use on the menu, it makes it look more healthier”
Returning to restaurants
113:29 – 113:31 “It’s got to be good value for money”
Value
115:28 – 115:54 “You’ve got to come away feeling like you’re relatively full…you often go to very expensive restaurants and it looks very fancy and two bites and it’s gone and it’s $40 or $50…I don’t call that value for money. I think you’ve got to come away feeling satisfied in many ways”
116:13- 116:19 “The quality and it should be of a sufficient quantity…but primarily the taste and the quantity of the food”
Influences on Consumer Choices in Restaurants 130 Ehrenberg-Bass Institute—2010

116:50 – 116:56 “I guess you know the intrinsic value of the produce”
Regionality
188:13 – 118:30 “I think it is becoming more important, it is with me… I do look at it and I like to support local industry, but if it was something you couldn’t get here and I really loved it, I would choose it”
118:31 – 118:46 “I think if the main thing of the meal…I would eat something from that region and would pick something that would accompany that region’s wine”
118:48 – 199:06 “In Adelaide I expect things to be Australian and I think it’s more of an authentication that this dish is really local…It is a good thing but it would really depend on whether I like that item as to whether I chose that”
119:20 - 199:41 “I put importance on local…especially seafood, other things I wouldn’t worry about so much, only because I think of it as being fresher and supporting local industry…Why do we need to go anywhere else to get them, I’m sure our products are just as good”
119:44 – 199:54 “Especially with seafood, you here about imported things having antibiotics etc…so that’s why you tend to steer clear of that…but otherwise what you’re ordering would come first”
120:28 – 120:38 “It does have importance, but I wouldn’t put it first, if I didn’t like the produce just because it’s Australian or South Australian, I wouldn’t choose it
120:39 – 120:55 “I think it’s got some importance, particularly with seafood more than other things”
Factors
121:30 – 122:00 “Looking at the whole combination of ingredients and imagining how it’s going to taste…the individual price is the least important”
122:02 – 122:37 “I think price would be the least important…If you’re going to a fine-dining restaurant you know it’s going to be expensive anyway...Most important is having a set of ingredients that you know you will like and will work together”
122:38 – 123:07 “I think the most important thing is choosing what you like and what you want to have and things on the menu, which I’ve had before and the leats important thing would be the price”
123:12 – 123:23 “The whole meal…the overall thing…the combination. The least important thing is the price”
Influences on Consumer Choices in Restaurants 131 Ehrenberg-Bass Institute—2010

123:25 – 123:46 “The least important thing is price…the most important this is what goes with it [the dish]…I think that’s important to have something a little extra on the side”
123:47 – 124:08 “I think the least important for me is price and the most important thing is the ambience of the restaurant…to me the food is secondary…it’s the ambience that makes the evening”
124:39 – 124:50 “The combination of flavours is the most important, I wouldn’t say price is the least [important] though, because if something was a lot higher on the menu I just wouldn’t consider it”
125:08 – 125:16 “The least important is price and most important is the ingredients and how they blend together”
125:17 – 125:23 “Taste, taste…who cares about the price”
125:58 – 126:18 “I’d want a better description, if I order the Snapper I want to make sure it’s not going to come out with a head on it…are the prawns peeled…is it filleted...the basic preparation”
126:25 – 126:41 “I want to know the preparation details so I can expect how tender, the texture and quality of the food when it comes on the plate and I also want to know where it comes from regionally, for the seafood in particular…I’d like to know that”
Influences on Consumer Choices in Restaurants 132 Ehrenberg-Bass Institute—2010

APPENDIX 2: BEST-WORST SCALINGFor the purpose of this study, a survey instrument was used to empirically test the relative importance of attributes that influence menu item choice. The survey design (included in Appendix 6) sought to identify the relative importance of attributes in relation to an individual’s level of food involvement, and the extent to which the presence of other people influence menu item selection in the context of a casual or fine-dining restaurant.
Best-Worst scaling (BWS) was used to measure the relative importance of the attributes underlying menu item selection. The BW method quantifies the attributes that influence consumer choice based on a ratio scale of measurement (Marley & Louviere 2005; Mueller & Rungie 2009). Respondents were required to evaluate 13 choice sets (each containing 4 attributes) according to the attribute that most and least influences their menu item choice at a casual or fine-dining restaurant. The attributes contained within each choice set were purposefully randomised using a balanced incomplete block design (BIBD), permitting estimates of the relative importance of each attribute to be obtained.
The utilisation of a BW design to measure consumer choice is advantageous, as the drawbacks associated with interval scaling (such as absolute differences between scale points) are effectively limited through greater discriminatory power (Cohen & Neira, 2003). Furthermore, the evaluation of preference as opposed to panel data (which only measures what was purchased) allowed the researcher to gauge the relative importance of attributes underpinning menu item selection (Goodman et al., 2005).
The final set of 13 attributes (outlined in table 5.1) was derived from the literature review, and the casual and fine-dining focus groups. Two measures for each of the 13 attributes were calculated; equal to the number of times each attribute was chosen as “best” and the number of times each attribute was chosen as “worst”. Thus, for both segments of restaurant patrons, the attribute that most and least influences menu item choice was identified.
Influences on Consumer Choices in Restaurants 133 Ehrenberg-Bass Institute—2010

APPENDIX 3: QUESTIONNAIRESection 1: Screening Questions600 having visited a fine-dining restaurant in the last 2 months
A fine-dining restaurant IS NOT:• Fast food (i.e., McDonalds, Food Court)• Where you have ordered take-away
A fine-dining restaurant IS:• Table cloth type of restaurant• Where a main plate is about $30-$50• Where you order food items from a (printed or blackboard) menu• Where you sit down to have the meal
Q1: Do you or does anyone in your immediate family work in any of the following industries?• Automotive• Media and Advertising• Marketing (exclude)• Education• Consulting• Hospitality (exclude)• Construction• Market Research (exclude)• Soft Drinks Manufacturer• None of the above
Q2: How old are you?• under 20 years (exclude)• 20-24 years• 25-34 years• 35-44 years• 45-54 years• 55-64 years• 60+ years (exclude)
Q3: Have you eaten at a fine-dining restaurant at least once within the last 2 months?
<<Yes>> continue<<No>> (exclude)
Q4: Have you eaten seafood at least once within the last 6 months?
<<Yes>> continue<<No>> (exclude)
Influences on Consumer Choices in Restaurants 134 Ehrenberg-Bass Institute—2010

Section 2: Your restaurant experience
Q1: How many times in the last 4 weeks have you visited a fine-dining restaurant?
Q2: How many times in the last 4 weeks have you consumed the following at a fine-dining restaurant?Prawn / oyster / scallop / lobster / calamari-squid / sardine / Fresh Salmon / Fresh Tuna / Snapper / Barramundi
Q3: How many times in the last 4 weeks have you visited a casual restaurant (a casual restaurant is where a main plate is about $15-$30, ordered from a menu, but not a fish and chips or food court outlet)?
Q4: How many times in the last 4 weeks have you consumed the following at a casual restaurant (a casual restaurant is where a main plate is about $15-$30, ordered from a menu, but not a fish and chips or food court outlet)?Prawn / oyster / scallop / lobster / calamari-squid / sardine / Fresh Salmon / Fresh Tuna / Snapper / Barramundi
Q5: How much would you usually spend for a Red Meat dish when dining at a fine-dining restaurant (for yourself and excluding beverages)?
Q6: How much would you usually spend for a White Meat dish when dining at a fine-dining restaurant (for yourself and excluding beverages)?
Q7 How much would you usually spend for a Shellfish dish when dining at a fine-dining restaurant (for yourself and excluding beverages)?
Q8: How much would you usually spend for a Fish dish when dining at a fine-dining restaurant (for yourself and excluding beverages)?
Q9: How much would you usually spend for a Vegetarian dish when dining at a fine-dining restaurant (for yourself and excluding beverages)?
Q10: Thinking over the last 4 weeks, of the number of meals that you have had at a fine-dining restaurant, how many 135were:
Red meat White meat Shellfish (prawns, oysters, etc) Fish Vegetarian
Q11: If 0% for Shellfish, what is the main reason that stopped you ordering shellfish?Allergic-health reasons / Vegetarian / Do not like shellfish / Too expensive / Influence of someone else in the table / No particular barrier / Poor availability of good quality shellfish / We are in a remote area / Don’t know
Influences on Consumer Choices in Restaurants 135 Ehrenberg-Bass Institute—2010

Q12: If 0% for Fish, what is the main reason that stopped you ordering fish?Allergic-health reasons / Vegetarian / Do not like fish / Too expensive / Influence of someone else in the table / No particular barrier / Poor availability of good quality fish / We are in a remote area / Don’t know
Q13: Would you say that you are eating more, or less shellfish at restaurant compared to 6 months ago?Eating more than 6 months ago / Eating less than 6 months ago / About the same / Don’t know
Q14: Would you say that you are eating more, or less fish at restaurant compared to 6 months ago?Eating more than 6 months ago / Eating less than 6 months ago / About the same / Don’t know
Q15: Thinking over the last 4 weeks, what proportion of the total seafood you have consumed was:
In your homeIn a restaurantIn / from a fish and chipsIn a friends / relative’s place
Q16: Thinking about food in fine-dining restaurant context, what food (from the following list), if any, do you associate with the provided statements? You can select as many or as few foods as you like.
Statement 1: generally rather expensiveFood list: beef, chicken, prawns, oysters, sardines, tuna, barramundi, fresh salmon
Statement 2: healthy to eatFood list: beef, chicken, prawns, oysters, sardines, tuna, barramundi, fresh salmon
Statement 3: tends to vary in qualityFood list: beef, chicken, prawns, oysters, sardines, tuna, barramundi, fresh salmon
Statement 4: good valueFood list: beef, chicken, prawns, oysters, sardines, tuna, barramundi, fresh salmon
Statement 5: naturalFood list: beef, chicken, prawns, oysters, sardines, tuna, barramundi, fresh salmon
Statement 6: low in fatFood list: beef, chicken, prawns, oysters, sardines, tuna, barramundi, fresh salmon
Statement 7: good for a light mealFood list: beef, chicken, prawns, oysters, sardines, tuna, barramundi, fresh salmon
Statement 8: good for a special occasionFood list: beef, chicken, prawns, oysters, sardines, tuna, barramundi, fresh salmon
Influences on Consumer Choices in Restaurants 136 Ehrenberg-Bass Institute—2010

Statement 9: good for a meal at the restaurantFood list: beef, chicken, prawns, oysters, sardines, tuna, barramundi, fresh salmon
Statement 10: boringFood list: beef, chicken, prawns, oysters, sardines, tuna, barramundi, fresh salmon
Statement 11: a luxury foodFood list: beef, chicken, prawns, oysters, sardines, tuna, barramundi, fresh salmon
Statement 12: widely availableFood list: beef, chicken, prawns, oysters, sardines, tuna, barramundi, fresh salmon
Statement 13: Always safe to eatFood list: beef, chicken, prawns, oysters, sardines, tuna, barramundi, fresh salmon
Influences on Consumer Choices in Restaurants 137 Ehrenberg-Bass Institute—2010

Section 3
Food involvement
• I don’t think much about food each day.Strongly Disagree
Disagree Disagree Somewhat
Undecided
Agree Somewhat
Agree Strongly Agree
• Cooking is not much fun.Strongly Disagree
Disagree Disagree Somewhat
Undecided
Agree Somewhat
Agree Strongly Agree
• Talking about what I ate or am going to eat is something I like to do.Strongly Disagree
Disagree Disagree Somewhat
Undecided
Agree Somewhat
Agree Strongly Agree
• Compared with other daily decisions, my food choices are not very important.Strongly Disagree
Disagree Disagree Somewhat
Undecided
Agree Somewhat
Agree Strongly Agree
• When I travel, one of the things I anticipate most is eating the food there.Strongly Disagree
Disagree Disagree Somewhat
Undecided
Agree Somewhat
Agree Strongly Agree
• I enjoy cooking for others and myself.Strongly Disagree
Disagree Disagree Somewhat
Undecided
Agree Somewhat
Agree Strongly Agree
• When I eat out, I don’t think or talk much about how the food tastes.Strongly Disagree
Disagree Disagree Somewhat
Undecided
Agree Somewhat
Agree Strongly Agree
Influences on Consumer Choices in Restaurants 138 Ehrenberg-Bass Institute—2010

• I do not like to mix or chop food.Strongly Disagree
Disagree Disagree Somewhat
Undecided
Agree Somewhat
Agree Strongly Agree
• I do most or all of my own food shopping.Strongly Disagree
Disagree Disagree Somewhat
Undecided
Agree Somewhat
Agree Strongly Agree
• I like shopping for food.Strongly Disagree
Disagree Disagree Somewhat
Undecided
Agree Somewhat
Agree Strongly Agree
Social context
• When I consider selecting a menu item I ask other people for advice.Strongly Disagree
Disagree Disagree Somewhat
Undecided
Agree Somewhat
Agree Strongly Agree
• I don’t need to talk to others before I select a menu item.Strongly Disagree
Disagree Disagree Somewhat
Undecided
Agree Somewhat
Agree Strongly Agree
• I rarely ask other people what menu item to select.Strongly Disagree
Disagree Disagree Somewhat
Undecided
Agree Somewhat
Agree Strongly Agree
• I like to get others’ opinions before I select a menu item.Strongly Disagree
Disagree Disagree Somewhat
Undecided
Agree Somewhat
Agree Strongly Agree
• I feel more comfortable selecting a menu item when I have obtained other people’s opinions on it.
Strongly Disagree
Disagree Disagree Somewhat
Undecided
Agree Somewhat
Agree Strongly Agree
Influences on Consumer Choices in Restaurants 139 Ehrenberg-Bass Institute—2010

• When choosing a menu item, other people’s opinions are not important to me. Strongly Disagree
Disagree Disagree Somewhat
Undecided
Agree Somewhat
Agree Strongly Agree
Decision making process
How strongly do you agree or disagree with the following statements:
• It takes me very little time to select a dish from the menu.Strongly Disagree
Disagree Disagree Somewhat
Undecided
Agree Somewhat
Agree Strongly Agree
• In most cases I will fully review all dishes available from the menu before making a decision.
Strongly Disagree
Disagree Disagree Somewhat
Undecided
Agree Somewhat
Agree Strongly Agree
• On most occasions, I order a dish that I have tried before.Strongly Disagree
Disagree Disagree Somewhat
Undecided
Agree Somewhat
Agree Strongly Agree
Influences on Consumer Choices in Restaurants 140 Ehrenberg-Bass Institute—2010

Section 4
The next section consists of 13 tables, each presenting 4 factors that might influence your choice at a fine-dining restaurant. We are looking for the one that influences most and the one that influences least your decision to choose a particular item from a menu in a fine-dining restaurant context.
The following questions may appear to be repetitive. However, each table presents a different combination of attributes we would like you to compare, based on the following situation:
Imagine that you are in a fine-dining restaurant for dinner with other people… What attribute would most and least influence your choice when selecting a dish from the menu?
(300 respondents with ‘when selecting a dish from the menu’ and 300 respondents with ‘when selecting a seafood dish from the menu’)
Least Table 1 Most11 1 The core ingredient of the dish is sustainably produced
(e.g. sustainable seafood, organic produce, free-range etc)
8 2 The combination of ingredients complements each other well
5 3 The method of preparation (e.g. choice of how dish is cooked, grilled, battered etc)
2 4 The price of the dish
Least Table 2 Most7 1 The accompaniments that come with the dish
(e.g. salad, chips, vegetables, sauces etc)1 2 A dish that features local produce6 3 A dish I’ve never tried before
(i.e. rarely consuming a similar dish on successive occasions)
5 4 The method of preparation (e.g. choice of how dish is cooked, grilled, battered etc)
Influences on Consumer Choices in Restaurants 141 Ehrenberg-Bass Institute—2010

Least Table 3 Most12 1 A dish that I could not/would not want to prepare at
home5 2 The method of preparation
(e.g. choice of how dish is cooked, grilled, battered etc)4 3 A dish representing a healthy option
(e.g. low in fat, nutritional content etc)10 4 A sufficient portion size that will satisfy my appetite
Least Table 4 Most5 1 The method of preparation
(e.g. choice of how dish is cooked, grilled, battered etc)13 2 Avoidance of certain foods
(e.g. Unfamiliar with the dish, allergies, messy to eat etc)
9 3 A dish that I have tried before and I know that I will like the taste
(i.e. a “safe” choice)3 4 The way a dish is written on the menu tempts my
palate
Least Table 5 Most4 1 A dish representing a healthy option
(e.g. low in fat, nutritional content etc)3 2 The way a dish is written on the menu tempts my
palate2 3 The price of the dish1 4 A dish that features local produce
Least Table 6 Most13 1 Avoidance of certain foods
(e.g. Unfamiliar with the dish, allergies, messy to eat etc)
2 2 The price of the dish10 3 A sufficient portion size that will satisfy my appetite7 4 The accompaniments that come with the dish
(e.g. salad, chips, vegetables, sauces etc)
Influences on Consumer Choices in Restaurants 142 Ehrenberg-Bass Institute—2010

Least Table 7 Most2 1 The price of the dish6 2 A dish I’ve never tried before
(i.e. rarely consuming a similar dish on successive occasions)
12 3 A dish that I could not/would not want to prepare at home
9 4 A dish that I have tried before and I know that I will like the taste
(i.e. a “safe” choice)
Least Table 8 Most1 1 A dish that features local produce
12 2 A dish that I could not/would not want to prepare at home
11 3 The core ingredient of the dish is sustainably produced (e.g. sustainable seafood, organic produce, free-range
etc)13 4 Avoidance of certain foods
(e.g. Unfamiliar with the dish, allergies, messy to eat etc)
Least Table 9 Most9 1 A dish that I have tried before and I know that I will like
the taste(i.e. a “safe” choice)
11 2 The core ingredient of the dish is sustainably produced (e.g. sustainable seafood, organic produce, free-range
etc)7 3 The accompaniments that come with the dish
(e.g. salad, chips, vegetables, sauces etc)4 4 A dish representing a healthy option
(e.g. low in fat, nutritional content etc)
Least Table 10 Most6 1 A dish I’ve never tried before
(i.e. rarely consuming a similar dish on successive occasions)
10 2 A sufficient portion size that will satisfy my appetite3 3 The way a dish is written on the menu tempts my
palate11 4 The core ingredient of the dish is sustainably produced
(e.g. sustainable seafood, organic produce, free-range etc)
Influences on Consumer Choices in Restaurants 143 Ehrenberg-Bass Institute—2010

Least Table 11 Most10 1 A sufficient portion size that will satisfy my appetite9 2 A dish that I have tried before and I know that I will like
the taste(i.e. a “safe” choice)
1 3 A dish that features local produce8 4 The accompaniments that come with the dish
(e.g. salad, chips, vegetables, sauces etc)
Least Table 12 Most3 1 The way a dish is written on the menu tempts my
palate7 2 The accompaniments that come with the dish
(e.g. salad, chips, vegetables, sauces etc)8 3 The combination of ingredients complements each
other well12 4 A dish that I could not/would not want to prepare at
home
Least Table 13 Most8 1 The combination of ingredients complements each
other well4 2 A dish representing a healthy option
(e.g. low in fat, nutritional content etc)13 3 Avoidance of certain foods
(e.g. Unfamiliar with the dish, allergies, messy to eat etc)
6 4 A dish I’ve never tried before (i.e. rarely consuming a similar dish on successive
occasions)
Influences on Consumer Choices in Restaurants 144 Ehrenberg-Bass Institute—2010

Section 5
We are interested in your future behaviour with regards to prawns, and how likely you will order prawns at the restaurant in the next 2 months (assuming you will visit a fine-dining restaurant in that period of time) depending on various situations.
We would like you to answer the following questions on a scale from 0 to 10.
If you are certain or practically certain that you will order prawns for the situation that is suggested, then you should choose the answer 10.
If you think that there is no chance or almost no chance, then the best answer would be 0.
If you are uncertain about the prospects, choose another number as close to 0 or 10 as you think it should be. You can think of the numbers as chances out of 10. For example, 3 would be 3 chances out of 10, while 7 would mean that there would be 7 chances out of 10 that you would order prawns at the restaurant in the next 2 months.
• What are the chances that you will order prawns for an entrée at a fine-dining restaurant in the next 2 months?
0 1 2 3 4 5 6 7 8 9 10
• What are the chances that you will order prawns for a main course at a fine-dining restaurant in the next 2 months?
•
0 1 2 3 4 5 6 7 8 9 10
•
• Now, what are the chances that you will order prawns at a fine-dining restaurant in the next 2 months if the prawns dish was prepared with native ingredients (bush tomato, lemon myrtle, saltbush, quandongs or muntries)?
0 1 2 3 4 5 6 7 8 9 10
• What are the chances that you will order prawns at a fine-dining restaurant in the next 2 months if you were told that the prawns the restaurant sources are harvested sustainably and MSC accredited?
0 1 2 3 4 5 6 7 8 9 10
• What are the chances that you will order prawns at a fine-dining restaurant in the next 2 months if you were told that the prawns of the dish were wild caught?
0 1 2 3 4 5 6 7 8 9 10
Influences on Consumer Choices in Restaurants 145 Ehrenberg-Bass Institute—2010

• What are the chances that you will order prawns at a fine-dining restaurant in the next 2 months if you were told that the prawns of the dish were farmed?
0 1 2 3 4 5 6 7 8 9 10
• What are the chances that you will order prawns at a fine-dining restaurant in the next 2 months if you were told the prawns are sourced from the Spencer Gulf Prawn Fisherman’s Association?
0 1 2 3 4 5 6 7 8 9 10
• What are the chances that you will order prawns at a fine-dining restaurant in the next 2 months if you were told that the prawns are local?
0 1 2 3 4 5 6 7 8 9 10
• What are the chances that you will order prawns at a fine-dining restaurant in the next 2 months if you were told that the Marine Stewardship Council accredits the prawns’ fisheries?
0 1 2 3 4 5 6 7 8 9 10
• What are the chances that you will order prawns at a fine-dining restaurant in the next 2 months if you were told that the prawns are imported?
0 1 2 3 4 5 6 7 8 9 10
• What are the chances that you will order prawns at a fine-dining restaurant in the next 2 months if you were told that the prawns are preservatives free?
0 1 2 3 4 5 6 7 8 9 10
• What are the chances that you will order prawns at a fine-dining restaurant in the next 2 months if you were presented with a greater variety of dishes including prawns (new recipes / innovative way to have prawns in the dish)?
0 1 2 3 4 5 6 7 8 9 10
• What are the chances that you will order prawns at a fine-dining restaurant in the next 2 months if you knew prawns had been frozen on the boat?
0 1 2 3 4 5 6 7 8 9 10
Influences on Consumer Choices in Restaurants 146 Ehrenberg-Bass Institute—2010

• What are the chances that you will order prawns at a fine-dining restaurant in the next 2 months if the prawns of the dish were already peeled and de-headed?
0 1 2 3 4 5 6 7 8 9 10
Influences on Consumer Choices in Restaurants 147 Ehrenberg-Bass Institute—2010

Section 6
We are interested in your behaviour with regards to various seafood dishes that can be available in any restaurant, and how likely you would order such dishes.
You will be first presented a seafood dish with its price. Then, other dishes will be introduced for which we’ll ask you how much you would pay for it in a restaurant.
Finally, we want to know which of these dishes you would order at the restaurant.
1. Fish and Chips
If you saw on the menu the dish “Fish and Chips (served with green salad)” priced at $15
What would you expect to see the following dishes priced at on the menu?• Cooper’s beer battered fish and chips (served with green salad): $• Grilled fish and baked potatoes (served with green salad and low fat sour cream):
$• Hoki and chips (served with green salad): $
Which of these dishes (if any) would you consider ordering at a restaurant (tick any that applies)?
2. Oysters
If you saw on the menu the dish “half a dozen of Oysters (served with lemon and vinaigrette)” priced at $10
What would you expect to see the following dishes priced at on the menu?• Freshly shucked oysters (served with lemon and vinaigrette)• Coffin Bay Freshly shucked oysters (served with lemon juice and shallot
vinaigrette)• Tasmanian Barilla Bay Oysters – Natural
Which of these dishes (if any) would you consider ordering at a restaurant (tick any that applies)?
3. Prawns
If you saw on the menu the dish “Garlic Prawns - main course” priced at $25
What would you expect to see the following dishes priced at on the menu?• Prawns from the Spencer Gulf with native garlic and sage: $ • Aussie Tiger Garlic Prawns: $
Influences on Consumer Choices in Restaurants 148 Ehrenberg-Bass Institute—2010

• Jumbo Prawns from the Spencer Gulf with garlic: $
Which of these dishes (if any) would you consider ordering at a casual restaurant (tick any that applies)?
4. Trevalla
If you saw on the menu the dish “Blue Eye Trevalla with a julienne of vegetables” priced at $25
What would you expect to see the following dishes priced at on the menu?• Trevalla en papillotte served with potato dauphinoise and a beurre blanc sauce: $ • Fresh deep sea blue eye trevalla with a sauce of native green olive and vernaccia:
$ • South Australian line caught blue eye trevalla on a bed of risotto: $
Which of these dishes (if any) would you consider ordering at a casual restaurant (tick any that applies)?
5. Kingfish
If you saw on the menu the dish “Yellowtail Kingfish with roasted capsicum and mashed potatoes” priced at $30
What would you expect to see the following dishes priced at on the menu?• Yellowtail Kingfish Carpaccio and Pomegranate, with frisée lettuce: $ • Cleanseas Hiramasa Yellowtail Kingfish with pickled cucumber and yuzu: $ • Grilled Yellowtail Kingfish on mashed potatoes with native parsley and lemon
crust: $
Which of these dishes (if any) would you consider ordering at a casual restaurant (tick any that applies)?
Influences on Consumer Choices in Restaurants 149 Ehrenberg-Bass Institute—2010

Section 7
Q1: Are you?
Male 1Female 2
Q2: What is your annual personal income before tax?
Less than $15,000 1$15,000 to $24,999 2$25,000 to $39,999 3$40,000 to $69,000 4$70,000 to $79,999 5$80,000 to $89,999 6$90,000 to $99,999 7$100,000 and more 8
Q3: Where do you live?
NSW 1NT 2Queensland 3SA 4Tasmania 5Victoria 6Canberra 7
Q4: Which of the following best describes your level of education?
Below year 12 1Year 12 2Undergraduate Degree 3Postgraduate Degree 4Other 5
THANKS FOR YOUR PARTICIPATION
Influences on Consumer Choices in Restaurants 150 Ehrenberg-Bass Institute—2010