Embed Size (px)
Citation preview

Australasian Journal of Educational Technology, 2016, 32(6).
1
What if learning analytics were based on learning science? Zahia Marzouk, Mladen Rakovic, Amna Liaqat, Jovita Vytasek, Donya Samadi, Jason Stewart-Alonso, Ilana Ram, Sonya Woloshen, Philip H. Winne, John C. Nesbit Simon Fraser University, Canada
Learning analytics are often formatted as visualisations developed from traced data collected as students study in online learning environments. Optimal analytics inform and motivate students’ decisions about adaptations that improve their learning. We observe that designs for learning often neglect theories and empirical findings in learning science that explain how students learn. We present six learning analytics that reflect what is known in six areas (we call them cases) of theory and research findings in the learning sciences: setting goals and monitoring progress, distributed practice, retrieval practice, prior knowledge for reading, comparative evaluation of writing, and collaborative learning. Our designs demonstrate learning analytics can be grounded in research on self-regulated learning and self-determination. We propose designs for learning analytics in general should guide students toward more effective self-regulated learning and promote motivation through perceptions of autonomy, competence, and relatedness.
Introduction Learning analytics are text reports and information visualisations that identify or summarise data about students’ learning activities. Using data often but not exclusively gathered in online environments, learning analytics are intended to help administrators, teachers, and students themselves improve learning. When students are the audience for learning analytics, ideal learning analytics would provide information they can use to productively self-regulate learning (Roll & Winne, 2015; Winne, in press). We strongly believe research on learning analytics will significantly stimulate and advance learning science, and more strongly link that work to advances in learning technologies. However, our reading about some learning analytics leads us to infer they were created because they could be – data were available and computational technologies could be applied to those data. We argue a more fruitful approach to designing learning analytics has three features. First, some learning analytics are based on coarse grained and distal proxies for specific tactical and strategic operations learners apply to build knowledge, develop fluency, and set a stage for transfer. Examples are the number of posts to a discussion forum or number of web pages visited. We posit that more fruitful learning analytics will offer specific tactical and strategic guidance for adapting operations in learning. Second, it appears to us that some learning analytics are solidly grounded in good sense. While this is a start, we recommend learning be much more tightly linked to productive theories and empirical findings in learning science. Third, because adapting learning often involves learners in what appears to them to be effortful gambles with what works well enough, we also hypothesise learning analytics should be developed to take account of learners’ motivation to change how they learn. We strive to illustrate these three components of learning analytics in this article. Self-regulated learning and motivation In self-regulated learning (SRL), learners metacognitively manage cognition, motivation, and behavior to improve their chances to reach learning goals (Winne, 2011). While relations of SRL to achievement are mixed (Dent & Koenka, 2015), there are signs it can be an important predictor of achievement (Zumbrunn, Tadlock, & Roberts, 2011). According to Winne and Hadwin’s (1998) SRL model, productively self-regulating learners adapt and regulate their cognition and motivation to better align with task demands, resources, and goals they set. Their model describes four phases. In phase 1, the learner develops an understanding of what the learning task entails, the task’s environmental affordances and constraints, and internal (cognitive, motivational) resources for working on the task. In phase 2, the learner constructs specific goals for learning and plans strategically how to achieve them. In phase 3, the learner executes the plan, monitors how it unfolds, and perhaps fine-tunes work during the task. In phase 4, the learner may plan major adaptations to learning strategies, her belief system and motivation, a process termed forward-reaching transfer by Salomon and Perkins (1989).

Australasian Journal of Educational Technology, 2016, 32(6).
2
Monitoring learning is a metacognitive process (Tobias & Everson, 2000) integral to SRL (Winne, 2001, 2011), that compares the current status of learning to standards that operationally define personally set goals. Learners form standards in the context of external task conditions, plus internal cognitive and motivational resources. When learners detect discrepancies relative to standards, they may consider an adaptation. Because learners tend to have selective and imperfect memories about how they studied (Schunk, Pintrich, & Meece, 2008; Winne, 2010), objective information offered just-in-time or just-in-case may facilitate SRL. Learning analytics can serve this function by mirroring learning processes with data grounded in those activities to show how learners engage with content and work within a digital learning environment (Winne & Baker, 2013). Learners’ knowledge of cognitive and metacognitive strategies must couple with motivation to enhance their achievement (Pintrich, 1988, 1989). A learner may be aware and capable of effective adaptive strategies but not motivated to apply them. In this light, Winne and Baker (2013) argued there is an essential relationship between SRL, metacognition, and motivation. They described SRL as a “behavioral expression of metacognitively guided motivation” (p.3). One example where SRL, metacognition, and motivation intertwine is setting goals. Goals reflect motives to initiate, persist, or change a behavior, and learners exercise metacognition when strategising how to proceed toward the goal. A challenge facing designers of learning analytics is how to guide learners to adapt learning processes without undermining intrinsic motivation to act strategically and independently (Behrens & DiCerbo, 2014; Wise, 2014). In this article, we tackle this challenge using the widely researched self-determination theory (SDT) as a framework for designing analytics. Deci and Ryan (1980) describe SDT as a macrotheory of human motivation that focuses on types and qualities of motivation rather than just amount (Deci & Ryan, 2008). SDT is a powerful heuristic that organises and explains motivation with few theoretical principles across many contexts and domains (Deci & Ryan, 2008; Vallerand, Koestner, & Pelletier, 2008). SDT explains that motivation is optimal when behavior is spurred by tasks that afford well-being, creative problem solving, learning, understanding, or mastery; and when basic psychological needs of autonomy, competence, and relatedness are met (Deci & Ryan, 2008). Central to SDT is a distinction between autonomous and controlled motivation. Autonomous motivation, where choices originate with the learner, is ideal. But controlled motivation that originates from authority can be shaped to promote autonomy by framing goals using non-controlling language (Vansteenkiste, Lens, & Deci, 2006) or, for uninteresting tasks, providing a rationale that helps learners appreciate the value of the task (Jang, 2008). How learning analytics can motivate self-regulated learning We adopt SDT as one framework for designing learning analytics that promote SRL as a function of content studied (what), reasons to adapt learning processes (why), and the presentation of analytics (how). To support data-informed decision making, we argue students need a sense of the quality of their actions, strategies, goals, progress towards goals, and more broadly, ability to self-regulate (Roll, Wiese, Long, Aleven, & Koedinger, 2014). Simply mirroring activity data is not enough. In this article we explore what learning analytics might look like when they are designed with reference to learning science research. Specifically, we propose ways to support planning and self-monitoring of learning tactics and strategies that, according to learning sciences research, are predicted to benefit students. We organise our presentation as cases. Each deals with a widely-researched cognitive process or instructional need. Within each case, we introduce relevant theory and propose designs for one or a few learning analytics that align with the theory and empirical findings. Each analytic is based on fine-grained learner data collected by nStudy (http://www.sfu.ca/edpsychlab/nstudy.html), a browser extension developed in our lab that we designed to gather data for learning science and learning analytics, and to support more effective learning. When they study using nStudy, learners can perform everyday studying activities such as creating quotes, annotating text, and tagging content. Throughout their studying session, nStudy collects extensive, time-stamped, fine-grained data as the student clicks, marks, creates, reviews, shares, and edits content (Winne et al., 2016). We are currently considering each of the learning analytics described here as an addition to nStudy.

Australasian Journal of Educational Technology, 2016, 32(6).
3
Case 1. Setting goals and monitoring progress Theoretical background When studying before an exam, learners may be overwhelmed by the volume of content and a lack confidence about their mastery of material. If they choose inappropriate standards to monitor progress, they may procrastinate, leaving studying to one, ineffective session of massed practice, or they may haphazardly access information. We propose templates students can use to set goals that help them plan and manage study by applying effective learning strategies to alleviate their concerns and set up learning analytics they can use to study more effectively. According to Locke, Shaw, Saari, and Latham (1981), a goal refers to “attaining a specific standard of proficiency on a task, usually within a specified time limit” (p. 5). Goals describe a level of difficulty or quality for proficiency. Locke et al. explained that goals determine task performance by directing attention and action, motivating effort, helping learners persist, and fostering cognitive and metacognitive engagement. These researchers found that learners who set goals had higher academic achievement. Learners learn more when they set goals and monitor gaps between performance and goals (Lee, Choi, & Kim, 2013). Theory also links setting goals to productive SRL (Nicol & Macfarlane-Dick, 2006; Winne, 1995; Zimmerman, 2008) that modulates learning processes, including reflecting and evaluating (Nicol & Macfarlane-Dick, 2006). These authors recommend providing learners with structured opportunities to self-monitor, reflect, and evaluate progress to close the cycle between setting goals, adapting learning, and improving achievement. Analytic 1: Goal setting Learners can use nStudy’s goal templates to plan studying. In Figure 1, they set a goal for the number of articles to study before a due date and choose topics for learning analytics about their study sessions: “Highlight key terms,” “Classify ideas using tags,” and “Create notes using key terms in the article.” Each goal has a tag, for example, “Studying Goal 1,” associated with articles learners study for the goal, allowing nStudy to match articles to goals.
Figure 1. Goal setting template Learners then study articles and create quotes, terms, and notes. nStudy’s activity log traces learners’ efforts and profiles their work in relation to the goal they set. Figure 2 shows the learner set a goal to study five articles. Her learning activities are mirrored relative to her goal. She opened four of these five articles. Trace data is generated as she operated on content in three of these four articles by creating quotes (highlighting text that also copies that text into nStudy’s sidebar for an article). In the first article, she highlighted 15 of 20 key terms identified by her instructor and applied three tags to classify ideas: four quotes were tagged important, six were tagged helpful, and three were tagged for test. She made five notes. Eight terms highlighted in the three articles were used within the text of her notes. She used two terms in notes that she did not highlight in the text.

Australasian Journal of Educational Technology, 2016, 32(6).
4
Figure 2. A learning analytic supporting a study goal SDT (Deci & Ryan, 1980; Vansteenkiste et al., 2006) offers a framework for justifying elements displayed in this learning analytic with respect to three psychological factors: autonomy, competence, and relatedness. The learning analytic in Figure 2 supports autonomy as it mirrors the learner’s chosen goal. This allows for identified-regulation, especially if the learner has opportunity to understand the reasons for externally set goals and consider why those goals can be personally important (Deci & Ryan, 2008; Jang, 2008). The analytics may promote a sense of competence as they visualise progress in articles opened and present measures of engaging with content fully under the learner’s control (autonomy). The display of ipsative (within-person) comparison rather than normative (between-person) comparison is intended to preserve the learner’s sense of relatedness. According to Winne and Hadwin’s (1998) model of SRL, productively self-regulating learners need information about how they studied and effects of those processes. This analytic is predicted to be useful for learners who set goals using the nStudy template, view their trace data, and compare their performance when goals were set to performance when goals were not set. Case 2. Distributed practice Theoretical background Students with upcoming exams and deadlines make decisions regarding the scheduling, duration, and location of study sessions. Students often believe massed practice, which involves studying most material during a last-minute cramming session right before an exam, benefits learning and achievement (Kornell & Bjork, 2008). This is a misconception. Spacing learning and review sessions across regular intervals improves retention (e.g., Cepeda, Pashler, Vul, Wixted, & Rohrer, 2006; Schmidt & Bjork, 1992) and induction (e.g., Kornell & Bjork, 2008; Kornell, Castel, Eich, & Bjork, 2010). This robust phenomenon is the spacing effect, and it has become a commonly suggested study strategy (Dunlosky, Rawson, Marsh, Nathan, & Willingham, 2013). In two recent meta-analyses, distributed practice was associated with moderate positive effect sizes for recall of verbal information (Donovan & Radosevich, 1999; Janiszewski, Noel, & Sawyer, 2003). The challenge is encouraging students to distribute practice (Kornell & Bjork, 2008). Analytics based on nStudy’s trace data create opportunities to improve self-monitoring and correct inaccurate recollections about studying (Winne & Jamieson-Noel, 2003). To encourage distributed practice, we propose analytics addressing the challenges learners face in monitoring and that encourage spaced review.
Australasian Journal of Educational Technology, 2016, 32(6).
5
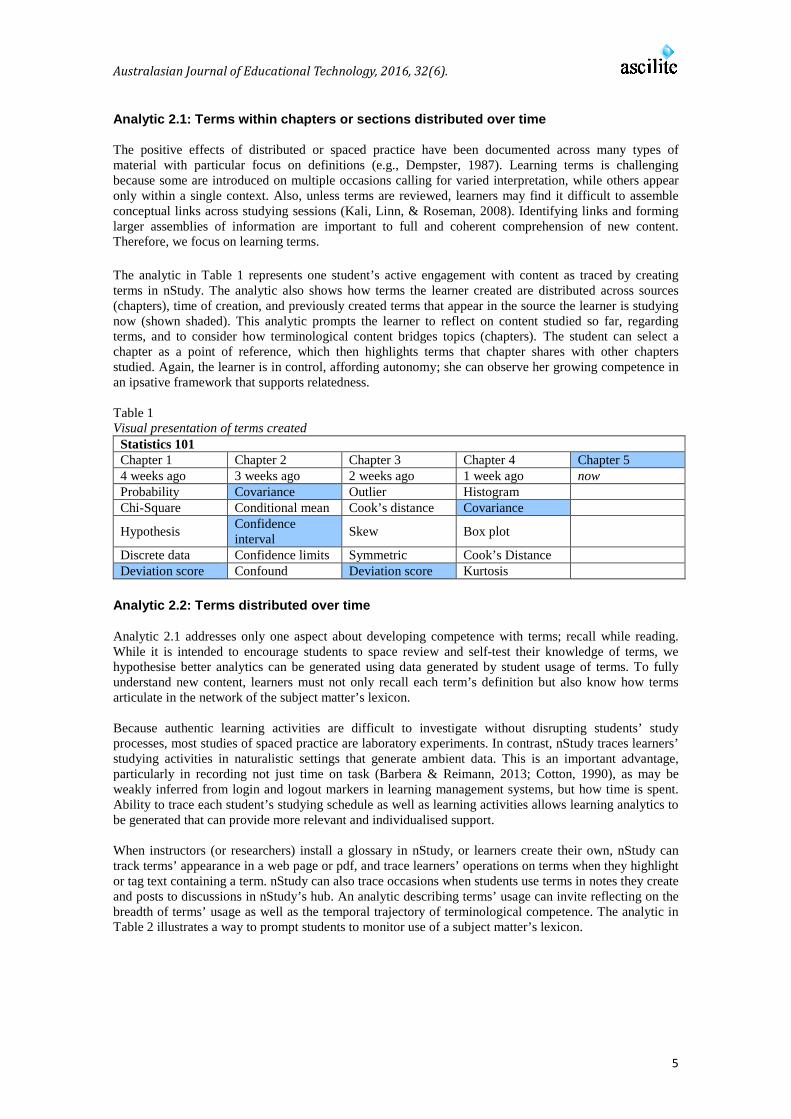
Analytic 2.1: Terms within chapters or sections distributed over time The positive effects of distributed or spaced practice have been documented across many types of material with particular focus on definitions (e.g., Dempster, 1987). Learning terms is challenging because some are introduced on multiple occasions calling for varied interpretation, while others appear only within a single context. Also, unless terms are reviewed, learners may find it difficult to assemble conceptual links across studying sessions (Kali, Linn, & Roseman, 2008). Identifying links and forming larger assemblies of information are important to full and coherent comprehension of new content. Therefore, we focus on learning terms. The analytic in Table 1 represents one student’s active engagement with content as traced by creating terms in nStudy. The analytic also shows how terms the learner created are distributed across sources (chapters), time of creation, and previously created terms that appear in the source the learner is studying now (shown shaded). This analytic prompts the learner to reflect on content studied so far, regarding terms, and to consider how terminological content bridges topics (chapters). The student can select a chapter as a point of reference, which then highlights terms that chapter shares with other chapters studied. Again, the learner is in control, affording autonomy; she can observe her growing competence in an ipsative framework that supports relatedness. Table 1 Visual presentation of terms created
Statistics 101 Chapter 1 Chapter 2 Chapter 3 Chapter 4 Chapter 5 4 weeks ago 3 weeks ago 2 weeks ago 1 week ago now Probability Covariance Outlier Histogram Chi-Square Conditional mean Cook’s distance Covariance
Hypothesis Confidence interval Skew Box plot
Discrete data Confidence limits Symmetric Cook’s Distance Deviation score Confound Deviation score Kurtosis
Analytic 2.2: Terms distributed over time Analytic 2.1 addresses only one aspect about developing competence with terms; recall while reading. While it is intended to encourage students to space review and self-test their knowledge of terms, we hypothesise better analytics can be generated using data generated by student usage of terms. To fully understand new content, learners must not only recall each term’s definition but also know how terms articulate in the network of the subject matter’s lexicon. Because authentic learning activities are difficult to investigate without disrupting students’ study processes, most studies of spaced practice are laboratory experiments. In contrast, nStudy traces learners’ studying activities in naturalistic settings that generate ambient data. This is an important advantage, particularly in recording not just time on task (Barbera & Reimann, 2013; Cotton, 1990), as may be weakly inferred from login and logout markers in learning management systems, but how time is spent. Ability to trace each student’s studying schedule as well as learning activities allows learning analytics to be generated that can provide more relevant and individualised support. When instructors (or researchers) install a glossary in nStudy, or learners create their own, nStudy can track terms’ appearance in a web page or pdf, and trace learners’ operations on terms when they highlight or tag text containing a term. nStudy can also trace occasions when students use terms in notes they create and posts to discussions in nStudy’s hub. An analytic describing terms’ usage can invite reflecting on the breadth of terms’ usage as well as the temporal trajectory of terminological competence. The analytic in Table 2 illustrates a way to prompt students to monitor use of a subject matter’s lexicon.

Australasian Journal of Educational Technology, 2016, 32(6).
6
Table 2 Term creation over time across contexts
Usage Map Terms Discussion 1 Discussion 2 Discussion 3 Histogram • • Type I error • Cook’s distance Conditional mean •
Analytic 2.3: Notifications of activity nStudy can also provide feedback statements to students via nStudy’s hub. The analytics in Figure 3 show an example of feedback on studying activities. Such notifications can prompt monitoring and self-regulation, inviting students to plan future study activities. An instructor (or researcher) can configure durations, artifacts referred to, delivery criteria, and other elements to address particular facets of metacognition. This artifact may be particularly useful for exploring the application of different models of distributed review time by prompting learners at different predetermined intervals or about different elements of their activity (e.g., Cepeda, Vul, Rohrer, Wixted, & Rohrer, 2008).
Figure 3. Sample feedback notifications Analytic 2.4: Scheduling optimal review times Along with ambient time-stamped trace data that nStudy gathers about studying au naturel, data about exam scores and information available from other systems (e.g., registrar, library) could be mined for patterns that offer a broader view of learners and their approaches to studying. Mining for patterns that characterise students at various levels of success within this larger pool of data can support tailoring analytics to individuals based on a homogeneous group of peers rather than a heterogeneous population or randomly differing people (Winne, in press). As an example, consider the empirical finding that, up to a point, increasing space between studying episodes improves performance for an average learner; beyond an average optimal interval between study sessions, performance declines for that average learner (Cepeda et al., 2008). As well, several studies show that repeatedly reviewing for brief periods leads to better recall compared to one review session where studying the same terms is massed. This finding holds even if the overall duration of studying remains the same (as reviewed by Cepeda et al., 2006; see Delaney, Verkoeijen, & Spirgel, 2010; Donovan & Radosevich, 1999; Janiszewski et al., 2003). With trace data, nStudy could individualise this

Australasian Journal of Educational Technology, 2016, 32(6).
7
model, beginning with a model based on a homogeneous set of peers as a first approximation, then tailoring parameter values based on the individual student’s data. Using this seed-and-tailor method, the analytic we propose in Table 3 is designed to support a particular learner in scheduling how she learns terms by using them as she studies, and reviewing definitions. Input to this analytic are first, dates of exams in which a particular term is tested (“Describe the confidence interval and its interpretation.”) and second, traces that track over time which terms she uses in notes and discussions she has with peers in nStudy’s hub. We explicitly invite the learner to exercise control by allowing reviews of a term by clicking them and reminders of upcoming scheduled review time and the content to be covered, as demonstrated in Figure 4. Collecting these data could enable teachers and students to explore patterns of metacognitive awareness about knowledge. Students reserve agency, as SDT recommends. The analytic also addresses making analytics actionable for learners (Clow, 2013) with options grounded in learning science and ipsative data. A more sophisticated analytic might explore whether type of review – re-viewing a term’s definition versus using a term in a discussion or note – can better tailor the schedule for review. Table 3 Scheduled review summary
Term (✓ to show) Create Date Use Pattern Score covariance 2016 Sep 20 - - - - - - - - - - - - - - - exam 100% Cook’s distance 2016 Sep 27 - - - - - - - - - - - - - - - - - - exam 60% outlier 2016 Oct 04 - - - - - - - - - - - - - - exam 90% skew 2016 Oct 11 - - - - - - - - - - - - - - - - - exam 50% confidence interval 2016 Oct 18 - - - - - - - - - - - - - - - exam 90%
Figure 4. Sample notification for review Case 3. Retrieval practice Theoretical background When learners judge their knowledge of a recently studied term without explicitly trying to recall it, they commonly overestimate what they know (Dunlosky & Nelson, 1994; Vesonder & Voss, 1985). Actually trying to recall, also called retrieval practice, improves learning and slows the rate of forgetting (Carpenter, Pashler, Wixted, & Vul, 2008; Roediger & Karpicke, 2006). Introducing retrieval practice (or self-testing) not only can enhance meaning (Karpicke & Roediger, 2006), it also may improve the accuracy of metacognitive judgments learners make about what they know. When students create a term in nStudy, they use a stock template to identify the term and its definition (Figure 6). This is the first learning episode. After the term is created, there is opportunity for an initial occasion of retrieval practice. This is most effective when attempted soon after the initial learning (Landauer & Bjork, 1978). Using nStudy, the student can decide when to access each term and decide whether to engage in retrieval practice (self-testing). It is in this subsequent and flexible scheduling of retrieval practice when support for SRL becomes important. Both equal-interval delays between retrieval practice sessions as well as expanding schedules of retrieval practice (where each retrieval attempt occurs after a longer time interval than the previous one) can

Australasian Journal of Educational Technology, 2016, 32(6).
8
benefit long-term retention depending on the exam date (Roediger & Butler, 2011). Beyond the benefit of feedback, practicing retrieval of definitions boosts retention more than re-reading and highlighting source material (Roediger & Butler, 2011). Analytic 3.1: Retrieval practice and judgment of knowledge While most research has compared static schedules of retrieval practice in a lab, students using nStudy can generate data in an authentic context where, as an active agent, the student decides when to practice retrieval. Based on the learner’s prior activity and self-selected schedule, nStudy can offer reminders. For example, if a term has not been selected for retrieval practice in over two months, and the final exam is in 2 weeks, nStudy can recommend the term for review. The analytic for retrieval practice is based on a template that prompts metacognitive monitoring. After a term is created, nStudy can present a blank field for the learner to recall the term’s definition (Figure 5). Additionally, the learner is invited to provide a confidence judgment. After entering the best recollection of the term’s definition, the correct definition is presented (Figure 6).
Figure 5. A blank term retrieval template for the term “Metacognition”
Figure 6. The student opts to judge knowledge of the term and recall its definition. The correct definition then appears on the right. This template benefits learning in several ways. First, the learner is invited to practice retrieval and metacognitively judge learning. As students log in to nStudy on different days in different settings, they encounter terms across different studying conditions. Variety in study context improves encoding of the term’s definition (Smith, Glenberg, & Bjork, 1978).

Australasian Journal of Educational Technology, 2016, 32(6).
9
Showing the learner when they last opened or interacted with a particular term may prompt plans for scheduling reviews that enhance learning. As well, when nStudy displays the definition, the learner can compare their judgment of learning to performance. Displaying a pattern of under- or over-confidence can prompt the learner to reconsider metacognitive standards used in confidence judgments about learning. This learning analytic may also prompt learners to adapt strategies for learning if they observe consistent over- or under-confidence. These same data are available to researchers investigating schedules of retrieval practice and adaptations learners make to studying. Analytics must be used to be beneficial. If a student does not explore options for retrieval practice of terms, nStudy or an instructor might intervene. But, in accord with SDT, when students are asked to judge confidence and have options to adapt schedules of retrieval practice, they behave in an autonomous fashion. Information about how retrieval practice relates to both judgments of learning and accuracy of recall fuel their SRL. Case 4. Prior knowledge for reading Theoretical background Learners’ domain-specific knowledge affects reading, comprehension and retention (Shapiro, 2004) as they strive to build a mental model of information presented in text (Kintsch, 1988). When learners lack domain-specific knowledge, they will have difficulty remembering (e.g. Bransford & Johnson, 1972). The theory of cognitive attentional capacity suggests one reason why this is so: Attentional capacity is limited (Kahneman, 1973). When learners pause to parse obscure text or look up a word’s meaning, cognitive resources shift away from comprehension. Since learners have different levels of domain knowledge, fixed recommendations about which articles will most benefit learning are likely appropriate only for some learners. To meet individual needs, we propose an analytic about reading material that adapts to the learner’s specific domain knowledge to provide a recommendation for sequencing reading assignments productively. Analytic 4.1: Sequencing of assigned readings based on prior knowledge In nStudy, the instructor can create a set of key terms for a syllabus of reading assignments hosted on a server and bookmarked in nStudy. Before a learner selects any particular assignment, nStudy can present a list of terms and request her to identify those she knows (Figure 7). nStudy then can recommend a subset of readings based on familiar terms (Figure 8). Subsequent selections could be based on a simple heuristic that first, tracks new terms she uses in notes to elaborate new material she studies, and second, recommends next articles for study based on her extended grasp of lexicon. This analytic assumes learners use new terms in their notes as they develop knowledge of those terms and findings that learners with domain specific knowledge are more prepared to comprehend demanding topics (McNamara, Kintsch, Songer, & Kintsch, 1996), make inferences while learning, use more advanced strategies during learning (Alexander, Jetton, & Kulikowich 1995; Murphy & Alexander, 2002), and monitor and plan their learning (Moos & Azevedo, 2008). We conjecture and, when many students use nStudy, could empirically test how this approach to sequencing content meshes with findings about retrieval practice. This illustrates how nStudy serves both individual learners and contributes raw materials to learning science.

Australasian Journal of Educational Technology, 2016, 32(6).
10
Figure 7. Example list of terms provided by nStudy
Figure 8. Sequenced reading recommendation Case 5. Comparative evaluation of writing Theoretical background According to schema theory (Piaget, 1964), knowledge is organised into cognitive structures, acquired and adapted with experience that facilitate encoding and recall. We suggest an application of schema theory to learning analytics about writing. Writers try to convey and, sometimes, to change perceptions (Anson, Bommarito, & Deuser, 1983). A recommendation arising from schema theory in teaching writing is to help students become aware not only of their schemas but also of how other people construct knowledge, perhaps using different schemas. This audience awareness generates standards writers can use to metacognitively monitor drafts and revise them to convey messages as they intend (Anson et al., 1983). Graph theory visually represents information as a structure of nodes (vertices) and edges that connect nodes (Cohen & Havlin, 2010). Graphs can identify properties of a node’s relationships that may otherwise be obscured. A text can be represented as a graph in which key words are nodes and conceptual connections are edges (Paranyushkin, 2011). For example, terms can be depicted as a graph with edges that represent co-occurrence of terms in a sentence. Edges can be weighted; the higher the co-occurrence of a pair of terms, the greater the edge weight. Representation of a text as a mathematical graph offers opportunities for text analysis; e.g., important concepts can be identified by a measure of graph centrality (Paranyushkin, 2011). The similarity of texts can be considered as a particular case of graph isomorphism, the general case being to determine mathematically the degree to which two vertices in graphs are linked in the same pattern (Zager & Verghese, 2008). One approach involves examining the extent to which some particular term in graphs of two texts has a similar neighborhood in those graphs (Koutra, Parikh, Ramdas, & Xiang, 2011). This approach can be applied iteratively to examine the similarity of neighborhoods to one another, and so on. Analytic 5.1: Similarities between a learner’s essay and assigned readings Graph-based measures of text similarity offer many opportunities for learning analytics. Given difficulties many students experience with writing (e.g., Casanave & Hubbard, 1992), identifying similarities between source materials (e.g., web pages, articles) and a learner’s essay could be useful for students and their instructor alike. Learners could identify nodes (terms) and neighborhoods of knowledge omitted or

Australasian Journal of Educational Technology, 2016, 32(6).
11
differently structured than in the materials they studied. Instructors could examine the class’s use of knowledge and schematic knowledge structures. nStudy’s essay tool and several of its other artifacts (e.g., quotes of text highlighted, terms’ definitions, notes) can supply input to graph-based writing analytics. First, nStudy reads source articles or assigned texts to identify terms in each text belonging to a glossary (previously entered into nStudy by the instructor). nStudy then creates a graph, which we call a termnet, showing terms clustered according to meanings. For example, an in-terms-of relation creates an edge between terms when one term is defined using another term. A sentence co-occurrence relation creates an edge when two terms co-occur in a sentence. A paragraph co-occurrence relation does the same for terms within paragraphs. These termnets depict the conceptual neighborhoods of each term. As a student drafts an essay, nStudy monitors terms the student uses and their conceptual relationships. A termnet of the student’s essay can be compared to the termnet for a set of source materials. Decorations in a student’s termnet, for example heat map coloring, can reflect use of terms in the essay compared to source materials. Such termnets visualise features of the draft essay relative to sources such as overall content coverage, emphasis expressed in terms’ frequency of use, and variations in schemas. Better writers are aware of essay coherence. Termnets constructed based on terms’ co-occurrences in paragraphs reflect a common elementary-grade principle that each paragraph presents a main idea. Graph theoretic indices that compare conceptual similarity (schemas) between a student’s paragraphs and that of the corpus of source documents describe main idea coherence. Alongside numerical analytics, the spatial display of the termnet visually represents that comparison. Analytic 5.2: Termnets for grading learners’ written responses We propose termnets can: (a) facilitate grading students’ free responses, and (b) generate analytics for learners and instructors about just-in-time performance and just-in-case learning. Suppose an instructor designs a free response question based on assigned reading(s), for example, “Briefly describe cell structure and the process of mitosis.” Then uses nStudy to create terms with definitions required in an ideal answer. Cell might be defined as “the smallest structural unit of an organism consisting of wall, cytoplasm and nucleus.” nStudy takes this glossary (terms plus definitions) as input and forms a termnet like that shown in Figure 9.
Figure 9. Termnet generated by an instructor This termnet is a directed graph. Nodes represent terms and directed edges (arrows) reflect in-terms-of relations where arrow points from the term used in the definition to the term defined. For example, cytoplasm is used to define cell so the edge is directed from cytoplasm to cell. When a student answers the instructor’s question using nStudy’s essay tool, nStudy parses that response to create the termnet shown in Figure 9 and, on comparing it to the instructor’s termnet creates an overlay termnet shown in Figure 10.

Australasian Journal of Educational Technology, 2016, 32(6).
12
Figure 10. Termnet generated from a student’s response The overlay termnet visualises differences between a student’s and the instructor’s termnet by decorating missed terms, missed and added edges, and changes in edges’ directions. In this example, the student forgot to mention polysaccharides, so the overlay termnet colors the polysaccharides node red. The student mentioned cell in her definition of organ, but the instructor did not; this is represented as a new edge. She did not mention nucleus when describing a cell (“Cell is a functional unit of an organism consisting of cytoplasm and wall.”), so the red edge between cell and nucleus identifies this omission. In this example, the student also used cytoplasm to define cell, and vice versa (“Cytoplasm is a part of cell that contains nucleus”). This directed relation is added to the edge between these corresponding nodes (colored green in Figure 11). Lastly, edges can be rotated in the student’s answer when the relation between concepts identified in the instructor’s termnet is reversed (orange). Here, the student used organ to define tissue (“Tissue is a set of cells and it also makes up organs.”) while the instructor’s termnet defined this as, “Organ consists of a number of tissues.”
Figure 11. Overlay termnet In large classes, gaining an overall perspective on students’ representation of conceptual structures is difficult. An aggregate of students’ termnets can reveal features of the group, as shown in Figure 12. The aggregated termnet shows instructors where students struggle or suggest whether a presentation was misleading. In Figure 12, many students omitted or incorrectly identified relationships between cell and tissue and between nucleus and chromosomes represented as thicker edges in Figure 12. Additional decorations can identify edges or directions added, or directions rotated. If students use nStudy’s tagging feature to classify terms, e.g., vague or too complex, examining how those tags predict disparities in aggregated termnets provides additional information for instructors about texts selected for students and lecture content.

Australasian Journal of Educational Technology, 2016, 32(6).
13
Figure 12. Instructor’s aggregated termnet Dynamic termnets representing graphs of terms’ relations over time can extend insights for instructors and students. For students, this type of analytic can depict evolving understanding over the timeline of a project or portfolio. Aggregated dynamic termnets can give instructors an overview of the progress of the class. Instructors may find it helpful to compare aggregated dynamic termnets across offerings of a single course to explore trends that suggest changes to the sequence of a course’s syllabus. Termnets and analytics based on them can be extended beyond literal terms. For example, learners may use synonyms or a phrase to represent a specific term in the instructor’s glossary. This limitation may be overcome in at least one way. Over time, instructors include these equivalents in nStudy’s representation of terms. This work might be eased by applying text mining and graph theoretic techniques to propose equivalencies for the instructor to confirm or reject. Case 6. Collaborative learning Theoretical background Analytics are needed to help learners choose partners with whom they can collaborate productively by profiting from knowledge others own (Siemens, 2004). Paralleling termnets and their representation of knowledge structures, a graph can represent a social learning network in which nodes represent people and edges represent exchanges of information between them. For example, Brooks, Greer, and Gutwin’s (2014) graphs visualise learners’ asynchronous communications in the iHelp discussion environment for an online course. They used three categories of nodes to represent participants in a discussion: (1) those who posted and replied, (2) lurkers who read messages but did not post, and (3) non-users who apparently neither read postings nor posted. Students who contributed the most postings were positioned centrally in their sociograms. The importance of posts was quantified by dividing the number of people who read a student’s posts by the sum of the (number who posted + number lurking) × number of posts. Participants posting important messages were visualised in the sociogram by larger diameter nodes. Brooks and his colleagues’ graphs help instructors understand how learners collaborate by showing learners’ communication intensity, the importance of learners’ contributions, and who reads and reviews posts. By applying text mining methods, we propose extending social network graphs to include consideration of the information in learners’ posts and replies. For instance, to examine characteristics of content-related information participants discuss, we first need to exclude posts like, “When is the paper due?” which would likely prompt many student responses, and thus according to Brooks et al.’s index, receive a high importance rating. Instead, for posts learners make using the nStudy hub feature, we examine them in terms of the interactive facet of Chi’s framework (Chi & Wylie, 2014). Chi and Wylie (2014) described four modes of cognitive engagement with study material: passive, active, constructive, and interactive (in reverse order, ICAP). The interactive mode is reported to best promote learning as, in this mode, the learner synthesises comments provided by other learners to construct and organise knowledge.
Australasian Journal of Educational Technology, 2016, 32(6).
14
Analytic 6.1: Social learning networks based on the interactive facet of ICAP When a learner posts in nStudy’s hub, a drop-down menu allows tagging the type of post. The list in Figure 13 illustrates one set of tags that can be selected: disagree, give reason, request justification, ask a question, elaborate, share, and agree. Each of these tags is articulated from Chi and Wylie’s (2014) operational definition of the interactive facet of ICAP.
Figure 13. nStudy Hub menu
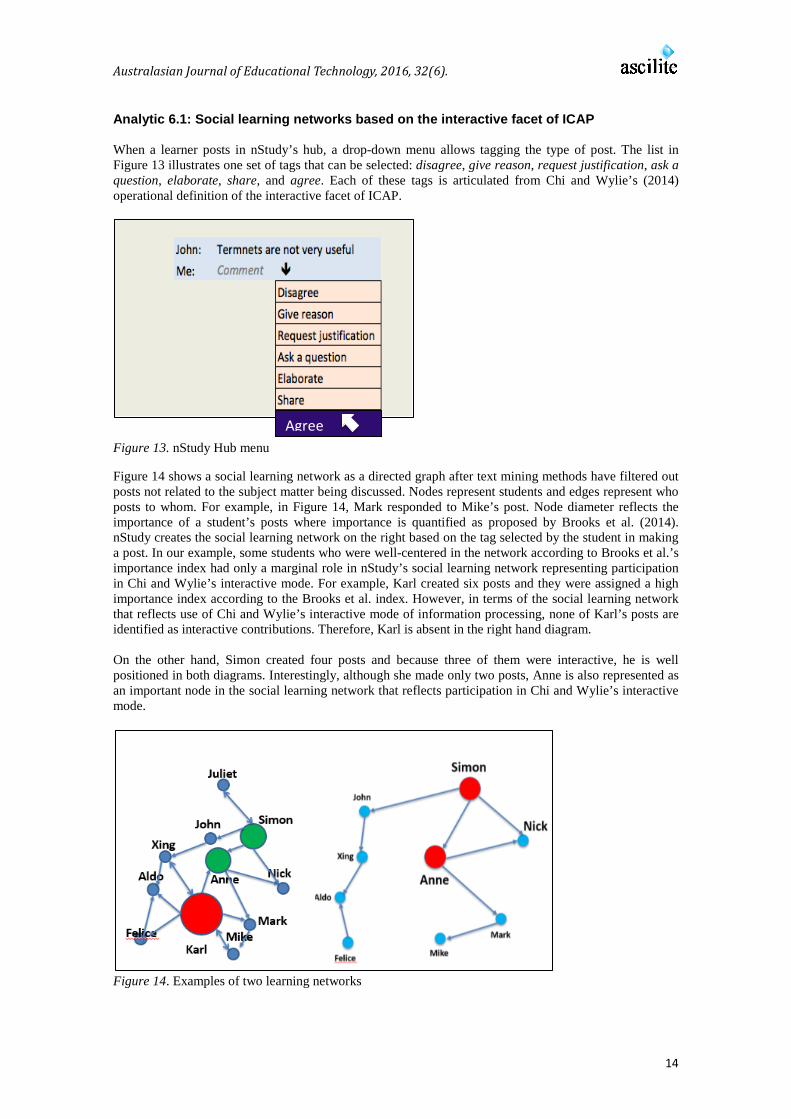
Figure 14 shows a social learning network as a directed graph after text mining methods have filtered out posts not related to the subject matter being discussed. Nodes represent students and edges represent who posts to whom. For example, in Figure 14, Mark responded to Mike’s post. Node diameter reflects the importance of a student’s posts where importance is quantified as proposed by Brooks et al. (2014). nStudy creates the social learning network on the right based on the tag selected by the student in making a post. In our example, some students who were well-centered in the network according to Brooks et al.’s importance index had only a marginal role in nStudy’s social learning network representing participation in Chi and Wylie’s interactive mode. For example, Karl created six posts and they were assigned a high importance index according to the Brooks et al. index. However, in terms of the social learning network that reflects use of Chi and Wylie’s interactive mode of information processing, none of Karl’s posts are identified as interactive contributions. Therefore, Karl is absent in the right hand diagram. On the other hand, Simon created four posts and because three of them were interactive, he is well positioned in both diagrams. Interestingly, although she made only two posts, Anne is also represented as an important node in the social learning network that reflects participation in Chi and Wylie’s interactive mode.
Figure 14. Examples of two learning networks
Agree

Australasian Journal of Educational Technology, 2016, 32(6).
15
The quality of analytics like this, of course, depends integrally on how accurately text mining methods can identify qualities of information students contribute to discussions and on students accurately classifying the nature of the post they make when they tag it. Supervised methods can help improve the output of text mining. If students discuss one another’s tags, a meta-discussion may evolve in the learning community that helps them to converge on accurate tagging. Conclusion Students’ metacognitive monitoring of learning processes and products is a key to productive SRL (Winne, 2011; Winne & Hadwin, 1998). Monitoring can falter if learners misrepresent or lack awareness of their actual study activities. In a study by Winne and Jamieson-Noel (2002), learners’ perceptions of how they studied did not match traces of those activities collected by software (Winne & Jamieson-Noel, 2002). In these cases, learning analytics can help learners accurately reflect their activities and how those activities relate to performance. As well, learning analytics can invite learners to consider features of their learning activities about which they may be unaware. Both are opportunities for learners to improve the basis for productive self-regulated learning. Analytics we presented here used ambient data collected as learners interact with online learning materials and several illustrated how to take into account three essential aspects of motivation: learners’ autonomy, relatedness, and competence (Vallerand et al., 2008). We subscribe to the view that analytics which jointly inform learners about learning activities and respect motivational features of learning are more likely to promote productive SRL in which learners use analytics to reflect, monitor, choose, act, and adapt studying that improves their progress (Wise, Vytasek, Hausknecht, & Zhao, 2016). As is amply demonstrated in the field of learning analytics, there is a great volume of trace data and ways these data can be analysed are numerous. We strongly endorse drawing on theory and existing empirical evidence in selecting data for input to analytics and designing analytics that reflect aspects of data. In this article, we proposed designs for analytics informed by research in learning science about goal-setting, distributed practice, prior knowledge, writing feedback and collaborative learning. We also grounded analytics in a well-researched theory of motivation, self-determination theory. We add that other theories of motivation, such as social cognitive theory (Bandura, 1986, 1997, 2001) and attribution theory (Weiner, 2000), also provide strong foundations for designing learning analytics. The richness of learning science affords many choices for engineering learning analytics. Mining these riches should receive major attention as the field of learning analytics matures. References Alexander, P. A., Jetton, T. L., & Kulikowich, J. M. (1995). Interrelationship of knowledge, interest, and
recall: Assessing the model of domain learning. Journal of Educational Psychology, 87(4), 559–575. Anson, C., Bommarito, E. M., & Deuser, J. A. (1983). From schemes to themes: Implications of schema
theory for teaching writing. Journal of Teaching Writing, 2(2), 193-211. http://dx.doi.org/10.1057/9781137284464.0026
Bandura, A (1986). Social foundations of thought and action. Englewood Cliffs, NJ: Prentice-Hall. Bandura, A. (1997). Self-efficacy: The exercise of control. New York, NY: Freeman. Bandura, A. (2001). Social cognitive theory: An agentic perspective. Annual Review of Psychology 52(1),
1-26. http://dx.doi.org/10.1146/annurev.psych.52.1.1 Barbera, E., & Reimann, P. (2013). Assessment and evaluation of time factors in online teaching and
learning. Hershey, PA: IGI Global. Behrens, J. T., & DiCerbo, K. E. (2014). Harnessing the currents of the digital ocean. In J.A. Larusson &
B. White (Eds.), Learning analytics (pp. 39-60). New York, NY: Springer. Bransford, J. D., & M. K. Johnson (1972). Contextual prerequisites for understanding: Some
investigations of comprehension and recall. Journal of Verbal Learning and Verbal Behavior, 11(6), 717- 726. http://dx.doi.org/10.1016/s0022-5371(72)80006-9
Brooks, C., Greer, J., & Gutwin, C. (2014). The data-assisted approach to building intelligent technology-enhanced learning environments. In J.A. Larusson & B. White (Eds.), Learning Analytics (pp. 123-156). New York, NY: Springer.
Carpenter, S. K., Pashler, H., Wixted, J. T., & Vul, E. (2008). The effects of tests on learning and forgetting. Memory & Cognition, 36(2), 438-448. http://dx.doi.org/10.3758/mc.36.2.438

Australasian Journal of Educational Technology, 2016, 32(6).
16
Casanave, C. P., & Hubbard, P. (1992). The writing assignments and writing problems of doctoral students: Faculty perceptions, pedagogical issues, and needed research. English for Specific Purposes, 11(1), 33-49. http://dx.doi.org/10.1016/0889-4906(92)90005-u
Cepeda, N. J., Pashler, H., Vul, E., Wixted, J. T., & Rohrer, D. (2006). Distributed practice in verbal recall tasks: A review and quantitative synthesis. Psychological Bulletin. 132(3), 354–380. http://dx.doi.org/10.1037/0033-2909.132.3.354
Cepeda, N. J., Vul, E., Rohrer, D., Wixted, J. T., & Pashler, H. (2008). Spacing effects in learning: A temporal ridgeline of optimal retention. Psychological Science, 19(11), 1095–1102. http://dx.doi.org/10.1111/j.1467-9280.2008.02209.x
Chi, M. T., & Wylie, R. (2014). The ICAP framework: Linking cognitive engagement to active learning outcomes. Educational Psychologist, 49(4), 219-243. http://dx.doi.org/10.1080/00461520.2014.965823
Clow, D. (2013). An overview of learning analytics. Teaching in Higher Education, 18(6), 683–695. http://dx.doi.org/10.1080/13562517.2013.827653
Cohen, R., & Havlin, S. (2010). Complex networks: Structure, robustness and function. Cambridge: Cambridge University Press.
Cotton, K. (1990). Educational time factors. Portland, OR: Northwest Regional Educational Laboratory. Deci, E. L., & Ryan, R. M. (1980). Self-determination theory: When mind mediates behavior. Journal of
Mind and Behavior, 1, 33–43. http://dx.doi.org/10.1007/978-1-4899-2271-7_3 Deci, E. L., & Ryan, R. M. (2008). Self-determination theory: A macrotheory of human motivation,
development, and health. Canadian Psychology, 49(3), 182-185. http://dx.doi.org/10.1037/a0012801 Delaney, P. F., Verkoeijen, P. P. J. L., & Spirgel, A. (2010). Spacing and testing effects: A deeply critical,
lengthy, and at times discursive review of the literature. Psychology of Learning and Motivation, 53, 63-147. http://dx.doi.org/10.1016/s0079-7421(10)53003-2
Dempster, F. N. (1987). Effects of variable encoding and spaced presentations on vocabulary learning. Journal of Educational Psychology, 79(2), 162-170. http://dx.doi.org/10.1037/0022-0663.79.2.162
Dent, A. L., & Koenka, A. C. (2015). The relation between self-regulated learning and academic achievement across childhood and adolescence: A meta-analysis. Educational Psychology Review,1-50. http://dx.doi.org/10.1007/s10648-015-9320-8
Donovan, J. J., & Radosevich, D. J. (1999). A meta-analytic review of the distribution of practice effect: Now you see it, now you don't. Journal of Applied Psychology, 84(5), 795-805. http://dx.doi.org/10.1037//0021-9010.84.5.795
Dunlosky, J., & Nelson, T. O. (1994). Does the sensitivity of judgments of learning (JOLs) to the effects of various study activities depend on when the JOLs occur? Journal of Memory and Language, 33(4), 545-565. http://dx.doi.org/10.1006/jmla.1994.1026
Dunlosky, J., Rawson, K. A., Marsh, E. J., Nathan, M. J., & Willingham, D. T. (2013). Improving students’ learning with effective learning techniques promising directions from cognitive and educational psychology. Psychological Science in the Public Interest, 14(1), 4-58. http://doi.org/10.1177/1529100612453266
Jang, H. (2008). Supporting students' motivation, engagement, and learning during an uninteresting activity. Journal of Educational Psychology, 100(4), 798-811. http://dx.doi.org/10.1037/a0012841
Janiszewski, C., Noel, H., & Sawyer, A. G. (2003). A meta-analysis of the spacing effect in verbal learning: Implications for research on advertising repetition and consumer memory. Journal of Consumer Research, 30(1), 138-149. http://dx.doi.org/10.1086/374692
Kahneman, D. (1973). Attention and effort. Englewood Cliffs, NJ: Prentice-Hall. Kali, Y., Linn, M., & Roseman, J. E. (2008). Designing Coherent Science Education: Implications for
Curriculum, Instruction, and Policy. Technology, Education--Connections (TEC) Series. New York, NY: Teachers College Press.
Karpicke, J. D., & Roediger, H. L. (2008). The critical importance of retrieval for learning. Science, 319(5865), 966-968. http://dx.doi.org/10.1126/science.1152408
Kintsch, W. (1988). The role of knowledge in discourse comprehension: A construction integration model. Psychological Review, 95(2), 163–182. http://dx.doi.org/10.1037/0033-295x.95.2.163
Kornell, N., & Bjork, R. A. (2008). Learning concepts and categories: Is spacing the ''Enemy of induction''? Psychological Science 19(6), 585-592. http://dx.doi.org/10.1111/j.1467-9280.2008.02127.x
Kornell, N., Castel, A. D., Eich, T. S., & Bjork, R. A. (2010). Spacing as the friend of both memory and induction in young and older adults. Psychology and Aging, 25(2), 498-503. http://dx.doi.org/10.1037/a0017807

Australasian Journal of Educational Technology, 2016, 32(6).
17
Koutra, D., Parikh, A., Ramdas, A., & Xiang, J. (2011). Algorithms for graph similarity and subgraph matching. Pittsburgh, PA: Technical Report of Carnegie-Mellon-University.
Landauer, T. K., & Bjork, R. A. (1978) Optimum rehearsal patterns and name learning. In M. M. Gruneberg, P.E. Morris, & R.N. Sykes (Eds.), Practical Aspects of Memory (pp. 625–632). Oxford, England: Academic Press
Lee, Y., Choi, J., & Kim, T. (2013). Discriminating factors between completers of and dropouts from online learning courses. British Journal of Educational Technology, 44(2), p. 328–337 http://dx.doi.org/10.1111/j.1467- 8535.2012.01306.x
Locke, E. A., Shaw, K. N., Saari, L. M., & Latham, G. P. (1981). Goal setting and task performance: 1969– 1980. Psychological Bulletin, 90(1), 125-152. http://dx.doi.org/10.1037/0033-2909.90.1.125
McNamara, D. S., Kintsch, E., Songer, N. B., & Kintsch, W. (1996). Are good texts always better? Interactions of text coherence, background knowledge, and levels of understanding in learning from text. Cognition and Instruction, 14(1), 1–43. http://dx.doi.org/10.1207/s1532690xci1401_1
Moos, D. C., & Azevedo, R. (2008). Self-regulated learning with hypermedia: The role of prior domain knowledge. Contemporary Educational Psychology 33(2), 270-298. http://dx.doi.org/10.1016/j.cedpsych.2007.03.001
Murphy, P. K., & Alexander, P. A. (2002). What counts? The predictive powers of subject-matter knowledge, strategic processing, and interest in domain-specific performance. The Journal of Experimental Education, 70(3), 197–214. http://dx.doi.org/10.1080/00220970209599506
Nicol, D. J., & Macfarlane‐Dick, D. (2006). Formative assessment and self‐regulated learning: A model and seven principles of good feedback practice. Studies in Higher Education, 31(2), 199-218. http://dx.doi.org/10.1080/03075070600572090
Paranyushkin, D. (2011). Identifying the pathways for meaning circulation using text network analysis. Berlin: Nodus Labs. Retrieved from http://noduslabs.com/research/pathways-meaning-circulation-text-network-analysis
Piaget, J. (1964). Part I: Cognitive development in children: Piaget development and learning. Journal of research in science teaching, 2(3), 176-186. http://dx.doi.org/10.1002/tea.3660020306
Pintrich, P. R. (1988). A process-oriented view of student motivation and cognition. In J.S. Stark, & L. Mets (Eds.), Improving teaching and learning through research. New directions for institutional research (Vol. 57, pp. 55-70). San Francisco, CA: Jossey-Bass.
Pintrich, P. R. (1989). The dynamic interplay of student motivation and cognition in the college classroom. In C. Ames, & M. Maehr (Eds.), Advances in motivation and achievement: Motivation enhancing environments (Vol. 6, pp. 117-160). Greenwich, CT: JAI Press.
Roediger, H. L., & Butler, A. C. (2011). The critical role of retrieval practice in long-term retention. Trends in Cognitive Sciences, 15(1), 20-27. http://dx.doi.org/10.1016/j.tics.2010.09.003
Roediger, H. L., & Karpicke, J. D. (2006). Test-enhanced learning taking memory tests improves long-term retention. Psychological Science, 17(3), 249-255. http://dx.doi.org/10.1111/j.1467-9280.2006.01693.x
Roll, I., Wiese, E. S., Long, Y., Aleven, V., & Koedinger, K. R. (2014). Tutoring self-and co-regulation with intelligent tutoring systems to help students acquire better learning skills. Design Recommendations for Intelligent Tutoring Systems, 2, 169-182. http://dx.doi.org/10.1007/978-3-540-30139-4_22
Roll, I., & Winne, P. H. (2015). Understanding, evaluating, and supporting self-regulated learning using learning analytics. Journal of Learning Analytics, 2(1), 7-12. http://dx.doi.org/10.18608/jla.2015.21.2
Salomon, G., & Perkins, D. N. (1989). Rocky roads to transfer: Rethinking mechanism of a neglected phenomenon. Educational Psychologist, 24(2), 113-142. http://dx.doi.org/10.1207/s15326985ep2402_1
Schmidt, R. A., & Bjork, R. A. (1992) New conceptualizations of practice: Common principles in three paradigms suggest new concepts for training. Psychological Science 3(4), 207-217. http://dx.doi.org/10.1111/j.1467-9280.1992.tb00029.x
Schunk, D. H., Pintrich, P. R., & Meece, J., L. (2008). Motivation in education (3rd ed.). Upper Saddle River, NJ: Pearson Merrill Prentice Hall.
Shapiro, A. M. (2004). Prior knowledge must be included as a subject variable in learning outcomes research. American Educational Research Journal, 41(1), 159–189. http://dx.doi.org/10.3102/00028312041001159
Siemens, G. (2004). Connectivism. A Learning Theory for the Digital Age. Retrieved from http://www.ingedewaard.net/papers/connectivism/2005_siemens_ALearningTheoryForTheDigitalAge.pdf
Smith, S. M., Glenberg, A., & Bjork, R. A. (1978). Environmental context and human memory. Memory & Cognition, 6(4), 342-353.Tobias, S., & Everson, H. T. (2000). Assessing metacognitive knowledge

Australasian Journal of Educational Technology, 2016, 32(6).
18
monitoring. In G. Schraw (Ed.), Issues in the measurement of metacognition (pp. 147–222). Lincoln, NE: Buros Institute of Mental Measurements and Erlbaum Associates.
Vallerand, R. J., Koestner, R., & Pelletier, L. G. (2008). Reflections on self-determination theory. Canadian Psychology, 49(3), 257-262. http://dx.doi.org/10.1037/a0012804
Vansteenkiste, M., Lens, W., & Deci, E. L. (2006). Intrinsic versus extrinsic goal contents in self- determination theory: Another look at the quality of academic motivation. Educational Psychologist, 41(1), 19-31. http://dx.doi.org/10.1207/s15326985ep4101_4
Vesonder, G. T., & Voss, J. F. (1985). On the ability to predict one's own responses while learning. Journal of Memory and Language, 24(3), 363-376. http://dx.doi.org/10.1016/0749-596x(85)90034-8
Weiner, B. (2000). Interpersonal and intrapersonal theories of motivation from an attributional perspective. Educational Psychology Review, 12, 1-14. http://dx.doi.org/10.1007/978-1-4615-1273-8_2
Winne, P. H. (1995). Inherent details in self-regulated learning. Educational Psychologist, 30(4), 173-187. http://dx.doi.org/10.1207/s15326985ep3004_2
Winne, P. H. (2001). Self-regulated learning viewed from models of information processing. In B. J. Zimmerman, & D. H. Schunk (Eds.), Self-regulated learning and academic achievement: Theoretical perspectives (2nd ed., pp. 153–189). Mahwah, NJ: Lawrence Erlbaum.
Winne, P. H. (2010). Improving measurements of self-regulated learning. Educational Psychologist, 45, 267-276. http://dx.doi.org/10.1080/00461520.2010.517150
Winne, P. H. (2011). A cognitive and metacognitive analysis of self-regulated learning. In B. J. Zimmerman and D. H. Schunk (Eds.), Handbook of self-regulation of learning and performance (pp. 15-32). New York, NY: Routledge.
Winne, P. H. (in press). Leveraging big data to help each learner upgrade learning and accelerate learning science. Teachers College Record, 118(13).
Winne, P. H., & Baker, R. S. (2013). The potentials of educational data mining for researching metacognition, motivation and self-regulated learning. Journal of Educational Data Mining, 5(1), 1-8. http://dx.doi.org/10.1007/s11409-014-9113-3
Winne, P. H., & Hadwin, A. F. (1998). Studying as self-regulated learning. In D. J. Hacker, J. Dunlosky, & A. Graesser (Eds.), Metacognition in educational theory and practice (pp. 277–304). Hillsdale, NJ: Lawrence Erlbaum.
Winne, P. H., & Jamieson-Noel, D. (2002). Exploring students’ calibration of self-reports about study tactics and achievement. Contemporary Educational Psychology, 27(4), 551-572. http://dx.doi.org/10.1016/s0361-476x(02)00006-1
Winne, P. H., Nesbit, J. C., Marzouk, Z., Ram, I., Samadi, D., Stewart, J., … Woloshen, S. (2016). nStudy traces of process and content in self-regulated learning. In M. Bernacki (Chair), Self-regulated learning analytics: Aligning data and their treatment to the assumptions of theory. American Educational Research Association, Washington, DC.
Wise, A. F. (2014). Designing pedagogical interventions to support student use of learning analytics. Proceedings of the Fourth International Conference on Learning Analytics and Knowledge - LAK ’14, Leuven, Belgium, 203–211. http://dx.doi.org/10.1145/2567574.2567588
Wise, A. F., Vytasek, J. M., Hausknecht, S., & Zhao, Y. (2016). Developing Learning Analytics Design Knowledge in the Middle Space: The Student Tuning Model and Align Design Framework for Learning Analytics Use. Online Learning, 20(2).
Zager, L. A., & Verghese, G. C. (2008). Graph similarity scoring and matching. Applied Mathematics Letters, 21(1), 86-94. http://dx.doi.org/10.1016/j.aml.2007.01.006
Zimmerman, B. J. (2008). Investigating self-regulation and motivation: Historical background, methodological developments, and future prospects. American Educational Research Journal, 45(1), 166-183. http://dx.doi.org/10.3102/0002831207312909
Zumbrunn, S., Tadlock, J., & Roberts, E. D. (2011, October). Encouraging self-regulated learning in the classroom: A review of the literature. Paper presented at the Metropolitan Educational Research Consortium (MERC), Richmond, VA.
Corresponding author: Zahia Marzouk, [email protected] Australasian Journal of Educational Technology © 2016. Please cite as: Marzouk, Z., Rakovic, M., Liaqat, A., Vytasek, J., Samadi, D., Stewart-Alonso, J., Ram, I., Woloshen, S., Winne, P. H., & Nesbit, J. C. (2016). What if learning analytics were based on learning science? Australasian Journal of Educational Technology, 32(6), 1-18. http://dx.doi.org/10.14742/ajet.3058