Embed Size (px)
Citation preview

Computational BiologyWhat for ?
Protein family Gene sequence Structure
Non-coding regions
Gene networks
Gene order
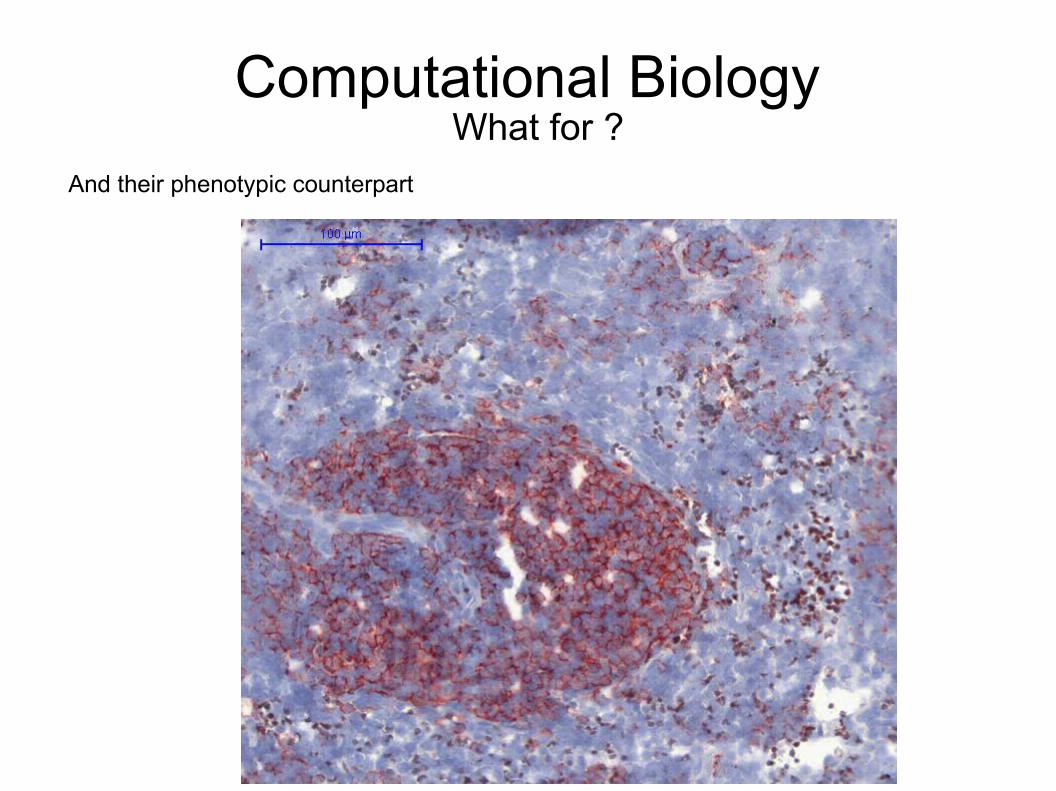
Computational BiologyWhat for ?
And their phenotypic counterpart

Translational BioInformaticsPLOS Computational BiologyA Peer-Reviewed, Open Access JournalTranslational Bioinformatics : a collection of Education Articles, 2012http://www.ploscollections.org/article/browseIssue.action?issue=info:doi/10.1371/issue.pcol.v03.i11 Impact of Computational Biology : translational sciencesIntegrate huge amount of heterogeneous molecular and clinical data for a better understanding of molecular basis of diseases and subsequently changing clinical practices of course for the benefice of the patient
. Informatics : the study of how to represent, store, search, retrieve and analyze information
Medical Informatics : concerns medical information
BioInformatics : concerns basic biological information
Clinical Informatics : focuses on the clinical delivery part of medical informatics
Biomedical Informatics : merges bioinformatics and medical informatics
Imaging Informatics : focuses on images

Translational :- How to improve diagnostic, pronostic and patients’ care ?● Small devices● Molecular dignostic● Nano-particules based treatment● Vaccine
Etc.● Mastering the huge amount of new knowledge in molecular biology, genetics and genomic.
Double helixoidal structure of ADN → pratical improvement of human health from a technological point of view ?
For sure, we are able to quickly compute/measure :- DNA sequences (whole genome scale)- RNA sequences and expression - protein sequences, structure, expression and modification- structure, presence and quantity of small molecular metabolites- generate a lot of data including images

2 playground chapters for this sessions :
- Quantitative Imagery
- Machine Learning / Data Mining
2 important chapters in an ideal world :
- Graph and Network representations
- Knowledge representations : data, database, ontologies
Then technologies/ environments for sotware use/development :- Java : ImageJ, Weka
- Python : Biopython, Numpy, Scipy, Matplotlib, Pyvis, Enthought Python Distribution and Canopy, Anaconda Pandas
- scripts : Perl, Gawk
- Inkscape, ImageMagik / Sphinx / XML, SBML, BioPax, GPML, JSON, SQL, noSQL, Hadoop
- Clustal → T-coffee, PathwayAPI, BioGRID, PatternHunter ….
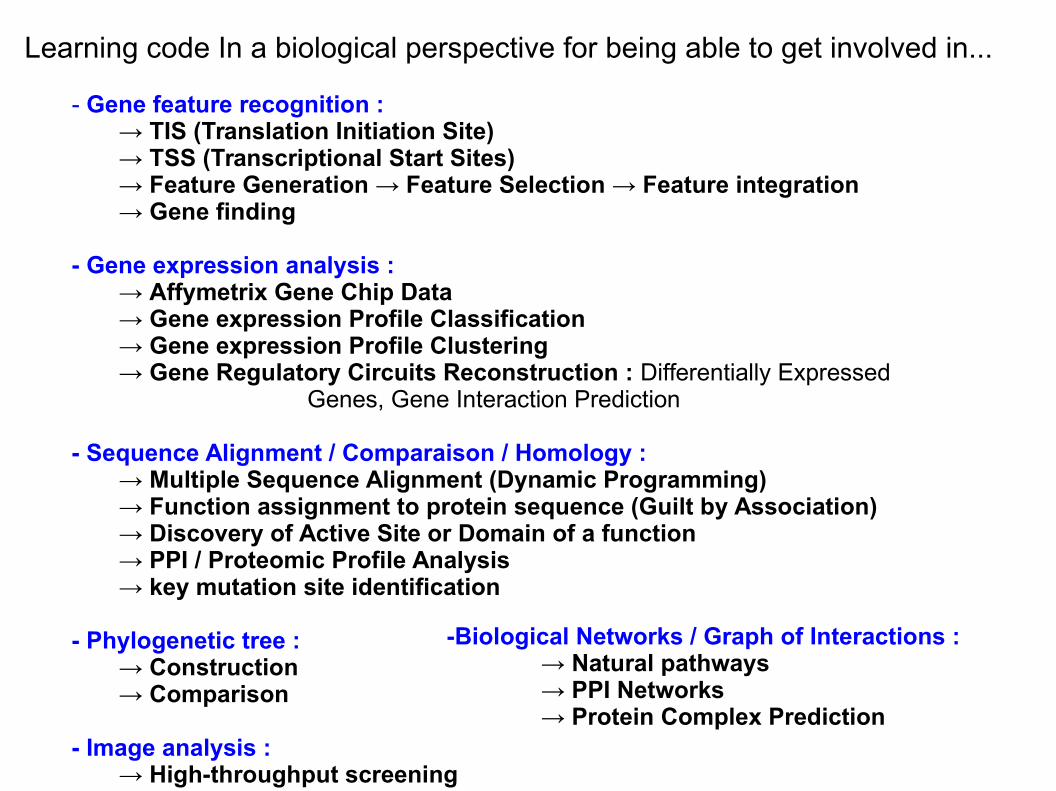
Learning code In a biological perspective for being able to get involved in...
- Gene feature recognition :→ TIS (Translation Initiation Site) → TSS (Transcriptional Start Sites)→ Feature Generation → Feature Selection → Feature integration → Gene finding
- Gene expression analysis : → Affymetrix Gene Chip Data→ Gene expression Profile Classification→ Gene expression Profile Clustering→ Gene Regulatory Circuits Reconstruction : Differentially Expressed
Genes, Gene Interaction Prediction
- Sequence Alignment / Comparaison / Homology :→ Multiple Sequence Alignment (Dynamic Programming)→ Function assignment to protein sequence (Guilt by Association)→ Discovery of Active Site or Domain of a function→ PPI / Proteomic Profile Analysis→ key mutation site identification
- Phylogenetic tree : → Construction→ Comparison
- Image analysis : → High-throughput screening
-Biological Networks / Graph of Interactions : → Natural pathways→ PPI Networks→ Protein Complex Prediction

TIS : Translation Initiation Site Recognition/Prediction
299 HSU27655.1 CAT U27655 Homo sapiensCGTGTGTGCAGCAGCCTGCAGCTGCCCCAAGCCATGGCTGAACACTGACTCCCAGCTGTG 80CCCAGGGCTTCAAAGACTTCTCAGCTTCGAGCATGGCTTTTGGCTGTCAGGGCAGCTGTA 160GGAGGCAGATGAGAAGAGGGAGATGGCCTTGGAGGAAGGGAAGGGGCCTGGTGCCGAGGA 240CCTCTCCTGGCCAGGAGCTTCCTCCAGGACAAGACCTTCCACCCAACAAGGACTCCCCT............................................................ 80................................iEEEEEEEEEEEEEEEEEEEEEEEEEEE 160EEEEEEEEEEEEEEEEEEEEEEEEEEEEEEEEEEEEEEEEEEEEEEEEEEEEEEEEEEEE 240EEEEEEEEEEEEEEEEEEEEEEEEEEEEEEEEEEEEEEEEEEEEEEEEEEEEEEEEEEE
cDNA sample
Why the second ATG is a TIS?

Gene prediction

PAS Prediction
Feature generati on
I ncomi ngsequences
Feature sel ecti on
Feature i ntegrati on
END
BEGI N
SVM in Weka
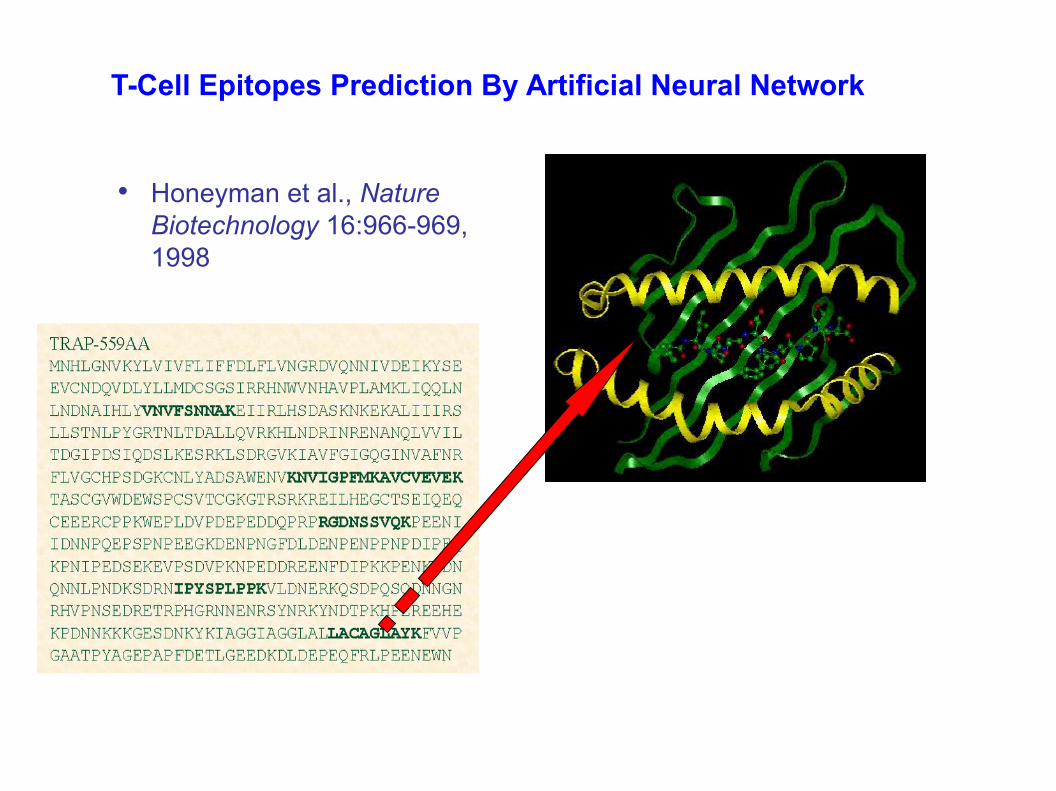
T-Cell Epitopes Prediction By Artificial Neural Network
• Honeyman et al., Nature Biotechnology 16:966-969, 1998
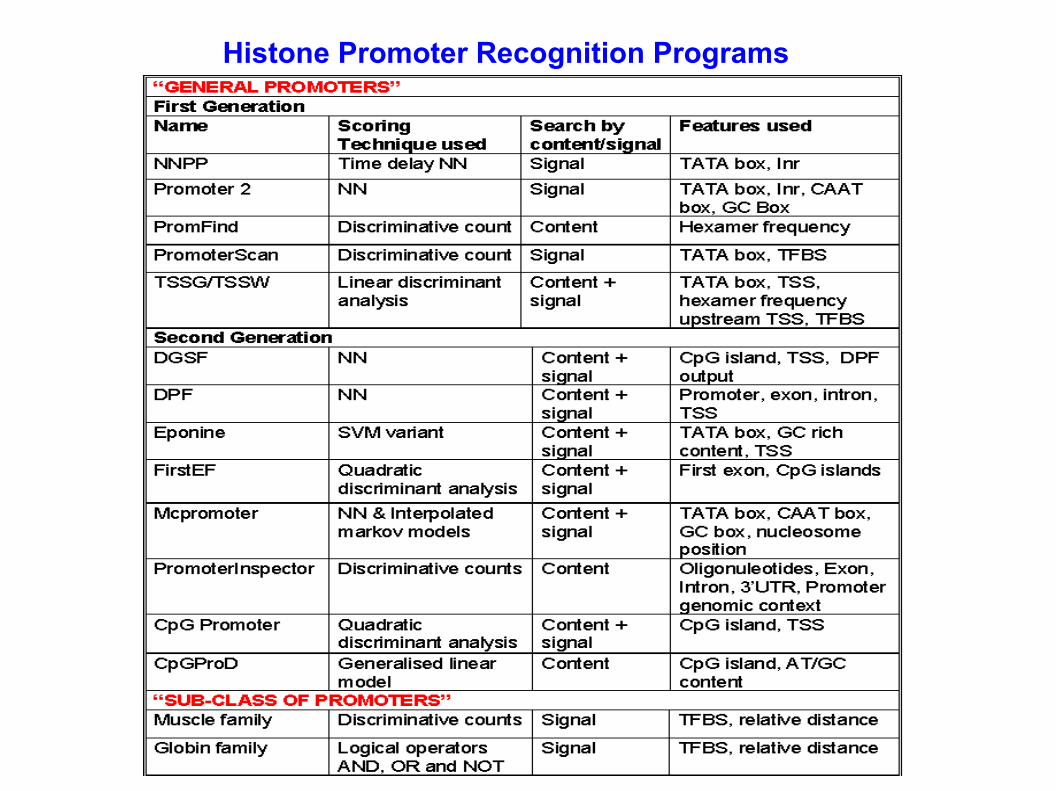
Histone Promoter Recognition Programs
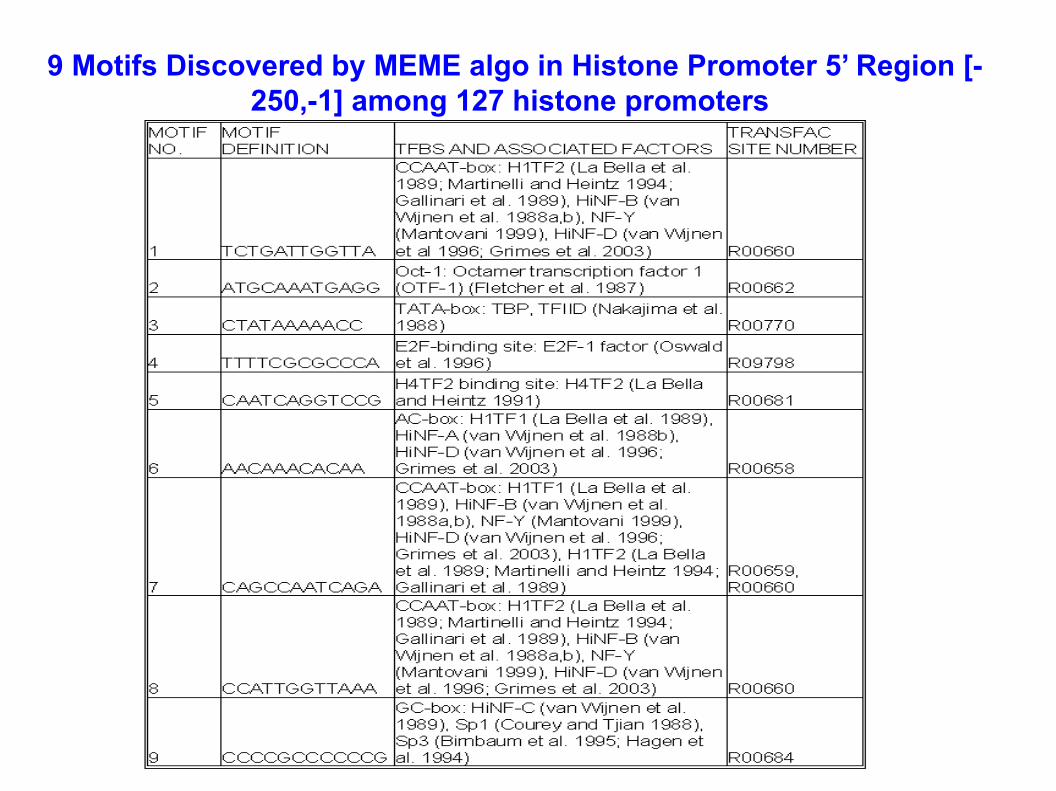
9 Motifs Discovered by MEME algo in Histone Promoter 5’ Region [-250,-1] among 127 histone promoters
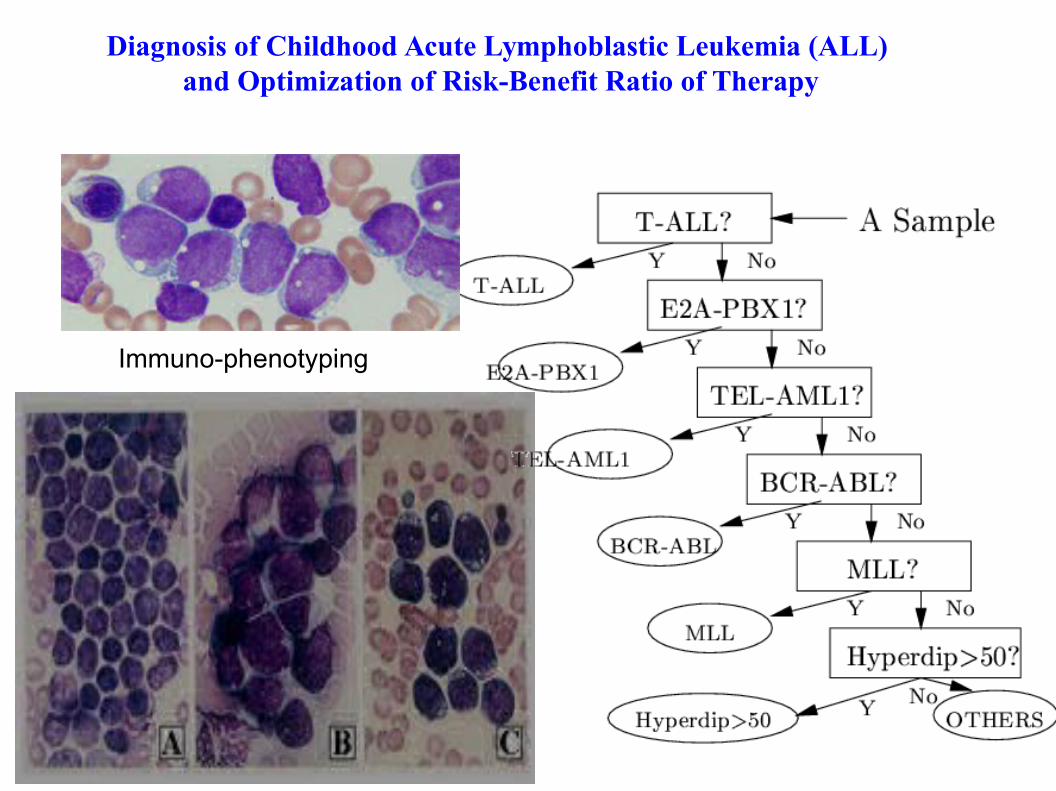
Diagnosis of Childhood Acute Lymphoblastic Leukemia (ALL) and Optimization of Risk-Benefit Ratio of Therapy
Immuno-phenotyping
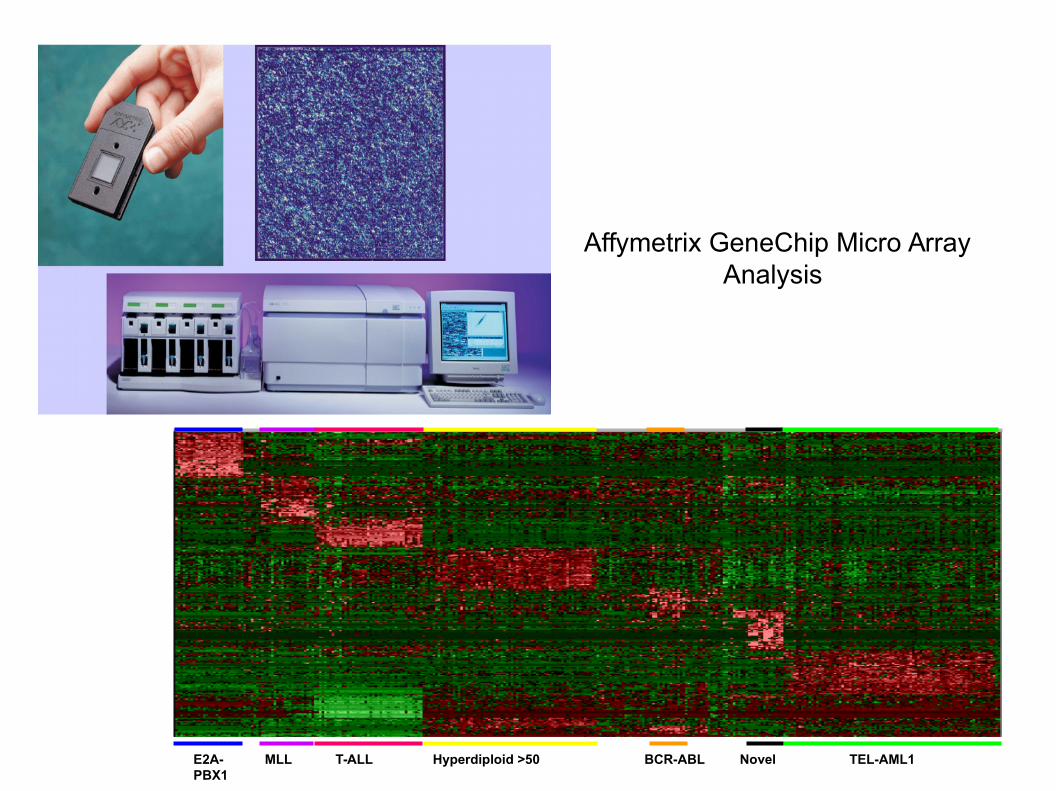
TEL-AML1BCR-ABLHyperdiploid >50E2A-PBX1
MLL T-ALL Novel
Affymetrix GeneChip Micro Array Analysis

Proteomics Data : Guilt-by-Association
Compare T with seqs of known function in a db
Assign to T same function as homologs
Confirm with suitable wet experiments
Discard this functionas a candidate
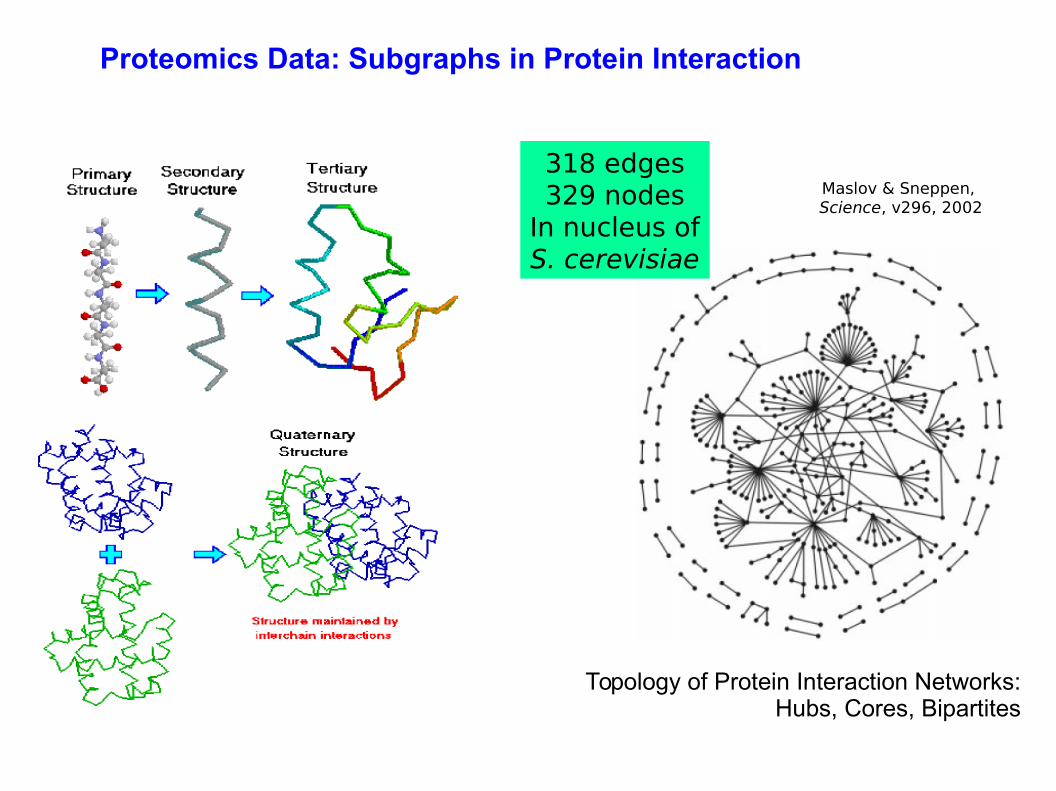
Topology of Protein Interaction Networks: Hubs, Cores, Bipartites
Maslov & Sneppen, Science, v296, 2002
318 edges329 nodes
In nucleus ofS. cerevisiae
Proteomics Data: Subgraphs in Protein Interaction
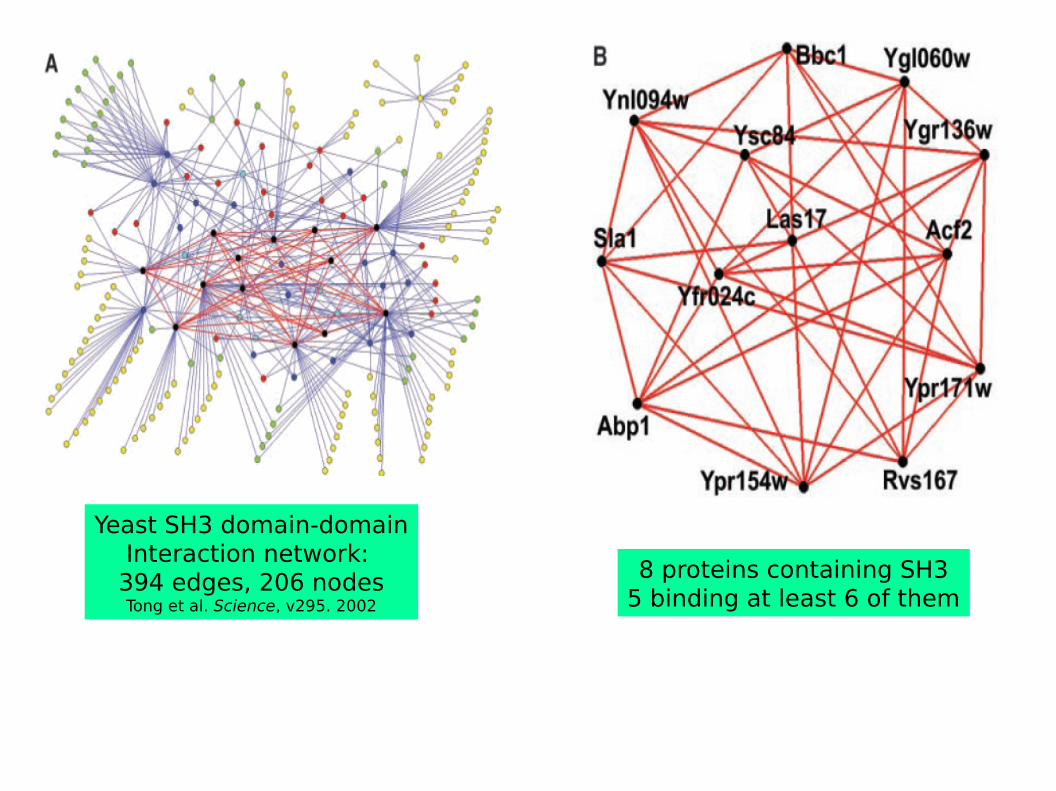
Yeast SH3 domain-domainInteraction network: 394 edges, 206 nodesTong et al. Science, v295. 2002
8 proteins containing SH35 binding at least 6 of them
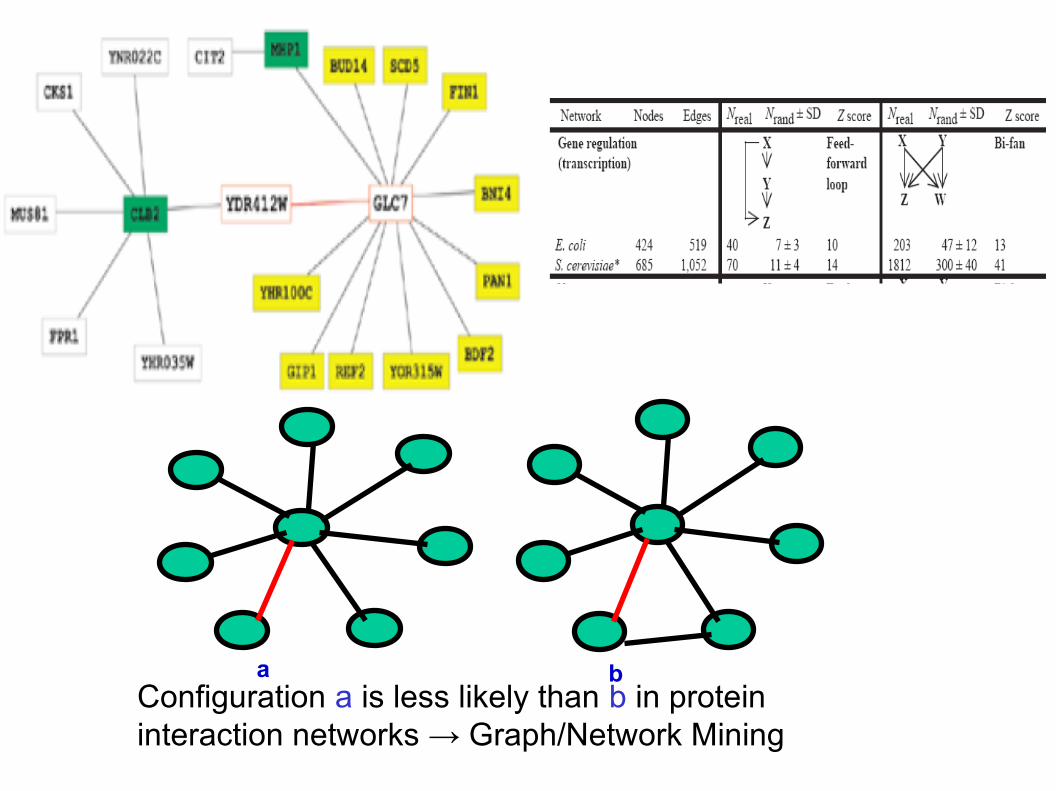
a bConfiguration a is less likely than b in protein interaction networks → Graph/Network Mining
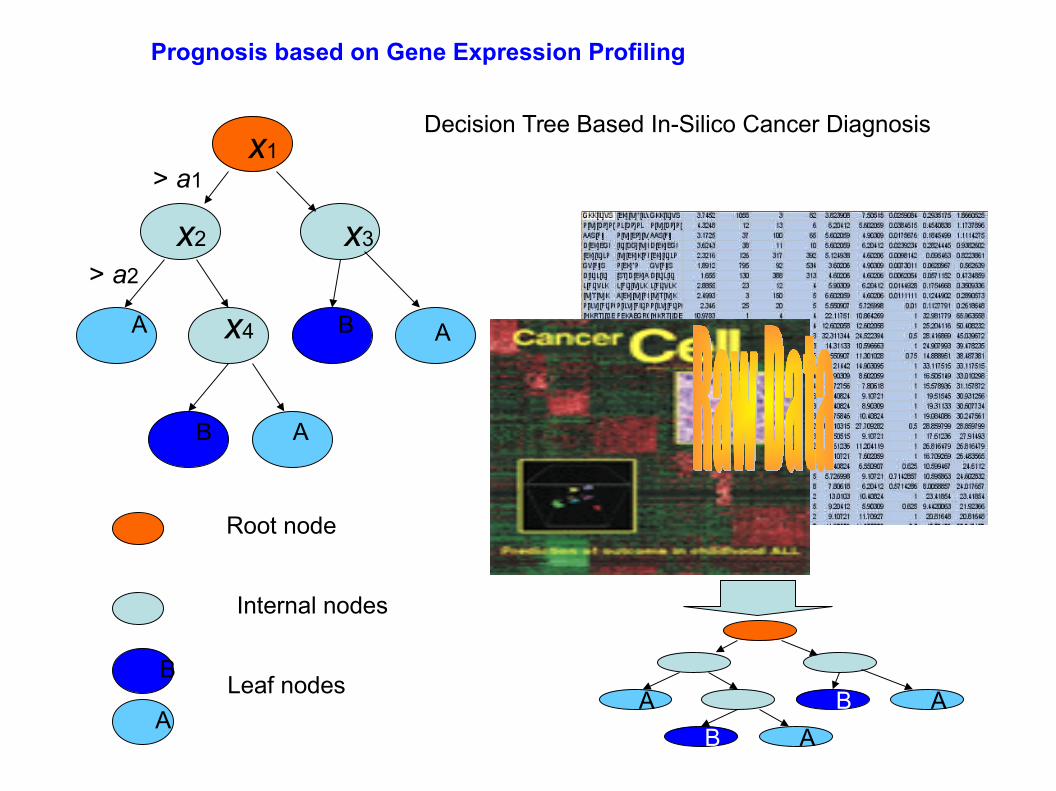
Decision Tree Based In-Silico Cancer Diagnosis
A B A
B A
x1
x2
x4
x3
> a1
> a2
Leaf nodes
Internal nodes
Root node
B
AA
B
B A
A
Prognosis based on Gene Expression Profiling

Discovery of Diagnostic Biomarkers for Ovarian Cancer
● Motivation: cure rate ~ 95% if correct diagnosis at early stage
● Proteomic profiling data obtained from patients’ serum samples
● The first data set by Petricoin et al was published in Lancet, 2002
● Data set of June-2002.● 253 samples: 91 controls
and 162 patients suffering from the disease; 15154 features (proteins, peptides, precisely, mass/charge identities)
SVM: 0 errors; Naïve Bayes: 19 errors; k-NN: 15 errors.

Mining Errors from Bio Databases
RECORD
SINGLE SOURCE DATABASE
Invalid values
Ambiguity
Incompatible schema
ATTRIBUTE
Uninformative sequences
Undersized sequences
Annotation error
Dubious sequences
Sequence redundancy
Data provenance flaws
Cross-annotation error
Sequence structure violation
Vector contaminated sequence
Erroneous data transformation
MULTIPLESOURCE DATABASE
• Among the 5,146,255 protein records queried using Entrez to the major protein or translated nucleotide databases , 3,327 protein sequences are shorter than four residues (as of Sep, 2004).
• In Nov 2004, the total number of undersized protein sequences increases to 3,350.
• Among 43,026,887 nucleotide records queried using Entrez to major nucleotide databases, 1,448 records contain sequences shorter than six bases (as of Sep, 2004).
• In Nov 2004, the total number of undersized nucleotide sequences increases to 1,711.
Example Meaningless Seqs

S(Seq)=1 ^ N(Seq Length)=1 ^ M(Species)=1 ^ M(PDB)=0 ^ M(DB)=0 (90.1%)Rule 7
S(Seq)=1 ^ M(Species)=1 ^ M(PDB)=0 ^ M(DB)=0 (90.4%)Rule 6
S(Seq)=1 ^ M(Seq Length)=1 ^ M(PDB)=0 ^ M(DB)=0 (92.8%)Rule 5
S(Seq)=1^ M(PDB)=0 ^ M(DB)=0 (93.1%)Rule 4
S(Seq)=1 ^ N(Seq Length)=1 ^ M(Species)=1 ^ M(PDB)=0 (96.8%)Rule 3
S(Seq)=1 ^ M(PDB)=0 ^ M(Species)=1 (97.1%)Rule 2
S(Seq)=1 ^ N(Seq Length)=1 ^ M(PDB)=0 (99.7%)Rule 1
Rule 1. Identical sequences with the same sequence length and not originated from PDB are 99.7% likely to be duplicates.
Rule 2. Identical sequences with the same sequence length and of the same species are 97.1% likely to be duplicates.
Rule 3. Identical sequences with the same sequence length, of the same species and not originated from PDB are 96.8% likely to be duplicates.
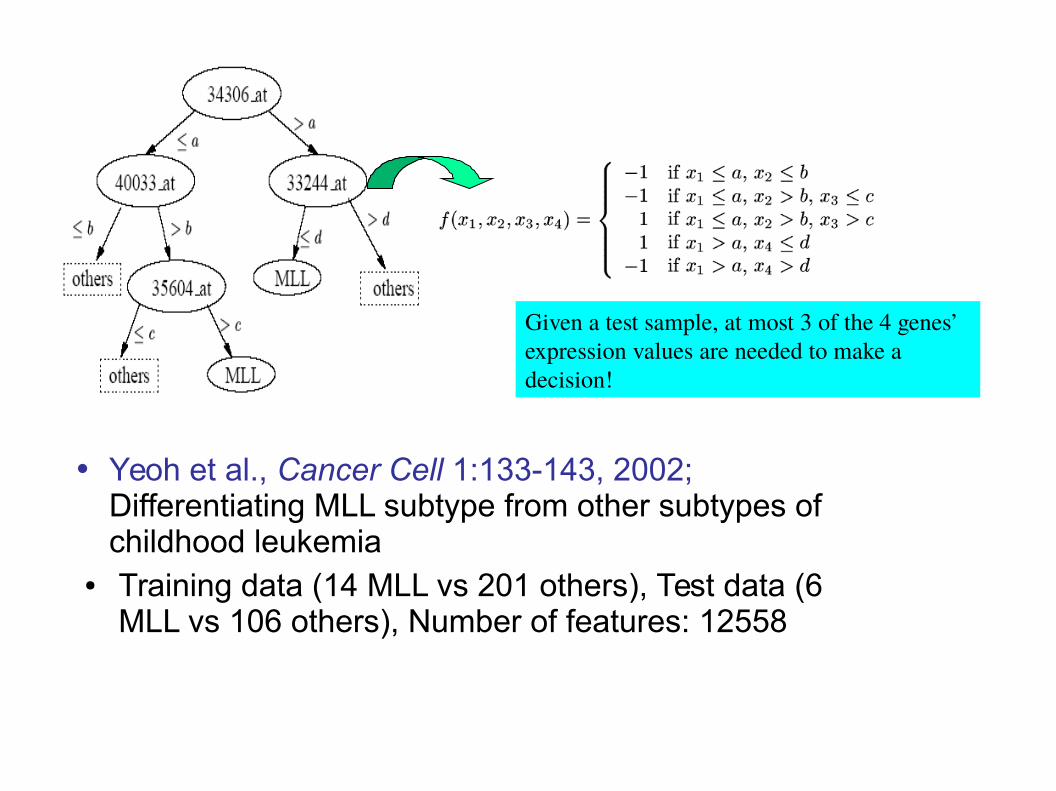
• Yeoh et al., Cancer Cell 1:133-143, 2002; Differentiating MLL subtype from other subtypes of childhood leukemia
● Training data (14 MLL vs 201 others), Test data (6 MLL vs 106 others), Number of features: 12558
Given a test sample, at most 3 of the 4 genes’ expression values are needed to make a decision!

Time since split
Australian
Papuan
Polynesian
Indonesian
Cherokee
Navajo
Japanese
Tibetan
English
Italian
Ethiopian
Mbuti PygmyAfrica
Europe
Asia
America
Oceania
Austalasia
Root
● Estimate order in which “populations” evolved
● Based on assimilated freq of many different genes
● But …– is human evolution a
succession of population fissions?
– Is there such thing as a proto-Anglo-Italian population which split, never to meet again, and became inhabitants of England and Italy?
Phylogenetic tree construction
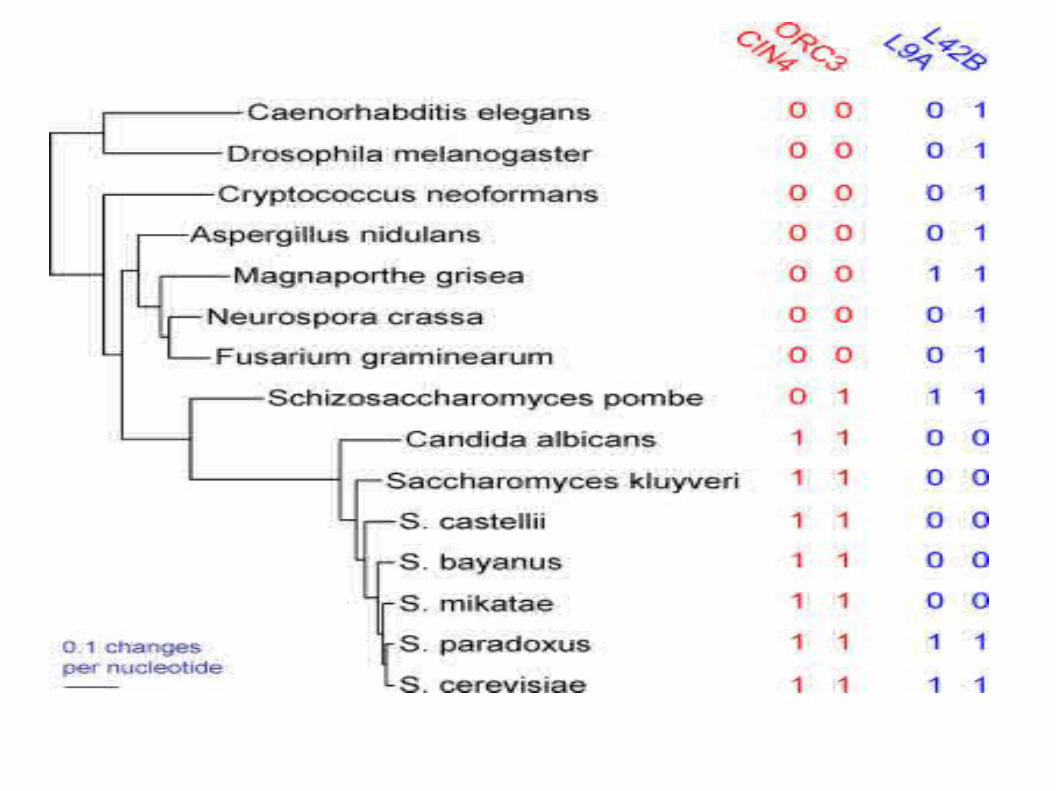

Predicting interactions using phylogenetic profile
Pellegrini et al. PNAS 96, 4285-4288 (1999)

Comparative genomics