Embed Size (px)
Citation preview

Preliminary version.
WHY DO SOME FIRMS CONTRACT OUT PRODUCTION?
A firm level panel data approach1
Carmen Díaz-Mora Angela Triguero University of Castilla-La Mancha University of Castilla-La Mancha Department of International Economics Department of International Economics Faculty of Juridical and Social Sciences Faculty of Economics and Business 45071-Toledo (SPAIN) 02071- Albacete (SPAIN) Phone/fax: +34 925 26 88 78 Phone/fax: +34 967 59 92 00 (ext. 2380) E-mail: Carmen.Dí[email protected] E-mail: [email protected] Abstract:
The present paper examines which factors determine outsourcing decision using firm-level
data for Spanish manufacturing industries. Outsourcing is measured as the manufacture of
custom-made finished products or parts and components which are been contracted out to
third parties. Moreover, we distinguish whether the firm provides the materials to the
independent firm or not. In our analysis we take into account the persistence in the firm’s
decision to outsource production as well as how some firm, industry and market
characteristics affect the likelihood of contracting out. Our results show that previous
subcontracting decision, wages, market changes, R&D activities, product and process
innovation, product differentiation, industry-size and exporter status affect positively the
current subcontracting decision.
JEL classification: D21, L23, L60.
Key words: Outsourcing, Subcontracting Decision, Firm-level panel data, Determinants,
Persistence, dynamic probit model.
August 2006
1 We are indebted to Rosario Gandoy for helpful suggestions. Financial support by the Consejería de Educación y Ciencia of the Junta de Comunidades de Castilla-La Mancha under the project PBI-05-021, cofinanced by FEDER funds, is gratefully acknowledged.
1

1. INTRODUCTION
Nowadays there is a broad consensus in academic literature about the meaning of
outsourcing which is defined as the act of transferring some of the company’s recurring
internal activities to outside providers through a contractual arrangement (WTO, 2005). The
term outside refers to external to the boundaries of the company, that is, outsourcing is
opposed to vertically integrated production. Moreover, as Grossman and Helpman (2005)
note “outsourcing means more than just the purchases of raw materials and standardized
intermediate goods” because an specific characteristic of outsourcing is that the relationship
between the firm which contracts out production and external provider is long-term and it
usually implies sharing information about the product. For this reason, purchases of
intermediate inputs through a usual marketing channel have not to be regarded as outsourcing.
We focus on outsourcing of production which here includes the manufacturing of
custom-made finished products or parts and components which are been contracted out to
third parties. The processing of the segmented production is carried out following the main
contractor’s specifications. This definition corresponds to a particular type of outsourcing, the
subcontracting, where the relationship developed between the principal and the third-party
company is of a "dominant/dominated" nature. Nevertheless, outsourcing could also imply a
more strict collaboration between firms involved, that is, create a partnership. Therefore,
among outsourcing transactions, different degrees of managerial controllability over
outsourced production exist; whereas subcontracting usually implies certain level of
controllability, in other outsourcing arrangements the controllability is weaker (Kimura and
Ando, 2005).
The object of this paper is to study the determinants of subcontracting production
using firm level panel data for Spanish manufacturing industries. Although both academic
literature and business press have paid great attention to the increasing relevance of this
strategy in the world economy, empirical research about its determinants remains limited. Our
work contributes to the academic literature analyzing the subcontracting decision. A standard
discrete variable of outsourcing presence/absence is urged by the nature of our sample where
more than half of the surveyed firms do not contract out production. Moreover, since a high
proportion of firms are inactive in subcontracting, we must consider the existence of fixed
entry costs for subcontracting. According to the theoretical model by Grossman and Helpman
(2002), transaction costs are a key difficulty in adopting outsourcing strategy and the presence
of them would imply persistence in the outsourcing decision. So, the impact of previous
2

subcontracting decision on current subcontracting decision is taking into account in our model
about determinants. And finally, as far as authors know, it is the first paper which
distinguishes if the main contractor provides or not the materials to the subcontracting firm.
2. DATA AND DESCRIPTIVE ANALYSIS.
Outsourcing data are obtained from the Survey of Business Strategy (Encuesta sobre
Estrategias Empresariales in Spanish, ESEE hereafter), a panel survey which offers
information about Spanish firms’ strategies for the period 1990-2002. The Survey provides
data on many relevant firm characteristics. The ESEE is a representative sample of the
population of Spanish manufacturing firms with 10 or more employees and belonging to the
manufacturing industry. The selection is carried out combining exhaustiveness in the case of
firms which have over 200 employees and random sampling criteria for firms which employ
between 10 and 200 workers. In the first year, 1990, 2,188 firms were interviewed along the
above mentioned criteria (1,724 firms in 2002). In order to maintain its representativeness
with regard to the population of reference, particular efforts have been made. On the one
hand, to reducing as far as possible the deterioration of the initial sample, trying to avoid the
reduction of the firms' collaboration. And on the other, to including each year into the sample
all the newly incorporated firms which employ over 200 workers, as well as a randomly
selected sample which represents around 5% of the newly incorporated firms which have
between 10 and 200 employees2.
In relation to outsourcing, surveyed firms give information about if they outsourcing
manufacturing or not and about the value of the contracted out production. The Survey
distinguishes two types of outsourcing depending whether the firm provides the materials to
the supplier or not. The second type implies a greater independence of the subcontracting firm
which has a higher degree of control over the materials.
With this information, we select exclusively those firms that respond the questions
about outsourcing (about 1,800 firms each year). In an additional step, we discriminate three
types of firms that subcontract production: firms that subcontract only providing the
materials; firms that subcontract only without providing the materials; and firms that do both
types of subcontracting (mixed subcontracting). As cited above, previous works that analyse
subcontracting behaviour do not distinguish by type of subcontracting arrangement.
2 See Fariñas and Jaumandreu (1999) and www.funep.es for further details about ESEE.
3

Chart 1 reflects the evolution of outsourcing decision in 1991-20023. Our results do
not show a growing trend in the proportion of firms that decide to outsource production. The
percentage of firms that subcontract production is about 45% along the period. That is, almost
one of every two Spanish manufacturing firms has contracted out parts, components and
finished products to independent providers. The stability in the proportion of firms that take
the decision to subcontract production is not a question of type of subcontracting because it is
common to all of them. Moreover, there are not differences in the percentage of firms doing
outsourcing if we distinguish between subcontracting with and without materials: around 20
per cent of surveyed firms get involved in any type of subcontracting arrangement. Lastly, 10
per cent of firms use both types of subcontracting at the same time.
Chart 1: Evolution of subcontracting decision, 1991-2002(Percentage of surveyed firms that subcontract)
0%
10%
20%
30%
40%
50%
1991 1992 1993 1994 1995 1996 1997 1998 1999 2000 2001 2002
Subc. with materials Subc. without materialsSubcontracting Mixed subcontracting
Source: Survey on Business Strategies (ESEE)
Chart 2 presents the subcontracting decision by firm size. It can be observed that
outsourcing strategy is more relevant in larger firms (more than 200 workers), where around
55 percent of them contracted out production. Relative to smaller firms (less than 200
workers), nearly 40 percent of them do outsourcing. This positive relationship between firm
size and subcontracting behavior has been found in previous works (Kimura, 2001; Holl,
2004; Tomiura, 2005). To explain this result, it can be argued that large firms face to lower
fixed entry cost for outsourcing. The changes along the period in the proportion of firms by
size involved in subcontracting are minor.
3 We have decided to omit the first year of the ESEE, 1990, due to the lack of information about the value of production which has been contracted out.
4
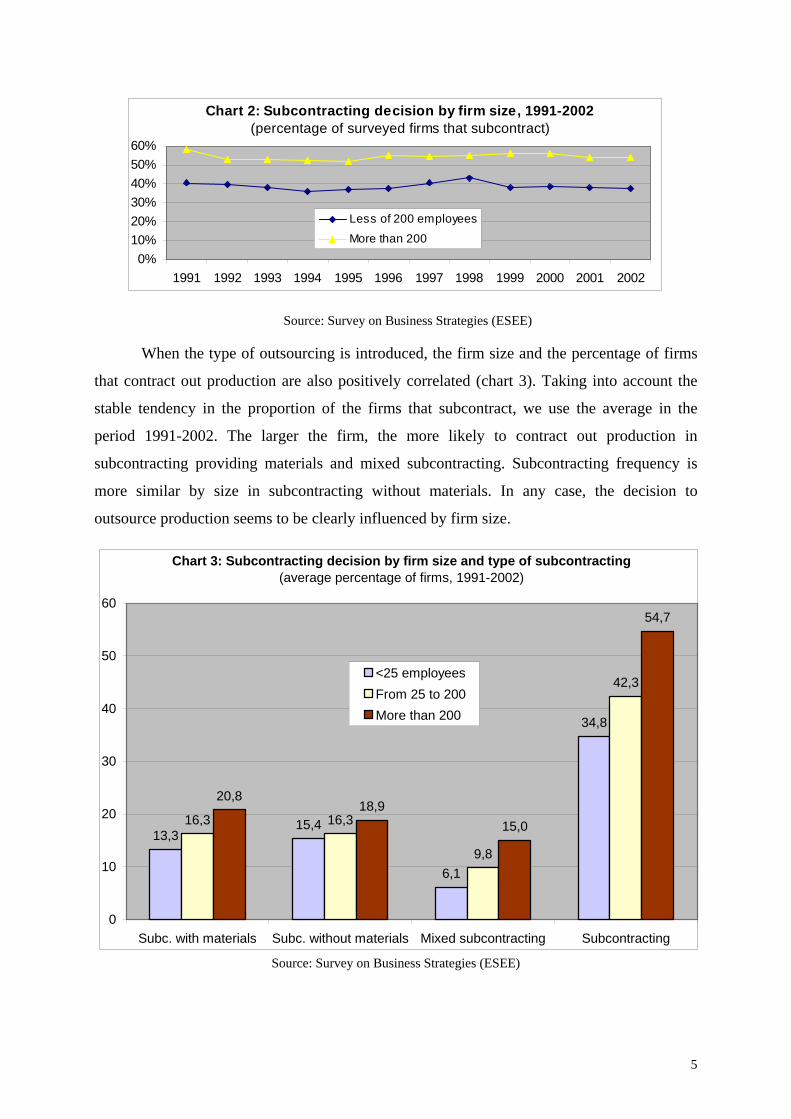
Chart 2: Subcontracting decision by firm size, 1991-2002(percentage of surveyed firms that subcontract)
0%10%20%30%40%50%60%
1991 1992 1993 1994 1995 1996 1997 1998 1999 2000 2001 2002
Less of 200 employees
More than 200
Source: Survey on Business Strategies (ESEE)
When the type of outsourcing is introduced, the firm size and the percentage of firms
that contract out production are also positively correlated (chart 3). Taking into account the
stable tendency in the proportion of the firms that subcontract, we use the average in the
period 1991-2002. The larger the firm, the more likely to contract out production in
subcontracting providing materials and mixed subcontracting. Subcontracting frequency is
more similar by size in subcontracting without materials. In any case, the decision to
outsource production seems to be clearly influenced by firm size.
Chart 3: Subcontracting decision by firm size and type of subcontracting(average percentage of firms, 1991-2002)
13,315,4
6,1
34,8
16,3 16,3
9,8
42,3
20,818,9
15,0
54,7
0
10
20
30
40
50
60
Subc. with materials Subc. without materials Mixed subcontracting Subcontracting
<25 employeesFrom 25 to 200More than 200
Source: Survey on Business Strategies (ESEE)
5
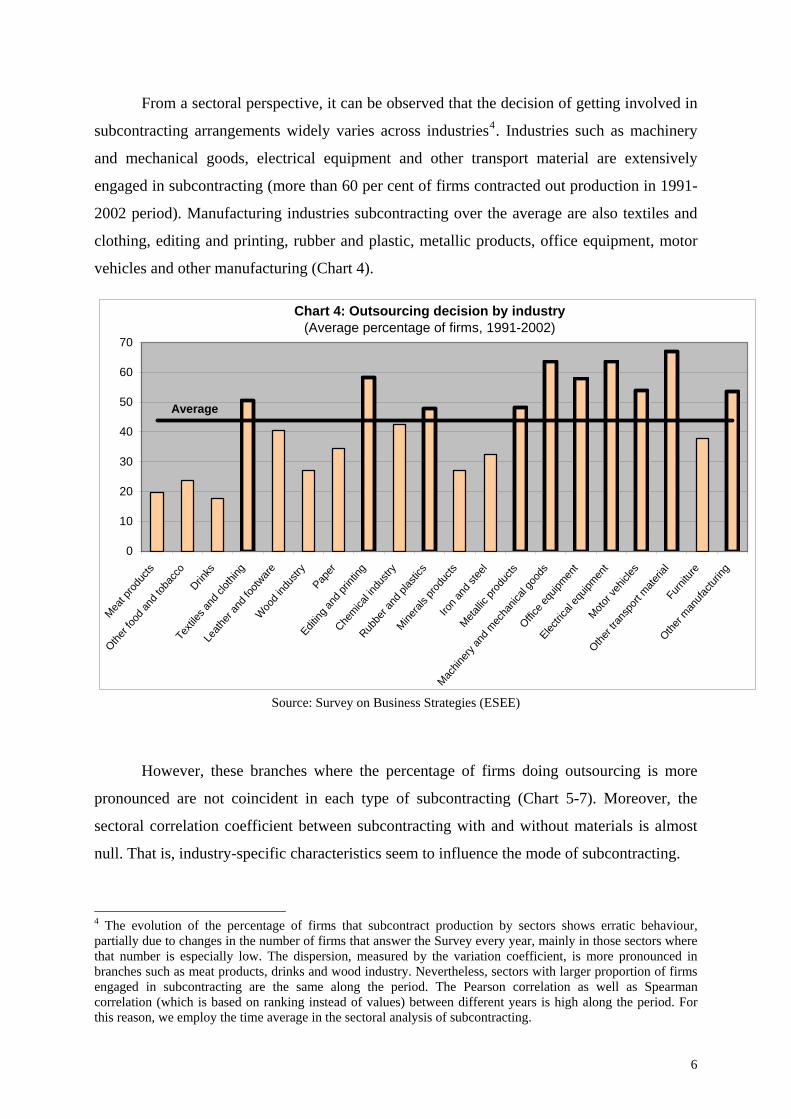
From a sectoral perspective, it can be observed that the decision of getting involved in
subcontracting arrangements widely varies across industries4. Industries such as machinery
and mechanical goods, electrical equipment and other transport material are extensively
engaged in subcontracting (more than 60 per cent of firms contracted out production in 1991-
2002 period). Manufacturing industries subcontracting over the average are also textiles and
clothing, editing and printing, rubber and plastic, metallic products, office equipment, motor
vehicles and other manufacturing (Chart 4).
Chart 4: Outsourcing decision by industry(Average percentage of firms, 1991-2002)
0
10
20
30
40
50
60
70
Meat p
roduc
ts
Other f
ood a
nd to
bacc
oDrin
ks
Texti
les an
d clot
hing
Leath
er an
d foo
twar
eW
ood i
ndus
tryPap
er
Editing
and p
rintin
g
Chemica
l indu
stry
Rubbe
r and
plas
tics
Mineral
s pro
ducts
Iron a
nd st
eel
Metallic
prod
ucts
Machin
ery a
nd m
echa
nical
good
s
Office e
quipm
ent
Electric
al eq
uipmen
tMoto
r veh
icles
Other t
ransp
ort m
ateria
lFu
rnitu
re
Other m
anufa
cturin
g
Average
Source: Survey on Business Strategies (ESEE)
However, these branches where the percentage of firms doing outsourcing is more
pronounced are not coincident in each type of subcontracting (Chart 5-7). Moreover, the
sectoral correlation coefficient between subcontracting with and without materials is almost
null. That is, industry-specific characteristics seem to influence the mode of subcontracting.
4 The evolution of the percentage of firms that subcontract production by sectors shows erratic behaviour, partially due to changes in the number of firms that answer the Survey every year, mainly in those sectors where that number is especially low. The dispersion, measured by the variation coefficient, is more pronounced in branches such as meat products, drinks and wood industry. Nevertheless, sectors with larger proportion of firms engaged in subcontracting are the same along the period. The Pearson correlation as well as Spearman correlation (which is based on ranking instead of values) between different years is high along the period. For this reason, we employ the time average in the sectoral analysis of subcontracting.
6

The frequency of subcontracting with materials is particularly large in textiles and
clothing (35 per cent of firms) and in leather and shoes, editing and printing, chemistry,
electrical equipment and other manufacturing industries (around 20-25 per cent). Related to
subcontracting without materials, editing and printing, rubber and plastics, metallic products,
machinery and mechanical goods, office equipment, electrical equipment, motor vehicles,
other transport material and furniture are the branches with higher percentage of firms that
decide subcontracting (20-25 per cent). So, only two sectors are common in two groups
(editing and printing and electrical equipment). In the first case, editing and printing, two
modes of subcontracting (providing and without providing materials) are very frequent and
they are alternative strategies because firms choose one or another type but they hardly do
mixed subcontracting. In the second case, electrical equipment, the percentage of firms that
subcontracts is over the average in the three subcontracting modes. So, we can infer that there
are not industry-specific characteristics which favor one particular mode of subcontracting.
Notable differences are found in textiles and clothing, leather and shoes, chemistry and
other manufacturing where subcontracting decision is highly frequent but it is very biased to
subcontracting providing materials. These branches, except chemistry, are labor intensive
with low skill requirements. Here, the competition in prices is very important and competitive
advantages are associated to the quality of materials, the design of products, etc. For this
reason, it is very important to control the materials used and the main contractor prefers to
provide them to the subcontracting firm. On the contrary, metallic products, machinery and
mechanical goods, office equipment, motor vehicles and other transport material clearly show
up in subcontracting without materials but do not in subcontracting with materials. These are
industries with higher technological content and higher skill where the most standardized
production stages, which are not the core competences of the firm, are contracted out and the
need to control the materials diminishes. By other hand, there is a high correlation between
mixed subcontracting and subcontracting without materials from a sectoral point of view. The
same branches show up in both types although the percentage of firms that do mixed
subcontracting are sensitively lower: only in machinery and mechanical goods and other
transport equipment the proportion exceeds the threshold of 20 per cent. At last, firms belong
to natural recourses intensive industries are less prone to contract out production .
7

Chart 5: Subcontracting (providing materials) decision by industry(average percentage of firms, 1991-2002)
0%5%
10%15%20%25%30%35%40%
Meat p
roduc
ts
Other fo
od an
d tob
acco
Drinks
Textile
s and
cloth
ing
Leath
er an
d foo
tware
Woo
d ind
ustry
Paper
Editing
and p
rintin
g
Chemica
l indu
stry
Rubbe
r and
plas
tics
Mineral
s prod
ucts
Iron a
nd st
eel
Metallic
prod
ucts
Machin
ery an
d mec
hanic
..
Office e
quipm
ent
Electric
al eq
uipmen
t
Motor v
ehicl
es
Other tr
ansp
ort m
ateria
lFurn
iture
Other m
anufa
cturin
g
Average
Chart 6: Subcontracting (without materials) decision by industry(average percentage of firms, 1991-2002)
0%5%
10%15%20%25%30%35%
Meat p
roduc
ts
Other fo
od an
d tob
acco
Drinks
Textile
s and
cloth
ing
Leath
er an
d foo
tware
Wood i
ndus
tryPap
er
Editing
and p
rintin
g
Chemica
l indu
stry
Rubbe
r and
plas
tics
Mineral
s prod
ucts
Iron a
nd st
eel
Metallic
prod
ucts
Machin
ery an
d mec
hanic
al...
Office e
quipm
ent
Electric
al eq
uipmen
t
Motor v
ehicle
s
Other tr
ansp
ort m
ateria
l
Furnitu
re
Other m
anufa
cturin
g
Average
Chart 7: Mixed Subcontracting decision by industry(average percentage of firms, 1991-2002)
0%5%
10%15%20%25%30%
Meat p
roduc
ts
Other fo
od an
d tob
acco
Drinks
Textile
s and
cloth
ing
Leath
er an
d foo
tware
Wood i
ndus
tryPap
er
Editing
and p
rintin
g
Chemica
l indu
stry
Rubbe
r and
plas
tics
Mineral
s prod
ucts
Iron a
nd st
eel
Metallic
prod
ucts
Machin
ery an
d mec
hanic
al...
Office e
quipm
ent
Electric
al eq
uipmen
t
Motor v
ehicl
es
Other tr
ansp
ort m
ateria
l
Furnitu
re
Other m
anufa
cturin
g
Average
Source: Survey on Business Strategies (ESEE)
According to our analysis, the percentage of firms that subcontracts production is not
coincident between large and small firms and among industries. So, the subcontracting
8

decision depends on firm size as well as on particular characteristics of each industry.
Furthermore the three modes of subcontracting differ in importance by industry. That is,
industry-specific factors such as the productive process and market-specific characteristics
seem to determine the type of subcontracting agreement.
Subcontracting intensity analysis.
We also analyse the intensity of subcontracting from a sectoral and time perspective.
Outsourcing intensity is computed as the ratio of these production activities contracted to
other firms to the value of the total intermediate purchases. The subcontracting intensity is
around 21 per cent of intermediate consumption. When types of subcontracting are
distinguished, intensity is higher for firms which do mixed subcontracting (almost 30 per cent
of intermediate purchases). Subcontracting without materials is more intensive than
subcontracting with materials although the gap has tended to narrow in the last years (Chart
8).
Chart 8: Evolution of subcontracting intensity, 1991-2002(Subcontracting over intermediate purchases)
0
3
6
9
12
15
18
21
24
27
30
1991 1992 1993 1994 1995 1996 1997 1998 1999 2000 2001 2002
Subc. with materialsSubc. without materialsSubcontractingMixed subcontracting
Source: Survey on Business Strategies (ESEE)
Taking into account the firm size, our data show a negative correlation between firm
size and subcontracting intensity (Chart 9). The smaller the firm, the more intensive is the
subcontracting strategy. The larger differences by size are observed in subcontracting
providing materials. However, the gap is minimum when the firm subcontracts without
providing materials. That is, the influence of firm size on subcontracting intensity depends on
the type of subcontracting arrangement.
9
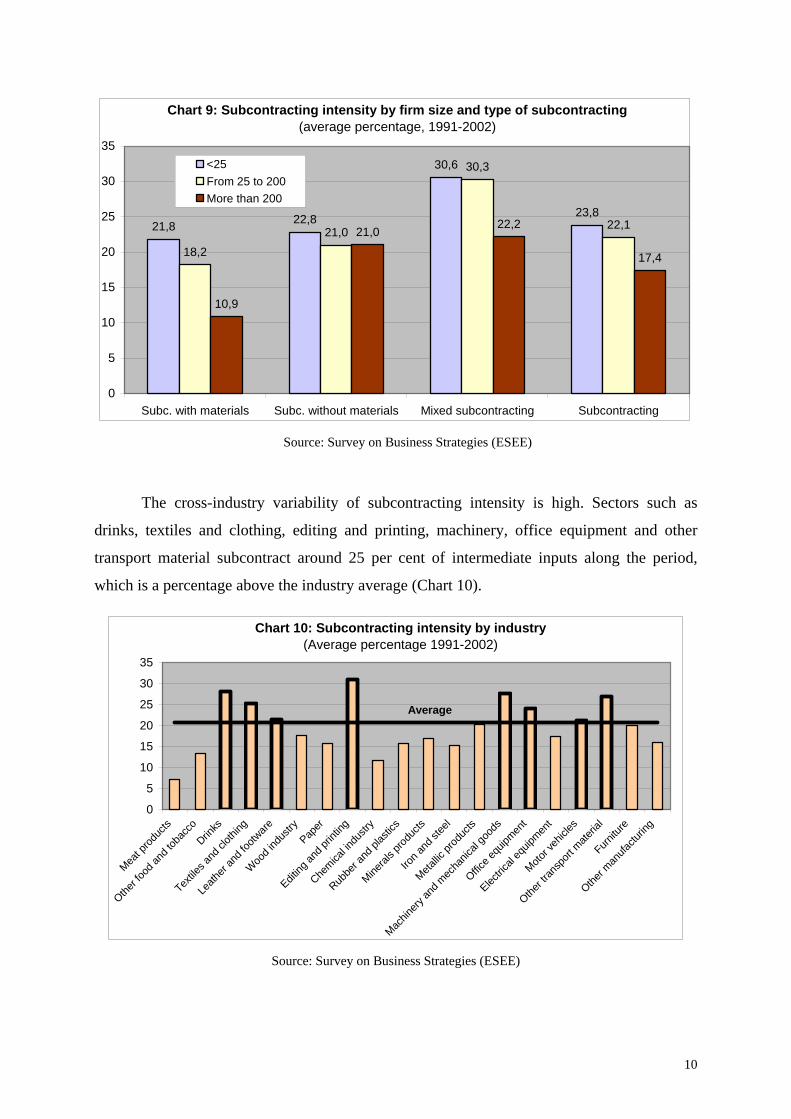
Chart 9: Subcontracting intensity by firm size and type of subcontracting(average percentage, 1991-2002)
21,8 22,8
30,6
23,8
18,221,0
30,3
22,1
10,9
21,022,2
17,4
0
5
10
15
20
25
30
35
Subc. with materials Subc. without materials Mixed subcontracting Subcontracting
<25From 25 to 200More than 200
Source: Survey on Business Strategies (ESEE)
The cross-industry variability of subcontracting intensity is high. Sectors such as
drinks, textiles and clothing, editing and printing, machinery, office equipment and other
transport material subcontract around 25 per cent of intermediate inputs along the period,
which is a percentage above the industry average (Chart 10).
Chart 10: Subcontracting intensity by industry(Average percentage 1991-2002)
0
5
10
15
20
25
30
35
Meat p
roduc
ts
Other fo
od an
d tob
acco
Drinks
Textile
s and
cloth
ing
Leath
er an
d foo
tware
Wood i
ndus
tryPap
er
Editing
and p
rintin
g
Chemica
l indu
stry
Rubbe
r and
plas
tics
Mineral
s prod
ucts
Iron a
nd st
eel
Metallic
prod
ucts
Machin
ery an
d mec
hanic
al go
ods
Office e
quipm
ent
Electric
al eq
uipmen
t
Motor v
ehicle
s
Other tr
ansp
ort m
ateria
l
Furnitu
re
Other m
anufa
cturin
g
Average
Source: Survey on Business Strategies (ESEE)
10
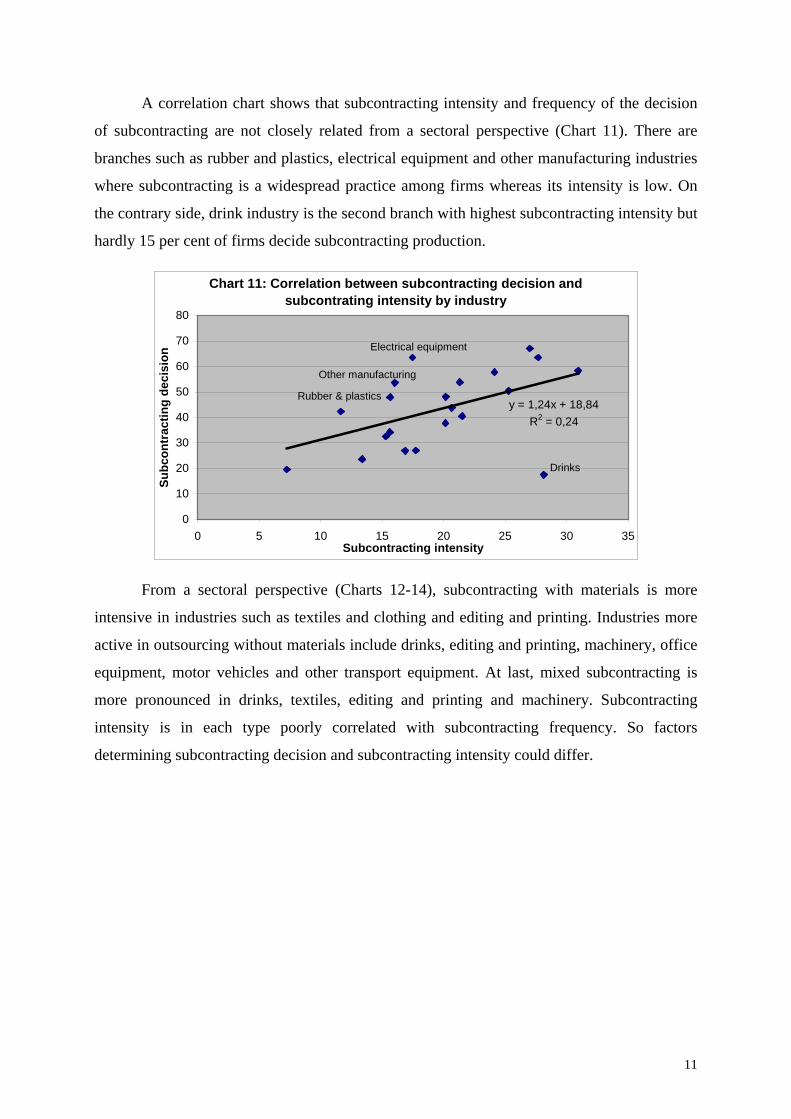
A correlation chart shows that subcontracting intensity and frequency of the decision
of subcontracting are not closely related from a sectoral perspective (Chart 11). There are
branches such as rubber and plastics, electrical equipment and other manufacturing industries
where subcontracting is a widespread practice among firms whereas its intensity is low. On
the contrary side, drink industry is the second branch with highest subcontracting intensity but
hardly 15 per cent of firms decide subcontracting production.
Chart 11: Correlation between subcontracting decision and subcontrating intensity by industry
y = 1,24x + 18,84R2 = 0,24
0
10
20
30
40
50
60
70
80
0 5 10 15 20 25 30 35Subcontracting intensity
Subc
ontr
actin
g de
cisi
on
Drinks
Rubber & plastics
Electrical equipment
Other manufacturing
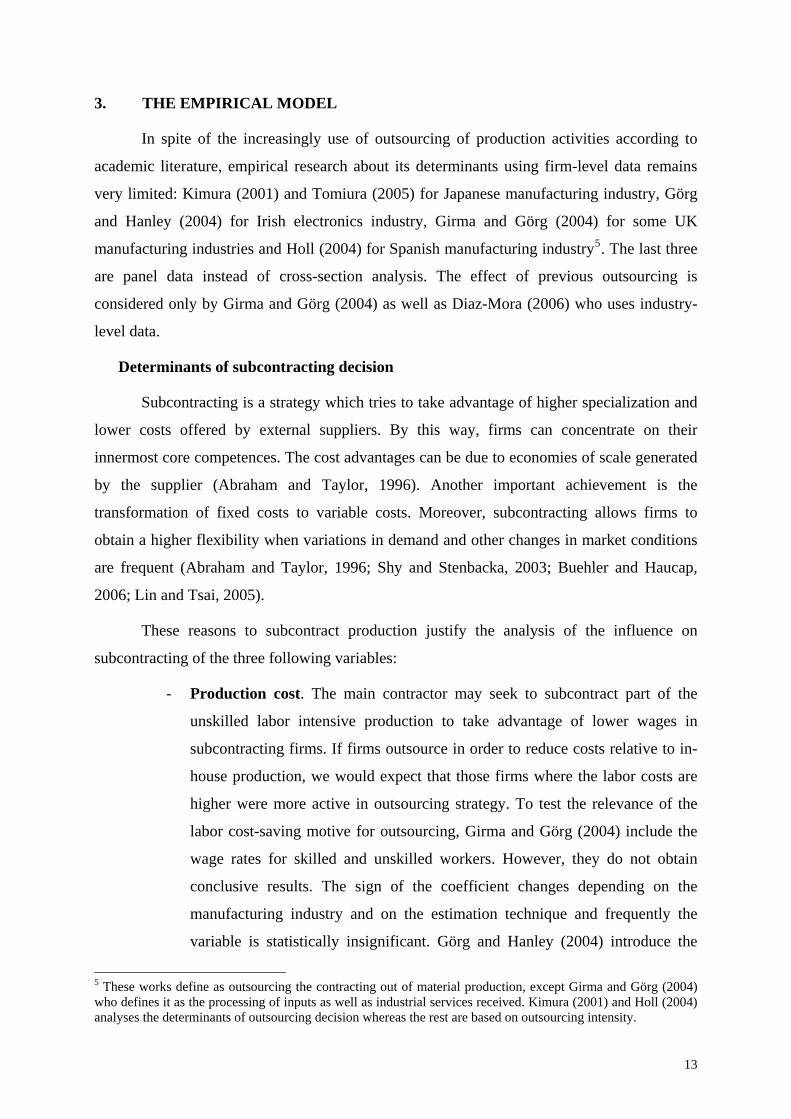
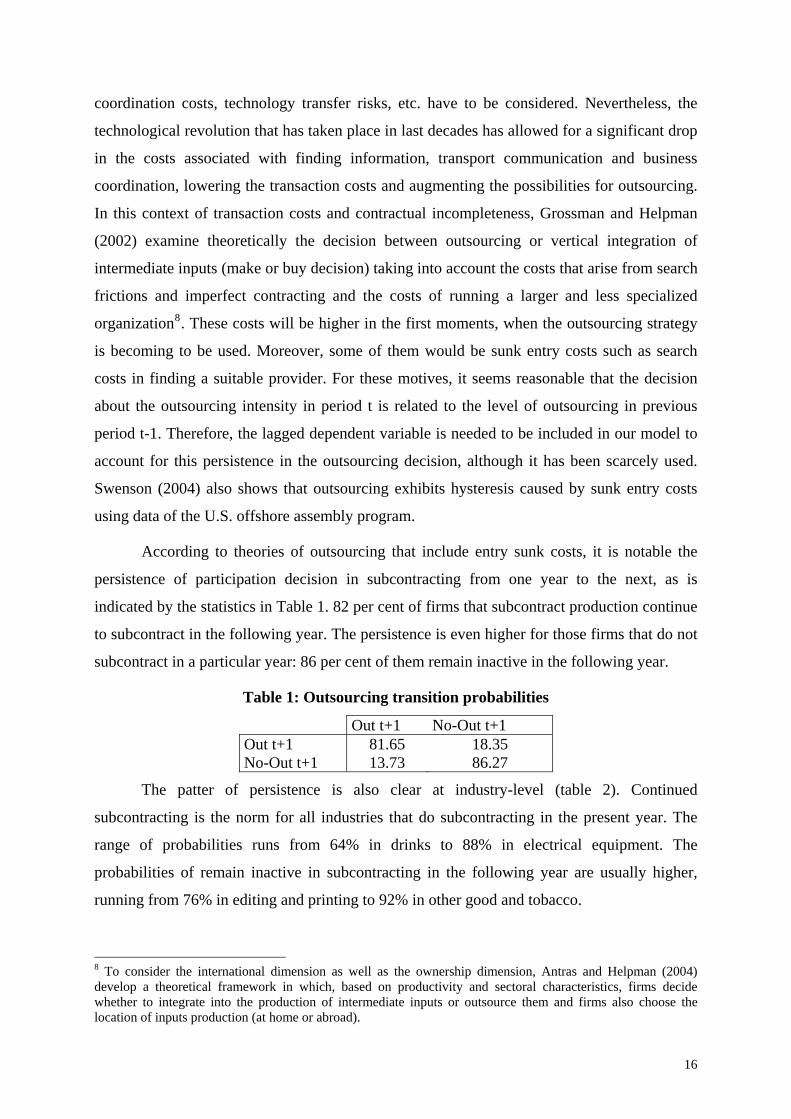
From a sectoral perspective (Charts 12-14), subcontracting with materials is more
intensive in industries such as textiles and clothing and editing and printing. Industries more
active in outsourcing without materials include drinks, editing and printing, machinery, office
equipment, motor vehicles and other transport equipment. At last, mixed subcontracting is
more pronounced in drinks, textiles, editing and printing and machinery. Subcontracting
intensity is in each type poorly correlated with subcontracting frequency. So factors
determining subcontracting decision and subcontracting intensity could differ.
11
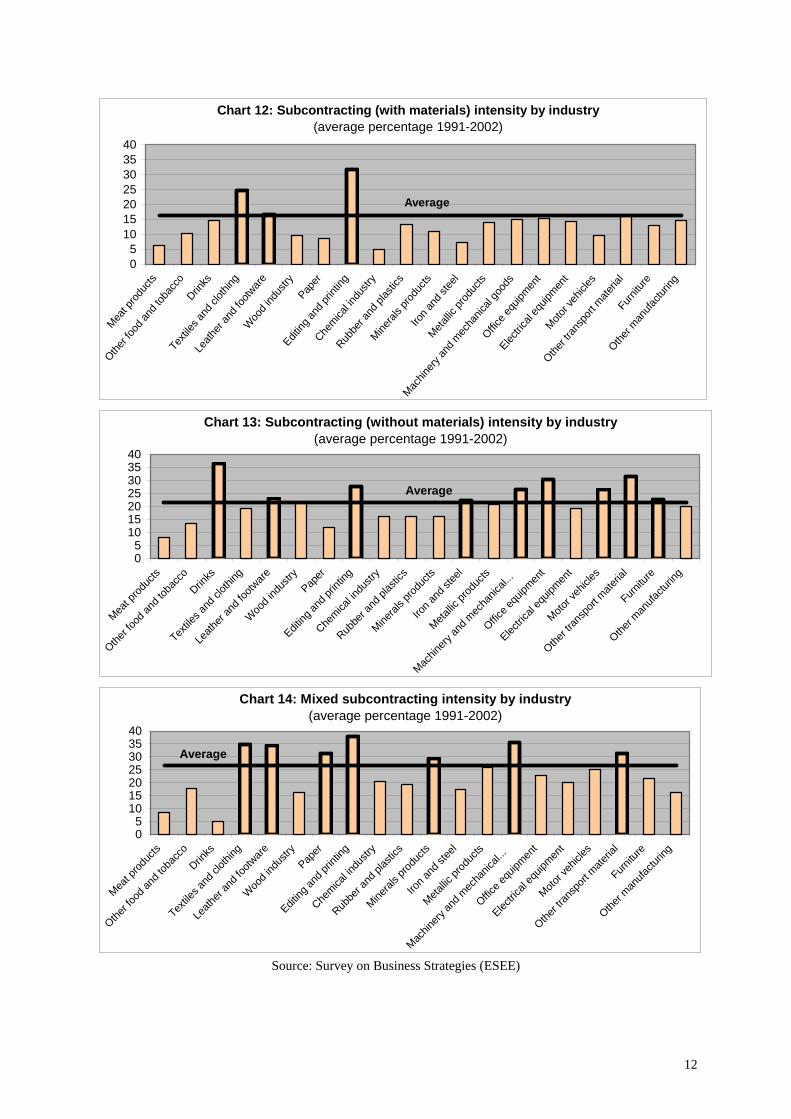
Chart 12: Subcontracting (with materials) intensity by industry(average percentage 1991-2002)
05
10152025303540
Meat p
roduc
ts
Other fo
od an
d tob
acco
Drinks
Texti
les an
d clot
hing
Leath
er an
d foo
twar
eW
ood i
ndus
tryPap
er
Editing
and p
rintin
g
Chemica
l indu
stry
Rubbe
r and
plas
tics
Mineral
s prod
ucts
Iron a
nd st
eel
Metallic
prod
ucts
Machin
ery an
d mec
hanic
al go
ods
Office e
quipm
ent
Electric
al eq
uipmen
tMoto
r veh
icles
Other tr
ansp
ort m
ateria
lFu
rnitur
e
Other m
anufa
cturin
g
Average
Chart 13: Subcontracting (without materials) intensity by industry(average percentage 1991-2002)
05
10152025303540
Meat p
roduc
ts
Other fo
od an
d tob
acco
Drinks
Textile
s and
cloth
ing
Leath
er an
d foo
tware
Wood i
ndus
tryPap
er
Editing
and p
rintin
g
Chemica
l indu
stry
Rubbe
r and
plas
tics
Mineral
s prod
ucts
Iron a
nd st
eel
Metallic
prod
ucts
Machin
ery an
d mec
hanic
al...
Office e
quipm
ent
Electric
al eq
uipmen
t
Motor v
ehicle
s
Other tr
ansp
ort m
ateria
l
Furnitu
re
Other m
anufa
cturin
g
Average
Chart 14: Mixed subcontracting intensity by industry(average percentage 1991-2002)
05
10152025303540
Meat p
roduc
ts
Other fo
od an
d tob
acco
Drinks
Textile
s and
cloth
ing
Leath
er an
d foo
tware
Wood i
ndus
tryPap
er
Editing
and p
rintin
g
Chemica
l indu
stry
Rubbe
r and
plas
tics
Mineral
s prod
ucts
Iron a
nd st
eel
Metallic
prod
ucts
Machin
ery an
d mec
hanic
al...
Office e
quipm
ent
Electric
al eq
uipmen
t
Motor v
ehicle
s
Other tr
ansp
ort m
ateria
l
Furnitu
re
Other m
anufa
cturin
g
Average
Source: Survey on Business Strategies (ESEE)
12
3. THE EMPIRICAL MODEL
In spite of the increasingly use of outsourcing of production activities according to
academic literature, empirical research about its determinants using firm-level data remains
very limited: Kimura (2001) and Tomiura (2005) for Japanese manufacturing industry, Görg
and Hanley (2004) for Irish electronics industry, Girma and Görg (2004) for some UK
manufacturing industries and Holl (2004) for Spanish manufacturing industry5. The last three
are panel data instead of cross-section analysis. The effect of previous outsourcing is
considered only by Girma and Görg (2004) as well as Diaz-Mora (2006) who uses industry-
level data.
Determinants of subcontracting decision
Subcontracting is a strategy which tries to take advantage of higher specialization and
lower costs offered by external suppliers. By this way, firms can concentrate on their
innermost core competences. The cost advantages can be due to economies of scale generated
by the supplier (Abraham and Taylor, 1996). Another important achievement is the
transformation of fixed costs to variable costs. Moreover, subcontracting allows firms to
obtain a higher flexibility when variations in demand and other changes in market conditions
are frequent (Abraham and Taylor, 1996; Shy and Stenbacka, 2003; Buehler and Haucap,
2006; Lin and Tsai, 2005).
These reasons to subcontract production justify the analysis of the influence on
subcontracting of the three following variables:
- Production cost. The main contractor may seek to subcontract part of the
unskilled labor intensive production to take advantage of lower wages in
subcontracting firms. If firms outsource in order to reduce costs relative to in-
house production, we would expect that those firms where the labor costs are
higher were more active in outsourcing strategy. To test the relevance of the
labor cost-saving motive for outsourcing, Girma and Görg (2004) include the
wage rates for skilled and unskilled workers. However, they do not obtain
conclusive results. The sign of the coefficient changes depending on the
manufacturing industry and on the estimation technique and frequently the
variable is statistically insignificant. Görg and Hanley (2004) introduce the
5 These works define as outsourcing the contracting out of material production, except Girma and Görg (2004) who defines it as the processing of inputs as well as industrial services received. Kimura (2001) and Holl (2004) analyses the determinants of outsourcing decision whereas the rest are based on outsourcing intensity.
13

average wage per employee and they also find that the effect of wages is
statistically insignificant and not robust to different estimation techniques. Holl
(2004) does obtain a positive and significant coefficient of the wages as well as
Diaz-Mora (2006) who uses the unit labor costs.
- Firm size. The existence of economies of scale in the production of
intermediate inputs implies that firm size variable have to be considered to
control for this scale economies effect. Since small and medium enterprises
will have more difficulties to reap the minimum efficient scale, they will opt
more intensively for outsourcing. But, taking into account that outsourcing
increases firm’s capacity for adaptation and flexibility, it can be argued that
large firms are more likely to carry out this process of vertically de-integration
of production structures. Another reason to expect a positive relationship
between firm size and outsourcing is proposed by Tomiura (2005), who
suggests that smaller firms could face to higher search costs, that is, due to
stronger market power large firms might find contracting partners more easily.
As a consequence, the sign of firm size cannot be predicted a priori. Whereas
empirical works such as Holl (2004) have obtained positive coefficients, the
sign is negative in Görg and Hanley (2004). This last study, however, excludes
small firms because it uses a Survey that provides information only for firms
with thirty or more employees. Kimura (2001) and Diaz-Mora (2006) do not
obtain a significant coefficient for firm size.
- Variations in demand and other changes in market conditions. Although
cost-savings motive, specialization and scale economies explain a wide part of
the increasing outsourcing, changes in market conditions need to be considered
to provide us a full perspective on what is happening. The more frequent these
changes occur, the more necessary outsourcing strategy becomes in order to
obtain higher flexibility. In this sense, a variable measuring changes in the
market conditions is introduced as factor that leads firms to subcontract.
Specifically, the following variations are considered within changes in the
market conditions: changes in own output prices, changes in national
competitors’ prices, changes in prices of similar imported products, changes in
the market due to entry of new players, changes in the market due to increase
or decrease in demand and changes in the market due to other motives. This is
14

a dummy variable coded 1 if the surveyed firm shows a change in some of the
above market conditions and 0 if does not. Holl (2004) includes a dummy
variable to control for demand variations but she focus on the changes in the
market share of the firm. The coefficient obtained is positive and significant.
Moreover, as Lin and Tsai (2005) point, a changing market environment
increases the search for flexibility and the emphasis on core competences,
offering an explanation for the growing outsourcing activities, in particular,
when the products are characterized by a higher technological content.
Therefore, subcontracting is becoming very important in firms producing
goods that are sophisticated, high tech and differentiated (Curzon Price,
2001)6. Moreover, they face a very competitive market where customers
demand highly differentiated products. These firms concentrate on R&D,
design and other skill intensive stages of production and they subcontract most
of their physical production. For these firms, subcontracting is a way of
flexible mode of production which allows them to take advantage of
specialized producers. To take into account this argument for subcontracting,
we introduce dummy variables which take the value 1 if the firm does process
innovation, product innovation and R&D activities and if the firm offers a
product specifically design for the customer (a differentiated product),
expecting a positive relationship between these firm’s characteristics and the
propensity to contract out production7. These variables are hardly included in
previous empirical works about determinants of subcontracting. Only Tomiura
(2005) considers the variable R&D expenditures obtaining that outsourcing is
positively related to this variable.
The subcontracting decision also depends on other variables. One of the most
important is the entity of the transaction costs. According to transaction cost theory (Coase,
1937; Williamson, 1975), outsourcing would entail a variety of transaction costs associated
with various aspects of inter-firm transactions. Search costs to find the right supplier,
negotiation costs, costs to design the contract and the incomplete contracts problem,
6 The author includes another type of firms where subcontracting is growing: firms producing goods not very sophisticated or difficult to make, where the labor-intensive stages of production are contracted out. These firms suffer a strong competence by low wage areas and they use subcontracting for cut-cutting motives. For them, wage is a determinant of subcontracting. 7 However, according to Grossman and Helpman (2002), the effect of product differentiation on outsourcing can be positive or negative depending on other parameters value.
15
coordination costs, technology transfer risks, etc. have to be considered. Nevertheless, the
technological revolution that has taken place in last decades has allowed for a significant drop
in the costs associated with finding information, transport communication and business
coordination, lowering the transaction costs and augmenting the possibilities for outsourcing.
In this context of transaction costs and contractual incompleteness, Grossman and Helpman
(2002) examine theoretically the decision between outsourcing or vertical integration of
intermediate inputs (make or buy decision) taking into account the costs that arise from search
frictions and imperfect contracting and the costs of running a larger and less specialized
organization8. These costs will be higher in the first moments, when the outsourcing strategy
is becoming to be used. Moreover, some of them would be sunk entry costs such as search
costs in finding a suitable provider. For these motives, it seems reasonable that the decision
about the outsourcing intensity in period t is related to the level of outsourcing in previous
period t-1. Therefore, the lagged dependent variable is needed to be included in our model to
account for this persistence in the outsourcing decision, although it has been scarcely used.
Swenson (2004) also shows that outsourcing exhibits hysteresis caused by sunk entry costs
using data of the U.S. offshore assembly program.
According to theories of outsourcing that include entry sunk costs, it is notable the
persistence of participation decision in subcontracting from one year to the next, as is
indicated by the statistics in Table 1. 82 per cent of firms that subcontract production continue
to subcontract in the following year. The persistence is even higher for those firms that do not
subcontract in a particular year: 86 per cent of them remain inactive in the following year.
Table 1: Outsourcing transition probabilities
Out t+1 No-Out t+1 Out t+1 81.65 18.35 No-Out t+1 13.73 86.27
The patter of persistence is also clear at industry-level (table 2). Continued
subcontracting is the norm for all industries that do subcontracting in the present year. The
range of probabilities runs from 64% in drinks to 88% in electrical equipment. The
probabilities of remain inactive in subcontracting in the following year are usually higher,
running from 76% in editing and printing to 92% in other good and tobacco.
8 To consider the international dimension as well as the ownership dimension, Antras and Helpman (2004) develop a theoretical framework in which, based on productivity and sectoral characteristics, firms decide whether to integrate into the production of intermediate inputs or outsource them and firms also choose the location of inputs production (at home or abroad).
16

Table 2: Outsourcing transition probabilities by industry
Positive Subc. in current year No Subc. in current year t+1 probabilities t+1 probabilities Industries
Subc. t+1 No-Subc. t+1 Subc. t+1 No-Subc. t+1 Meat products 66.67 33.33 8.06 91.94 Other food and tobacco 76.20 23.80 7.44 92.56 Drinks 64.18 35.82 7.55 92.45 Textiles and clothing 85.71 14.29 13.88 86.12 Leather and footwear 77.92 22.08 13.99 86.01 Wood industry 65.08 34.92 12.80 87.20 Paper 79.35 20.65 9.79 90.21 Editing and printing 82.48 17.52 23.48 76.52 Chemical industry 83.52 16.48 11.59 88.41 Rubber and plastics 83.08 16.92 15.69 84.31 Minerals products 71.51 28.49 10.48 89.52 Iron and steel 77.08 22.92 10.53 89.47 Metallic products 77.81 22.19 18.05 81.95 Machinery and mechanical goods 86.51 13.49 21.67 78.33 Office equipment 85.88 14.12 19.17 80.83 Electrical equipment 88.09 11.91 22.08 77.92 Motor vehicles 84.08 15.92 17.39 82.61 Other transport material 83.87 16.13 27.97 72.03 Furniture 73.82 26.18 16.85 83.15 Other manufacturing 87.34 12.66 14.21 85.79
Because of transaction costs are related to the search of suitable subcontracting
partners, an important determinant of transaction costs is the thickness of market (Spencer,
2005). So, according to theoretical models, the size or thickness of the market is related to
outsourcing. Grossman and Helpman (2002) and McLaren (2000) consider the effects of
market thickness on the outsourcing of intermediate inputs in their transaction cost models
where the trade off between vertical integration and outsourcing is investigated. A thicker
market increases the chance of finding a good external supplier and, therefore, the advantage
of vertical integration over outsourcing reduces. The benefit of a thicker market makes
outsourcing more viable in large industries (Grossman and Helpman, 2002) and in firms
operating in markets and economies open to international trade (McLaren, 2000). Greater
internationalization of the firm and larger industry size raise the chance to find a specialized
provider, increasing the chance to engage in outsourcing. The industry size is measured by the
number of employees in the industry. The level of internationalization is measured by a
dummy variable which takes the value 1 if the firm shows positive export behaviour and 0
otherwise. Kimura (2001) and Görg and Hanley (2004) introduce in their model the export
intensity obtaining a significant and positive coefficient.
17

Similar arguments can be used to consider the variable age as determinant of
subcontracting. More mature firms could find suitable subcontractors easier due to a “learning
effect” as well as a more incentive to focus on their core activities (Ono, 2003, Holl, 2004).
Age variable is measured as the years the firm is operating. It is calculated as the difference
between the year the firm was born up and the current year.
Shy and Stenbacka (2003) and Buehler and Haucap (2006) argue that firms use
outsourcing as a strategic instrument to compete with their rivals in the industry they operate.
If outsourcing is considered as a competitive strategy, the higher the market competition, the
more often the use of subcontracting. To proxy the market competition, we use a dummy
variable which takes the value 1 if the firm has competitors with a significant quota in the
own market and 0 otherwise. By other hand, taking into account the strategic motive for
outsourcing, firms could be more prone to subcontracting in sectors where subcontracting is
more frequent. Moreover, there can be specific sectoral characteristics which allow an easier
disintegration of production process favouring subcontracting. The introduction of industry
dummies allows us the possibility of controlling for technological heterogeneity as well as
other permanent differences across industries. By other hand,
There are additional factors to consider in a model of the determinants of outsourcing
which are used as variables of control. For example, the foreign ownership could affect the
degree to which a firm engages in subcontracting. To control for nationality (foreign or
domestic), we include the dummy variable Foreign Ownership which takes on value 1 if the
firm has foreign ownership participation (at least 50%) and 0 otherwise. Previous works
suggest a positive sign on this variable. They argue that since foreign firms are part of an
international network competing in a global market, the potential to contract out to more
efficient producers abroad increases (Görg and Hanley, 2004; Girma and Görg, 2004). Hence,
international outsourcing would be positively related to foreign ownership. However,
preceding works based on total outsourcing (national and international) have obtained
positive signs (Kimura, 2001; Girma and Görg, 2004) but also negative signs (Holl, 2004;
Díaz-Mora, 2005) and even insignificant coefficients (Görg and Hanley, 2004). As Holl
(2004) and Diaz-Mora (2006) suggest if foreign affiliates are located in a country just for
doing production tasks for the parent company, the possibility from these manufacturing
plants for using subcontractors could decrease. The effect of foreign ownership on
subcontracting is ambiguous and will be an empirical matter.
18

The definition, measure and expected signs of the variables included as determinants
of subcontracting in our model are summarized in table 3.
Table 3: Explanatory variables: definition, measure and expected signs.
Variable Definition and measure Expected signWage Log of the wage per employee + Firm-Size Firm size measured by the log of the number of workers Undetermined
Market-changes Dummy variable that takes the value 1 if the firm has suffered changes in market conditions and 0 otherwise +
Product-innovation Dummy variable that takes the value 1 if the firm does product innovation and 0 otherwise +
Process-innovation Dummy variable that takes the value 1 if the firm does process innovation and 0 otherwise +
R&D Dummy variable that takes the value 1 if the firm does invest in R&D and 0 otherwise +
Product-differentiation Dummy variable that takes the value 1 if the firm offers a differentiated product and 0 otherwise Undetermined
Industry-Size Log of the number of employees in the industry +
Export Dummy variable that takes the value 1 if the firm exported in t-1 and 0 otherwise +
Age Firm's age measured by the log of the numbers of years since the firm was born +
Subct-1Dummy variable that takes the value 1 if the firm subcontracted production in t-1 and 0 otherwise +
Market-competition Dummy variable that takes the value 1 if the firm has competitors with a significant market quota and 0 otherwise +
Foreign-own Dummy variable that takes the value 1 if the firm has foreign capital participation and 0 otherwise +
Dj Industry dummies for 20 sectors of two-digit NACE Dt Time dummies
Table 4 reports means of the explanatory variables for firms that subcontract and firms
that do no subcontract along the period. Substantial differences between the two types of
firms can be observed. Firms which contract out production pay higher wages, are larger,
more mature and they belong to larger industries than integrated firms. Moreover, the
percentage of firms that face to changes in market conditions, do product and process
innovation, invest in R&D, offer a differentiated product, are exporter firms, have filials
overseas, have competitors with a significant market quota and have foreign capital
participation is higher for firms which decide to outsource material production. Differences
across firms depending on the type of subcontracting arrangement are also shown.
19

Table 4: Firm, industry and market characteristics and subcontracting
Firms that subcontract
Firms that subcontract providing materials
Firms that subcontract
without materials
Firms that do mixed
subcontracting
Firms that do not
subcontract
Wages 6.013 5.657 6.036 6.553 5.469 Firm size (number of employees) 357 294 411 372 208
Market changes (% of firms that face to them) 6,8% 6,5% 6,8% 7,2% 5,9%
Process innovations (% of firms that do them) 36,3% 32,4% 34,6% 45,5% 20,3%
Product innovations (% of firms that do them) 47,4% 43,0% 44,3% 59,7% 29,1%
R&D activities (% of firms that do them) 42,3% 38,9% 41,8% 48,7% 30,2%
Product differentiation (% of firms that offer it) 42,7% 37,6% 46,5% 44,5% 33,0%
Industry-Size 351.000 334.000 362.000 360.000 338.000 Export status (% of firms that export) 72,3% 71,7% 66,1% 83,3% 51,5%
Age (number of years) 25,0 24,2 23,9 28,2 22,0 Market competition (% of firms with competitors with a relevant market quota)
82,9% 81,8% 82,8% 85,0% 77,5%
Foreign ownership (% of firms with foreign capital participation)
27,4% 25,6% 26,2% 32,3% 19,9%
We propose the next model to estimate the influence of diverse plant, industry and
market characteristics on firm’s subcontracting behaviour. These characteristics try to capture
the above motives for firms to engage in production subcontracting.
Pr (SUBCit = 1) = F (β1SUBCi,t-1 + β2Wagei,t-1 + β3Firm-Sizei,t-1+ β4Market-changesi,t-1
+ β5Product-innovationi,t-1 + β6Process-innovationi,t-1 + β7R&Di,t-1 + β8Product-
differentiationi,t-1 + β9Industry-size i,t-1 + β10Exporti,t-1 + β11Ageit + β12Market-competitioni,t-1
+ β13Foreign-owni,t-1 + β14Dt +β15Dj + uit) (1)
Where i represents the firm and t is the time period 1991-2002. The dependant
variable, the subcontracting decision (SUBC), is a dichotomous variable which takes the
value 1 or 0 depending on whether the firm decide to contracted out production in period t or
not. Since the direction of causality could remain uncertain for some of the explanatory
variables, we lag one period them to avoid a potential simultaneity problem.
20

To test the determinants of subcontracting behaviour, we use a dynamic panel data
probit model which includes the information available on the firm’s probability to contract
out production. It is a dynamic model because the lagged endogenous variable is included as
explanatory variable. Moreover, unobserved characteristics are likely to affect the decision to
contract out production by the firm. This means that the error term, uit, comprises two
components, a permanent unobserved plant-specific element (αi) and the remainder
disturbance (νit). The firm-specific unobserved heterogeneity must be taken into account
because in the case of being permanent or being highly serially correlated, it can induce
persistence in subcontracting behaviour, overestimating the coefficient on the lagged
endogenous variable and thus incorrectly interpreting as high entry cost (Bernard and Jensen,
2004). For this reason, we use a random effects probit model as well as a pooled probit. The
random effects model requires that the unobserved firm effects be uncorrelated with the
regressors, that is, uncorrelated with those firm characteristics which are observed and
included in our subcontracting decision model. Nevertheless, random effects model can be
adequate when a large population of firms are being sampled. In this case, the random effects
estimation assumes that the unobserved firm characteristics are randomly distributed among
the different transversal observations (Greene, 2000).
Therefore, we test the equation (1) using pooled probit and random effects probit
models and we compare the results.
4. ESTIMATION RESULTS
Table 5 displays the econometric results. Our data set consists of about 1550 firms
yielding 17.000 observations (depending of the specification). The results of the three first
columns are based on the standard probit model where the observations are pooled over the
sample period. Column 1 reports the results of the estimation of equation excluding the
variable dummy for differentiated products. The coefficient estimates show signs and levels
of significance in line with expectations.
Corresponding to the assumption that firms face entry costs when they decide to
subcontract production, the coefficient for lagged subcontracting decision is positive and
highly significant. The probability that firms decide to outsource this period depends on
previous subcontracting behaviour.
21

Table 5: Regression results (Probit estimation)
(Dependent variable: Subcontracting decision) Pooled probit Random effects probit
Coefficients Column (1)
Column (2)
Column (3)
Column (1)
Column (2)
Column (3)
Subct-1 1.861*** 1.860*** 1.730*** 1.527*** 1.526*** 1.847*** (0.024) (0.024) (0.044) (0.033) (0.033) (0.055) Waget-1 0.148*** 0.140*** 0.170** 0.227*** 0.222*** 0.196** (0.036) (0.036) (0.066) (0.048) (0.048) (0.077) Firm-size -0.000 0.017 (0.011) (0.017) Dfirm-size1 0.003 0.013 0.027 0.026 (0.032) (0.216) (0.046) (0.067) Dfirm-size2 0.050 0.072 0.108* 0.100 (0.044) (0.883) (0.060) (0.094) Market-changes 0.071*** 0.070*** -0.003 0.077** 0.077** -0.013 (0.026) (0.026) (0.060) (0.031) (0.031) (0.055) Product innovation 0.164*** 0.164*** 0.155*** 0.191*** 0.191*** 0.184*** (0.031) (0.031) (0.031) (0.037) (0.037) (0.066) Process innovation 0.073*** 0.070** 0.073 0.075** 0.074** 0.080 (0.027) (0.027) (0.027) (0.032) (0.032) (0.056) R&D 0.092*** 0.082** 0.170*** 0.141*** 0.135*** 0.198*** (0.032) (0.031) (0.032) (0.040) (0.040) (0.066) Product-Differentiation 0.151*** 0.176*** (0.032) (0.032) Size industry 0.191*** 0.192*** 0.172* 0.298*** 0.301*** 0.191* (0.046) (0.046) (0.046) (0.070) (0.071) (0.107) Export 0.195*** 0.189*** 0.217*** 0.241*** 0.238*** 0.236*** (0.030) (0.030) (0.030) (0.040) (0.040) (0.064) Age 0.011 0.008 0.004 0.018 0.016 0.007 (0.014) (0.014) (0.014) (0.019) (0.019) (0.028) Market-competition 0.044 0.045 0.042 -0.014 -0.015 -0.021 (0.034) (0.035) (0.036) (0.045) (0.045) (0.052) Nationality-own. -0.035 -0.045 -0.103 -0.043 -0.050 -0.109 (0.034) (0.034) (0.063) (0.048) (0.047) (0.073) Constant -5.022*** -5.040*** -5.042*** -7.153*** -7.102*** -5.655*** (0.671) (0.669) (1.302) (1.001) (0.997) (1.530) Observations 16688 16688 4795 16688 16688 4795 Number of groups 2547 2547 2415 Log likelihood -6944.74 -6943.78 -2092.13 -6829.90 -6828.59 -2079.74 LR test (rho=0) 9000.37 9002.29 2392.94 229.69 230.38 24.77 Prob>chi2 0.000 0.000 0.000 Pseudo R2 0.393 0.393 0.364
Notes: Significant coefficients are indicated by *, **, ***, for significance at the 1%, 5% and 10% level, respectively. The figures in parenthesis are standard errors. All regressions include unreported sectoral dummies
and annual time dummies. All the variables, except the dummy variables, are in logarithm.
22

Moreover, in line with our prior expectations, firms with higher wages are more likely
to engage in subcontracting9. These firms tend to use outsourcing as a defensive strategy
trying to improve their competitiveness. The positive and significant coefficient of wages
provides empirical evidence of the cost-cutting motive for outsourcing. Additionally,
according to the positive link between the market changes and subcontracting behaviour, as
the variations in market conditions are more frequent, the probability to outsource increases.
This outcome confirms the hypothesis that outsourcing production is a strategy to gain
flexibility in a context of rapid market changes. Our results confirm that firms involved in
R&D activities, product and process innovations and differentiation products are more prone
to contract out production. In this sense, producing high-tech, differentiated and innovator
products increases the firm’s probability of subcontracting. As it has been argued above, these
firms need to concentrate in their innermost core competences due to they are faced to a
changing market environment. The variables used to capture the thickness of the market also
show positive and significant coefficients. As the industry-size increases, so do
subcontracting decision. Exporter firms have more possibilities to be main contractors10. In
both cases, the positive correlation is explained by a higher probability to find suitable
providers. Nevertheless, the coefficient obtained by age variable is not significant. At last,
variables such as firms’ size, market-competition and foreign ownership also exhibit an
absence of statistical significance11. Most of the time and industry dummy variables are
highly significant although, in order to spare space, the coefficients are omitted from the
results table.
Table 5 displays the estimations of two more specifications. The second specification
(column 2) removes the variables firm size measured by the log of number of employees
substituting it by two dummy variables. The first one (D-Size1) takes the value 1 if the firm
has between 26 and 200 employees and 0 otherwise and the second one (D-Size2) takes the
value 1 if the firm has more than 200 employees and 0 otherwise. Both of them show
insignificant coefficients. Again firms’ size is not a determinant for the subcontracting
decision. The sign and significance of the remainder regressors do not change. 9 As we explained above, we use wage lagged one period. Nevertheless, since the subcontracting decision is already included lagged one period in the model, we have considered the value of wages in t-2 obtaining very similar estimation results. 10 This argument is used by Görg, Hanley and Strobl (2005) who study the impact of international outsourcing on productivity employing plant level data for Irish manufacturing. Their results show that exporting firms obtain more productivity gains from international outsourcing of materials inputs than non-exporter firms. The authors argue that exporting firms face lower costs of searching for potential suppliers abroad. 11 We have also included the quadratic value of age and size in the regression to allow for a more flexible form, but the coefficients remain statistically insignificant.
23

The column 3 reports the results of the estimation adding the variable dummy for
differentiated products. A substantially fewer number of surveyed firms has answer this
question. So the number of observations reduces a lot, diminishing the available information
as well for the rest of the variables. The product differentiation affects positively and
significantly to the probability to subcontract. Whereas the variables market-changes and
process-innovation loose their statistical significance, the rest of the coefficients hardly
change.
The table 5 also reports the estimation results using random-effects probit techniques
(three last columns). We again distinguish the same three specifications and we obtain results
which are very similar to earlier results. The only difference is that the dummy variable for
firm size which takes the value 1 if the firm has more than 200 employees turns out
significant. That is, large firms are more prone to subcontracts production than medium and
small firms.
Table 6 reports the marginal effects of the three specifications using a pooled probit
and a random effects probit. That is, how marginal changes in the independent variables
would affect the predicted probabilities to decide subcontracting. The results show that the
marginal effects of lagged subcontracting decision on current subcontracting probabilities are
particularly large: firms that decided to subcontract production in the previous year have at
least a 55% greater probability of doing subcontracting in current period. Marginal increases
in the others explanatory variables also raise the probability that a firm subcontracts but the
effect is lower. To conserve space, we only report marginal effects for significant explanatory
variables.
The regressions were also run separately for the subsamples of firms subcontracting
providing materials and firms subcontracting without materials. The sign and significance of
the coefficients of variables are too similar for the two types of subcontracting arrangement
and too similar to those obtained for aggregate subcontracting. Two particularities need to be
mentioned. First, the obtained estimates for subcontracting providing materials show that size
has a significant and positive effect on subcontracting decision. For this type of
subcontracting, the likelihood of subcontracting increases with the size of the firm. Second,
the econometric findings for subcontracting without materials suggest that age is an important
factor in the propensity to engage in contracting out. More mature firms are more prone to
subcontract production without providing materials.
24

Table 6: Marginal effects
(based on probit results of table 5) Pooled probit Random effects probit
Marginal effects Column (1)
Column (2)
Column (3)
Column (1)
Column (2)
Column (3)
Subct-1 0.645*** 0.645*** 0.611*** 0.549*** 0.549*** 0.641*** (0.006) (0.006) (0.012) (0.010) (0.010) (0.014) Waget-1 0.058*** 0.055*** 0.066** 0.088*** 0.086*** 0.076** (0.014) (0.014) (0.026) (0.018) (0.018) (0.029) Dfirm-size2 0.042* (0.023) Market-changes 0.028*** 0.027*** 0.030** 0.029** (0.010) (0.010) (0.012) (0.012) Product innovation 0.064*** 0.064*** 0.061*** 0.074*** 0.074*** 0.072*** (0.012) (0.012) (0.023) (0.014) (0.014) (0.025) Process innovation 0.029*** 0.027** 0.029** 0.028** (0.011) (0.011) (0.012) (0.012) R&D 0.036*** 0.032** 0.067*** 0.054*** 0.052*** 0.077*** (0.012) (0.012) (0.023) (0.015) (0.015) (0.025) Product-Differentiation 0.059*** 0.030* (0.023) (0.017) Size industry 0.074*** 0.075*** 0.067* 0.115*** 0.116*** 0.074* (0.018) (0.018) (0.035) (0.027) (0.027) (0.041) Export 0.075*** 0.073*** 0.084*** 0.092*** 0.091*** 0.091*** (0.012) (0.012) (0.021) (0.015) (0.015) (0.024)
Notes: Significant coefficients are indicated by *, **, ***, for significance at the 1%, 5% and 10% level,
respectively. The figures in parenthesis are standard errors.
25
References:
Abraham, K. and Taylor, S. (1996): Firm’s use of outside contractors: theory and evidence, Journal of Labour Economics, 14, 394-424.
Antras, P. and Helpman, E. (2004): Global outsourcing, Journal of Political Economy, 112(3), 552-580.
Bernard, A.B, and Jensen, .B. (2004): Why some firms export, Review of Economics and Statistics, 86 (2), 561-569.
Buehler, S. and Haucap, J. (2006): Strategic outsourcing revisited, Journal of Economic Behaviour and Organization, forthcoming.
Coase, R. (1937): The Nature of the firm, Economica, New Series, 4, 386-405.
Curzon Price, V. (2001): Some causes and consequences, in Fragmentation. New production patterns in the world economy, (Eds.) S.W. Arndt and H. Kierzkowski, Oxford University Press, Oxford.
Díaz-Mora, C. (2006): What factors determine the outsourcing intensity? A dynamic panel data approach for manufacturing industries, Applied Economics, forthcoming.
Fariñas, J.C. and Jaumandrey, J. (1999): Diez años de encuesta sobre estrategias empresariales, Economía Industrial, 329, 29-42.
Girma, S. and Görg, H. (2004): Outsourcing, foreign ownership and productivity: evidence from UK establishment level data, Review of International Economics, 12, 817-832.
Görg, H. and Hanley, A. (2004): Does outsourcing increase profitability?, The Economic and Social Review, 35 (3), 367-387.
Görg, H., Hanley, A. and Strobl, E. (2004): Outsourcing, foreign ownership, exporting and productivity: an empirical investigation with plant level data, Research Paper 08, University of Nottingham, Nottingham.
Greene, W.H. (2000): Econometric Analysis , Prentice-Hall, London.
Grossman, G.M. and Helpman, E. (2002): Integration versus outsourcing in industry equilibrium, Quarterly Journal of Economics, 117 (1), 85-120.
Grossman, G.M. and Helpman, E. (2005): Outsourcing in a global economy, The Review of Economic Studies, 72 (1), 135-160.
Holl, A. (2004): Production subcontracting and location: Panel data evidence from Spanish manufacturing firms, TRP Working Paper 146, University of Sheffield, Sheffield.
Kimura, F. (2001): Fragmentation, internalization, and interfirm linkages: Evidence from the micro data of Japanese manufacturing firms, in Global production and trade in East Asia, (Eds.) L.K. Cheng and H. Kierzkowski, Kluwer Academic Publishers, Boston.
Kimura, F. and Ando, M. (2005): Two-dimensional fragmentation in East Asia: conceptual framework and empirics, International Review of Economics and Finance, 14, 317-348.
Lin, J.Y. and Tsai, Y. (2005): What’s new about Outsourcing?, Paper presented to the Pacific Asia Free Trade and Development 30th Conference, Honolulu, February 19-21
McLaren, J. (2000): Globalization and Vertical Structure, American Economic Review, 90, 1239-1254.
26
Ono, Y. (2003): Outsourcing business services and the role of central administrative offices, Journal of Urban Economics, 53, 377-395.
Shy, O. and Stenbacka, R. (2003): Strategic outsourcing, Journal of Economic Behaviour and Organization, 50, 203-224.
Spencer, B. (2005): International Outsourcing and Incomplete Contracts, Canadian Journal of Economics, 38 (4), 1107-1135.
Swenson, D.L. (2004): Entry costs and outsourcing decisions: evidence from the U.S. overseas assembly provision, North American Journal of Economics and Finance, 15, 267-286.
Tomiura, E. (2005): Foreign outsourcing and firm-level characteristics: evidence from Japanese manufacturers, Journal of the Japanese and International Economics, 19, 255-271.
Williamson, O. (1975): Markets and hierarchies: Analysis and antitrust implications, Macmillan, New York.
World Trade Organization (2005): World Trade Report 2005, Chapter 3C, Offshoring services: recent development and prospects, Geneva.
27