Embed Size (px)
Citation preview
What Drives Venture Capital Fundraising?
Paul A. Gompers and Josh Lerner*
August 1998
We examine the determinants of venture capital fundraising in the U.S. over the past twenty-fiveyears. We study industry aggregate, state-level, and firm-specific fundraising to determine ifmacroeconomic, regulatory, or performance factors affect venture capital activity. We find thatshifts in demand for venture capital appear to have a positive and important impact oncommitments to new venture capital funds. Commitments by taxable and tax-exempt investorsseem equally sensitive to changes in capital gains tax rates, consistent with the notion thatdecreases in capital gains tax rates increase the demand for venture capital as more workers areincented to become entrepreneurs. Aggregate and state level venture fundraising are positivelyaffected by easing of pension investment restrictions as well as industrial and academic R&Dexpenditures. Fund performance and reputation also lead to greater fundraising by ventureorganizations.
*Harvard University and National Bureau of Economic Research. Margaret Blair, MartinFeldstein, Thomas Hellmann, James Poterba, Peter Reiss, Andrei Shleifer, and seminarparticipants at the Harvard-MIT Public Finance seminar and the Brookings Panel on EconomicActivity provided helpful comments and suggestions. We would also like to thank Gabe Biller,Kay Hashimoto, and Qian Sun for excellent research assistance. Dan Feenberg provided us withstate-level tax data. Chris Allen helped in collecting data. Support for this project was providedby the Advanced Technology Program and the Division of Research, Harvard Business School.
1. Introduction
During the past twenty years, commitments to the U.S. venture capital industry have
grown dramatically. This growth has not been uniform: it has occurred in quite concentrated
areas of the country and peaks in fundraising have been followed by major retrenchments.
Despite the importance of the venture capital sector in generating innovation and new jobs, few
academic studies have attempted to determine the underlying causes of these dramatic
movements in venture fundraising.
In this paper we examine the forces that affect fundraising by independent venture capital
organizations from 1972 through 1994. We study both industry fundraising patterns and the
fundraising success of individual venture organizations. We find that regulatory changes
affecting pension funds, capital gains tax rates, overall economic growth, and research and
development expenditures—as well as firm-specific performance and reputation—affect
fundraising by venture capital organizations. The results are potentially important for
understanding and promoting venture capital investment.
Various factors may affect the level of commitments to venture capital organizations.
Poterba (1989) argues that many of the changes in fundraising could arise from changes in either
the supply of or the demand for venture capital. When we refer to the supply of venture capital,
we mean the desire of investors to place money into venture capital funds. Demand is then the
desire of entrepreneurs to attract venture capital investment in their firm. For example, decreases
in capital gains tax rates might increase commitments to venture capital funds through increases
in the desire of taxable investors to make new commitments to funds as well as through increases
2
in the demand for venture capital investments when workers have greater incentives to become
entrepreneurs. Our research methodology attempts to distinguish between supply and demand
factors that affect the quantity of venture capital.
We find that demand-side factors appear to have had an important impact on
commitments to venture capital funds. Capital gains tax rates have an important effect at both
the industry, state-, and firm-specific levels. Decreases in the capital gains tax rates are
associated with greater venture capital commitments. The effect, however, appears to occur
through the demand for venture capital: rate changes affect both taxable and tax-exempt
investors. Similarly, R&D expenditures, especially expenditures by industrial firms, are
positively related to venture investments in particular states.
We also find that The Department of Labor’s clarification of its “prudent man” rule,
which enabled pension funds to freely invest in venture capital, and individual venture firm
performance and reputation influence fundraising. Higher recent returns (as measured by the
value of equity held in firms taken public) lead to greater capital commitments to new funds.
Older and larger organizations also attract more capital. Finally, we examine factors that affect
venture organizations’ decisions to raise funds targeted at early-stage, start-up firms. These
funds are potentially the most important for generating new firms and innovation. We find that
smaller, West Coast venture organizations are more likely to have raised an early-stage venture
fund.
3
The rest of the paper is organized as follows: A brief discussion of the institutional details
of venture capital is presented in Section 2. Section 3 discusses the economics of venture capital
and presents factors that might affect venture capital fundraising. Industry-wide fundraising
patterns, at both the aggregate and state level, are explored in Section 4. Section 5 explores
fundraising by individual venture organizations in an exhaustive database of venture capital
funds. Section 6 considers alternative explanations. Section 7 concludes.
2. The Institution of Venture Capital1
In this section we briefly review the institutional details of venture capital organizations.
The discussion highlights the structure and function of venture capital organizations in the U.S. and
how venture capital is distinct from other sources of financing for young, entrepreneurial
companies. In addition, we seek to place the development of the venture capital industry in context
so the tests discussed in Section 3 are better understood.
Many start-up firms require substantial capital. A firm’s founder may not have sufficient
funds to finance these projects alone and might therefore seek outside financing. Entrepreneurial
firms that are characterized by significant intangible assets, expect years of negative earnings, and
have uncertain prospects are unlikely to receive bank loans or other debt financing. For many of
these young companies, the tremendous uncertainty and asymmetric information may make venture
capital the only potential source of financing. Venture capital organizations finance these high-risk,
potentially high-reward projects, purchasing equity stakes while the firms are still privately held.
Venture capitalists have backed many high-technology companies including Apple Computer,
1Much of this discussion is based on Gompers and Lerner (1996).
4
Cisco Systems, Genentech, Intel, Microsoft, Netscape, and Sun Microsystems. A substantial
number of successful service firms (including Federal Express, Staples, Starbucks, and TCBY) have
also received venture financing.
Venture capitalists are often active investors, monitoring the progress of firms, sitting on
boards of directors, and meting out financing based on the attainment of milestones. While banks
monitor the financial health of firms that they lend to, venture capitalists monitor strategy and
investment decisions as well as take an active role in advising the firm. Venture capitalists often
retain important control rights that allow them to intervene in the company’s operations when
necessary. In addition, venture capitalists provide entrepreneurs with access to consultants,
investment bankers, and lawyers. Brav and Gompers (1997) show that venture capital backing adds
value even after the initial public offering: venture-backed companies substantially outperform
nonventure-backed firms in the public aftermarket.
The first modern venture capital firm, American Research and Development (ARD), was
formed in 1946 by MIT President Karl Compton, Harvard Business School Professor Georges F.
Doriot, and local business leaders. A small group of venture capitalists made high-risk investments
into emerging companies that were based on technology developed for World War II. The success
of the investments ranged widely: almost half of ARD's profits during its 26-year existence as an
independent entity came from its $70,000 investment in Digital Equipment Company (DEC) in
1957, which grew in value to $355 million. Because institutional investors were reluctant to invest,
ARD was structured as a publicly traded closed-end fund and marketed mostly to individuals [Liles
5
(1977)]. The few other venture organizations begun in the decade after ARD's formation were also
structured as closed-end funds.
The first venture capital limited partnership, Draper, Gaither, and Anderson, was formed in
1958. Imitators soon followed, but limited partnerships accounted for a minority of the venture pool
during the 1960s and 1970s. Most venture organizations raised money either through closed-end
funds or small business investment companies (SBICs), federally guaranteed risk-capital pools that
proliferated during the 1960s. While the market for SBICs in the late 1960s and early 1970s was
strong, incentive problems ultimately led to the collapse of the sector. Even so, the annual flow of
money into venture capital during its first three decades never exceeded a few hundred million
dollars and usually was substantially less.
One change in the venture capital industry during the past twenty years has been the rise of
the limited partnership as the dominant organizational form.2 Limited partnerships also have an
important advantage which makes them attractive to tax-exempt institutional investors: capital gains
taxes are not paid by the limited partnership. Instead taxes are paid only by the (taxable) investors.
Venture partnerships have pre-determined, finite lifetimes (usually ten years though extensions are
often allowed). Investors in the fund are limited partners. In order to maintain limited liability,
investors must not become involved in the day-to-day management of the fund.
2The rise of the limited partnership also allows us to accurately track venture capital fundraising.Venture capital limited partnerships raise a pre-specified amount of money to be invested. Thedata discussed in Section 5 is fund-by-fund tracking of these amounts.
6
3. The Economics of Venture Capital
3.1. Supply and demand in venture capital
In this section we develop predictions about what factors might influence the quantity of
venture capital provided in an economy. In order to understand the mechanism through which
these factors work, it is important to discuss supply and demand in the venture capital market.
Figure 1 presents a simple illustration of equilibrium in the venture capital market. Supply of
venture capital is determined by the willingness of investors to provide funds to venture firms. The
willingness of investors to commit money to venture capital is dependent upon the expected rate of
return on venture investments. Therefore, in the venture capital market, price is the expected rate
of return on new venture capital investments. Higher expected returns lead to a greater desire of
investors to supply venture capital, i.e., like most supply schedules it slopes upward.
The demand schedule is simply the quantity of entrepreneurial firms seeking venture capital
that can supply a particular expected rate of return. As the price increases—the expected return
increases—fewer entrepreneurial firms demand capital because the quantity of projects meeting that
threshold declines. The demand schedule therefore slopes downward.
We will discuss the equilibria in the supply and demand framework by examining the
quantity of venture capital. While any supply and demand equilibrium also implies a particular
price, i.e., an expected rate of return, we can not measure the anticipated rate of return in the
venture capital market. Nor does the actual rate of return provide a useful proxy. Returns from
venture capital investments can only be observed many years after the original investments
because private firms are valued at cost until they are sold or taken public many years later.
7
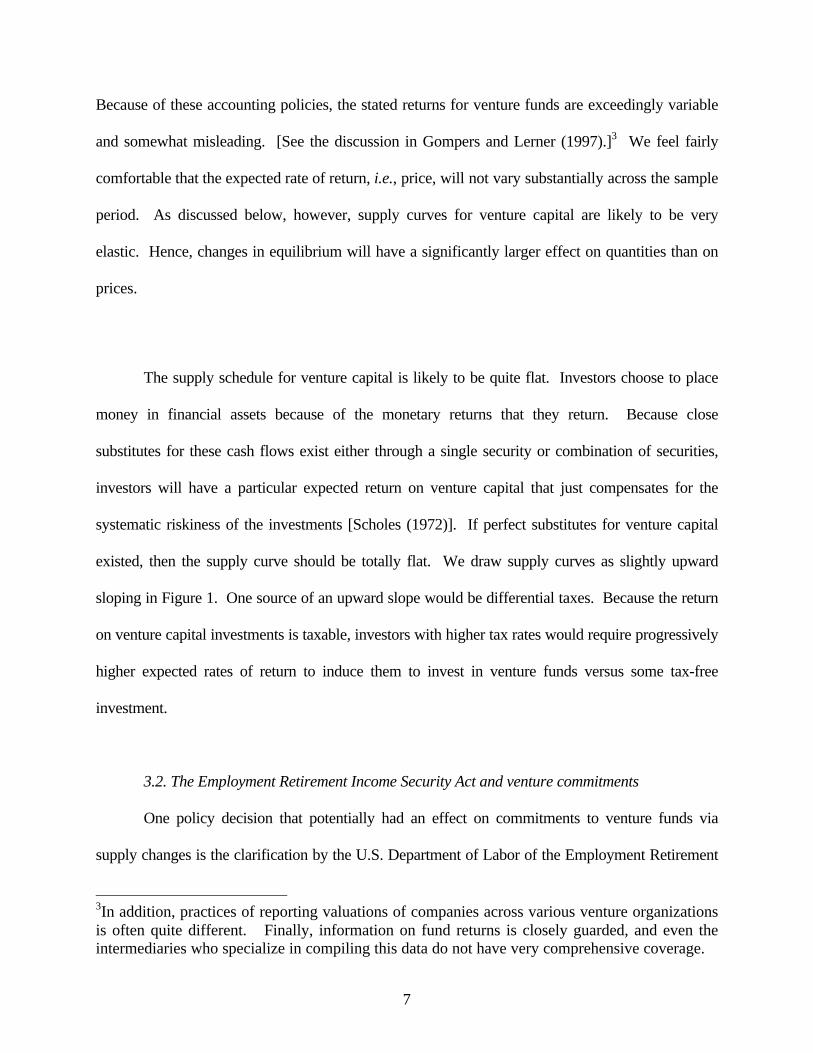
Because of these accounting policies, the stated returns for venture funds are exceedingly variable
and somewhat misleading. [See the discussion in Gompers and Lerner (1997).]3 We feel fairly
comfortable that the expected rate of return, i.e., price, will not vary substantially across the sample
period. As discussed below, however, supply curves for venture capital are likely to be very
elastic. Hence, changes in equilibrium will have a significantly larger effect on quantities than on
prices.
The supply schedule for venture capital is likely to be quite flat. Investors choose to place
money in financial assets because of the monetary returns that they return. Because close
substitutes for these cash flows exist either through a single security or combination of securities,
investors will have a particular expected return on venture capital that just compensates for the
systematic riskiness of the investments [Scholes (1972)]. If perfect substitutes for venture capital
existed, then the supply curve should be totally flat. We draw supply curves as slightly upward
sloping in Figure 1. One source of an upward slope would be differential taxes. Because the return
on venture capital investments is taxable, investors with higher tax rates would require progressively
higher expected rates of return to induce them to invest in venture funds versus some tax-free
investment.
3.2. The Employment Retirement Income Security Act and venture commitments
One policy decision that potentially had an effect on commitments to venture funds via
supply changes is the clarification by the U.S. Department of Labor of the Employment Retirement
3In addition, practices of reporting valuations of companies across various venture organizationsis often quite different. Finally, information on fund returns is closely guarded, and even theintermediaries who specialize in compiling this data do not have very comprehensive coverage.
8
Income Security Act’s (ERISA) prudent man rule in 1979. Through 1978, the rule stated that
pension managers had to invest with the care of a “prudent man.” Consequently, many pension
funds avoided investing in venture capital entirely: it was felt that a fund’s investment in a start-up
could be seen as imprudent. In early 1979, the Department of Labor ruled that portfolio
diversification was a consideration in determining the prudence of an individual investment. Thus,
the ruling implied that an allocation of a small fraction of a portfolio to venture capital funds would
not be seen as imprudent. That clarification specifically opened the door for pension funds to invest
in venture capital.
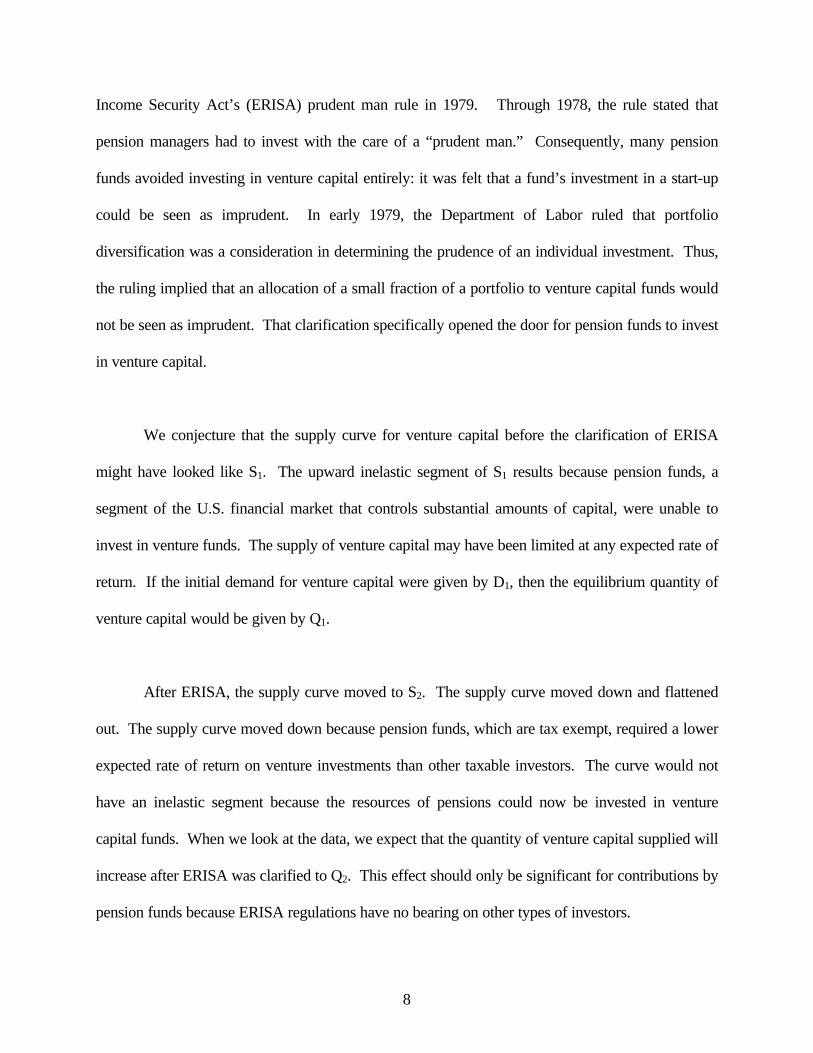
We conjecture that the supply curve for venture capital before the clarification of ERISA
might have looked like S1. The upward inelastic segment of S1 results because pension funds, a
segment of the U.S. financial market that controls substantial amounts of capital, were unable to
invest in venture funds. The supply of venture capital may have been limited at any expected rate of
return. If the initial demand for venture capital were given by D1, then the equilibrium quantity of
venture capital would be given by Q1.
After ERISA, the supply curve moved to S2. The supply curve moved down and flattened
out. The supply curve moved down because pension funds, which are tax exempt, required a lower
expected rate of return on venture investments than other taxable investors. The curve would not
have an inelastic segment because the resources of pensions could now be invested in venture
capital funds. When we look at the data, we expect that the quantity of venture capital supplied will
increase after ERISA was clarified to Q2. This effect should only be significant for contributions by
pension funds because ERISA regulations have no bearing on other types of investors.
9
3.3. Capital gains taxes and venture capital fundraising
The effect of capital gains tax rates on commitments to the venture capital industry has been
debated in the academic literature as well as political circles. The effect of reductions in the capital
gains tax rate on commitments to venture capital was one of the intended benefits of the reduction
of the tax from 28% to 14% on investments in small companies held for five years that was enacted
in 1993.
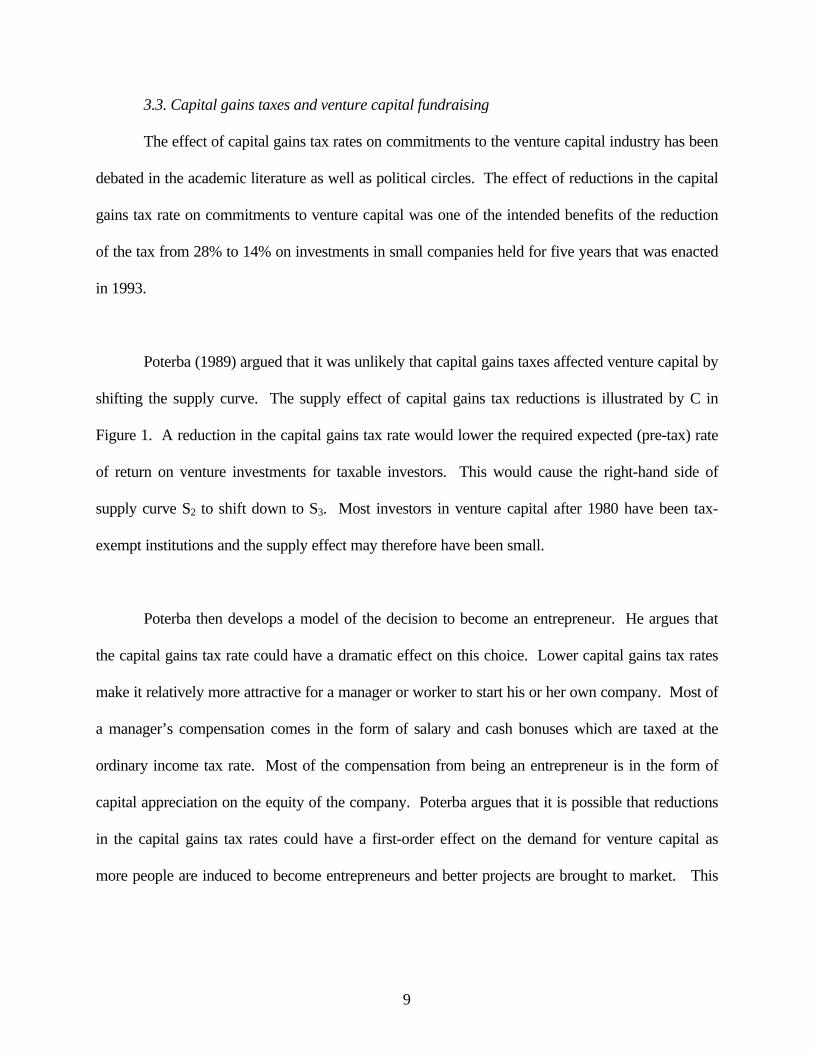
Poterba (1989) argued that it was unlikely that capital gains taxes affected venture capital by
shifting the supply curve. The supply effect of capital gains tax reductions is illustrated by C in
Figure 1. A reduction in the capital gains tax rate would lower the required expected (pre-tax) rate
of return on venture investments for taxable investors. This would cause the right-hand side of
supply curve S2 to shift down to S3. Most investors in venture capital after 1980 have been tax-
exempt institutions and the supply effect may therefore have been small.
Poterba then develops a model of the decision to become an entrepreneur. He argues that
the capital gains tax rate could have a dramatic effect on this choice. Lower capital gains tax rates
make it relatively more attractive for a manager or worker to start his or her own company. Most of
a manager’s compensation comes in the form of salary and cash bonuses which are taxed at the
ordinary income tax rate. Most of the compensation from being an entrepreneur is in the form of
capital appreciation on the equity of the company. Poterba argues that it is possible that reductions
in the capital gains tax rates could have a first-order effect on the demand for venture capital as
more people are induced to become entrepreneurs and better projects are brought to market. This
10
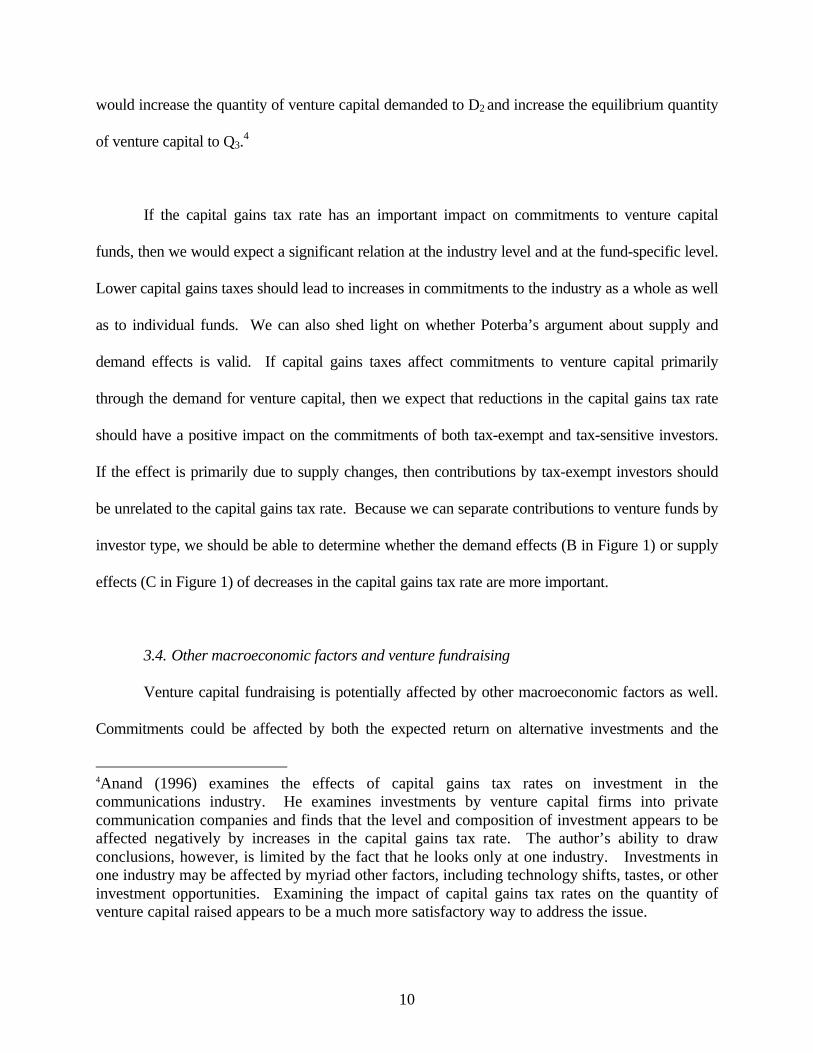
would increase the quantity of venture capital demanded to D2 and increase the equilibrium quantity
of venture capital to Q3.4
If the capital gains tax rate has an important impact on commitments to venture capital
funds, then we would expect a significant relation at the industry level and at the fund-specific level.
Lower capital gains taxes should lead to increases in commitments to the industry as a whole as well
as to individual funds. We can also shed light on whether Poterba’s argument about supply and
demand effects is valid. If capital gains taxes affect commitments to venture capital primarily
through the demand for venture capital, then we expect that reductions in the capital gains tax rate
should have a positive impact on the commitments of both tax-exempt and tax-sensitive investors.
If the effect is primarily due to supply changes, then contributions by tax-exempt investors should
be unrelated to the capital gains tax rate. Because we can separate contributions to venture funds by
investor type, we should be able to determine whether the demand effects (B in Figure 1) or supply
effects (C in Figure 1) of decreases in the capital gains tax rate are more important.
3.4. Other macroeconomic factors and venture fundraising
Venture capital fundraising is potentially affected by other macroeconomic factors as well.
Commitments could be affected by both the expected return on alternative investments and the
4Anand (1996) examines the effects of capital gains tax rates on investment in thecommunications industry. He examines investments by venture capital firms into privatecommunication companies and finds that the level and composition of investment appears to beaffected negatively by increases in the capital gains tax rate. The author’s ability to drawconclusions, however, is limited by the fact that he looks only at one industry. Investments inone industry may be affected by myriad other factors, including technology shifts, tastes, or otherinvestment opportunities. Examining the impact of capital gains tax rates on the quantity ofventure capital raised appears to be a much more satisfactory way to address the issue.
11
general health of the economy. If the economy is growing quickly, then there may be more
attractive opportunities for entrepreneurs to start new firms and, hence, increases in the demand for
venture capitalists. Formally, the demand curve would shift to the right. The greater investment
opportunity set might be associated with greater commitments to the venture capital industry. GDP
growth, returns in the stock market, and R&D expenditures would all be potential proxies for
demand conditions.
The level of interest rates in the economy also could affect the supply of venture capital. An
alternative investment to venture capital is bonds. If interest rates rise, then the attractiveness of
investing in venture capital funds may decline. This would decrease the willingness of investors to
supply venture capital at all prices, i.e., at all expected return levels.
3.5. Firm performance and fundraising
In this section we develop hypotheses about factors that might affect venture capital
fundraising at the firm level. In addition to the market-wide factors discussed above, we look for
venture capital firm-specific characteristics that may influence fundraising. First, a substantial body
of research examines the relation between past performance and investment. Allocations by
investors across asset classes seem to be driven by, in part, the relative performance of various
sectors over the recent past. If there is short-run momentum in returns—as shown by Grinblatt,
Titman, and Wermers (1995)—this response may be rational.
The flow of money into and out of various types of financial institutions in response to
performance has been documented extensively of mutual funds. While the early research on mutual
12
funds [Jensen (1968); Ippolito (1989)] indicated that mutual fund managers as a group do not
significantly outperform the market, recent work has shown cash flows appear to respond to past
performance. Sirri and Tufano (1998) find that performance relative to peers in the same
investment category is an important determinant of new capital commitments to mutual funds.
They examine 690 equity mutual funds and rank the funds by their performance relative to funds
that have the same investment focus. They find that the top performing funds in any particular
investment style have substantial new commitments to their funds in the subsequent year. The
relation between performance and commitments, however, is not linear. Funds that perform poorly
do not appear to be penalized in the following year. Money does not leave poor performing funds.
Sirri and Tufano (1998) find that one exception to these findings is new funds. Money does seem to
leave a new fund if it is a poor performer.
Chevalier and Ellison (1997) examine how these patterns affect investment incentive
functions. They find that funds which have underperformed their peers in the first part of the year
have an incentive to increase the riskiness of their portfolios in order to increase the chances that
they will end up near the top of the performance charts. If they bet wrong and fail, they will lose
few of their current investors.
If the evidence from mutual funds has implications for venture capital, then we would
expect that recent performance would be positively related to commitments to new funds. As in
Sirri and Tufano’s (1998) mutual fund results, reputation of the venture organization may influence
the flow of new commitments when it raises a new fund. Several measures of reputation may be
important. These include venture organization age and capital under management. Older and larger
13
venture organizations are likely to have more established reputations. They may therefore receive
larger capital commitments than similar younger funds.
4. Venture Industry-Wide Results
We examine the implications of performance and capital gains tax rates for commitments to
venture capital funds by performing two layers of analysis: aggregate flows and commitments to
individual funds. The first level of analysis examines the flow of venture capital commitments into
the industry. We examine the commitments to new venture capital funds from 1969 through 1994
first aggregating all commitments in the U.S. We then take up an analysis of the level of venture
activity on a state-by-state basis.
4.1. Aggregate fundraising results
Data on annual commitments to U.S. venture capital funds come from the consulting firm
Venture Economics. This organization has tracked venture fundraising since the 1960s. This
database not only records venture capital organizations, but also the names of their individual
funds. We have checked the entries in this database against the historical information reported in
over 400 venture offering memorandums and partnership agreements, as well as against the fund
profiles in the Venture Capital Journal and Private Equity Analyst. [The construction and
verification of the database are described in Gompers and Lerner (1998a).] This database is also
used in the analysis of individual organizations’ fundraising data analyzed in Section 5.
This database includes over two thousand venture capital funds, SBICs, and related
organizations. It is used in preparation of directories such as their annual volume Venture Capital
14
Performance. It is compiled from information provided by venture capitalists and institutional
investors. In examining fundraising behavior, we only look at venture capital limited partnerships.
First, these partnerships are the dominant organizational form in the industry, accounting for
roughly 80% of commitments to the venture capital industry in recent years. Furthermore, the
actual size of SBICs and corporate venture affiliates is often very difficult the estimate. SBICs have
access to matching government funds, often several times greater than the amount contributed by
private investors. Corporate programs usually do not have a pool of capital specified in advance
and are frequently disbanded before being investing much capital. Limited partnerships—with their
well-defined size and life-span—offer the cleanest estimate of venture capital inflows.
We total commitments to venture funds each year. Commitments are defined as the pledges
that venture capitalists receive for investment over the lifetime of the fund. They are not the amount
of money that is actually invested in a given year. Typically, venture funds draw on and invest the
committed capital over a two to three year time period. For example, in 1995 Sierra Ventures raised
their fifth fund with aggregate commitments of $100 million. This $100 million would be invested
between 1995 and about 1999, but we would classify the entire $100 million as having been
committed in 1995.
We also need some measure of returns in the venture capital industry. Ideally, we would
have year-by-year performance data for individual funds. These data present several problems. As
discussed above, calculation of returns is hampered by policies of many venture organizations that
potentially delay the write-up or write-down of assets. As a proxy for performance of the venture
organizations, we use a measure of the market value of equity held by venture capitalists in firms
15
that went public in a particular year. This measure will be highly correlated with returns on venture
funds. Most money in venture capital is earned on firms that eventually go public. Ignoring the
companies that do not go public is reasonable because their impact on returns is usually quite small.
A Venture Economics study (1988) finds that a $1 investment in a firm that goes public provides an
average cash return of $1.95 in excess of the initial investment with an average holding period of
4.2 years. The next best alternative, an investment in an acquired firm, yields a cash return of only
40 cents over a 3.7 year mean holding period. Using the IPO measure also makes sense because
marketing documents for venture capital funds often highlight the successful public companies
which have been backed by the venture organization. We therefore expect that the amount of
venture capital raised will be a positive function of the value of firms taken public by venture
capitalists in the previous year.
We identify potential venture-backed IPOs using three sources. The first is the listings of
venture-backed IPOs published in Venture Economics' Venture Capital Journal. This is the
same source used by Barry, et al. (1990) and Megginson and Weiss (1991). We also use listings
of the securities distributions by venture funds. Venture capitalists typically unwind their
successful investments by distributing the shares to their limited partners. They avoid selling the
shares themselves and distributing the proceeds to their limited partners because their investors
include both tax-exempt and tax-paying parties. To sell the shares would generate an immediate
tax liability, which some of the limited partners may wish to avoid. We obtain lists of the
distributions received by a pension fund which is among the largest venture investors and by
three investment managers [Gompers and Lerner (1998b)]. (These investment managers allocate
funds from numerous pension funds into venture capital and other asset classes.) These investors
16
had received distributions from 135 venture funds, most of which are managed by the oldest and
most established venture organizations in the industry. Most of the successful investments by
these funds can be identified from these lists.
The final source used to identify IPOs for the sample are the offering documents used by
venture capitalists to raise new funds from investors. Venture organizations will often list in
these offering memorandums their past investments that either went public or were acquired on
favorable terms. We examine over four hundred of these memorandums in the files of Venture
Economics [Gompers and Lerner (1998a)]. We identify any investments listed as having gone
public. Most of the offering documents compiled by Venture Economics are from young
venture organizations. This is because their Fund Raiser Advisory Service counsels less
experienced firms on strategies for raising capital.
We include in the IPO sample all firms if a venture investor listed in the "Management"
and "Principal and Selling Shareholders" sections of the IPO prospectus is listed in the Venture
Economics database. In many cases, it is not immediately obvious whether a venture investor or
director is an exact match with a venture organization listed in the database.5 To address these
ambiguities, we consult the edition of Venture Economics' Pratt's Guide to Venture Capital
Sources (1996) published in the year of the IPO. We compare the addresses and key personnel
of each of these ambiguous venture organizations with the information reported in the
prospectus. If we are not virtually certain that the venture organizations in the prospectus and
5In many cases, individual investors (often called "angels") will describe themselves as venturecapitalists. Groups of individual investors often make their investments through partnerships,which frequently are given a name not unlike those of venture capital organizations.
17
the database are the same, we do not code it as a match. For each investor, we code the venture
organization, the particular venture fund investing in the firm, and the size of the stake before
and after the offering. This process leads to the identification of 885 IPOs in which a venture
capitalist served as a director or a venture capital fund was a blockholder.
In each year, we calculate the market value of the equity stakes in firms going public held
by each venture capital organization. This value is the number of shares held by the venture
organization multiplied by the IPO offering price. We then sum the market values for each IPO
in a given year to obtain an annual performance number for each venture capital organization.
We then sum across all venture organizations in a given year to get a measure of venture industry
performance.
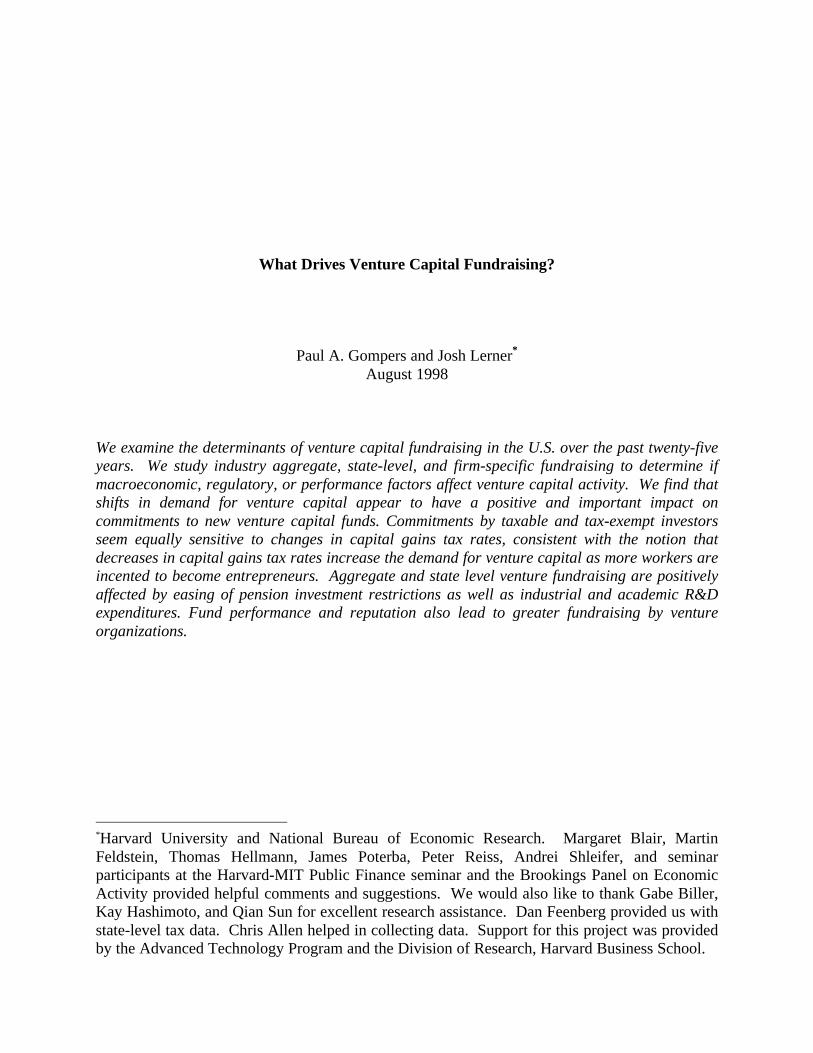
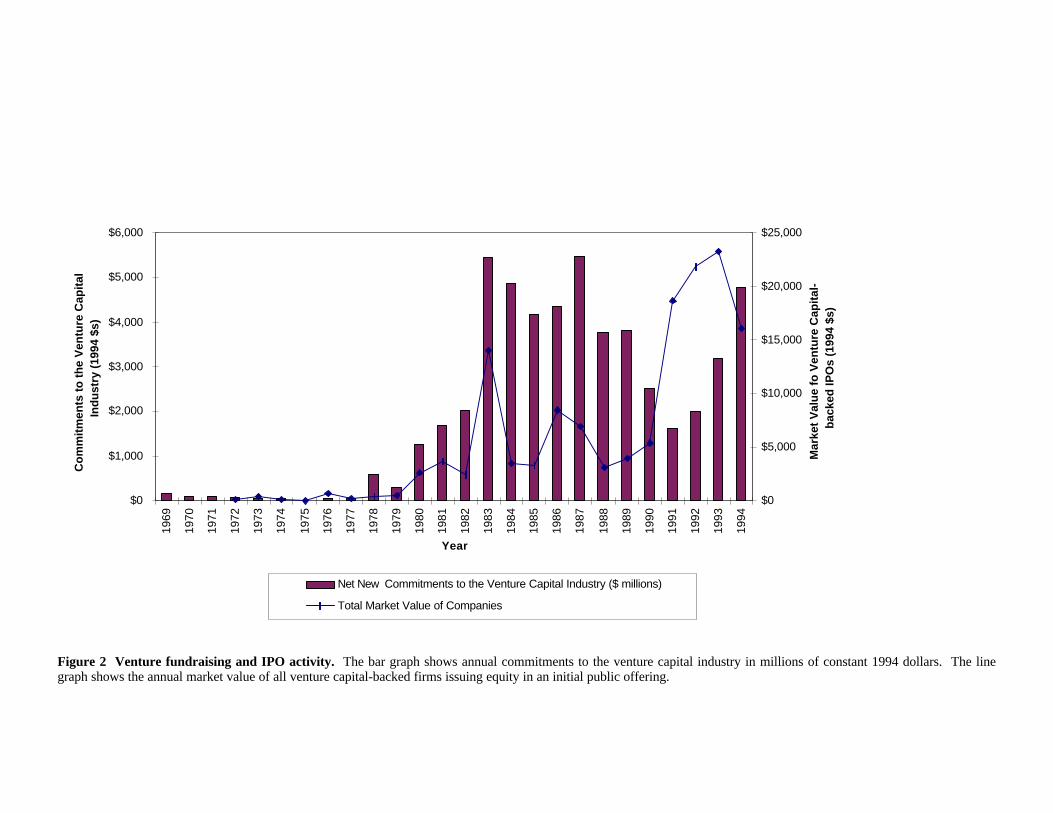
In Figure 2, we graph the time series of venture capital commitments and the market value
of all firms brought public by venture capitalists in each year from 1969 through 1994. We see that
from 1969 through 1979, commitments to venture capital and venture-backed IPOs were quite low.
Starting in 1980, both commitments to the venture capital industry and the value of firms brought
public by venture capitalist rise. The rise of both reversed in 1983. After 1983, it appears that the
shift in venture-backed IPO market leads to changes in commitments to new venture funds. For
example, increases in the market value of venture-backed IPOs in both 1986 and 1991-1992
preceded resurgences in the venture capital market.
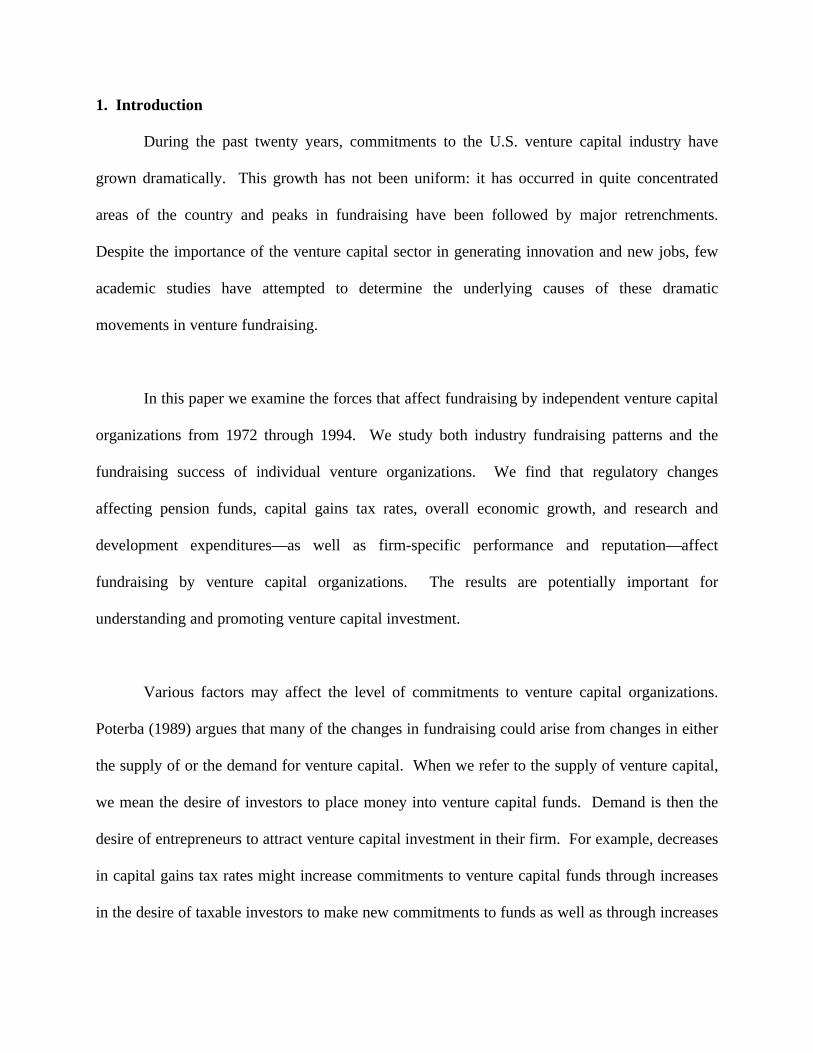
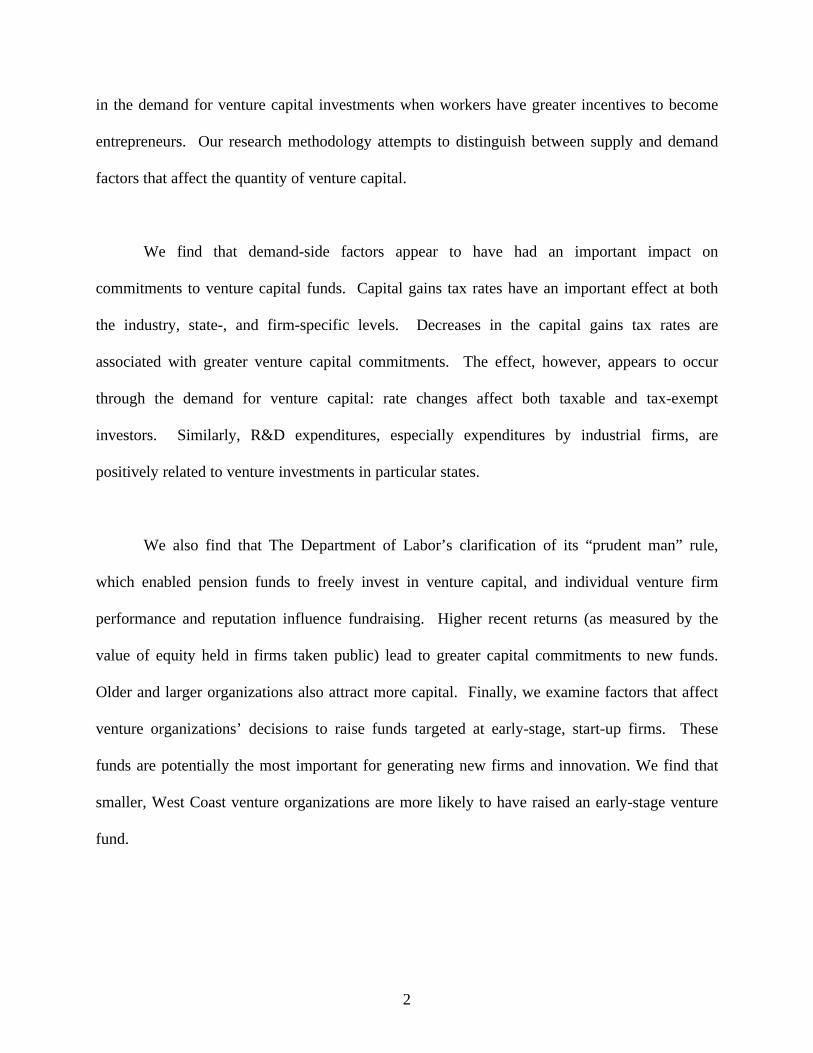
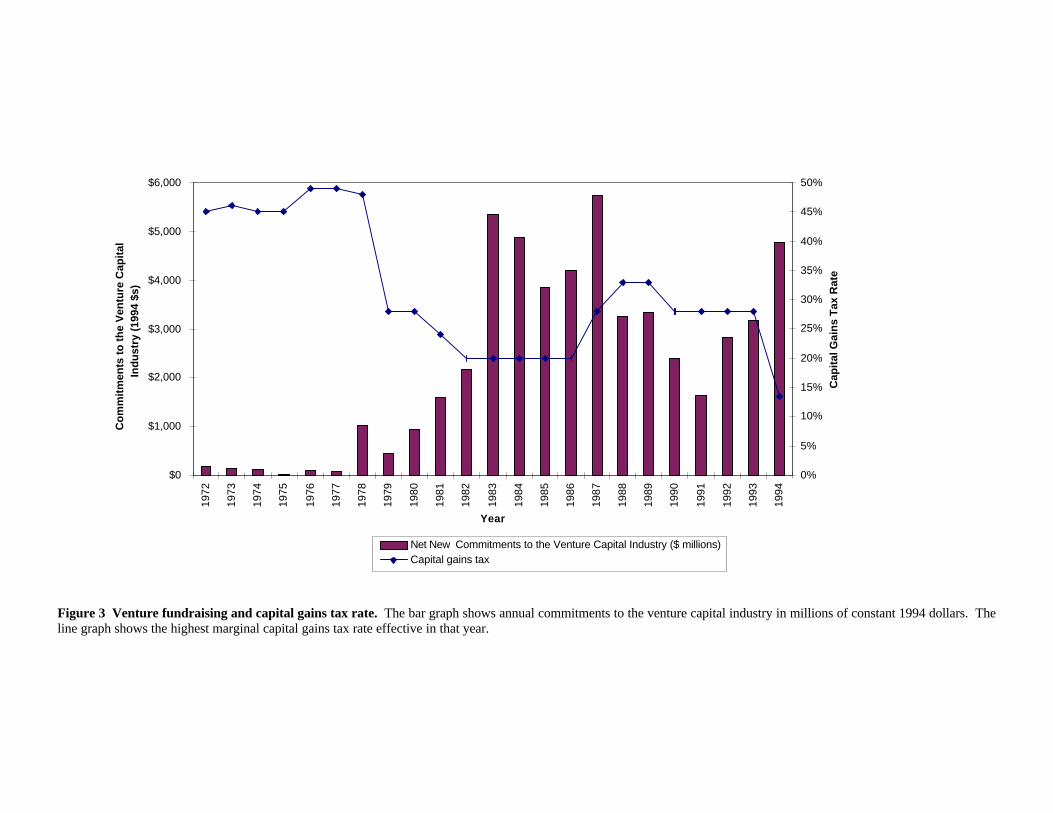
The relation between capital gains taxes and venture capital commitments is documented in
Figure 3. The relation is clearly negative. In the 1970s, high capital gains tax rates were associated
18
with low levels of venture capital fundraising. Increases in the capital gains tax rates in 1988 were
followed by reductions in venture capital commitments, while the reduction of capital gains for
long-held investments in 1993 was followed by a rise in venture fundraising. This negative relation
between venture capital funding levels and capital gains tax rates is clearly only suggestive, because
the influence of multiple factors needs to be examined.
Detailed information on the nature of commitments is shown in Table 1. Several patterns
are prominent. First, the volatility of commitments is readily apparent. The level of fundraising
(expressed in 1994 dollars) can vary dramatically from one year to the next. The volatility in
venture fundraising is mirrored by a similar volatility in the IPO market, both for venture-backed
companies and for the entire IPO market. We see the dramatic shift from individuals to pension
funds over the past fifteen years as the primary capital source for new venture funds.6
In order to assess the impact of each of these variables controlling for the others, we present
multivariate regressions in Table 2. Our approach here and in the individual firm regressions is to
estimate reduced-form specifications and identify which factors potentially work through demand
shifts and which factors work through supply shifts. The time series of data runs from 1972 through
1994. The dependent variable is the natural logarithm of real commitments to the venture capital
industry (in millions of 1994 dollars). We present regressions for commitments to the entire venture
capital industry, as well as four subgroups: taxable investors, tax-exempt investors, individuals, and
pension funds. The independent variables include the natural logarithm of the market value of firms
6The measures of the sources of funds are taken from various issues of Venture Economics’Venture Capital Journal.
19
brought public by venture organizations in the previous year (in millions of 1994 dollars), the real
return on Treasury bills in the previous year, the real CRSP value-weighted stock market return in
the prior year, the previous year’s real GDP growth, a dummy variable that equals one for years
after 1978 when ERISA’s prudent man rule was clarified, and the top marginal capital gains tax
rate.
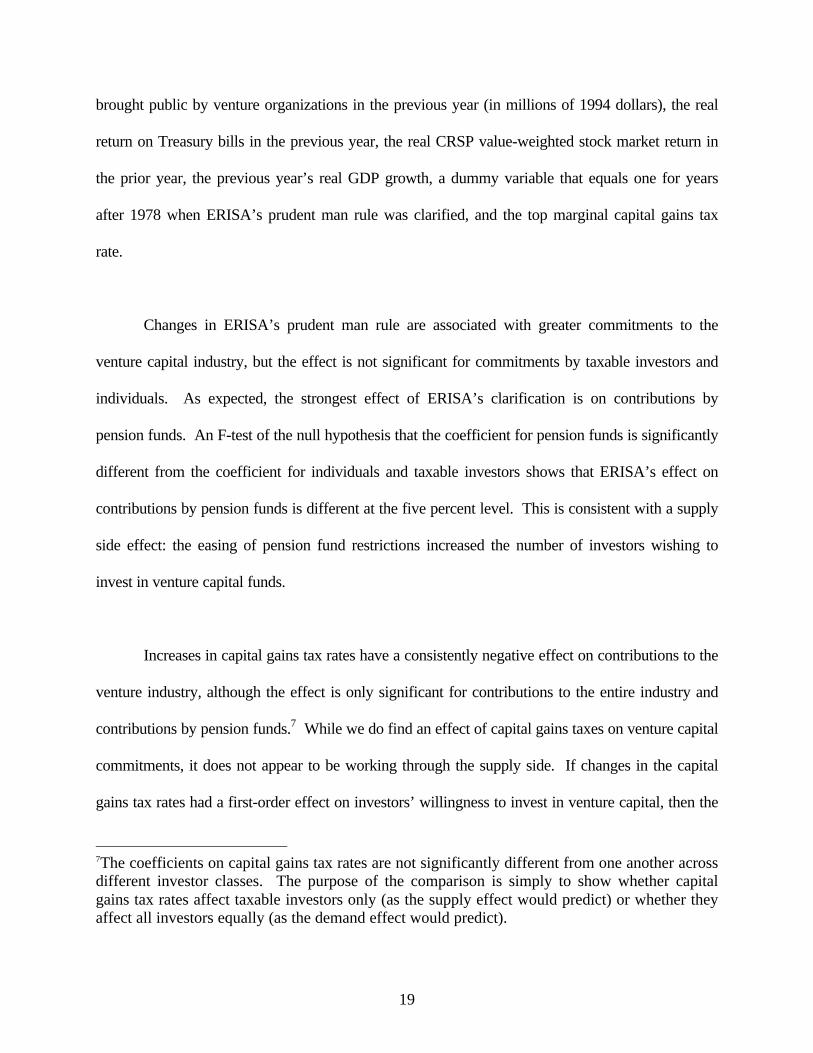
Changes in ERISA’s prudent man rule are associated with greater commitments to the
venture capital industry, but the effect is not significant for commitments by taxable investors and
individuals. As expected, the strongest effect of ERISA’s clarification is on contributions by
pension funds. An F-test of the null hypothesis that the coefficient for pension funds is significantly
different from the coefficient for individuals and taxable investors shows that ERISA’s effect on
contributions by pension funds is different at the five percent level. This is consistent with a supply
side effect: the easing of pension fund restrictions increased the number of investors wishing to
invest in venture capital funds.
Increases in capital gains tax rates have a consistently negative effect on contributions to the
venture industry, although the effect is only significant for contributions to the entire industry and
contributions by pension funds.7 While we do find an effect of capital gains taxes on venture capital
commitments, it does not appear to be working through the supply side. If changes in the capital
gains tax rates had a first-order effect on investors’ willingness to invest in venture capital, then the
7The coefficients on capital gains tax rates are not significantly different from one another acrossdifferent investor classes. The purpose of the comparison is simply to show whether capitalgains tax rates affect taxable investors only (as the supply effect would predict) or whether theyaffect all investors equally (as the demand effect would predict).
20
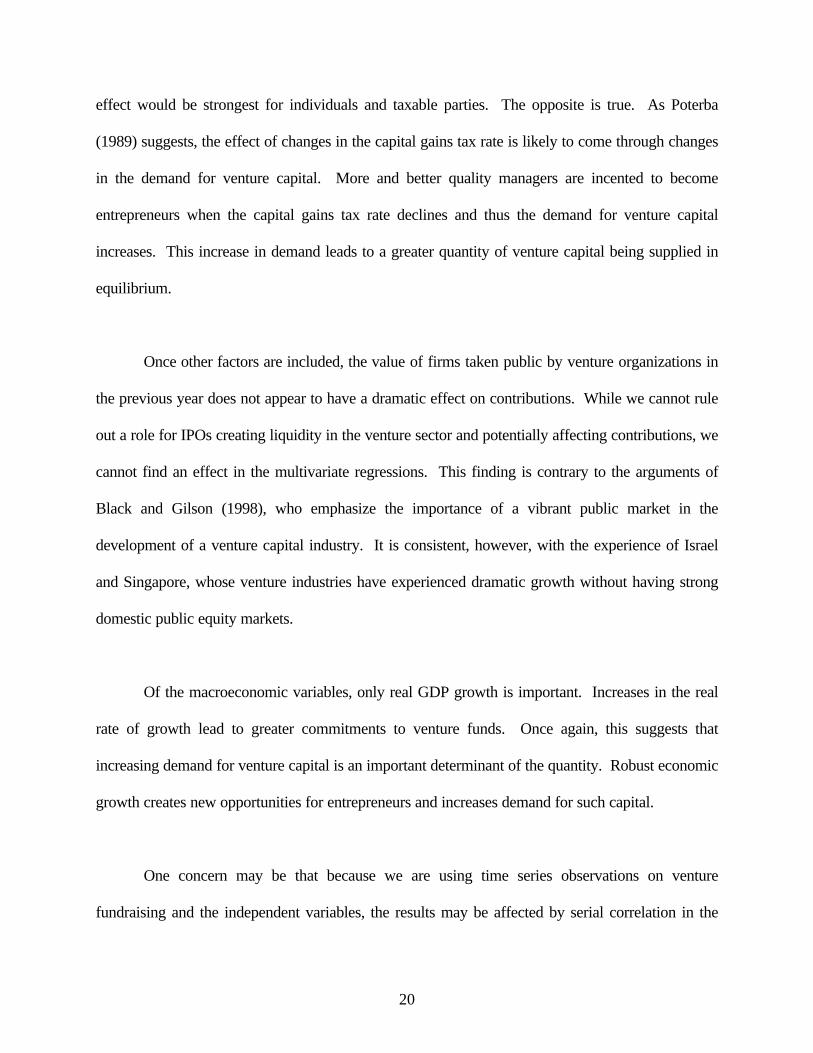
effect would be strongest for individuals and taxable parties. The opposite is true. As Poterba
(1989) suggests, the effect of changes in the capital gains tax rate is likely to come through changes
in the demand for venture capital. More and better quality managers are incented to become
entrepreneurs when the capital gains tax rate declines and thus the demand for venture capital
increases. This increase in demand leads to a greater quantity of venture capital being supplied in
equilibrium.
Once other factors are included, the value of firms taken public by venture organizations in
the previous year does not appear to have a dramatic effect on contributions. While we cannot rule
out a role for IPOs creating liquidity in the venture sector and potentially affecting contributions, we
cannot find an effect in the multivariate regressions. This finding is contrary to the arguments of
Black and Gilson (1998), who emphasize the importance of a vibrant public market in the
development of a venture capital industry. It is consistent, however, with the experience of Israel
and Singapore, whose venture industries have experienced dramatic growth without having strong
domestic public equity markets.
Of the macroeconomic variables, only real GDP growth is important. Increases in the real
rate of growth lead to greater commitments to venture funds. Once again, this suggests that
increasing demand for venture capital is an important determinant of the quantity. Robust economic
growth creates new opportunities for entrepreneurs and increases demand for such capital.
One concern may be that because we are using time series observations on venture
fundraising and the independent variables, the results may be affected by serial correlation in the
21
error terms. The Durbin-Watson statistics for each of the regressions were between 1.88 and 2.00,
indicating that such serial correlation does not affect the results. As a diagnostic, we also ran
Cochrane-Orcutt regressions using a lag term which did not materially change the results.
4.2. State-level venture activity
One difficulty with the analysis in the previous section was the relatively small number of
observations. In order to gain additional power for our tests of market-wide venture activity, we
examine venture capital activity in each of the fifty states and the District of Columbia from 1976
through 1994. We can then examine how state level demand and supply factors affect venture
investing in those states.
We employ a slightly different approach here than in Sections 4.1 and 5: rather than
examining the formation of venture funds in each state, we measure the actual venture capital
investments. This reflects the difficulty of assigning venture organizations to particular states.
Many venture organizations have multiple offices, which may account for differing shares of the
investments. Venture organizations’ headquarters may reflect the need to be proximate to their
sources of capital and not their portfolio firms. For instance, many venture organizations are
based in New York City, even though this has historically been the site of few start-up firms.
This pattern is particularly true for groups specializing in the later-stage investments, which
typically occur after other groups (who may be geographically more proximate to the portfolio
firm) have already joined the board [Lerner (1995)].
22
We once again use the data of Venture Economics to determine venture capital activity
by state. In this case, we undertake a special tabulation of the number of companies financed
and dollar volume of financing in each state and year between 1976 and 1994. We include all
investments by private equity groups into young entrepreneurial firms, but exclude investments
into leveraged buyouts and restructurings by groups that primarily make venture capital
investments.
We also collect a variety of additional data on a state by state basis. Gross state product
has been compiled on an annual basis by the Department of Commerce’s Bureau of Economic
Analysis (1997) [also used was Friedenberg and Beemiller, (1997)]. For each state, we compiled
the total amount of research performed in industry and in academia, regardless of funding source.
The state industrial R&D data was compiled by the National Science Foundation (NSF) as part
of the “Survey of Research and Development in Industry” (1980, 1998b). The data posed two
problems. First, since 1978 this information has only been collected on a biannual basis. Thus,
it was necessary to impute the missing years. Second, certain states are persistently missing. In
these instances, the unassigned R&D in each region is assigned to each suppressed state on the
basis of its Gross State Product.8 The allocation of academic R&D expenditures by state is
determined the NSF’s annual “Survey of Research and Development Expenditures at
Universities and Colleges” (1998a). We obtain the marginal state tax rate on capital gains
through the use of the TAXSIM tax simulation program. We compute the impact of $1000 of
8For instance, in 1977, as in earlier and later years, data for New Hampshire and Vermont aresuppressed. Of the $2.4 billion of R&D spending in New England in that year, $2.3 billion isaccounted for by Connecticut, Maine, Massachusetts, and Rhode Island. We divide theremaining amount 65%-35% between New Hampshire and Vermont, proportional to their GrossState Products in that year.
23
capital gains on a wealthy individual in each state and year, controlling for the possible
deductibility of state taxes in Federal taxes. [The program is described in Feenberg and Coutts
(1993); the simulation and the resulting data are reproduced at
http://www.nber.org/~taxsim/state-rates.]
Table 3 looks at venture capital activity in each state by tabulating the total number of
companies that received venture capital and the total amount of venture capital invested from 1976
through 1994. The tremendous concentration of investment in four states is clearly evident.
California has by far the most venture investing activity with nearly $20 billion invested (in 1994
dollars). Massachusetts, New York, and Texas are the next most active states and account for the
bulk of the remaining capital. It is also clear that many states have almost no venture capital
activity. We seek to explore these patterns in a regression framework.
In Table 4 we present state fixed-effects regressions for the level of venture capital
investment per capita (in millions of 1994 dollars) and the number of companies receiving venture
capital per capita. We employ an observation for each year in each state, i.e., a balanced panel.
Independent variables include market-wide measures used in the regressions in Table 2 (logarithm
of IPO activity, the previous year’s real T-bill return, and the previous year’s equity market return).
In addition, we include several variables that might proxy for state-level demand conditions. These
include the previous year’s growth in state Gross State Product (GSP) per capita as well as measures
of last year’s academic and industrial expenditure on R&D (in millions of 1994 dollars) per capita.
The R&D expenditure potentially captures demand effects of high-technology firms. If R&D is
24
higher in a state, it may mean that the number of potential entrepreneurs with promising ideas may
be greater.
In addition, we include a dummy variable that is equal to one after 1978 to capture the effect
of changes in ERISA’s prudent man rule. Finally, we include several measures of the capital gains
tax rate burden. We first control for state and Federal capital gains taxes separately by including the
maximum marginal state and Federal capital gains tax rate separately. We then add the Federal and
state rates to create a variable which captures the total capital gains tax burden in that state.9
Table 4 shows that both industrial and academic R&D spending are significantly related to
state-level venture capital activity. Increases in state R&D levels increase both the amount of
venture capital invested as well as the number of firms receiving venture capital. This result
suggests that both academic and industrial R&D spending are potentially important for the creation
of entrepreneurial firms that demand venture capital.
Similarly, growth in GSP per capita is positively related to venture capital activity. This
result, consistent with the aggregate results, may indicate the importance of the demand effects, i.e.,
it is important to have a strong growing economy to create new firms that need venture capital
financing.
9The state tax measure only includes the marginal impact: i.e., any savings in Federal taxes dueto the deductibility of state taxes are factored in. All regressions include state fixed-effects.
25
The dummy variable measuring the shift in ERISA policy continues to have a positive effect
in the state-level regressions. After the clarification of ERISA, the amount of venture capital
invested per capita as well as the number of firms receiving venture capital per capita increases.
Finally, capital gains tax rates continue to matter. In the regressions including both state and
Federal rates, it is only the Federal rate that is significantly related to venture capital activity. The
state capital gains tax rate is, however, always negatively related to venture capital activity and is of
the same order of magnitude as the effect of Federal rates. The combined Federal and state capital
gains rate is also significantly related to venture capital activity. The result confirms the earlier
results. Capital gains tax rates do appear to be negatively related to venture capital activity.
5. Individual venture organization results
5.1. Summary statistics
In this section, we examine fundraising patterns by individual venture organizations. We
perform three levels of analysis. First, we present summary statistics for the database, both in its
entirety and segmented by year. We then analyze factors affecting the fundraising ability of
individual venture organizations. Finally, we examine the decision of venture organizations to
raise funds with a focus on early- and seed-stage firms. The importance of early- and seed-stage
funds in creating new firms is widely recognized. Many of the efforts to stimulate venture
activity focus on stimulating seed capital funds. Understanding the unique factors affecting the
decision to target these firms is important for potential policy decisions. We examine fund
information collected by Venture Economics from 1961 through 1992.
Table 5 presents information on the completeness of the venture fundraising database. In
all, we have information on 1294 venture capital funds. Of those, we have information on the fund
26
size and closing date for 846 (20 of these are missing month of closing). The average venture
organization in the sample raised 2.23 funds while the median raised only 1. The maximum number
of venture funds raised by an organization is 25. The average venture organization raised $126
million in 1994 dollars while the largest organization had raised over $2 billion.
The time series distribution of our sample is presented in Table 6. We see growth in both
the number of funds raised and dollar volume of commitments in the early- and mid-1980s. The
sample also appears to exhibit a slight growth in the size of funds raised (in constant 1994 dollars).
If we look at the sum of all the funds in our sample, we have data on $45.0 billion in venture
funding which represents nearly all the capital raised by organized venture capital partnerships
during the sample period.10 The lack of size data for 448 of the funds does not impart bias to our
results. Our data cover almost all the capital raised over the sample period and, hence, the results
are clearly applicable to the most important firms.
5.2. Fundraising regression results
We analyze firm level fundraising by using one yearly observation for each venture
organization starting with the year that they raise their first venture capital fund. The dependent
variable is either a dummy variable indicating whether the venture organization raised a fund or
the amount of money (in millions of 1994 dollars) raised in that year. Independent variables
include the age of the venture organization, the amount of money it raised during the previous
10The Federal government does not collect numbers on venture capital inflows. The VentureEconomics database, however, corresponds closely to those of another consulting firm, AssetAlternatives, as well as estimates by practitioners.
27
ten years11 (in millions of 1994 dollars), the value of equity held by this venture organization in
firms brought public in that year and the previous year, the value of all venture-backed firms
brought public in the previous year, real GDP growth in the previous year, the previous year’s
Treasury bill return, the previous year’s stock market return as measured by the annual return on
the CRSP value weighted market index, a dummy variable that equals one after 1978 (indicating
years after the clarification of the ERISA prudent man rule), and the top marginal capital gains
tax rate on individuals.
We estimate a Heckman two-stage model. The Heckman model estimates two equations.
The first is the probability that a fund was raised in a given year. The second equation then
estimates the amount raised given that a fund was raised in a particular year. This two-stage
model is appropriate if the correct decision is that venture capitalists first decide whether to raise
a new fund or not. Once they decide to raise a new fund, the venture capitalists then decide the
size of fund they wish to raise. The two equations give us insights about factors that affect the
probability of raising a new fund and ones that primarily affect the optimal fund size.
Table 7 gives the results from the Heckman models. The first regression in each model
gives the probability of raising a new fund, while the second regression gives the size of a fund
conditional on it being raised. We find that neither the capital gains tax rate nor ERISA’s
clarification have a significant effect on the probability of a venture organization raising a new
fund. The ERISA dummy has no effect on the size of the fund either. The capital gains tax rate
11We look at money raised over the previous ten years because that is the specified life-span of atypical venture capital limited partnership agreement. The ten-year sum provides the bestavailable estimate of capital under management.
28
does, however, have a significant effect on the size of the fund raised. Lower capital gains tax
rates are associated with larger funds. This would be expected if venture organizations raised
new funds on a normal cycle that was typically unaffected by external factors. Changes in the
capital gains tax rate may affect the quantity of good start-ups to finance as managers are
induced to start firms. The greater quantity of good projects would lead venture capitalists to
raise larger funds.
We also find that firm performance has a dramatic effect on fundraising. Both the value
of equity held in firms taken public by the venture capital firm in the current year and in the
previous year have a positive effect on the probability of raising a new fund and the size of the
fund. The effect of the previous year’s IPO volume is nearly four times as large as the current
year’s. This might be due to the long process of raising a new fund (which may take many
months). Venture organizations go on “road shows” and gauge investor interest, sign up
prospective investors, and generate the necessary documents prior to closing. The more relevant
performance is probably the previous year’s returns, which are foremost in investors’ minds
during fundraising.
Reputation also appears to have a positive effect on the size of the fund raised. Older and
larger venture organizations have higher probabilities of raising funds and raise larger funds.
The reputation variable potentially captures beliefs about future returns not captured in recent
performance variables. The effect of venture organization size is particularly strong on the size
of the fund raised. This could indicate that venture organization size is a good proxy for
reputation. Venture organization size might also measure the need to raise larger funds. Large
29
venture organizations may have more employees and general partners. In order to keep all of
them working at capacity, the minimum fund size needed is substantially higher.
We find that the Treasury bill return in the previous year is positively related to the
probability of raising a new fund. This effect may stem from the rapid increase in funds being
raised in the early 1980s at a time when real interest rates were high. Both the probability of
raising a fund and the size of a new fund raised first decline and then increase with time from the
previous fund.12
We present the fixed-effects regression models in Table 8. The fixed-effects models
include dummy variables for each venture organization that are intended to pick up unmeasured
firm-specific factors. If we find a result even after controlling for firm fixed effects, we can be
confident that the effects are robust. We could not estimate the fixed-effects Heckman model.
Therefore, we run two separate regressions. The first is a fixed-effects logit which estimates the
probability of raising a fund in a given year. The second regression is a fixed-effects least
squares regression that estimates the size of funds raised conditional on a fund being raised. The
approximation to the two-stage maximum likelihood Heckman model is consistent in the
estimations without the fixed effects, so we are confident that the results in Table 8 are
reasonable [Maddala (1987)].
In both specifications, the capital gains tax rate continues to be a significant factor in
venture fundraising. A decrease in the capital gains tax rate increases the size of funds raised in
12The regression results are robust to various segmentations of the data, e.g., examining firmslocated on the West Coast and East Coast.
30
all the specifications. In the first model, the ERISA dummy variable has an important impact.
Controlling for firm factors, the ERISA clarification leads to a greater probability of raising a
new fund.
Venture organization performance (as measured by the value of equity stakes in initial
public offerings) continues to have a positive effect on fundraising. In the two-stage model with
firm fixed effects, the probability of raising a fund increases with greater performance, but the
size of the fund does not appear to be affected. We find, however, that the reputation variables
have mixed signs in the fixed-effects regression, which are different from the regressions without
the firm fixed effects. In the two-stage model, the probability of raising a fund is lower for older
and larger organizations, but the fund size is larger. As a firm ages, the probability of raising a
new fund declines, although the size of funds being raised increases. This lower probability of
raising a fund may reflect the retirement of partners within older venture organizations.
Unconditionally, older firms are more likely to raise a fund because of their better track record.
Controlling for firm effects, however, as a firm ages, it becomes less likely to raise a fund.
5.3. Stage focus results
We also undertake an analysis of the ability of venture capital organizations to raise a
fund that focuses on early-stage investments. The early-stage venture market is often seen as
being critical to the success of later-stage investments. Early-stage funds provide new firms with
critical financing in their infancy [see for instance OECD (1996)]. Many of the policy initiatives
undertaken across the country and around the world are aimed at increasing the availability of
early-stage capital. Similarly, firms in their very early stages are the most prone to capital
31
rationing and liquidity constraints because the uncertainty and asymmetric information are the
greatest. If we can understand the incentives to raise a focused fund, we might be able to
understand industry dynamics better and may make better recommendations about promoting
new entrepreneurial firms.
We divide firms into two categories in this analysis. We indicate whether the funds
analyzed above have a stated investment focus on early-stage firms only. (Venture Economics
characterizes each fund’s focus in their database.) Table 9 presents summary statistics for
venture funds that have a stated early-stage focus and those that do not. We find that funds
focusing on early-stage investments are significantly smaller, with a mean [median] size of $42
[$25] million, than are funds that do not focus on early-stage investments (mean of $57 [$36]
million). This makes sense because early-stage investments are typically smaller than later-stage
investments. Gompers (1995) finds that the average early-stage investment is only half as large
as the mean later-stage investment. Because the amount of time spent during the investment and
monitoring process (e.g., due diligence, negotiations, etc.) and the need for oversight after the
investment is similar, early-stage funds are usually smaller.
We also find that early-stage funds tend to be raised by venture organizations that are
slightly older and larger. One possibility is that older, more experienced venture organizations
have the necessary knowledge to raise a focused fund. The early-stage funds are, on average,
more recent and are more likely to be raised on the West Coast. Clearly, the mix of investments
on the West Coast, primarily California, is heavily concentrated on early-stage, technology-based
32
companies. East Coast firms are more balanced and tend to invest in greater fractions of later-
stage companies.
In Table 10 we present multivariate regressions analyzing the determinants of fund focus.
We use each new venture capital fund as an observation and examine whether it had an early-
stage focus. As the summary statistics hinted, smaller funds are more likely to have an early-
stage focus. Similarly, we find that firms on the West Coast are more likely to raise an early-
stage fund. Finally, we find that a venture organization is more likely to raise a fund with an
early-stage focus after the Department of Labor’s clarification of ERISA’s prudent man rule.
This greater probability following ERISA change is potentially due to the clarification stating
that investments would be judged prudent not by their individual risk, but by their contribution to
portfolio risk. Prior to this amendment, early-stage funds may have been viewed as too
speculative and may have had a more difficult time raising money than a later-stage or general
purpose venture capital fund. After the amendment, venture organizations could raise focused
funds without worrying that pension funds would avoid it out of concern over its perceived
riskiness.
6. Alternative Explanations
Several alternative explanations may account for the findings in Sections 4 and 5. First,
the supply and demand for venture capital may be affected by the supply of substitute financing.
We have attempted to control for the cost of credit by including the real interest rate. In periods
of high real interest rates, venture capital may be more attractive from the entrepreneur’s
perspective. Similarly, if the availability of bank financing were a major factor in the
33
determination of venture capital commitments, then we should have seen an increase in venture
capital commitments in the late 1980s and early 1990s, when bank credit to young, small firms
substantially declined. Instead, we see a decline in venture capital commitments over this time
period, indicating that bank credit and venture fundraising moved together.
A second alternative explanation for our results on capital gains taxes and venture
commitments may be the inability to accurately measure expected GDP growth. If expected
GDP growth is somehow correlated with capital gains tax rates, then we might be incorrectly
interpreting the significance to capital gains tax rates. In unreported regressions, we modeled
expected GDP growth using the previous four years of real GDP growth. Instead of lagged GDP
growth, we reestimated the regressions using the expected GDP growth rate. Results were
qualitatively the same as in Sections 4 and 5. This is not surprising since the expected GDP
growth rate is primarily affected by last year’s growth.
Finally, the growth in venture capital commitments may have less to do with policy
changes and more to do with changes in the amount of technological opportunities. In fact, the
state level R&D expenditures indicate that this may be the case. If changes in technological
opportunity were causing increases in venture capital investments, we would expect several
measures of technological innovation to lead increases in venture fundraising. In particular,
Kortum and Lerner (1998) show that a surge of patents occurred in the late 1980s and 1990s.
This suggests that some of the recent growth in venture capital fundraising in the mid-1990s may
be due to increases in technological opportunities. The increase in venture fundraising in the late
1970s and 1980s (the period of our sample), however, does not seem to be caused by similar
34
technology shifts. Similarly, the state level analysis shows that even controlling for R&D
spending, regulatory policies still have an effect.
7. Conclusion
In this paper, we examine the determinants of fundraising for the venture industry and
individual venture organizations. We examine supply and demand effects as well as the
importance of individual firm performance and reputation.
We find that demand for venture capital appears to play a critical role. Higher GDP
growth and increases in R&D spending lead to greater venture capital activity. We also find that
capital gains tax rates matter, with lower rates leading to a greater quantity of venture capital
raised. The effect, however, appears to stem from a greater demand for venture capital:
commitments by tax-exempt pension funds are the most affected by changes in the capital gains
tax rate. We find evidence that ERISA clarification in rules governing pension fund investment
have generally increased commitments to the industry.
Fund performance is an important determinant of the ability of venture organizations to
raise new capital. Firms that hold larger equity stakes in firms that have recently gone public
raise funds with greater probability and raise larger funds. Reputation, in the form of firm age
and size, also positively impacts the ability to raise new capital.
We also provide evidence that the decision to raise an early-stage venture fund has been
affected by pension regulations. The probability of raising a focused fund increased after
35
ERISA’s clarification. We also find greater early-stage activity in smaller funds and venture
organizations on the West Coast where technology-based startups are more prevalent.
Our research has a variety of implications for policy makers who wish to stimulate
venture capital activity. The fundraising results indicate that regulatory reform and policy
decisions may have an effect on commitments to the venture industry. While the capital gains
tax rate is an important driver of venture capital fundraising, blanket reduction in capital gains
tax rates may be a blunt instrument for promoting venture capital. Our analysis suggests that an
important factor for the increase in venture capital is probably increases in the number of high
quality startups. The greater number of good firms leads to more demand for venture capital.
Policies that increase the relative attractiveness of becoming an entrepreneur and promote
technology innovation probably would have more of an effect on venture capital investments
than an across the board cut in the capital gains tax rate. Furthermore, the results highlight the
highly localized nature of venture capital activity. Countries that wish to promote venture capital
activity may consider concentrating efforts rather than spreading resources uniformly around the
country. This is in contrast to many of the efforts that various countries have instituted.
The results also raise a series of questions for further research. In general, the role of
reputation and performance as determinants of fundraising is consistent with earlier literature for
other types of money managers. The decision to invest is clearly predicated on the expectation
of future returns, and both past performance and reputation are components of the expected
future returns. But in recent years, many of the most established venture organizations in the
U.S. have experienced internal corporate governance problems and have been disbanded. The
36
issue of who carries the reputation with them is important. Does reputation follow general
partners who start their own fund or must they establish new reputations? In markets without
experienced venture capitalists, how can the lack of reputation be overcome? Clearly, more
work is necessary.
Another set of unanswered questions relates to the effectiveness of public efforts to
transfer the venture capital model to other regions. Even if venture capital organizations spur
technological innovation in the United States, it is not evident that the model can be seamlessly
transferred abroad. Different employment practices, regulatory policies, or public market
avenues might limit the formation these funds [see Black and Gilson (1998) for a discussion].
Even if it were feasible to transfer such efforts, public economic development programs can be
subject to political manipulation: e.g., pressures to award funds to politically connected
businesses.
On the other hand, overseas venture initiatives may be able to benefit from the experience
of venture organizations in the United States. In particular, the Israeli Yozma program seems to
have successfully captured “spillovers” of knowledge from U.S. and British venture
organizations. In contrast to many forms of government intervention to boost economic growth,
the implementation of these programs has received little scrutiny by economists. [Two recent
exceptions are Irwin and Klenow (1996) and Lerner (1996).] This is a ripe area for further
exploration.

37
Venture capital is increasingly regarded as an important component of the U.S. economic
landscape. While policy makers have often tried to affect the flow of funds into the sector, little
has been known about the real impact of such policy measures. Our paper begins to answer
those questions and points towards areas for future research.
38
References
Anand, Bharat. 1996. "Tax Effects on Venture Capital." Unpublished working paper, YaleSchool of Management.
Barry, Christopher B., Chris J. Muscarella, John W. Peavy III, and Michael R. Vetsuypens.1990. "The Role of Venture Capital in the Creation of Public Companies: Evidence fromthe Going Public Process." Journal of Financial Economics 27: 447-71.
Black, Bernard S., and Ronald J. Gilson. 1998. "Venture Capital and the Structure ofCapital Markets: Banks versus Stock Markets." Journal of Financial Economics 47: 243-278.
Brav, Alon, and Paul A. Gompers. 1997. "Myth or Reality? The Long-RunUnderperformance of Initial Public Offerings: Evidence from Venture Capital andNonventure Capital-backed Companies." Journal of Finance 52: 1791-1822.
Chevalier, Judith A., and Glenn D. Ellison. 1997. "Risk Taking by Mutual Funds as aResponse to Incentives." Journal of Political Economy 105: 1167-1200.
Feenberg, Daniel R., and Elizabeth Coutts. 1993. "An Introduction to the TAXSIMModel." Journal of Policy Analysis and Management 12: 189-194.
Friedenberg, H.L., and R.M. Beemiller. 1997. "Comprehensive Revision of Gross StateProduct by Industry. 1977-94." Survey of Current Business 77 (June): 15-41.
Gompers, Paul A. 1995. "Optimal Investment. Monitoring. and the Staging of VentureCapital." Journal of Finance 50: 1461-1490.
Gompers, Paul A., and Josh Lerner. 1996. "The Use of Covenants: An Empirical Analysisof Venture Partnership Agreements." Journal of Law and Economics 39: 463-498.
Gompers, Paul A., and Josh Lerner. 1997. "Risk and Reward in Private Equity Investments:The Challenge of Performance Assessment." Journal of Private Equity 1: 5-12.
Gompers, Paul A., and Josh Lerner. 1998a. "An Analysis of Compensation in the U.S.Venture Capital Partnership." Journal of Financial Economics forthcoming.
Gompers, Paul A., and Josh Lerner. 1998b. "Venture Capital Distributions: Short- andLong-Run Reactions." Journal of Finance forthcoming.
Grinblatt, Mark, Sheridan Titman, and Russ Wermers. 1995. "Momentum InvestmentStrategies, Portfolio Performance, and Herding: A Study of Mutual Fund Behavior."American Economic Review 85: 1088-1105.
Ippolito, Richard. 1989. "Efficiency with Costly Information: A Study of Mutual FundPerformance, 1965-1984." Quarterly Journal of Economics 104: 1-23.
39
Irwin, Douglas A., and Peter J. Klenow. 1996. “High Tech R&D Subsidies: Estimating the Effectsof Sematech.” Journal of International Economics 40: 323-344.
Jensen, Michael. 1968. “The Performance of Mutual Funds in the Period 1945-1964.” Journal ofFinance 23: 389-416.
Kortum, Samuel, and Josh Lerner. 1998. “Stronger Protection or Technological Revolution: Whatis Behind the Recent Surge of Patenting?” Carnegie-Rochester Conference Series on Public Policyforthcoming.
Lerner, Josh. 1995. "Venture Capitalists and the Oversight of Private Firms." Journal of Finance50: 301-18.
Lerner, Josh. 1996. “The Government as Venture Capitalist: The Long-Run effects of the SBIRProgram.” Working paper no. 5753, National Bureau of Economic Research.
Liles, Patrick. 1977. Sustaining the Venture Capital Firm. Cambridge: Management AnalysisCenter.
Maddala, G.S. 1987. Limited-Dependent and Qualitative Variables in Econometrics. Cambridge:Cambridge University Press.
Megginson, William C., and Kathleen A. Weiss. 1991. "Venture Capital Certification in InitialPublic Offerings." Journal of Finance 46: 879-93.
Organization for Economic Co-operation and Development. 1996. Government Programs forVenture Capital. Paris: Organization for Economic Co-operation and Development.
Poterba, James. 1989. “Venture Capital and Capital Gains Taxation.” In Lawrence Summers.editor. Tax Policy and the Economy. Cambridge: MIT Press.
Scholes, Myron S. 1972. “The Market for Securities: Substitution versus Price Pressure and theEffects of Information on Share Prices.” Journal of Business 45: 179-211.
Sirri, Erik, and Peter Tufano. 1998. "Costly Search and Mutual Fund Flows.” Journal of Financeforthcoming.
U.S. Department of Commerce. Bureau of Economic Analysis. 1997. “Gross State Product byIndustry: Original Experimental Estimates, 1963-1986.” Unpublished data file (Washington).
U.S. National Science Foundation. Division of Science Resource Studies. 1980. Research andDevelopment in Industry—1979. Washington: U.S. Government Printing Office.
U.S. National Science Foundation. Division of Science Resource Studies. 1998a. “Survey ofResearch and Development Expenditures at Universities and Colleges.” http://caspar.nsf.gov.

40
U.S. National Science Foundation. Division of Science Resource Studies. 1998b. “Survey ofResearch and Development in Industry.” http://www.nsf.gov/sbe/srs/sind/start.htm.
Venture Economics. 1988. Exiting Venture Capital Investments. Needham: Venture Economics.
Venture Economics. 1996. Pratt’s Guide to Venture Capital Sources. New York: SDC Publishing.
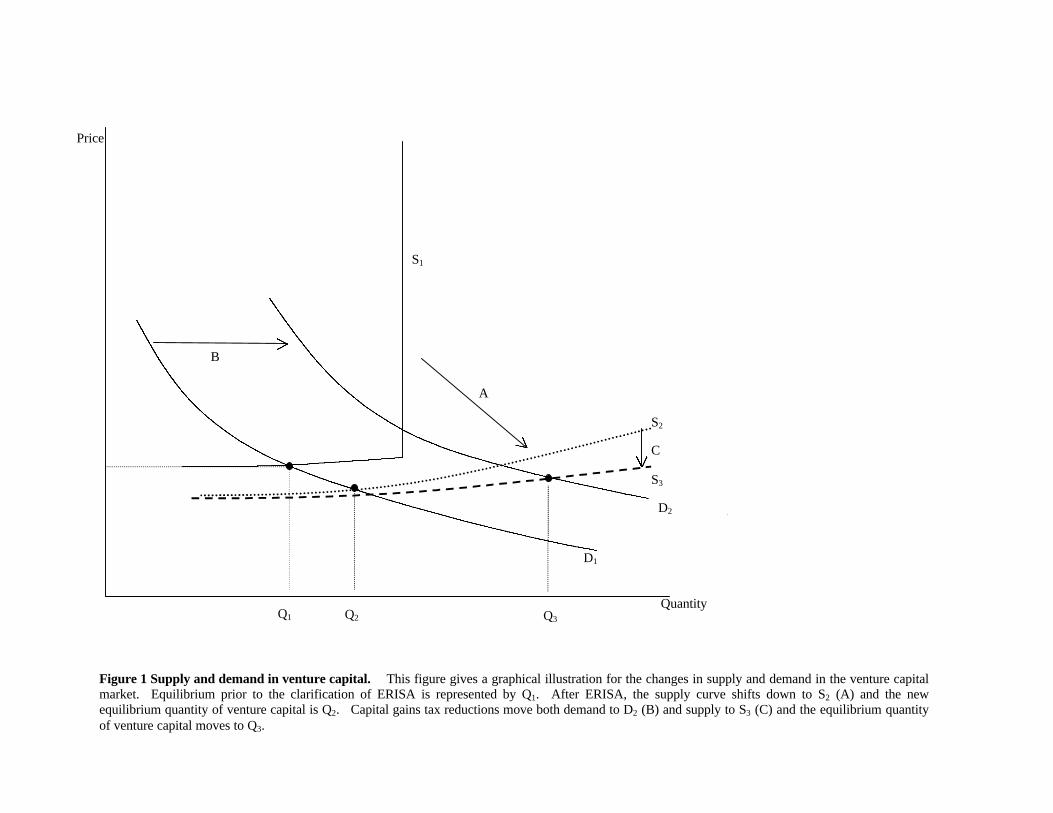
Figure 1 Supply and demand in venture capital. This figure gives a graphical illustration for the changes in supply and demand in the venture capitalmarket. Equilibrium prior to the clarification of ERISA is represented by Q1. After ERISA, the supply curve shifts down to S2 (A) and the newequilibrium quantity of venture capital is Q2. Capital gains tax reductions move both demand to D2 (B) and supply to S3 (C) and the equilibrium quantityof venture capital moves to Q3.
Quantity
6
D1
D2
Q3Q1 Q2
B
Price
S1
S2
S3
C
D2
A
$0
$1,000
$2,000
$3,000
$4,000
$5,000
$6,000
1969
1970
1971
1972
1973
1974
1975
1976
1977
1978
1979
1980
1981
1982
1983
1984
1985
1986
1987
1988
1989
1990
1991
1992
1993
1994
Year
Co
mm
itm
ents
to
th
e V
entu
re C
apit
al
Ind
ust
ry (
1994
$s)
$0
$5,000
$10,000
$15,000
$20,000
$25,000
Mar
ket
Val
ue
fo V
entu
re C
apit
al-
bac
ked
IPO
s (1
994
$s)
Net New Commitments to the Venture Capital Industry ($ millions)
Total Market Value of Companies
Figure 2 Venture fundraising and IPO activity. The bar graph shows annual commitments to the venture capital industry in millions of constant 1994 dollars. The linegraph shows the annual market value of all venture capital-backed firms issuing equity in an initial public offering.
$0
$1,000
$2,000
$3,000
$4,000
$5,000
$6,000
1972
1973
1974
1975
1976
1977
1978
1979
1980
1981
1982
1983
1984
1985
1986
1987
1988
1989
1990
1991
1992
1993
1994
Year
Co
mm
itm
ents
to
th
e V
entu
re C
apit
al
Ind
ust
ry (
1994
$s)
0%
5%
10%
15%
20%
25%
30%
35%
40%
45%
50%
Cap
ital
Gai
ns
Tax
Rat
e
Net New Commitments to the Venture Capital Industry ($ millions)Capital gains tax
Figure 3 Venture fundraising and capital gains tax rate. The bar graph shows annual commitments to the venture capital industry in millions of constant 1994 dollars. Theline graph shows the highest marginal capital gains tax rate effective in that year.
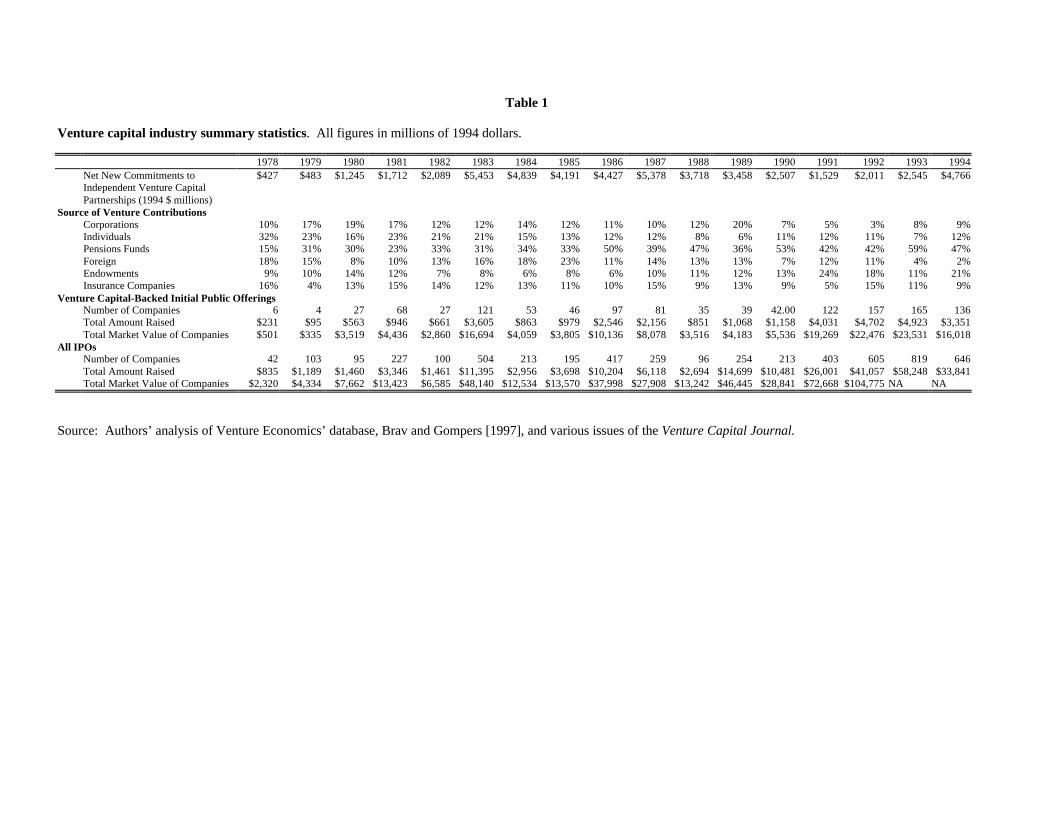
Table 1
Venture capital industry summary statistics. All figures in millions of 1994 dollars.
1978 1979 1980 1981 1982 1983 1984 1985 1986 1987 1988 1989 1990 1991 1992 1993 1994Net New Commitments toIndependent Venture CapitalPartnerships (1994 $ millions)
$427 $483 $1,245 $1,712 $2,089 $5,453 $4,839 $4,191 $4,427 $5,378 $3,718 $3,458 $2,507 $1,529 $2,011 $2,545 $4,766
Source of Venture ContributionsCorporations 10% 17% 19% 17% 12% 12% 14% 12% 11% 10% 12% 20% 7% 5% 3% 8% 9%Individuals 32% 23% 16% 23% 21% 21% 15% 13% 12% 12% 8% 6% 11% 12% 11% 7% 12%Pensions Funds 15% 31% 30% 23% 33% 31% 34% 33% 50% 39% 47% 36% 53% 42% 42% 59% 47%Foreign 18% 15% 8% 10% 13% 16% 18% 23% 11% 14% 13% 13% 7% 12% 11% 4% 2%Endowments 9% 10% 14% 12% 7% 8% 6% 8% 6% 10% 11% 12% 13% 24% 18% 11% 21%Insurance Companies 16% 4% 13% 15% 14% 12% 13% 11% 10% 15% 9% 13% 9% 5% 15% 11% 9%
Venture Capital-Backed Initial Public OfferingsNumber of Companies 6 4 27 68 27 121 53 46 97 81 35 39 42.00 122 157 165 136Total Amount Raised $231 $95 $563 $946 $661 $3,605 $863 $979 $2,546 $2,156 $851 $1,068 $1,158 $4,031 $4,702 $4,923 $3,351Total Market Value of Companies $501 $335 $3,519 $4,436 $2,860 $16,694 $4,059 $3,805 $10,136 $8,078 $3,516 $4,183 $5,536 $19,269 $22,476 $23,531 $16,018
All IPOsNumber of Companies 42 103 95 227 100 504 213 195 417 259 96 254 213 403 605 819 646Total Amount Raised $835 $1,189 $1,460 $3,346 $1,461 $11,395 $2,956 $3,698 $10,204 $6,118 $2,694 $14,699 $10,481 $26,001 $41,057 $58,248 $33,841Total Market Value of Companies $2,320 $4,334 $7,662 $13,423 $6,585 $48,140 $12,534 $13,570 $37,998 $27,908 $13,242 $46,445 $28,841 $72,668 $104,775 NA NA
Source: Authors’ analysis of Venture Economics’ database, Brav and Gompers [1997], and various issues of the Venture Capital Journal.
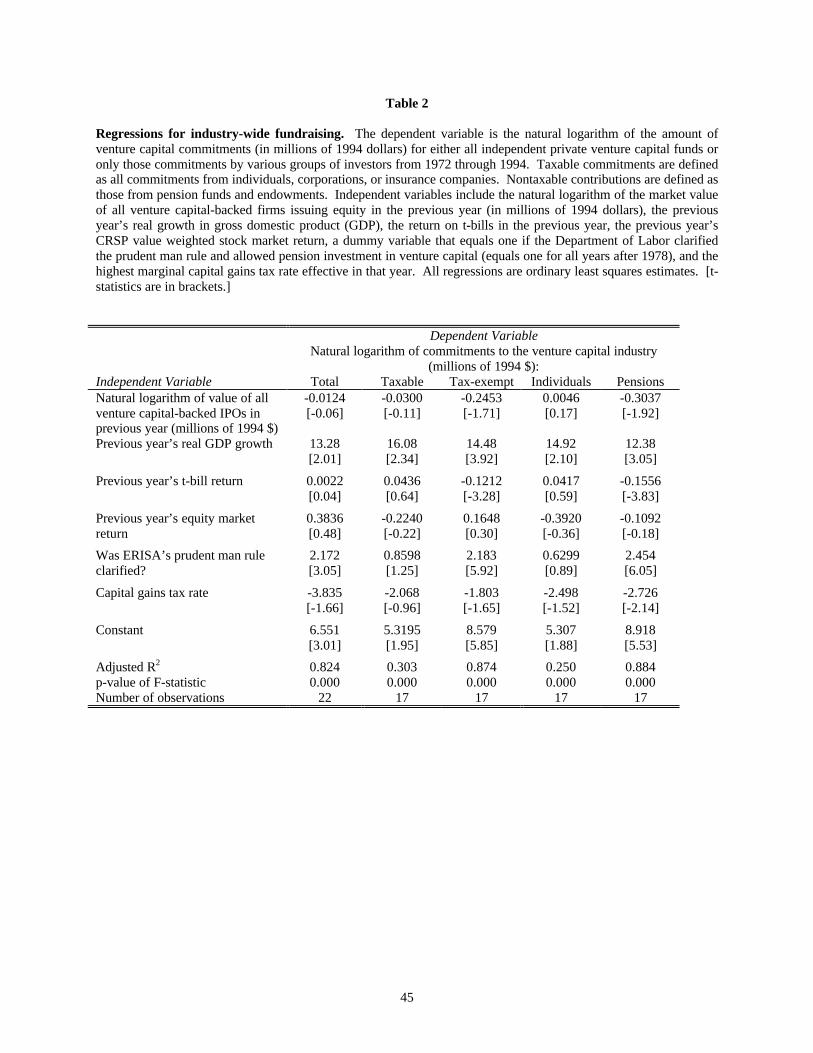
45
Table 2
Regressions for industry-wide fundraising. The dependent variable is the natural logarithm of the amount ofventure capital commitments (in millions of 1994 dollars) for either all independent private venture capital funds oronly those commitments by various groups of investors from 1972 through 1994. Taxable commitments are definedas all commitments from individuals, corporations, or insurance companies. Nontaxable contributions are defined asthose from pension funds and endowments. Independent variables include the natural logarithm of the market valueof all venture capital-backed firms issuing equity in the previous year (in millions of 1994 dollars), the previousyear’s real growth in gross domestic product (GDP), the return on t-bills in the previous year, the previous year’sCRSP value weighted stock market return, a dummy variable that equals one if the Department of Labor clarifiedthe prudent man rule and allowed pension investment in venture capital (equals one for all years after 1978), and thehighest marginal capital gains tax rate effective in that year. All regressions are ordinary least squares estimates. [t-statistics are in brackets.]
Dependent VariableNatural logarithm of commitments to the venture capital industry
(millions of 1994 $):Independent Variable Total Taxable Tax-exempt Individuals PensionsNatural logarithm of value of allventure capital-backed IPOs inprevious year (millions of 1994 $)
-0.0124[-0.06]
-0.0300[-0.11]
-0.2453[-1.71]
0.0046[0.17]
-0.3037[-1.92]
Previous year’s real GDP growth 13.28[2.01]
16.08[2.34]
14.48[3.92]
14.92[2.10]
12.38[3.05]
Previous year’s t-bill return 0.0022[0.04]
0.0436[0.64]
-0.1212[-3.28]
0.0417[0.59]
-0.1556[-3.83]
Previous year’s equity marketreturn
0.3836[0.48]
-0.2240[-0.22]
0.1648[0.30]
-0.3920[-0.36]
-0.1092[-0.18]
Was ERISA’s prudent man ruleclarified?
2.172[3.05]
0.8598[1.25]
2.183[5.92]
0.6299[0.89]
2.454[6.05]
Capital gains tax rate -3.835[-1.66]
-2.068[-0.96]
-1.803[-1.65]
-2.498[-1.52]
-2.726[-2.14]
Constant 6.551[3.01]
5.3195[1.95]
8.579[5.85]
5.307[1.88]
8.918[5.53]
Adjusted R2 0.824 0.303 0.874 0.250 0.884p-value of F-statistic 0.000 0.000 0.000 0.000 0.000Number of observations 22 17 17 17 17
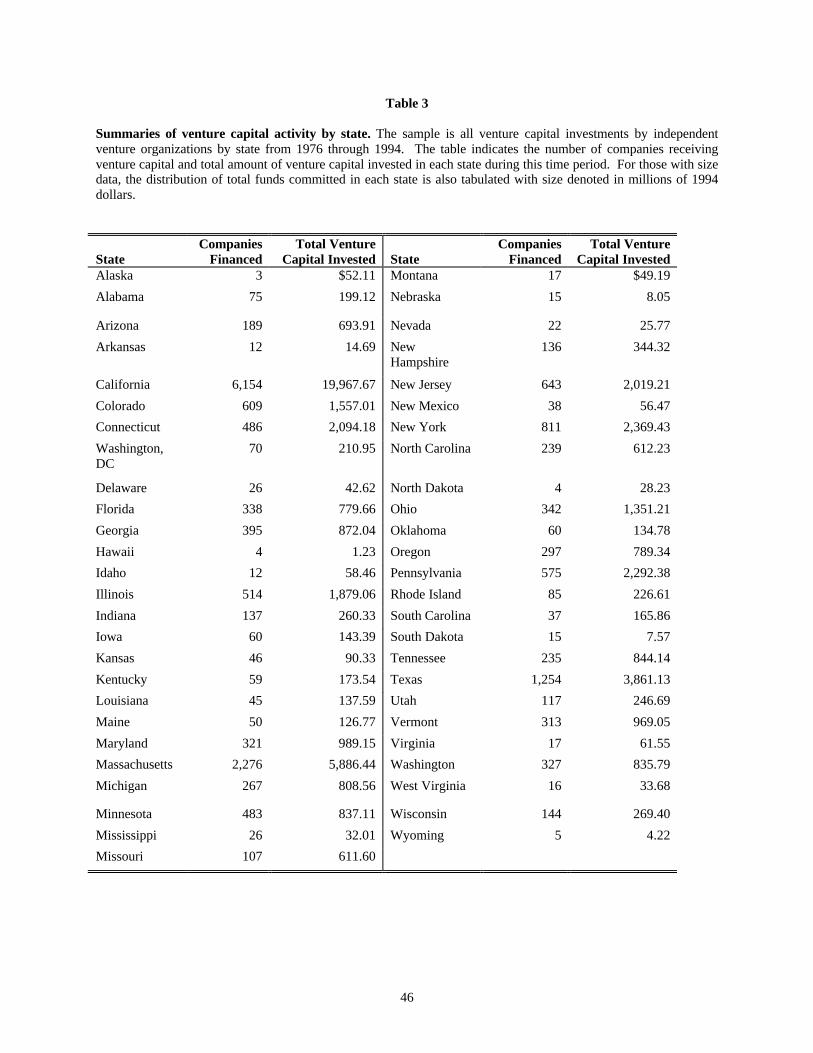
46
Table 3
Summaries of venture capital activity by state. The sample is all venture capital investments by independentventure organizations by state from 1976 through 1994. The table indicates the number of companies receivingventure capital and total amount of venture capital invested in each state during this time period. For those with sizedata, the distribution of total funds committed in each state is also tabulated with size denoted in millions of 1994dollars.
StateCompanies
FinancedTotal Venture
Capital Invested StateCompanies
FinancedTotal Venture
Capital InvestedAlaska 3 $52.11 Montana 17 $49.19
Alabama 75 199.12 Nebraska 15 8.05
Arizona 189 693.91 Nevada 22 25.77
Arkansas 12 14.69 NewHampshire
136 344.32
California 6,154 19,967.67 New Jersey 643 2,019.21
Colorado 609 1,557.01 New Mexico 38 56.47
Connecticut 486 2,094.18 New York 811 2,369.43
Washington,DC
70 210.95 North Carolina 239 612.23
Delaware 26 42.62 North Dakota 4 28.23
Florida 338 779.66 Ohio 342 1,351.21
Georgia 395 872.04 Oklahoma 60 134.78
Hawaii 4 1.23 Oregon 297 789.34
Idaho 12 58.46 Pennsylvania 575 2,292.38
Illinois 514 1,879.06 Rhode Island 85 226.61
Indiana 137 260.33 South Carolina 37 165.86
Iowa 60 143.39 South Dakota 15 7.57
Kansas 46 90.33 Tennessee 235 844.14
Kentucky 59 173.54 Texas 1,254 3,861.13
Louisiana 45 137.59 Utah 117 246.69
Maine 50 126.77 Vermont 313 969.05
Maryland 321 989.15 Virginia 17 61.55
Massachusetts 2,276 5,886.44 Washington 327 835.79
Michigan 267 808.56 West Virginia 16 33.68
Minnesota 483 837.11 Wisconsin 144 269.40
Mississippi 26 32.01 Wyoming 5 4.22
Missouri 107 611.60
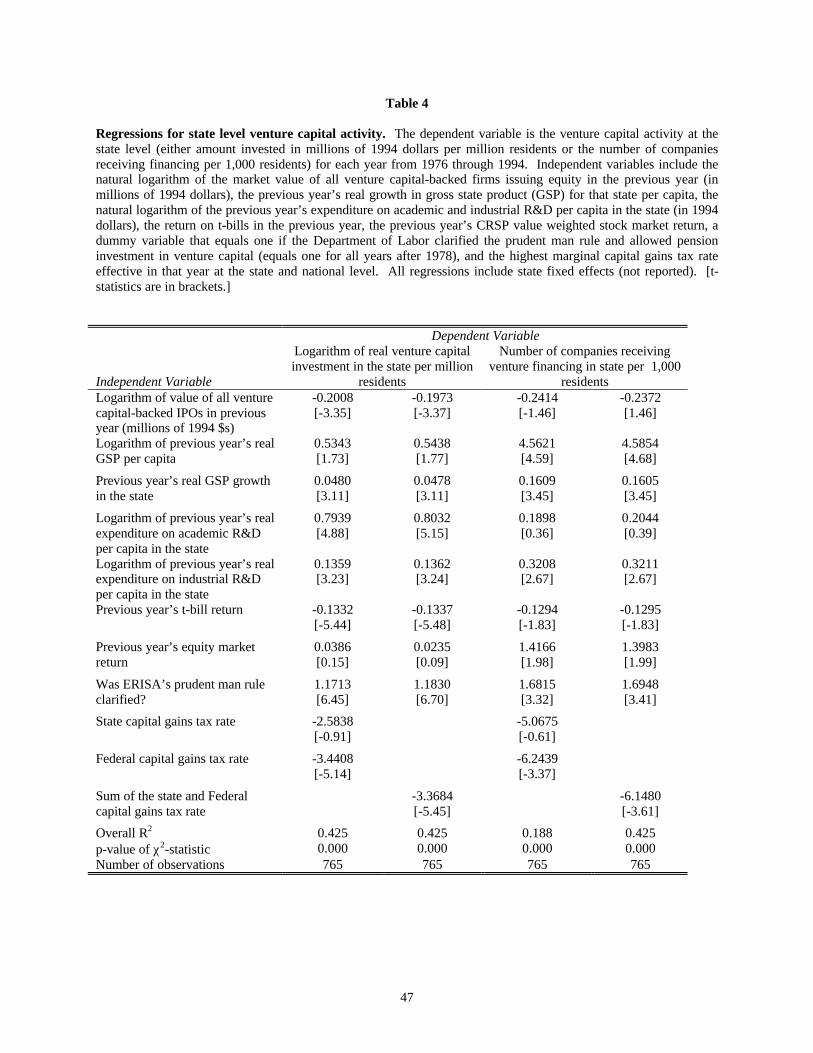
47
Table 4
Regressions for state level venture capital activity. The dependent variable is the venture capital activity at thestate level (either amount invested in millions of 1994 dollars per million residents or the number of companiesreceiving financing per 1,000 residents) for each year from 1976 through 1994. Independent variables include thenatural logarithm of the market value of all venture capital-backed firms issuing equity in the previous year (inmillions of 1994 dollars), the previous year’s real growth in gross state product (GSP) for that state per capita, thenatural logarithm of the previous year’s expenditure on academic and industrial R&D per capita in the state (in 1994dollars), the return on t-bills in the previous year, the previous year’s CRSP value weighted stock market return, adummy variable that equals one if the Department of Labor clarified the prudent man rule and allowed pensioninvestment in venture capital (equals one for all years after 1978), and the highest marginal capital gains tax rateeffective in that year at the state and national level. All regressions include state fixed effects (not reported). [t-statistics are in brackets.]
Dependent Variable
Independent Variable
Logarithm of real venture capitalinvestment in the state per million
residents
Number of companies receivingventure financing in state per 1,000
residentsLogarithm of value of all venturecapital-backed IPOs in previousyear (millions of 1994 $s)
-0.2008[-3.35]
-0.1973[-3.37]
-0.2414[-1.46]
-0.2372[1.46]
Logarithm of previous year’s realGSP per capita
0.5343[1.73]
0.5438[1.77]
4.5621[4.59]
4.5854[4.68]
Previous year’s real GSP growthin the state
0.0480[3.11]
0.0478[3.11]
0.1609[3.45]
0.1605[3.45]
Logarithm of previous year’s realexpenditure on academic R&Dper capita in the state
0.7939[4.88]
0.8032[5.15]
0.1898[0.36]
0.2044[0.39]
Logarithm of previous year’s realexpenditure on industrial R&Dper capita in the state
0.1359[3.23]
0.1362[3.24]
0.3208[2.67]
0.3211[2.67]
Previous year’s t-bill return -0.1332[-5.44]
-0.1337[-5.48]
-0.1294[-1.83]
-0.1295[-1.83]
Previous year’s equity marketreturn
0.0386[0.15]
0.0235[0.09]
1.4166[1.98]
1.3983[1.99]
Was ERISA’s prudent man ruleclarified?
1.1713[6.45]
1.1830[6.70]
1.6815[3.32]
1.6948[3.41]
State capital gains tax rate -2.5838[-0.91]
-5.0675[-0.61]
Federal capital gains tax rate -3.4408[-5.14]
-6.2439[-3.37]
Sum of the state and Federalcapital gains tax rate
-3.3684[-5.45]
-6.1480[-3.61]
Overall R2 0.425 0.425 0.188 0.425p-value of χ2-statistic 0.000 0.000 0.000 0.000Number of observations 765 765 765 765
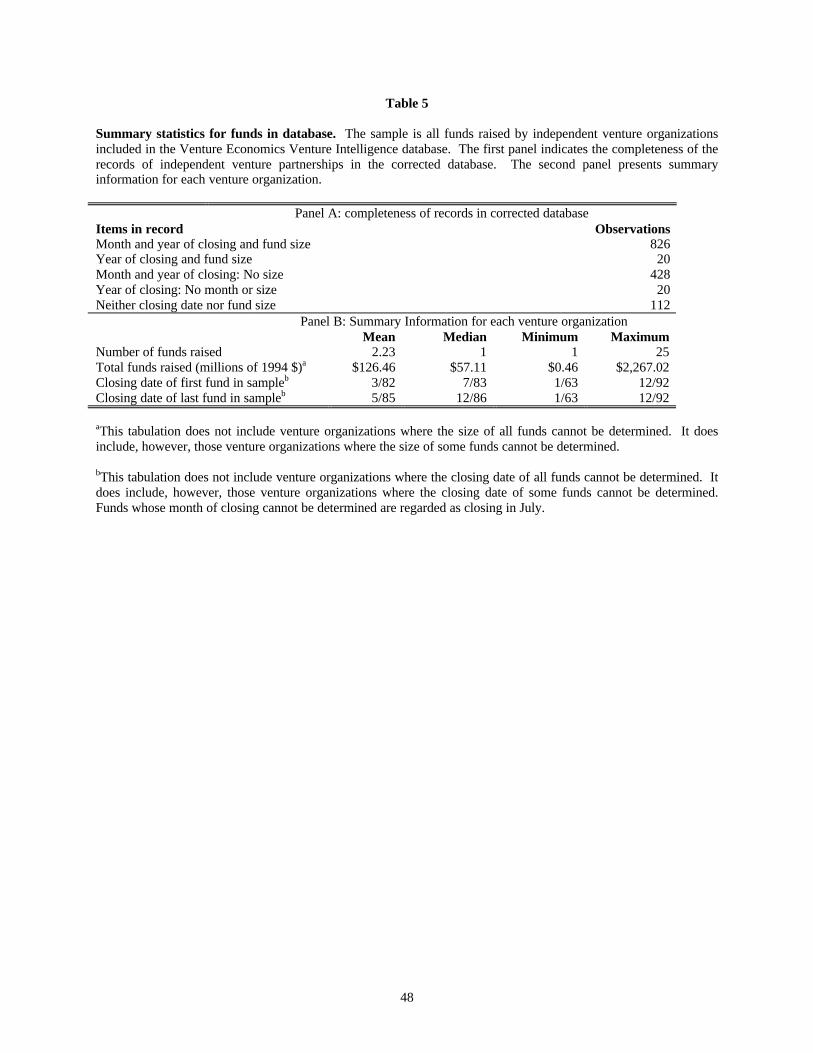
48
Table 5
Summary statistics for funds in database. The sample is all funds raised by independent venture organizationsincluded in the Venture Economics Venture Intelligence database. The first panel indicates the completeness of therecords of independent venture partnerships in the corrected database. The second panel presents summaryinformation for each venture organization.
Panel A: completeness of records in corrected databaseItems in record ObservationsMonth and year of closing and fund size 826Year of closing and fund size 20Month and year of closing: No size 428Year of closing: No month or size 20Neither closing date nor fund size 112
Panel B: Summary Information for each venture organizationMean Median Minimum Maximum
Number of funds raised 2.23 1 1 25Total funds raised (millions of 1994 $)a $126.46 $57.11 $0.46 $2,267.02Closing date of first fund in sampleb 3/82 7/83 1/63 12/92Closing date of last fund in sampleb 5/85 12/86 1/63 12/92
aThis tabulation does not include venture organizations where the size of all funds cannot be determined. It doesinclude, however, those venture organizations where the size of some funds cannot be determined.
bThis tabulation does not include venture organizations where the closing date of all funds cannot be determined. Itdoes include, however, those venture organizations where the closing date of some funds cannot be determined.Funds whose month of closing cannot be determined are regarded as closing in July.
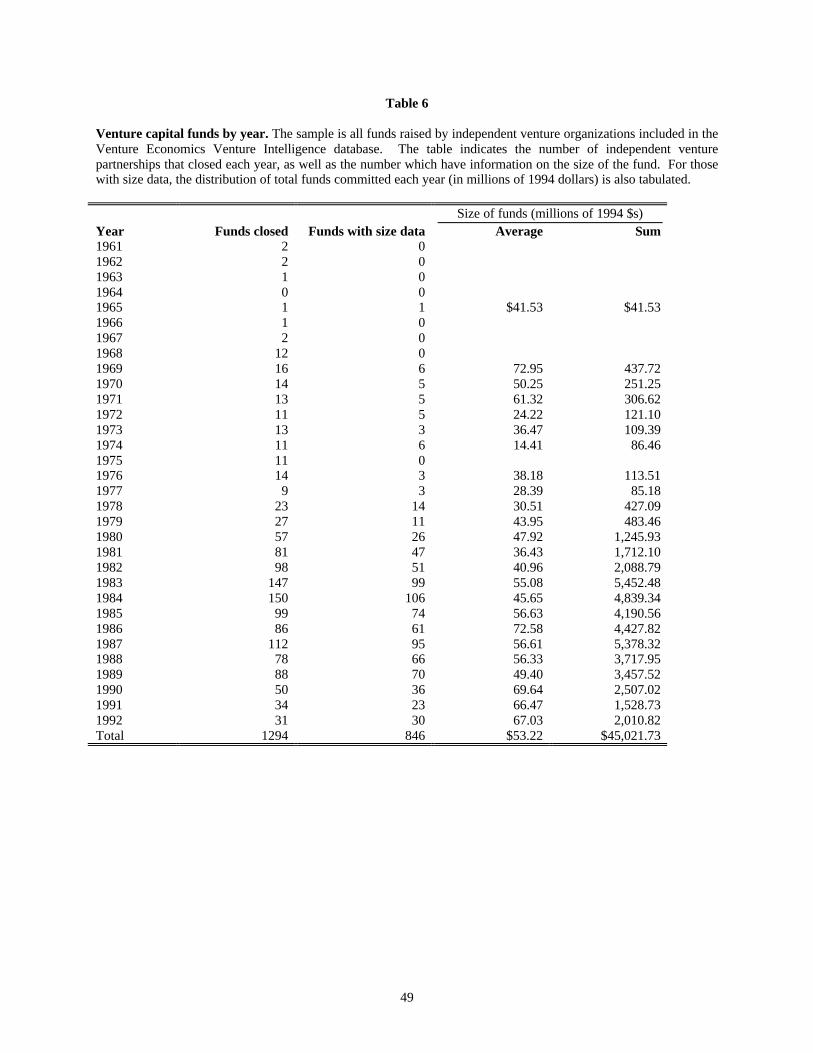
49
Table 6
Venture capital funds by year. The sample is all funds raised by independent venture organizations included in theVenture Economics Venture Intelligence database. The table indicates the number of independent venturepartnerships that closed each year, as well as the number which have information on the size of the fund. For thosewith size data, the distribution of total funds committed each year (in millions of 1994 dollars) is also tabulated.
Size of funds (millions of 1994 $s)Year Funds closed Funds with size data Average Sum1961 2 01962 2 01963 1 01964 0 01965 1 1 $41.53 $41.531966 1 01967 2 01968 12 01969 16 6 72.95 437.721970 14 5 50.25 251.251971 13 5 61.32 306.621972 11 5 24.22 121.101973 13 3 36.47 109.391974 11 6 14.41 86.461975 11 01976 14 3 38.18 113.511977 9 3 28.39 85.181978 23 14 30.51 427.091979 27 11 43.95 483.461980 57 26 47.92 1,245.931981 81 47 36.43 1,712.101982 98 51 40.96 2,088.791983 147 99 55.08 5,452.481984 150 106 45.65 4,839.341985 99 74 56.63 4,190.561986 86 61 72.58 4,427.821987 112 95 56.61 5,378.321988 78 66 56.33 3,717.951989 88 70 49.40 3,457.521990 50 36 69.64 2,507.021991 34 23 66.47 1,528.731992 31 30 67.03 2,010.82Total 1294 846 $53.22 $45,021.73
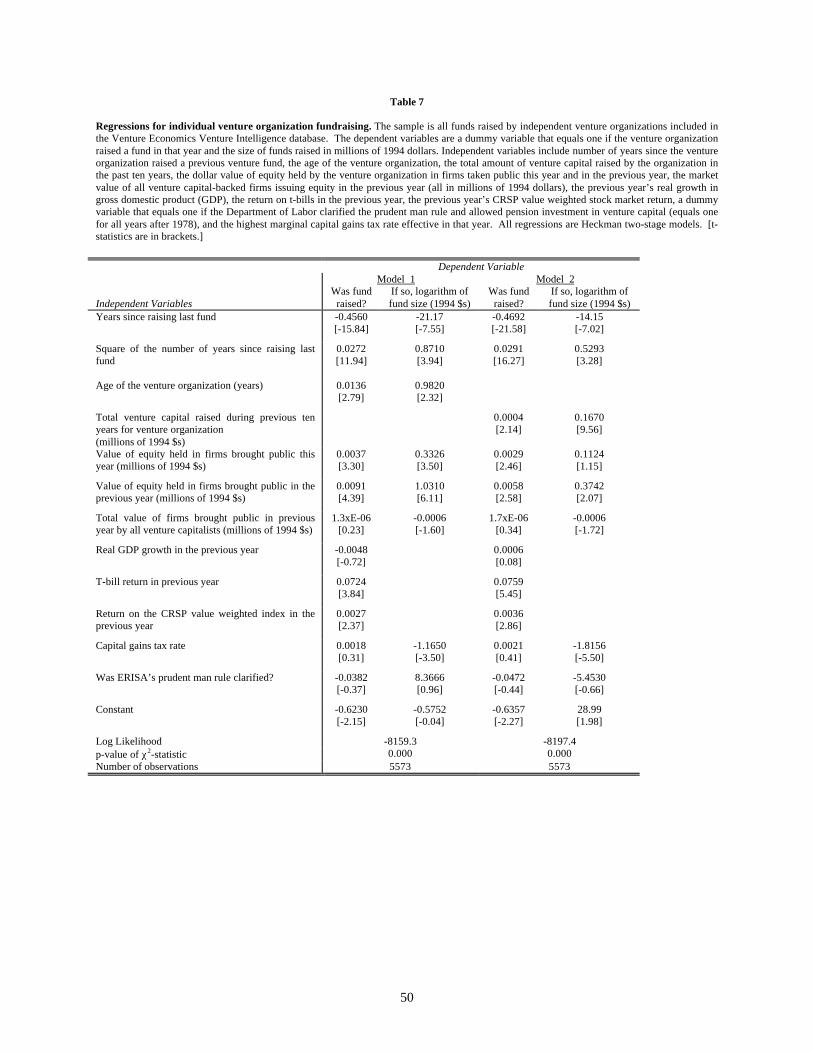
50
Table 7
Regressions for individual venture organization fundraising. The sample is all funds raised by independent venture organizations included inthe Venture Economics Venture Intelligence database. The dependent variables are a dummy variable that equals one if the venture organizationraised a fund in that year and the size of funds raised in millions of 1994 dollars. Independent variables include number of years since the ventureorganization raised a previous venture fund, the age of the venture organization, the total amount of venture capital raised by the organization inthe past ten years, the dollar value of equity held by the venture organization in firms taken public this year and in the previous year, the marketvalue of all venture capital-backed firms issuing equity in the previous year (all in millions of 1994 dollars), the previous year’s real growth ingross domestic product (GDP), the return on t-bills in the previous year, the previous year’s CRSP value weighted stock market return, a dummyvariable that equals one if the Department of Labor clarified the prudent man rule and allowed pension investment in venture capital (equals onefor all years after 1978), and the highest marginal capital gains tax rate effective in that year. All regressions are Heckman two-stage models. [t-statistics are in brackets.]
Dependent VariableModel 1 Model 2
Independent VariablesWas fund
raised?If so, logarithm offund size (1994 $s)
Was fundraised?
If so, logarithm offund size (1994 $s)
Years since raising last fund -0.4560[-15.84]
-21.17[-7.55]
-0.4692[-21.58]
-14.15[-7.02]
Square of the number of years since raising lastfund
0.0272[11.94]
0.8710[3.94]
0.0291[16.27]
0.5293[3.28]
Age of the venture organization (years) 0.0136[2.79]
0.9820[2.32]
Total venture capital raised during previous tenyears for venture organization(millions of 1994 $s)
0.0004[2.14]
0.1670[9.56]
Value of equity held in firms brought public thisyear (millions of 1994 $s)
0.0037[3.30]
0.3326[3.50]
0.0029[2.46]
0.1124[1.15]
Value of equity held in firms brought public in theprevious year (millions of 1994 $s)
0.0091[4.39]
1.0310[6.11]
0.0058[2.58]
0.3742[2.07]
Total value of firms brought public in previousyear by all venture capitalists (millions of 1994 $s)
1.3xE-06[0.23]
-0.0006[-1.60]
1.7xE-06[0.34]
-0.0006[-1.72]
Real GDP growth in the previous year -0.0048[-0.72]
0.0006[0.08]
T-bill return in previous year 0.0724[3.84]
0.0759[5.45]
Return on the CRSP value weighted index in theprevious year
0.0027[2.37]
0.0036[2.86]
Capital gains tax rate 0.0018[0.31]
-1.1650[-3.50]
0.0021[0.41]
-1.8156[-5.50]
Was ERISA’s prudent man rule clarified? -0.0382[-0.37]
8.3666[0.96]
-0.0472[-0.44]
-5.4530[-0.66]
Constant -0.6230[-2.15]
-0.5752[-0.04]
-0.6357[-2.27]
28.99[1.98]
Log Likelihood -8159.3 -8197.4p-value of χ2-statistic 0.000 0.000Number of observations 5573 5573
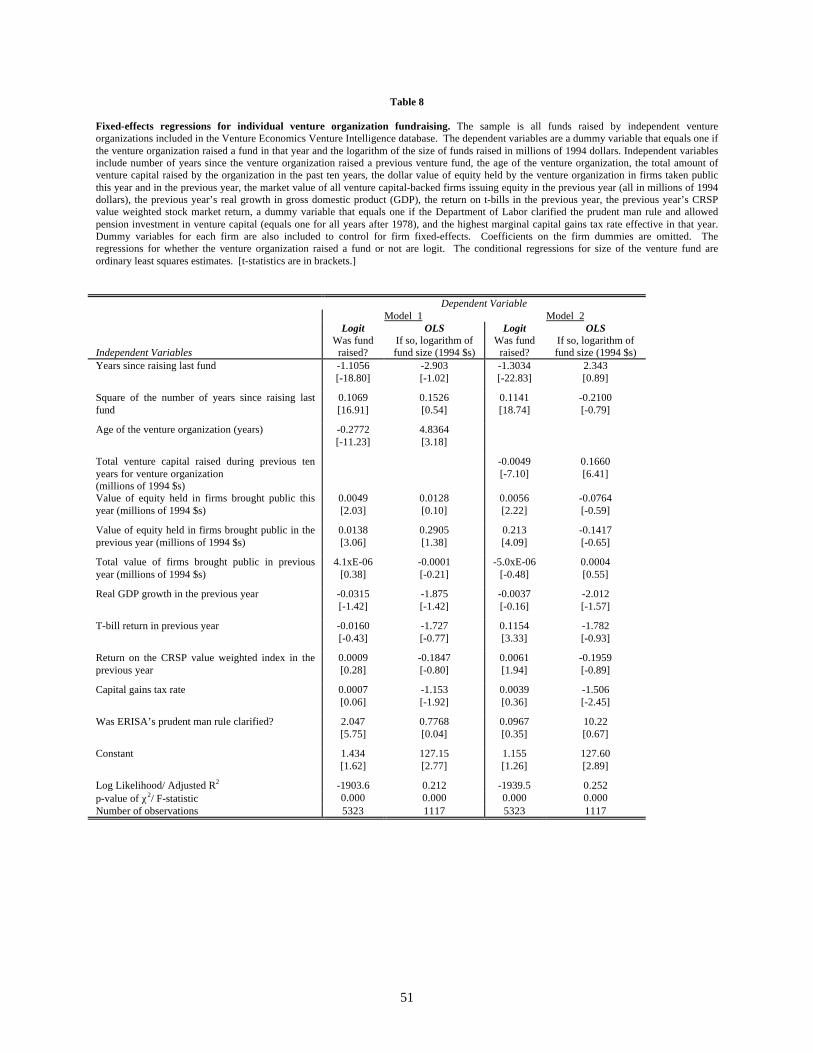
51
Table 8
Fixed-effects regressions for individual venture organization fundraising. The sample is all funds raised by independent ventureorganizations included in the Venture Economics Venture Intelligence database. The dependent variables are a dummy variable that equals one ifthe venture organization raised a fund in that year and the logarithm of the size of funds raised in millions of 1994 dollars. Independent variablesinclude number of years since the venture organization raised a previous venture fund, the age of the venture organization, the total amount ofventure capital raised by the organization in the past ten years, the dollar value of equity held by the venture organization in firms taken publicthis year and in the previous year, the market value of all venture capital-backed firms issuing equity in the previous year (all in millions of 1994dollars), the previous year’s real growth in gross domestic product (GDP), the return on t-bills in the previous year, the previous year’s CRSPvalue weighted stock market return, a dummy variable that equals one if the Department of Labor clarified the prudent man rule and allowedpension investment in venture capital (equals one for all years after 1978), and the highest marginal capital gains tax rate effective in that year.Dummy variables for each firm are also included to control for firm fixed-effects. Coefficients on the firm dummies are omitted. Theregressions for whether the venture organization raised a fund or not are logit. The conditional regressions for size of the venture fund areordinary least squares estimates. [t-statistics are in brackets.]
Dependent VariableModel 1 Model 2
Logit OLS Logit OLS
Independent VariablesWas fund
raised?If so, logarithm offund size (1994 $s)
Was fundraised?
If so, logarithm offund size (1994 $s)
Years since raising last fund -1.1056[-18.80]
-2.903[-1.02]
-1.3034[-22.83]
2.343[0.89]
Square of the number of years since raising lastfund
0.1069[16.91]
0.1526[0.54]
0.1141[18.74]
-0.2100[-0.79]
Age of the venture organization (years) -0.2772[-11.23]
4.8364[3.18]
Total venture capital raised during previous tenyears for venture organization(millions of 1994 $s)
-0.0049[-7.10]
0.1660[6.41]
Value of equity held in firms brought public thisyear (millions of 1994 $s)
0.0049[2.03]
0.0128[0.10]
0.0056[2.22]
-0.0764[-0.59]
Value of equity held in firms brought public in theprevious year (millions of 1994 $s)
0.0138[3.06]
0.2905[1.38]
0.213[4.09]
-0.1417[-0.65]
Total value of firms brought public in previousyear (millions of 1994 $s)
4.1xE-06[0.38]
-0.0001[-0.21]
-5.0xE-06[-0.48]
0.0004[0.55]
Real GDP growth in the previous year -0.0315[-1.42]
-1.875[-1.42]
-0.0037[-0.16]
-2.012[-1.57]
T-bill return in previous year -0.0160[-0.43]
-1.727[-0.77]
0.1154[3.33]
-1.782[-0.93]
Return on the CRSP value weighted index in theprevious year
0.0009[0.28]
-0.1847[-0.80]
0.0061[1.94]
-0.1959[-0.89]
Capital gains tax rate 0.0007[0.06]
-1.153[-1.92]
0.0039[0.36]
-1.506[-2.45]
Was ERISA’s prudent man rule clarified? 2.047[5.75]
0.7768[0.04]
0.0967[0.35]
10.22[0.67]
Constant 1.434[1.62]
127.15[2.77]
1.155[1.26]
127.60[2.89]
Log Likelihood/ Adjusted R2 -1903.6 0.212 -1939.5 0.252p-value of χ2/ F-statistic 0.000 0.000 0.000 0.000Number of observations 5323 1117 5323 1117
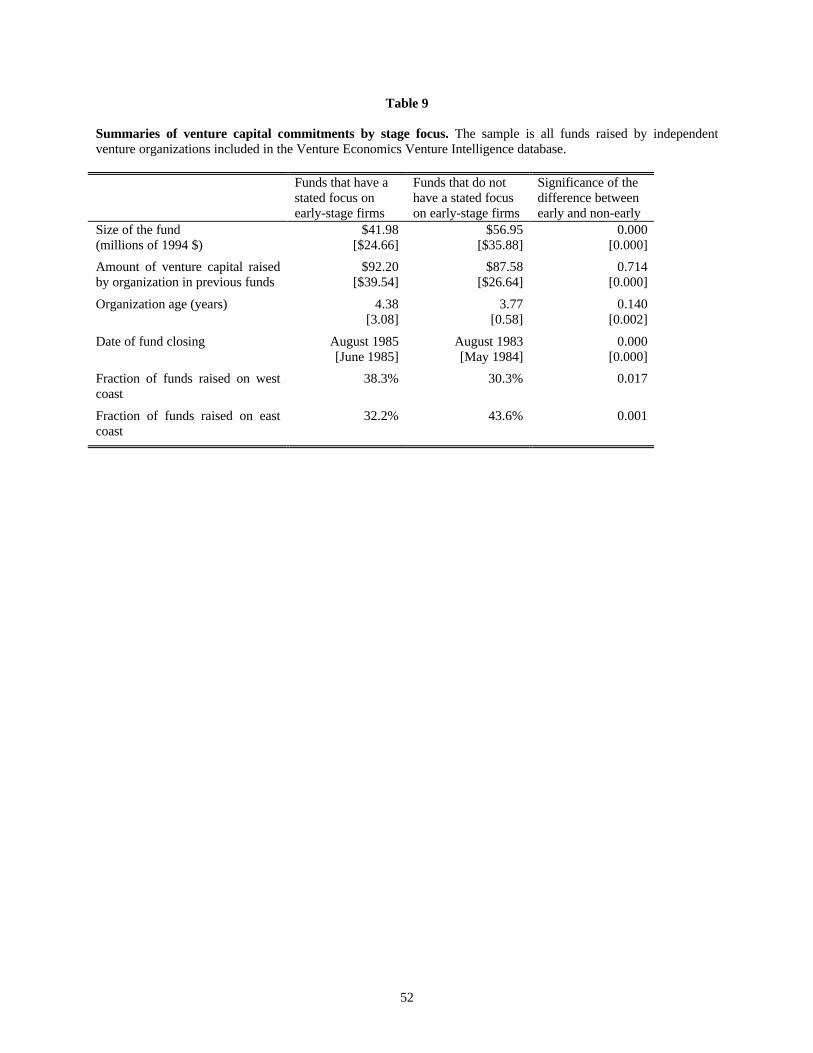
52
Table 9
Summaries of venture capital commitments by stage focus. The sample is all funds raised by independentventure organizations included in the Venture Economics Venture Intelligence database.
Funds that have astated focus onearly-stage firms
Funds that do nothave a stated focuson early-stage firms
Significance of thedifference betweenearly and non-early
Size of the fund(millions of 1994 $)
$41.98[$24.66]
$56.95[$35.88]
0.000[0.000]
Amount of venture capital raisedby organization in previous funds
$92.20[$39.54]
$87.58[$26.64]
0.714[0.000]
Organization age (years) 4.38[3.08]
3.77[0.58]
0.140[0.002]
Date of fund closing August 1985[June 1985]
August 1983[May 1984]
0.000[0.000]
Fraction of funds raised on westcoast
38.3% 30.3% 0.017
Fraction of funds raised on eastcoast
32.2% 43.6% 0.001
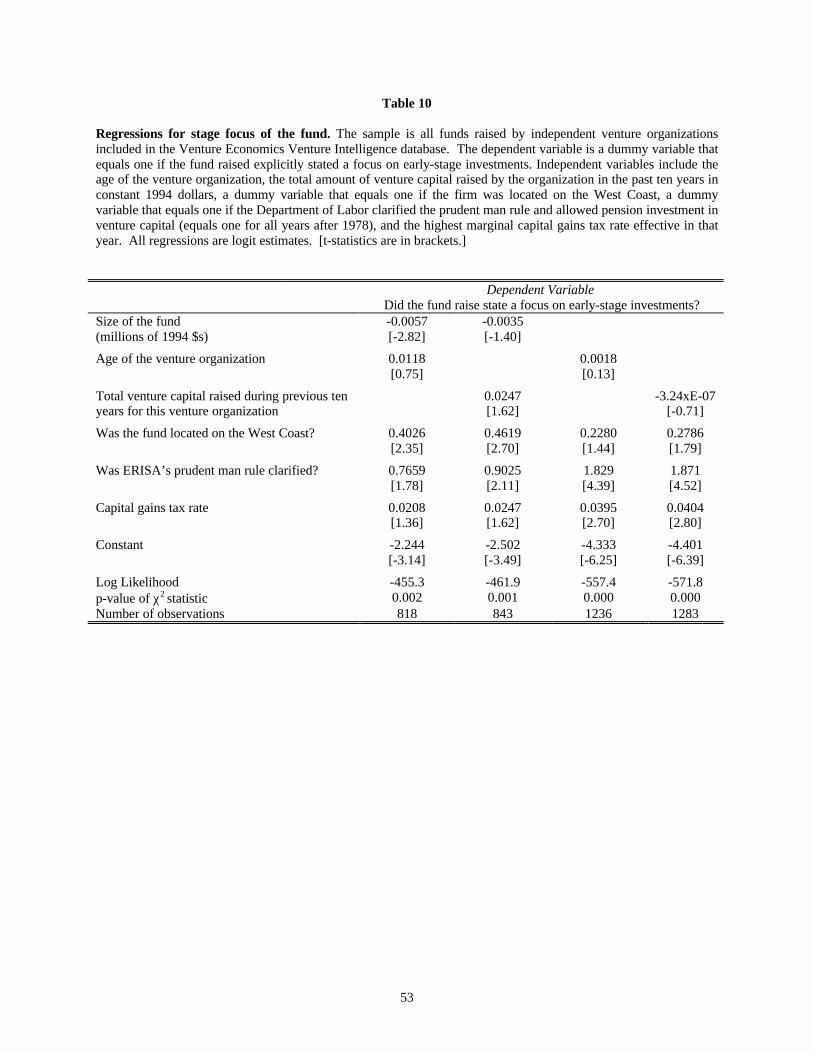
53
Table 10
Regressions for stage focus of the fund. The sample is all funds raised by independent venture organizationsincluded in the Venture Economics Venture Intelligence database. The dependent variable is a dummy variable thatequals one if the fund raised explicitly stated a focus on early-stage investments. Independent variables include theage of the venture organization, the total amount of venture capital raised by the organization in the past ten years inconstant 1994 dollars, a dummy variable that equals one if the firm was located on the West Coast, a dummyvariable that equals one if the Department of Labor clarified the prudent man rule and allowed pension investment inventure capital (equals one for all years after 1978), and the highest marginal capital gains tax rate effective in thatyear. All regressions are logit estimates. [t-statistics are in brackets.]
Dependent VariableDid the fund raise state a focus on early-stage investments?
Size of the fund(millions of 1994 $s)
-0.0057[-2.82]
-0.0035[-1.40]
Age of the venture organization 0.0118[0.75]
0.0018[0.13]
Total venture capital raised during previous tenyears for this venture organization
0.0247[1.62]
-3.24xE-07[-0.71]
Was the fund located on the West Coast? 0.4026[2.35]
0.4619[2.70]
0.2280[1.44]
0.2786[1.79]
Was ERISA’s prudent man rule clarified? 0.7659[1.78]
0.9025[2.11]
1.829[4.39]
1.871[4.52]
Capital gains tax rate 0.0208[1.36]
0.0247[1.62]
0.0395[2.70]
0.0404[2.80]
Constant -2.244[-3.14]
-2.502[-3.49]
-4.333[-6.25]
-4.401[-6.39]
Log Likelihood -455.3 -461.9 -557.4 -571.8p-value of χ2 statistic 0.002 0.001 0.000 0.000Number of observations 818 843 1236 1283


![VENTURE CAPITAL FOR SUSTAINABILITY 2007 REPORT [2007] Venture Capital... · growing sector as Venture Capital for Sustainability ... Venture Capitalists’ stake in ... Venture Capital](https://img.dokumen.tips/doc/110x75/5a7926b77f8b9a00168dc540/venture-capital-for-sustainability-2007-2007-venture-capitalgrowing-sector.jpg)