Embed Size (px)
Citation preview

What Does ESSA Mean for
English Learners and
Accountability?
@EdPolicyAIR
#ESSAforELs


English Learner Reclassification
Joseph P. Robinson-Cimpian, Ph.D.
Associate Professor and College of Education Distinguished Scholar
University of Illinois at Urbana-Champaign

2 primary policy concerns
Time to reclassification
Criteria for reclassification

Source: Umansky & Reardon, American Educational Research Journal, 2014

2 takeaways on TimeAvg. 4-7 years, but much
variation
Bilingual ed associated with higher long-term reclassification rates

Criteria for reclassificationPolicymakers’ dilemma:
Where to set the test-based criteria for reclassification eligibility?
Original method and analysis: Robinson, Educational Evaluation and Policy Analysis, 2011
Testing policy-change effects: Robinson-Cimpian & Thompson, Journal of Policy Analysis and Management, 2016
Examining variation in effects across districts in a state:Robinson-Cimpian, Thompson & Makowski, American Educational Research Journal, in press

Better to remain an EL in these districts
Better to exit EL status in these districts
State criteria are fine on average
Source: Robinson-Cimpian et al., American Educational Research Journal, in press

2 takeaways on Criteria
Same criteria, different effects
Need to evaluate criteria, adjust criteria and resources

Incorporating English Learners into State Accountability Systems
Dr. Karen Thompson

Key questions about incorporating ELs into state accountability systems
• What information do we need to identify schools and districts that are serving ELs effectively?
• How can we obtain accurate information about the content-area achievement of students while they are in the process of learning English?
12

The Ever EL Framework
• Takes into account that the EL subgroup is not stable
• Allows for analysis of:• Current ELs
• Former ELs
• Ever ELs
• Allows for longitudinal analysis
13
K 3rd 5th 7th 9th

The Ever EL Framework Applied to Graduation
Sample sizes
Current ELs: 2,262
Former ELs: 4,209
Ever ELs: 6,471
Never ELs: 38,700
14
0.0%
10.0%
20.0%
30.0%
40.0%
50.0%
60.0%
70.0%
80.0%
Current ELs Former ELs Ever ELs Never ELs
Oregon Cohort Graduation Rate,
2014-15

The Ever EL Framework Applied to Graduation
Sample sizes
Current ELs: 2,262
Former ELs: 4,209
Ever ELs: 6,471
Never ELs: 38,700
15
0.0%
10.0%
20.0%
30.0%
40.0%
50.0%
60.0%
70.0%
80.0%
Current ELs Former ELs Ever ELs Never ELs
Oregon Cohort Graduation Rate,
2014-15

The Ever EL Framework Applied to Graduation
Sample sizes
Current ELs: 2,262
Former ELs: 4,209
Ever ELs: 6,471
Never ELs: 38,700
16
0.0%
10.0%
20.0%
30.0%
40.0%
50.0%
60.0%
70.0%
80.0%
Current ELs Former ELs Ever ELs Never ELs
Oregon Cohort Graduation Rate,
2014-15

The Ever EL Framework Applied to Graduation
Sample sizes
Current ELs: 2,262
Former ELs: 4,209
Ever ELs: 6,471
Never ELs: 38,700
17
0.0%
10.0%
20.0%
30.0%
40.0%
50.0%
60.0%
70.0%
80.0%
Current ELs Former ELs Ever ELs Never ELs
Oregon Cohort Graduation Rate,
2014-15

The Ever EL Framework Applied to Special Education Participation
18

Recent state legislation designed, in part, to identify districts in need of technical assistance to better meet the needs of ELs, is using a diverse set of criteria, including:
• Ever EL graduation rates
• Ever EL postsecondary enrollment rates
• Current EL English language proficiency assessment growth
• Ever EL content-area assessment growth
Innovation in State-Level Accountability Systems: Oregon
19
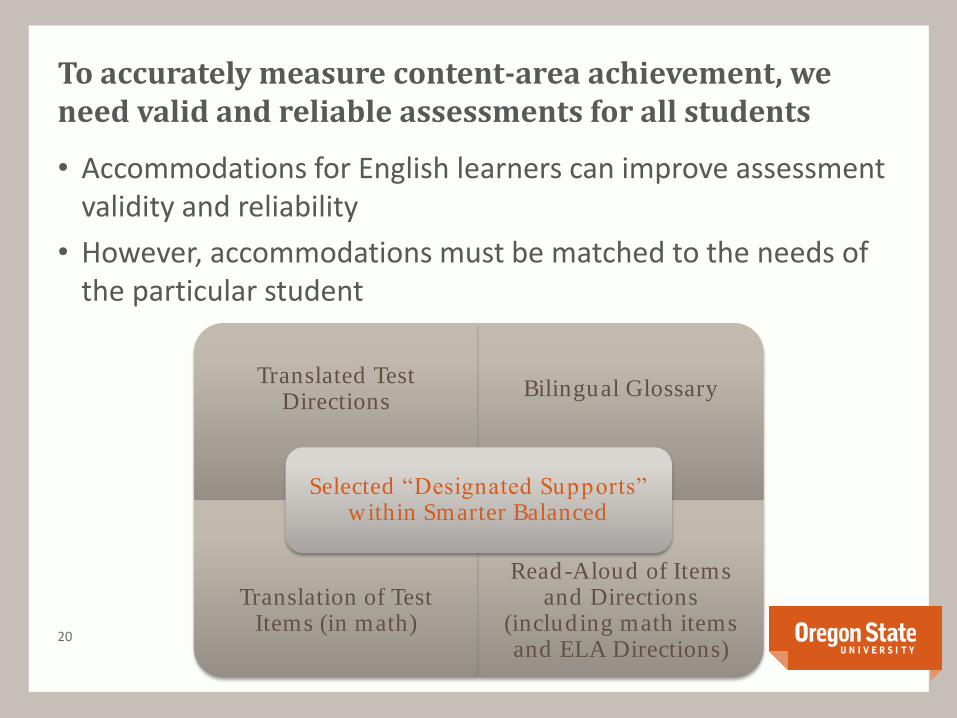
To accurately measure content-area achievement, we need valid and reliable assessments for all students
• Accommodations for English learners can improve assessment validity and reliability
• However, accommodations must be matched to the needs of the particular student
20
Translated Test Directions
Bilingual Glossary
Translation of Test Items (in math)
Read-Aloud of Items and Directions
(includ ing math items and ELA Directions)
Selected “Designated Supports” within Smarter Balanced

Two Key Takeaways on Incorporating ELs into State Accountability Systems
• Consider outcomes for the full group of students ever classified as English learners
• Allow for a wide range of accommodations on content-area assessments and match accommodations to student needs
21

Monitoring the Performance
of English Learners
Rachel B. SlamaSenior Researcher
American Institutes for Research

AMERICAN INSTITUTES FOR RESEARCH
Massachusetts commissions longitudinal
study on English learner outcomes
• ELs are 7.9% of K-12 students in the state (n=75,947)
• Cohort demographics mirror U.S. EL population
• 68% are low-income
• 82% U.S.-born
• 57% Spanish speakers
• Clustered in high-poverty,
urban districts
• Study followed kindergarten
EL cohort for 11 years (K-10)
• Sample includes current
and former ELs
24
Source: Massachusetts selected populations report. Retrieved from:
http://profiles.doe.mass.edu/state_report/selectedpopulations.aspx?mode=district&year=2014&Continue.x=4&Continue.y=7;
Analysis of 2003-2004 Student Information Management System (SIMS) student-level restricted data

AMERICAN INSTITUTES FOR RESEARCH
It is important to consider the total EL cohort
25
25% (n=1,936)
13% (n=1,320)
23% (n=565)
42% (n=128)
34% (n=3,277)
35% (n=3,791)
62% (n=3,584)
85% (n=2,490)
64% (n=51,949)
65% (53,695)
82% (n=49,544)
94% (n=35,902)
0% 20% 40% 60% 80% 100%
2006–07(Grade 3)
2008–09(Grade 5)
2011–12(Grade 8)
2013–14(Grade 10)
Percentage of Subgroup Proficient or Above on MCAS (ELA)
ELs
Ever ELs
Never ELs

AMERICAN INSTITUTES FOR RESEARCH
Some ELs never catch up to their peers
academically in ELA, even after exit
26
46% (n=1,341)
47% (n=2,471)
69% (n=3,019)
88% (n=2,362)
64% (n=51,949)
65% (53,695)
82% (n=49,544)
94% (n=35,902)
0% 20% 40% 60% 80% 100%
2006–07(Grade 3)
2008–09(Grade 5)
2011–12(Grade 8)
2013–14(Grade 10)
Percentage of Subgroup Proficient or Above on MCAS (ELA)
Former ELs
Never ELs

AMERICAN INSTITUTES FOR RESEARCH
Some ELs never catch up to their peers
academically in math, even after exit
27
47% (n=1,341)
43% (n=2,471)
40% (n=3,019)
75% (n=2,362)
64% (n=51,949)
56% (n=53,695)
55% (n=49,544)
86% (n=35,902)
0% 20% 40% 60% 80% 100%
2006–07(Grade 3)
2008–09(Grade 5)
2011–12(Grade 8)
2013–14(Grade 10)
Percentage of Students Proficient or Above on MCAS (Mathematics)
Former ELs
Never ELs

AMERICAN INSTITUTES FOR RESEARCH
A decade later: How did the kindergarten EL
cohort fare?
Indicator Percentage of cohort
Time to reclassification 50% reclassified in 2.7 years
Remained in MA K-10 55% of sample (n=2,787)
Reclassified during K-10 89% of non-movers (n=2,491)
Never reclassified K-10
11% of non-movers (n=296);
majority of this group (59%; n=175)
also received special education
services
Source: Eleven-year longitudinal analysis of Massachusetts Student Information Management System (SIMS) restricted student data.
28

AMERICAN INSTITUTES FOR RESEARCH
Takeaways
• Look at previous and current EL performance to gauge
how districts are serving ELs
• Early services not an inoculation against later academic
challenges—some reclassified students not meeting content
standards in ELA and mathematics
• Ideally EL students would be monitored over their entire
school trajectories, including after exit
29

AMERICAN INSTITUTES FOR RESEARCH
Acknowledgments
MA EL study report authors: Rachel Slama, Erin Haynes, Lynne Sacks, Dong
Hoon Lee, and Diane August
Research support: Ayrin Molefe, Sidney Wilkinson-Flicker, and Michael Garet
(AIR); Diane Staehr Fenner and Sydney Snyder (DSF Consulting); Lien Hoang
(Office of Planning and Research, Massachusetts Department of Elementary and
Secondary Education)
Stakeholder support: Kendra Winner and Carrie Conaway (Office of Planning
and Research, Massachusetts Department of Elementary and
Secondary Education); Sergio Páez,
consultant to Holyoke Public Schools
and former superintendent
30
Image from www.allthingsprivatepractice.com

AMERICAN INSTITUTES FOR RESEARCH
Center for English Language Learners at
American Institutes for Research
The Center for English Language Learners (ELL Center) at
AIR is committed to improving instruction and outcomes for
ELLs by conducting relevant research and applying what we
know about what works for ELLs in schools and districts
across the country.
Our services include conducting rigorous studies of teaching
and learning; evaluating federal, state, and district policies
and practices that affect ELLs and crafting evidence-based
recommendations for policymakers and educators; and
providing technical assistance and professional development
to help schools and districts improve instruction and learning
for ELLs.
31

Rachel B. Slama
781-373-7019
201 Jones Road, 1st Floor West
Waltham, MA 02451-1600
General Information: 781-373-7000
www.air.org
32

What Does ESSA Mean for
English Learners and
Accountability?
@EdPolicyAIR
#ESSAforELs