Embed Size (px)
Citation preview
1
1
STAT 422 & GS01 0013: Fall 2007Bayesian Data Analysis
• Instructors:– Gary Rosner ([email protected])– Luis Nieto-Barajas ([email protected])
• Room: FC 2.3031• Time: Wed. & Fri. 10:30 AM – 12:00 PM• Grade:
– 3 homework sets, 1 exam, and a student presentation.• Course Text:
– An Introduction to Bayesian Analysis: Theory andMethods
Jayanta K. Ghosh, Mohan Delampady, & Tapas SamantaNew York:Springer, 2006.
2
What Do Authors Mean When TheyWrite “p = 0.05”?
• Null hypothesis is probably true• Null hypothesis is probably false• Observed result is unlikely• Experimental therapy is probably
effective• None of above

2
3
2nd-Best AnswerRepaired
a) Null hypothesis is probably trueb) Null hypothesis is probably falsec) Observed result is in a set that is
unlikely, assuming null hypothesisd) Experimental therapy is probably
effective
4
What is Statistics?
• A collection of procedures andprinciples for gaining andprocessing information in order tomake decisions when faced withuncertainty.
–Seeing Through Statistics–Jessica Utts

3
5
Bayesian or Frequentist
• Bayesian conditions on data– What do we know about the
parameters given the data?• Frequentist conditions on
hypotheses– How likely are these observations if
there is no difference?
6
Advantages of Bayesian Inference
• Easier to incorporate externalinformation
• Follows learning paradigm• Easier to account for sources of
uncertainty• Inference more natural• Foundation for decision making in
the presence of uncertainty

4
7
Criticisms of Bayesian Approach
• Prior specification– Different prior can lead to different
posterior inference• Large sample sizes minimize influence of
prior
• More difficult to carry out– Newer computing methods/programs
allow inference in complex problems
8
Bayes Rule Allows InvertingConditional Probs• Sometimes have but want
• If know
• can get ( )( ) ( )
( )APr
BAPrBPrABPr
!=
!
Pr AB( ), Pr B( ), & Pr A( )
( )BAPr
( )ABPr

5
9
Diagnostic Tests
• Sensitivity:
• Specificity:
• Want
!
Pr Test + Disease( )
!
PV+ = Pr Disease Test +( )
!
Pr Test " No Disease( )
!
PV" = Pr No Disease Test "( )
10
Bayes Rule Helps DeterminePV+ & PV-
!
PV+ = Pr D + T +( ) =Pr T + D +( ) "Pr D +( )
Pr T +( )
!
Pr T +( ) = Pr T +" D +( ) + Pr T +" D #( )
= Pr T + D +( )Pr D +( ) + Pr T + D #( )Pr D #( )
– where

6
11
Bayesian Statistical Inference• 3 main components
– Prior distribution• Initial hypothesized distribution (prior to
collecting data)– Likelihood
• Probability function associated with thedata, conditioning on parameters
– Posterior distribution• Updated distribution (from prior) after
collecting data.
12
Main Bayesian Concept• Posterior Dist’n is proportional to
– Likelihood times Prior
– For example,
( )( ) ( )param.parameter Data
Data parameter
PrPr
Pr
!
"
( )
( ) ( )difftrt Nodifftrt No Data
Data difftrt No
PrPr
Pr
!
"

7
13
• Predictive distribution– Important Bayesian concept
– For example• Probability associated with outcome
of next patient of treatment A vs B– With predicitive dist’n, can get
expected utility
( )dataCurrent nObservatioNext Pr
14
Decision Making under Uncertainty
• What do we know?• How do we put it all together?
• Multiple sources of information– Multiple studies
• Randomized clinical trials• Epidemiology

8
15
GUSTO Clinical Trial
• An International Randomized TrialComparing Four ThrombolyticStrategies for Acute MyocardialInfarction
• New England Journal of Medicine,– vol. 329:673-682, 1993
16
GUSTOGlobal Utilization ofStreptokinase and TissuePlasminogen Activator forOccluded Coronary ArteriesR
A
N
D
streptokinase + i.v. heparin
streptokinase + subQ heparin
t-PA + streptokinase + i.v. heparin
t-PA + i.v. heparin

9
17
GUSTO• Hypothesis:
– Early & sustained infarct-vesselpatency associated with bettersurvival among pts having MI
• Principal end point:– 30-day all-cause mortality
18
GUSTO– Began Dec. 27, 1990– Ended Feb. 22, 1993– Enrolled 41,021 worldwide
• 15 countries; 1081 hospitals– 90% power (2-sided 0.05-level) to
detect 15% reduction in mortality (~1% difference)• E.g., 8% 6.8%

10
19
GUSTO Results
• t-PA + i.v. heparin providessurvival benefit, compared tostreptokinase arms– 6.3% vs. 7.2%—7.4%
20
Odds Ratios & 95% Confidence Intervals forMortality & Disabling Stroke Reduction

11
21
What Else Do We Know?• Placing Trials in Context Using
Bayesian Analysis: GUSTORevisited by Reverend Bayes– James M. Brophy &– Lawrence Joseph
• Journal of the American MedicalAssociation, vol.273: 871-875, 1995
22
Meta-Analysis• The statistical analysis of a large
collection of analysis results fromindividual studies for the purposeof integrating the findings.
–G.V. Glass “Primary, secondary, andmeta-analysis of research” Educ Res5:3-8, 1976

12
23
Meta-Analysis
• Meta-analysis looks for consistencyand explanations of heterogeneity ordifferences between studies.
24
GUSTO vs. Other Studies
• Two other studies evaluated t-PA& streptokinase– GISSI-2– ISIS-3
• These studies did not show sucha strong effect for t-PA

13
25
3 Similar Studies
26
How To Combine Information?
• Want to account for– Between-study differences and– Within-study heterogeneity
• Bayesian inference

14
27
Choice of PriorDist’n
28
PosteriorDistribution
SK bettertPA better

15
29
Probability of SuperiorityDepends on Prior Belief
30
But What About DifferencesBetween the Studies?
• Different tPA administration inGUSTO
• More revascularization in GUSTO• More US centers in GUSTO
16
31
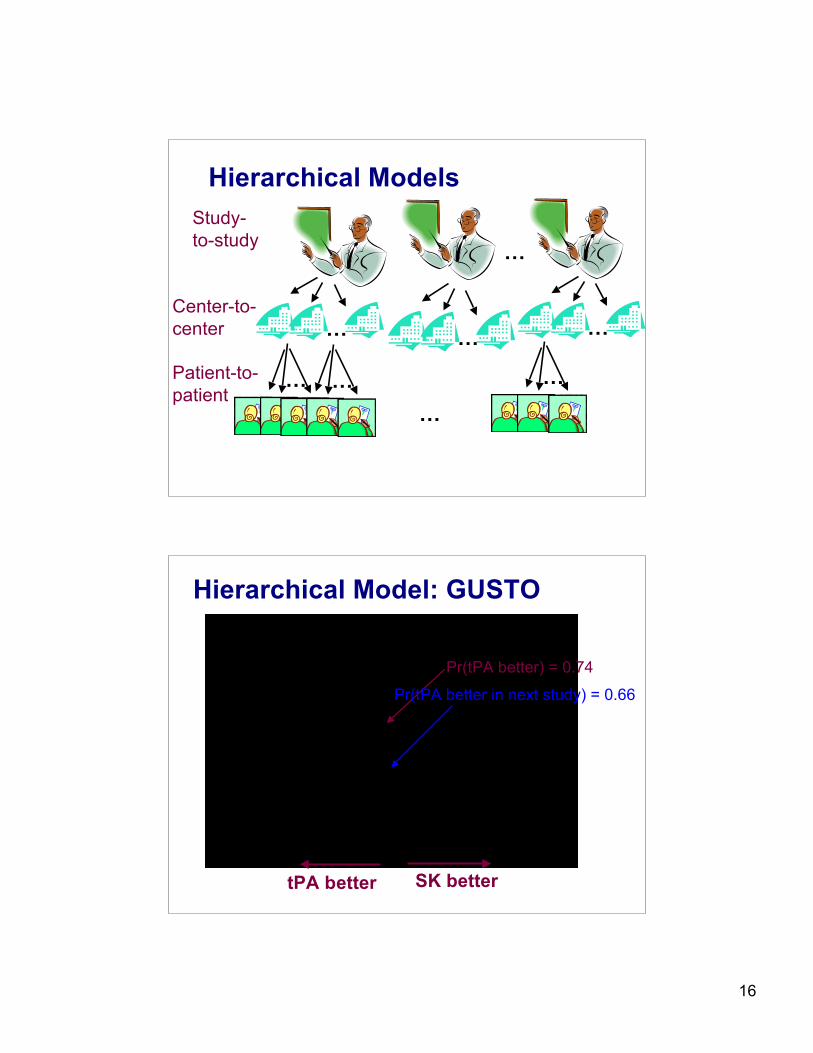
Hierarchical ModelsStudy-to-study
Center-to-center
…
…… …
…
Patient-to-patient
… ……
32
Hierarchical Model: GUSTO
SK bettertPA better
Pr(tPA better) = 0.74
Pr(tPA better in next study) = 0.66

17
33
TO BE CONTINUED…