Embed Size (px)
Citation preview


What are the New Methods of Investing Passively in
Commodities?
Joëlle Miffre
Professor of Finance, EDHEC Business School Member of EDHEC-Risk Institute

What are the New Methods of Investing Passively in Commodities?
• Fundamentals of Commodity Futures Pricing – Backwardation and Contango – Limitation of First Generation Indices
• Moving from First to Second Generation (Enhanced Beta Indices) – Improved Rolling Techniques: Liquidity Risk – Improving Performance via Long-Only Signals
• Long-Short Third Generation Commodity Indices – Limitation of First and Second Generation Indices – Fully Exploiting Backwardation and Contango
• Comparative Study of Performance

Futures prices
Contract maturity
Contango • Upward-sloping term structure or negative roll yield = ln(F0,n) – ln(F0,d) < 0 • High inventory levels (abundant supply) • Net long hedgers, Net short speculators • Momentum losers
Backwardation • Downward-sloping term structure or positive roll yield = ln(F0,n) – ln(F0,d) > 0 • Low inventory levels (scarce supply) • Net short hedgers, Net long speculators • Momentum winners
(n = nearby contract, d = distant contract)
n d
4
F0,n
F0,n
F0,d
F0,d

First Generation Commodity Indices
• Fully-collateralized investment that provides a passive long-only exposure to commodities irrespective of whether markets are in backwardation or in contango
• Total return on the passive index includes spot price change, collateral yield and roll yield
• Examples – S&P-GSCI
– Thompson Reuters-Jefferies / CRB
– Dow Jones-UBS Commodity Index

Limitations of First Generation Indices Term Structure of Commodity Futures Prices
The figure plots monthly prices of front-end crude oil contracts alongside shaded areas which indicate backwardated months with positive roll yields Correlation of 30.18% (p-value of 0.00) Source: Miffre, Fuertes and Fernandez-Perez (2012)

Limitations of First Generation Indices Term Structure of Commodity Futures Prices
• First generation indices ignore the shape of the term structure and thus end up long contangoed commodities (losing roll yields)
• New generations of indices emerged mainly to take advantage of the changing nature of commodity curves
• Second generation indices are long-only and designed to mitigate negative effects of contango on performance
Backwardation (roll yield > 0)
n d Maturity
Contango (roll yield < 0)
Futures prices
F0,n
F0,d
F0,d
F0,n
Sell
Sell
Buy
Buy

What are the New Methods of Investing Passively in Commodities?
• Fundamentals of Commodity Futures Pricing – Backwardation and Contango – Limitation of First Generation Indices
• Moving from First to Second Generation (Enhanced Beta Indices) – Improved Rolling Techniques: Liquidity Risk – Improving Performance via Long-Only Signals
• Long-Short Third Generation Commodity Indices – Limitation of First and Second Generation Indices – Fully Exploiting Backwardation and Contango
• Comparative Study of Performance

Improved Rolling Techniques 1. Enhanced Roll Strategy
• “A specific contract month is chosen for its liquidity characteristics used for a whole year”
– Dec 2010 contract chosen in Nov 2009, thereby going further out onto the futures curve and avoiding all monthly rolls until Nov 2010
• Example: S&P-GSCI Enhanced Index
Source: Tsui and Dash, 2011, S&P Indices | Research & Design

Improved Rolling Techniques 2. Forward Roll Strategy
• “This approach takes the roll schedule from the standard roll framework and places all the contracts farther out on the futures curve (3-month, 6-month, etc.)”
• Examples – S&P-GSCI 3-Month Forward Index
– Merrill Lynch Commodity Index (MLCX)
Source: Tsui and Dash, 2011, S&P Indices | Research & Design

Improved Rolling Techniques 3. Constant Maturity Strategy
• “Instead of investing in a single futures contract, the constant maturity strategy spreads the long futures position over a number of contract months along the futures curve” – Equally over each of the six active contracts
– Or over designated intervals (e.g., 6-mth, 1-year constant maturities)
• Examples – UBS Bloomberg Constant Maturity Commodity Index (CMCI)
– BNP Paribas Commodity Market Representative Index (CMRI)
– JP Morgan Commodity Curve Index (JPM CCI)
– Credit Suisse S&P-GSCI
Source: Tsui and Dash, 2011, S&P Indices | Research & Design

Improved Rolling Techniques 4. Implied Roll Yield Strategy
• “Determines implied roll yields among the contracts out to a
particular maturity and chooses the contract with maximum implied roll yield”
• Examples
– Deutsche Bank Liquid Commodity Index – Optimum Yield Index
– Diapason Commodity Index
– DCI BNP Paribas Enhanced Index
– Barclays Capital Backwardation Index
Source: Tsui and Dash, 2011, S&P Indices | Research & Design

Improved Rolling Techniques Empirical Evidence: Forward Roll Strategy
• Does performance increase with contract maturity?
• Sharpe ratios are higher the more distant the contracts traded, but the improved performance comes at the cost of a worse tracking
Source: Rallis, Miffre and Fuertes (2013)
Index 3-month 6-month 9-month 12-month
Panel A: S&P-GSCI
Mean excess return 0.0368 0.0866 0.0875 0.0869 0.0883
Spread over index 0.0498 0.0507 0.0501 0.0515
(4.30) (2.69) (2.25) (2.21)
Std deviation 0.2126 0.1911 0.1691 0.1578 0.1535
Sharpe ratio 0.1730 0.4531 0.5172 0.5508 0.5753
Correlation with index 97.79% 94.36% 92.08% 91.30%
Tracking error 4.01% 5.61% 6.17% 6.27%
Panel B: DJ-UBSCI
Mean excess return 0.0197 0.0497 0.0595 0.0618 0.0629
Spread over index 0.0300 0.0399 0.0421 0.0432
(5.62) (3.76) (3.20) (3.05)
Std deviation 0.1451 0.1381 0.1265 0.1202 0.1157
Sharpe ratio 0.1356 0.3595 0.4707 0.5142 0.5438
Correlation with index 98.98% 96.03% 93.81% 92.97%
Tracking error 1.97% 3.54% 4.17% 4.27%
“3-month”: Index holds 3-month average maturity contracts, t-statistics in parentheses

Improved Rolling Techniques Empirical Evidence: Liquidity Risk
• Contracts in the mid- to far-end of the curve are less liquid
• Is the incremental performance of 2nd generation indices merely a compensation for lack of liquidity?
Source: Rallis, Miffre and Fuertes (2013)
Improved Rolling Techniques Empirical Evidence: Liquidity Risk
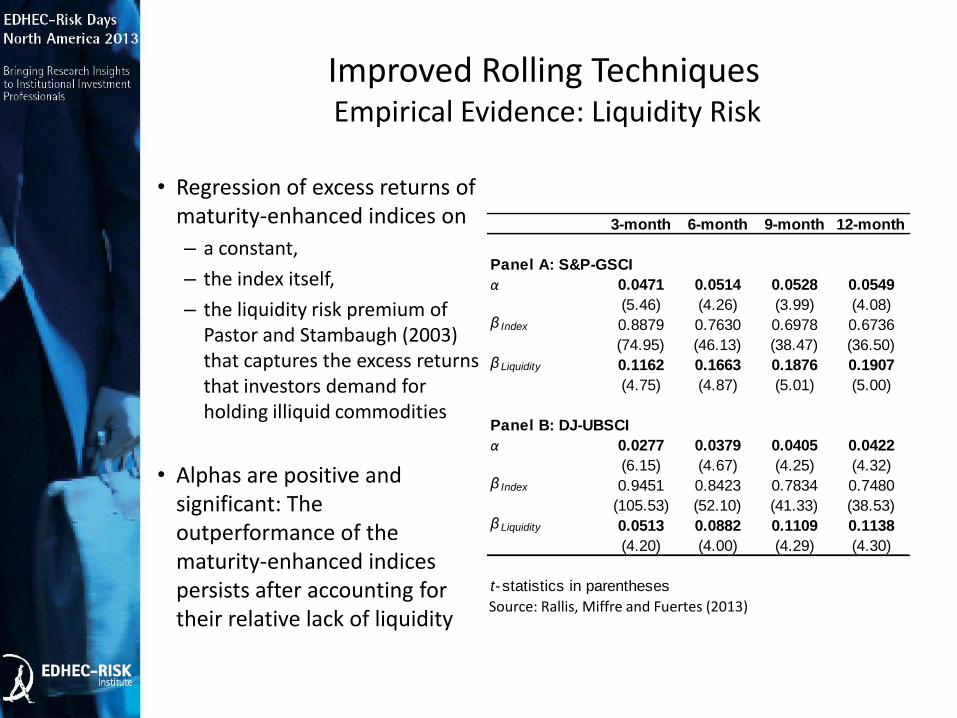
• Regression of excess returns of maturity-enhanced indices on
– a constant,
– the index itself,
– the liquidity risk premium of Pastor and Stambaugh (2003) that captures the excess returns that investors demand for holding illiquid commodities
• Alphas are positive and significant: The outperformance of the maturity-enhanced indices persists after accounting for their relative lack of liquidity
3-month 6-month 9-month 12-month
Panel A: S&P-GSCI
α 0.0471 0.0514 0.0528 0.0549
(5.46) (4.26) (3.99) (4.08)β Index 0.8879 0.7630 0.6978 0.6736
(74.95) (46.13) (38.47) (36.50)β Liquidity 0.1162 0.1663 0.1876 0.1907
(4.75) (4.87) (5.01) (5.00)
Panel B: DJ-UBSCI
α 0.0277 0.0379 0.0405 0.0422
(6.15) (4.67) (4.25) (4.32)β Index 0.9451 0.8423 0.7834 0.7480
(105.53) (52.10) (41.33) (38.53)β Liquidity 0.0513 0.0882 0.1109 0.1138
(4.20) (4.00) (4.29) (4.30)
t-statistics in parentheses
Source: Rallis, Miffre and Fuertes (2013)

What are the New Methods of Investing Passively in Commodities?
• Fundamentals of Commodity Futures Pricing – Backwardation and Contango – Limitation of First Generation Indices
• Moving from First to Second Generation (Enhanced Beta Indices) – Improved Rolling Techniques: Liquidity Risk – Improving Performance via Long-Only Signals
• Long-Short Third Generation Commodity Indices – Limitation of First and Second Generation Indices – Fully Exploiting Backwardation and Contango
• Comparative Study of Performance

Enhancing Performance in a Long-Only
Framework
• By taking long positions in – Momentum winners (Erb and Harvey, 2006; Miffre and Rallis, 2007)
– Commodities with positive roll yields (downward-sloping term structure; Erb and Harvey, 2006; Gorton and Rouwenhorst, 2006)
– Momentum winners with positive roll yields (Fuertes, Miffre and Rallis, 2010)
• By exploiting mean-reversion (Erb and Harvey, 2006; Gorton and Rouwenhorst, 2006)

Enhancing Performance in a Long-Only
Framework
Many second generation index providers use these signals as part of their proprietary asset allocation
• Momentum – Bache Commodity Index
– BNP Paribas Oscillator Commodities
– Morningstar Long/Flat Commodity Index
– Morningstar Long-Only Commodity Index
• Momentum and roll yield – BNP Paribas COMAC Long-Only
• Mean reversion – DBLCI-Mean Reversion…

Enhancing Performance in a Long-Only
Framework: Empirical Evidence
• We test the claim that performance increases by incorporating momentum or term structure signals in the first-generation S&P-GSCI and DJ-UBSCI
• Alphas are positive but the increased performance comes at the cost of a relatively poorer tracking
Index Momentum Term Structure
Panel A: S&P-GSCI
Mean excess return 0.0376 0.0504 0.0618
Spread over index 0.0128 0.0242
(1.52) (2.62)
Std deviation 0.2126 0.2110 0.2047
Sharpe ratio 0.1768 0.2388 0.3020
α relative to two-factor model 0.0134 0.0258
(1.59) (2.89)
Correlation with index 98.43% 98.11%
Tracking error 3.73% 3.97%
Panel B: DJ-UBSCI
Mean excess return 0.0202 0.0347 0.0400
Spread over index 0.0145 0.0197
(1.54) (2.29)
Std deviation 0.1451 0.1554 0.1505
Sharpe ratio 0.1393 0.2232 0.2655
α relative to two-factor model 0.0135 0.0198
(1.44) (2.28)
Correlation with index 96.73% 97.01%
Tracking error 3.95% 3.66%
Source: Rallis, Miffre and Fuertes (2013)

What are the New Methods of Investing Passively in Commodities?
• Fundamentals of Commodity Futures Pricing – Backwardation and Contango – Limitation of First Generation Indices
• Moving from First to Second Generation (Enhanced Beta Indices) – Improved Rolling Techniques: Liquidity Risk – Improving Performance via Long-Only Signals
• Long-Short Third Generation Commodity Indices – Limitation of First and Second Generation Indices – Fully Exploiting Backwardation and Contango
• Comparative Study of Performance

Limitation of 1st and 2nd Generation Indices
• Instead of merely mitigating the negative impact of contango on performance, why not fully benefit from contango by going short?
The figure plots monthly prices of front-end crude oil contracts alongside shaded areas which indicate backwardated months with positive roll yields Correlation of 30.18% (p-value of 0.00) Source: Miffre, Fuertes and Fernandez-Perez (2012)

Long-Short Third Generation Indices
• Simple and transparent rule-based relative-value indices that take long, as well as short, fully-collateralized positions in commodity futures markets to benefit from
– The price appreciation associated with backwardation
– The price depreciation associated with contango
• Third generation indices could challenge CTAs as they are
– Alpha providers
– Good diversifiers
– Highly liquid (trade front-end contracts, often impose liquidity constraints)
– Low-cost
– Fully-transparent (clear rebalancing rules)
• Third generation indices could become benchmarks to appraise CTAs performance

Long-Short Third Generation Indices
• Different signals are used; e.g.,
– Momentum
• Morningstar
• Mont Lucas Management
• Credit Suisse MOVERS
– Term structure: Barclays Capital Backwardation Long-Short Index
– Market-neutrality: Deutsche Bank Commodity Harvest
– Rule-based and fundamental indices: Barclays Capital CORALS

Comparative Study of Performance Sharpe Ratios
-0.23
-0.03
0.26
-0.4
-0.2
0
0.2
0.4
0.6 Sh
arp
e ra
tio
Sample analyzed: May 2008 – April 2012 that is common to all indices First generation indices in blue, second generation in red and third generation in green Source: Miffre (2012)

Comparative Study of Performance Excess Returns in the Month Following the Debacle of
Lehman Brothers
-24.29% -20.69%
9.68%
-40%
-30%
-20%
-10%
0%
10%
20%
30% Ex
cess
ret
urn
s in
Oct
ob
er 2
00
8
First generation indices in blue, second generation in red and third generation in green Source: Miffre (2012)
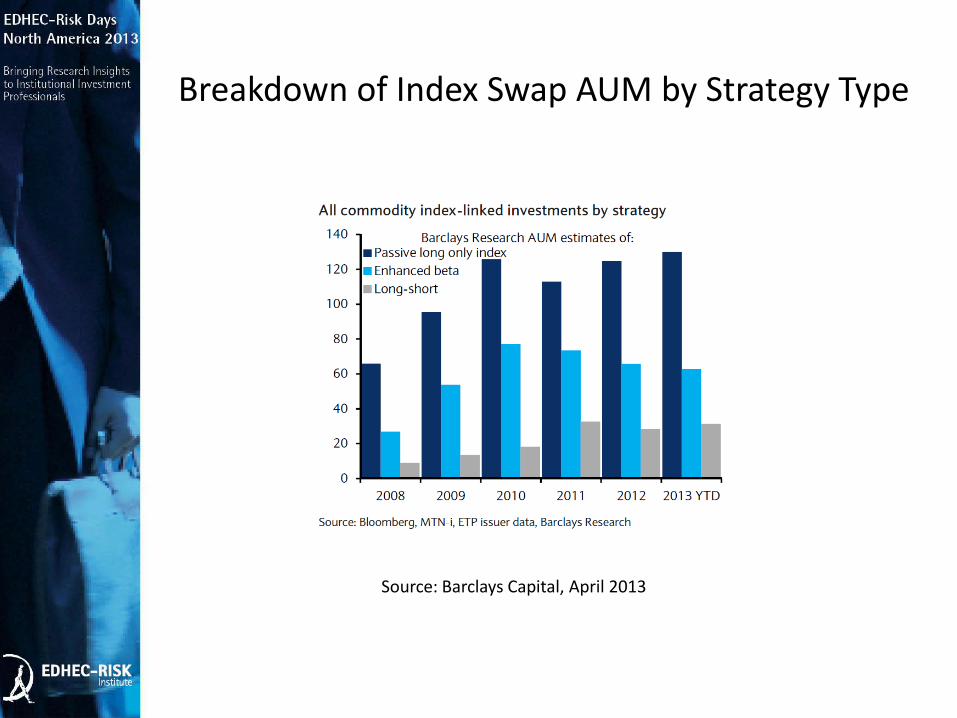
Breakdown of Index Swap AUM by Strategy Type
Source: Barclays Capital, April 2013

2013 YTD Passive Long-Only Index Strategies Underperformed
Source: Barclays Capital, July 2013 Curve = Distant contracts (most backwardated/least contangoed) Trend = Momentum Value = Slope of the term structure (used as proxy for inventory level) Liquidity = Capture liquidity premium on distant contracts

References
• With special thanks to Hilary Till for frequently providing industry specific information
• Barclays Capital, The Commodity Refiner, From an area of shortage to an ear of enough? April 2013, report by K. Norrish and H. Croft
• Barclays Capital, Commodity Research, 19 July 2013, The Commodity Investor, report by S. Cooper, J. Jiang, S. Luo, K. Norrish, S. Unnikrishnan, M. B. Rivera
• Erb, C., and C. Harvey, 2006, The strategic and tactical value of commodity futures, Financial Analysts Journal 62, 2, 69-97
• Gorton, G., and G. Rouwenhorst, 2006, Facts and fantasies about commodity futures, Financial Analysts Journal 62, 2, 47-68
• Miffre, J., 2012, Comparing first, second and third generation commodity indices, EDHEC Business School, Working paper
• Miffre, J.; A-M., Fuertes, and A. Fernandez-Perez, 2012, Commodity futures returns and idiosyncratic volatility, EDHEC Business School, Working paper
• Miffre, J., and G., Rallis, 2007, Momentum strategies in commodity futures markets, Journal of Banking and Finance 31, 6, 1863-1886
• Pastor, L. and R., Stambaugh, 2003, Liquidity risk and expected stock returns, Journal of Political Economy 111, 642-685
• Rallis, G.; J., Miffre, and A-M., Fuertes, 2013, Strategic and tactical roles of enhanced commodity indices, Journal of Futures Markets 33, 10, 965-992
• S&P Indices | Research & Design, Feb 2011, Dynamic Roll of Commodities Futures: An Extended Framework, report by P. Tsui and S. Dash


