Embed Size (px)
Citation preview
What Americans Know and Why it Matters for Politics
Eric D. Lawrence
Department of Political Science
George Washington University
April 20, 2010
Prepared for presentation at the 2010 Annual Meeting of the Midwest Political Science Association. A prelim-
inary version of the paper benefited from the comments of Robert Adcock, Brandon Bartels, Jai Kwan Jung,
Elizabeth Saunders, and John Sides. All errors remain the responsibility of the author.

How much does the public know about politics? What accounts for the origins of knowledge of politics?
And what are the consequences of varying levels of political knowledge and political sophistication? These
questions have animated debates about the adequacy of democratic decision making for centuries. In modern
political science, from Converse (1964) to Delli and Carpini and Keeter (1996) and beyond, researchers have
conceptualized and developed measures of political knowledge and political sophistication and demonstrated
their unconditional and conditional effects on political attitudes and behavior.
This paper examines an aspect of political knowledge rarely studied by political scientists, mathematical
competence. At first consideration, mathematical ability appears to be orthogonal to understanding basic political
facts. In many instances, this holds true. But some domains of public opinion require at least mathematical
competence in order to have coherent positions on issues. As recently argued in Wired (Thompson 2010),
“We live in a world where the thorniest policy issues increasingly boil down to arguments over what
the data mean. If you don’t understand statistics, you don’t know what’s going on—and you can’t
tell when you are being lied to.”
Not all issues have mathematical elements, of course. The political psychology literature of the 1980s demon-
strated convincingly that a minimally informed respondent can make decisions and take positions generally con-
sistent with her interests using heuristics, cue taking, and other cognitive short cuts. But while the implications
of differing levels of mathematical competence has varying consequences across policy domains and question
types, the findings of this paper demonstrate that in some contexts, math skill matters.
This is not the first paper to study mathematical limitations in political thinking. Prior work in political
science examines what has come to be called “political innumeracy.” Innumeracy is a word coined to provide a
parallel concept to the idea of illiteracy. An illiterate can not read; an innumerate can not do math. The main
political innumeracy studies in political science have examined respondents’ accuracy in estimating sizes of sub-
populations, both racial(Sigelman and Niemi 2001, Nadeau et al. 1993, Wong 2007) and homosexual (Martinez
et al. 2008). In most cases, respondents overestimate the proportion of the public falling in different racial and
ethnic categories, leading to problematic results like 150% falling in one of several racial categories. In more
recent work with different tasks, John Sides and I conducted survey experiments in multiple years wherein we
asked respondents to estimate social and demographic statistics of political interest (Lawrence and Sides 2008)
and US budget shares (Lawrence and Sides 2009). Among other things, we find that many people have a hard
time making reasonable estimates or even following basic mathematical rules (when estimating percentages,
shares must add to 100%, e.g.). None of these works, however, establish a link between political innumeracy
and mathematical competence. Rather, lack of mathematical competence is inferred from the aggregate and
1

individual level results.
Other disciplines have more developed understandings of the impact of mathematical (im)comptence. In
psychology, there is a large literature documenting computational, statistical, and general mathematical short-
comings in typical people.1 And the burgeoning behavioral economics literature, inspired by the earlier work in
psychology, testifies to the growing importance of accounting for cognitive limitations for economics as well. In
the statistical and experimental work described below, I confront two questions that lie squarely in the domain
of political science. First, how do (the lack of) mathematical reasoning skills affect our measurement of polit-
ical sophistication, if at all? Second, does variation in math skills affect the inferences we make about political
questions with mathematical elements?
Expectations
Some kinds of reasoning tasks require people to draw on factual knowledge learned in formal education settings
or informally by actively paying attention to the world. When we ask respondents what party controls the House
of Representatives, they need to know what the House is, what parties there are in the United States, and so
forth. While we typically assume that respondents know the names of the two major parties in the United
States, however, a series of question wording variations by Pew demonstrates that assumption is problematic.
The sample percentages correctly identifying the party in control of the House increases substantially, e.g., when
“Democratic” and “Republican” are supplied as possible alternatives.
Other kinds of reasoning taks requires people to not only draw on factual knowledge learned in formal
education settings or informally by actively paying attention to the world, but also to use (perhaps long dormant)
mathematical skills. What is the current unemployment rate? What is the average household income in the
United States? What proportion of the federal budget is allocated to foreign aid? Has the federal deficit declined
or increased over the past decade? When the latter types of questions are studied, variation in math skills get
ignored. Ignoring these skills, if they affect the probability of answering a question correctly, may lead us to
faulty conclusions about what political knowledge questions are measuring.
A related form of reasoning task depends on mathematical reasoning in less subtle ways. Many of the
Kahneman and Tversky experiments contain tasks demanding that subjects choose between certain and risky
alternatives. Often, the two alternatives have the same expected value. Kahneman and Tversky convincingly
demonstrated that subjects’ choices across such alternatives depends on how the alternatives are framed. These
framing effects provide much of the empirical underpinning of prospect theory, an approach that has gained
1For example, the 35 chapters in Kahneman, Slovic, and Tversky (1982) demonstrate a wide range of limitations in subjects’ abilityto make probability calculations, deal with base rates, etc.
2
some purchase in political science, particularly in IR. Note, however, that for a subject to able to recognize
that risky and certain alternatives have the same expected values, he must be able perform an expected utility
calculation, which involves both computation and at least a minimal understanding of probability. Some people
can do that; others can not. These two groups are apt to perform differently when confronted with such tasks.
The main conjecture of this paper, then, is that measuring and then controlling for mathematical skills will
sharpen our inferences about the effect of information and/or knowledge on outcomes of interest. I assess this
conjecture using both observational and experimental data described in the next section.
Data Analysis
The following empirical analysis uses data collected in the GW module of the CCES, fielded in October-
November 2006 by Polimetrix (now YouGov-Polimetrix). The GW module had a sample of 1,000 respon-
dents, allowing for straightforward cross-sectional analysis as well as experiments with respondents randomized
to different treatments. In recent administrations of the American National Election Study (ANES), political
knowledge has been measured with an open ended four question battery asking respondents to identify political
figures (see Appendix below for question wordings).2 The four question NES battery, which asks respondents to
identify the job held by the Vice-President, Speaker of the House, Chief Justice of the Supreme Court, and Prime
Minister of the UK, yields a five point scale, ranging from zero to four political figures correctly identified.3
To assess the relative effects of political and math knowledge, I constructed a four question math battery.
The questions are again shown in the Appendix. The first question, intended to be the easiest question, is a
basic tip calculation problem like that used in financial literacy surveys. It was indeed the easiest question. The
second and fourth questions are slight tweaks of SAT questions. The second question requires manipulating
information in calculating percentages. The third question requires the same kind of calculations needed to
calculate expected utility over alternatives. I designed this question for use with the “unusual Asian disease”
problem discussed below. The fourth question, which requires counting (or computing) combinations, was
intended to be the hardest question, and indeed it was. Like the ANES battery, the four math questions generate
a five point scale. The joint distribution of the two knowledge scales is shown in Figure 1. The data points are
jittered to enable seeing the clusters of observations on the discrete scale, and a fit line is drawn through the
scatterplot. The clustering of points in the northeast region of the scatterplot shows that there are many more
respondents with relatively high political and mathematical knowledge than relatively low levels of knowledge on
2Ideally, I’d use the four question scale recommended by Delli Carpini and Keeter (1996), but to maintain comparability to the ANES,their questions were used.
3These questions have come under some criticism for underestimating levels of political knowledge, but I code “correct” answersmore generously than was done for the 2004 NES.
3
both scales. In the next two sections, I show how these two knowledge scales perform in explaining variation in
several variables of interest to political scientists.
Substantive political knowledge
To determine whether controlling for mathematical knowledge makes a difference, I examine three substantive
political outcome variables, each of which has a numeric component, knowledge of the deficit, knowledge of
foreign aid levels, and knowledge of both legal and illegal immigration levels. For each of these outcomes, I add
controls for party identification and levels of education, with a series of dichotomous variables created such that
the baseline respondent is an independent with some college.4
The first dependent variable of interest is knowledge of the level of the deficit. Knowledge of changes in
the deficit have been shown to be influenced by partisanship (Bartels 2002, Achen and Bartels 2006), but here
we measure whether respondents can correctly identify the level of the deficit, with a fixed response question
wording.5 Our expectations here are that political knowledge and math knowledge should have positive effects
on getting the question correct, though the expectations for the latter are weaker, since the multiple choice
format means the respondent does not need to manipulate numerical quantities.6 The first column of Table 1
shows the results for the deficit question. Math knowledge adds nothing to the model here, whereas the political
knowledge scale is statistically significant and of moderate impact. Moving from the minimum to the maximum
on the political knowledge scale increases the probability of a correct answer by .27 ( 95% CI: [.13, .41]). For
this task, controlling for math generates no new results.
For the second task, respondents were asked to estimate the percentage of the U.S. federal budget allocated to
foreign aid. This question has been studied previously (Kull 1995-96, PIPA 2001, Gilens 2001), and the sample
average in the CCES data of 19% closely follows prior estimates. Figure 2 shows the full distribution of the
dependent variable, which exhibits a highly skewed and disperse range of values. The second column of Table
1 presents the weighted OLS estimates with the foreign aid percentage estimate as the outcome variable. Since
the true value is less than 1%, negative coefficients indicate higher levels of knowledge of the federal foreign aid
budget. Political knowledge again is significant and has a large effect—moving across the full range of knowledge
decreases foreign aid estimates by 21%. Math knowledge is less precisely estimated (z= -1.57) and the effect size
is less than a quarter of substantive knowledge—moving across the full range decreases the foreign aid estimate
by almost 5%. The math effects here are not trivial. What would happen if the math scale was omitted from
4Starting from a seven point party identification scale, independent leaners are classified as partisans.5In case you’ve already forgotten the good old days of small deficits, the correct answer at the time of the survey administration was
$300 billion.6Also, as Gibson and Caldeira (2009) show, the multiple choice format questions tend to generate higher estimates of knowledge.
They are generally easier for respondents, at least in the domain of measuring political knowledge.
4
the analysis? In that case, the political knowledge effects increase in magnitude from -4.20 to -4.44, a change of
only 5%. So while including the math scale in this analysis adds to our understanding, omitting it does not exact
a high price.
In the third task, half the sample was asked to estimate the size of the legal immigrant population in the
U.S. with the other half asked to estimate the illegal immigrant population. For a more comprehensive analysis
of these questions, see Sides and Citrin (2008). As an open-ended question asking respondents to estimate
a percentage, this task was much more similar to the foreign aid question than to the deficit question. The
distribution of the responses to the two questions are shown in Figure 3. Both legal and illegal immigration
levels were overestimated on average by 15%. Regression results are shown in Table 2, where the dependent
variable is the difference of the respondent’s estimate and the true values (12% for legal immigration, 3% for
illegal immigration). Given that respondents overestimate immigration levels on average, negative coefficients
indicate that the effect of the variable is to get respondents closer to the true values. Both knowledge scales are
statistically significant in the two equations, with moderate to large effects. In the legal immigration equation,
the effect sizes are equal, whereas in the illegal immigration question, the effect size is much larger for political
knowledge.7 As with the foreign aid analysis, we can calculate the impact of omitting the math scale from the
analysis. Here, omitting the scale leads to overestimating the effect of political knowledge by 18% for legal
immigration and by 10% for illegal immigration.
Taking these three sets of results as a whole, what’s the upshot? We have established that when asking
respondents questions that require that they manipulate numbers, math skills help explain variation in those
questions, though moreso on immigration than on foreign aid. Math skills do not dominate the equations, but
they do add explanatory power.
The unusual Asian disease experiment
In the same survey, I replicated the famous Tversky and Kahneman (1981) “unusual Asian disease” experiment.
This experiment has been replicated and tweaked in many ways, mostly by psychologists but some times by
political scientists (Druckman 2001). Küberger(1998) provides a comprehensive meta-analysis which demon-
strates the robustness of the finding across a wide range of domains. By varying the question wording and the
alternatives, it is possible to reduce the effect of the framing (Druckman 2001) but the existence of the framing
effect endures.
The question wording used in the GW module of the 2006 CCES appears in the appendix below. The
7Using F-tests of parameter equality, we can not reject the null of equality for the two knowledge scale parameters in the legal case(p = .99) but can reject the null for the illegal case, given an alpha level of .05 (p = .04).
5
wording matches the original Tversky-Kahneman formulation, and the results obtained with this wording closely
follows that of the 1981 paper. In interpreting the meaning of the Tversky-Kahneman results, scholars have typ-
ically taken them to imply the powerful effects of framing on choosing between a risky and a certain alternative.
Given a saving frame, respondents are less likely to choose a risky alternative. Given a dying frame, respondents
are more likely to choose a certain alternative. But notice that there is an unstated assumption in this interpre-
tation of the findings. Specifically, it is assumed, e.g., that when confronted with the saving frame alternative of
“If program B is adopted, there is a 1/3 probability that 600 people will be saved, and a 2/3 probability that no
people will be saved” that the subject will recognize that statement to imply an expected number of lives saved
of 200. A problem here is that some subjects will be able to see that, but some will not.8 But even if some
subjects are unable to make such calculations, does that affect the outcome of the experiment? I address this
question by asking respondents to perform an expected utility calculation (the raffle ticket question described in
the appendix) and then controlling for whether respondents answered the question correctly.
First, however, we must establish that we can replicate the basic Tversky-Kahneman effects. The rows of
Table 3 show that we can do so. The first row, denoted “Baseline” are the replication results. Respondents were
given the two alternatives, with the saving or dying frame randomly assigned. In that experiment, the strikingly
large results emerge, producing a 39% gap across frames.9 Similarly to Druckman(2001), I explore whether
adding an explicit don’t know option and adding a don’t know and a neutral option affects the framing effects.
Adding these options does cut into the magnitude of the treatment effect (see rows 2 and 3 of Table 3), but a
sizable, statistically significant effect remains.
What happens when we control for respondents ability to answer an expected utility question? Column 1 of
Table 4 shows the replication results, now in probit form, with the attendant enormous effect of framing. With
the “people saved” rather than the “people died” frame, the probability of making the risky choice decreased
by .39.10 The second column of Table 4 adds two variables to the original formulation, a variable indicating
if the respondent correctly answered the expected utility question as well as that variable interacted with the
saving frame. No direct effect of the math item was expected, but the interaction term was expected to have a
negative effect. If one is able to correctly calculate expected utility, one will more likely identify the two choices
in the problem to have the same expected number of lives saved/lost. The results in Table 4 show that when
the interaction term is added to the model, the direct effect of the frame is no longer statistically significant. The
framing effects only explain alternative choice for those who can answer the analogous math question correctly. And for this subgroup,
8It has been suggested that the existence of casinos and state lotteries suggest that a non-trivial portion of the public can not makesuch calculations.
9All the differences shown in Table 3 are statistically significant at conventional levels.10Notice that the replication column here contains the same information as the first row of Table 3, albeit in different form).
6

the treatment effect is larger than the average treatment effect. To the best of my knowledge, this aspect of the framing
effect has never been documented previously. The results make intuitive sense. What will respondents do if they
can not make the expected utility calculation? Guessing, which means behaving randomly, would be the most
likely behavior. And if such subjects do behave randomly, then their behavior, by definition, will be uncorrelated
with framing.
Table 5 extends two other features of the original Tversky-Kahneman experiment, allowing for don’t know
responses (column 1) and neutral responses (column 2). Note that here, the frames are irrelevant. The dependent
variables are whether the respondent answers don’t know or favors neither alternative when presented with those
options explicitly. The effects here are modest and inconsistent. For the four groups presented with a don’t know
alternative, higher levels of political knowledge lower the probability of opting for “don’t know,” but the expected
utility question is unrelated to the choice. For the two groups presented with a neutral option, the effects of the
two scales is reversed. The bottom half of Table 5 shows the marginal effects, which are non-zero but not huge.
Conclusion
What have we learned? In some but not all outcomes that require respondents to think about (the deficit ques-
tion), estimate (foreign aid and immigration), or manipulate (unusual Asian disease) numerical data, accounting
for math skills in explaining variation in the outcome made a difference. The differences ranged in size from
quite modest (foreign aid) to quite striking (unusual aid). Some of the explanatory power attributed to political
knowledge appears to be due to mathematical ability or perhaps the broader and more elusive concept of “intel-
ligence.” An obvious quick generalization from the results would be that as the mathematical complexity of the
task increases (from thinking to estimating to manipulating), the importance of accounting for math skills in-
creases. Additional manipulation of task complexity with more experiments would be required, however, before
we could be confident that the pattern holds more broadly.
Should we start including math questions in our surveys on a regular basis? Survey questions are expensive,
so in most cases, the marginal benefits of including them will be outweighed by the costs. But when subjects
are asked questions with mathematical reasoning implicit or asked to perform mathematical manipulations, the
benefit/cost ratio may increase rapidly. And certainly the findings from the Tversky-Kahneman experiment
replication warrant further exploration. Given the importance of framing effects to ongoing research projects
in several subfields, understanding the boundaries and scope conditions of the theory and evidence base will be
a constructive next step in establishing whether the findings here are generalizable or anomalous.
7

Appendix: Question Wording of Survey Items
NES Political knowledge questions
Now we have a set of questions concerning various public figures. We want to see how much information about
them gets out to the public from television, newspapers and the like.
[knowhastert] The first person is Dennis Hastert. What job or political office does he now hold? If you do
not know, feel free to guess or just write “don’t know.”
[knowcheney] The next person is Dick Cheney. What job or political office does he now hold? If you do
not know, feel free to guess or just write “don’t know.”
[knowblair] The next person is Tony Blair. What job or political office does he now hold? If you do not
know, feel free to guess or just write “don’t know.”
[knowroberts] The next person is John Roberts. What job or political office does he now hold? If you do
not know, feel free to guess or just write “don’t know.”
Math knowledge questions These last few questions are math problems. If you are unsure of the answer, just
make your best guess. {randomize order of responses}
[Math1] It is your turn to pay for dinner. You get a bill for $36 and want to add a 15% tip. After the tip, the total
paid will be:
1. $37.80
2. $39.60
3. $41.40
4. $43.20
[Math2] John has a collection of 90 compact discs (CDs). If 30 percent of his CDs are country music and the
rest are jazz, how many jazz CDs does he have?
1. 27
2. 30
3. 60
4. 63
[Math3] At a school fair, a group is selling raffle tickets for $1 a piece. For each ticket, the chances of winning a
prize of $5 is one in ten. If you buy 100 tickets, how much money should you expect to win?
1. $0
2. $20
8

3. $50
4. $100
[Math4] You are a supervisor of six employees, and you have a job that requires two people to complete. How
many different pairs of two employees can you assign to the job?
1. 9
2. 12
3. 15
4. 24
Subject knowledge question
[deficit] The federal budget deficit is the difference between how much money the government spends and how
much money it collects. What is your best guess regarding the current size of the annual U.S. deficit?
1. $180 million
2. $500 million
3. $300 billion
4. $900 billion
[immigration] Out of every 100 people living in the United States, how many do you think were born outside of
the country?
[foreign aid] Foreign aid is the assistance that the United States gives to other countries. Just based on what you
know, please tell me your hunch about what percentage of the federal budget goes to foreign aid—from 0-100%.
Unusual Asian disease experiment
Imagine that the U.S. is preparing for the outbreak of an unusual Asian disease, which is expected to kill 600
people. Two alternative programs to combat the disease have been proposed. Assume that the exact scientific
estimate of the consequences of the programs are as follows: {Randomize across frames}
Saving frame If program A is adopted, 200 people will be saved. If program B is adopted, there is a 1/3
probability that 600 people will be saved, and a 2/3 probability that no people will be saved.
[disease] Which of the two programs would you favor?
Program A
Program B
Dying frame If program A is adopted, 400 people will die. If program B is adopted, there is a 1/3 probability
9

that nobody will die, and a 2/3 probability that 600 people will die.
[disease] Which of the two programs would you favor?
Program A
Program B
10

References
Achen, Christopher and Larry M. Bartels. 2006. “It Feels Like We’re Thinking: The Rationalizing Voter and
Electoral Democracy.” Paper presented at the Annual Meeting of the American Political Science Association.
Bartels, Larry M. 2002. “Beyond the Running Tally: Partisan Bias in Political Perceptions.” Political Behavior 24(2):
117-150.
Delli Carpini, Michael, and Scott Keeter. 1996. What Americans Know about Politics and Why It Matters. New Haven:
Yale University Press.
Druckman, James. 2001. “Evaluating Framing Effects.” Journal of Economic Psychology 22(1): 91-101
Gibson, James L., and Gregory A. Caldeira. 2009. “Knowing the Supreme Court? A Reconsideration of Public
Ignorance of the High Court.” The Journal of Politics 71 (2): 429-441.
Gilens, Martin. 2001. “Political Ignorance and Collective Policy Preferences.” American Political Science Review 95
(2): 379-396.
Kahneman, Daniel, and Amos Tversky. 1973. “On the Psychology of Prediction.” Psychological Review 80 (4):
237-251.
Küberger, Anton. 1998. “The Influence of Framing on Risky Decisions: A Meta-analysis.” Organizational Behavior
and Human Decision Processes 75(1): 23-55.
Kull, Stephen. 1995-96. “What the Public Knows that Washington Doesn’t.” Foreign Policy 101: 102-115.
Luskin, Robert C. 1990. “Explaining Political Sophistication.” Political Behavior 12(4): 331-361.
Martinez, Michael D., Kenneth D. Wald and Stephen C. Craig. 2008. “Homophobic Innumeracy? Estimating
the Size of the Gay and Lesbian Population.” Public Opinion Quarterly 72(4):753-767.
Nadeau, Richard, and Richard.G. Niemi. 1995. “Educated Guesses: The Process of Answering Factual Knowl-
edge Questions in Surveys.” Public Opinion Quarterly 59: 323-346.
Nadeau, Richard, Richard.G. Niemi, and Jeffrey Levine. 1993. “Innumeracy about Minority Populations.” Public
Opinion Quarterly 57: 332-347.
Paulos, John Allen. 1988. Innumeracy: Mathematical Illiteracy and Its Consequences. New York: Hill and Wang.
PIPA (Program on International Policy Attitudes). 2001. “Americans on Foreign Aid and World Hunger: A
Study of U.S. Public Attitudes.” Available online at: http://www.worldpublicopinion.org/pipa/
11

pdf/feb01/ForeignAid_Feb01_rpt.pdf
Prior, Markus, and Arthur Lupia. 2008. “Money, Time, and Political Knowledge: Distinguishing Quick Recall
and Political Learning Skills.” American Journal of Political Science 52 (1): 169-83.
Sides, John, and Jack Citrin. 2008. “How Large the Huddled Masses? The Causes and Consequences of Public
Misperceptions about Immigrant Populations.” Working paper.
Sigelman, Lee and Richard Niemi. 2001. “Innumeracy about Minority Populations: African Americans and
Whites Compared.” Public Opinion Quarterly 65(1): 86-94.
Thompson, Clive. 2010. “Do You Speak Statistics?” Wired, p. 36, May 2010.
Tversky, Amos and Daniel Kahneman. 1981. “The framing of decisions and the psychology of choice.” Science
211: 453-458.
Wong, Cara. 2007. “‘Little’ and ‘Big’ Pictures in Our Heads: Race, Local Context, and Innumeracy About Racial
Groups in the United States.” Public Opinion Quarterly 71(3):392-412.
12
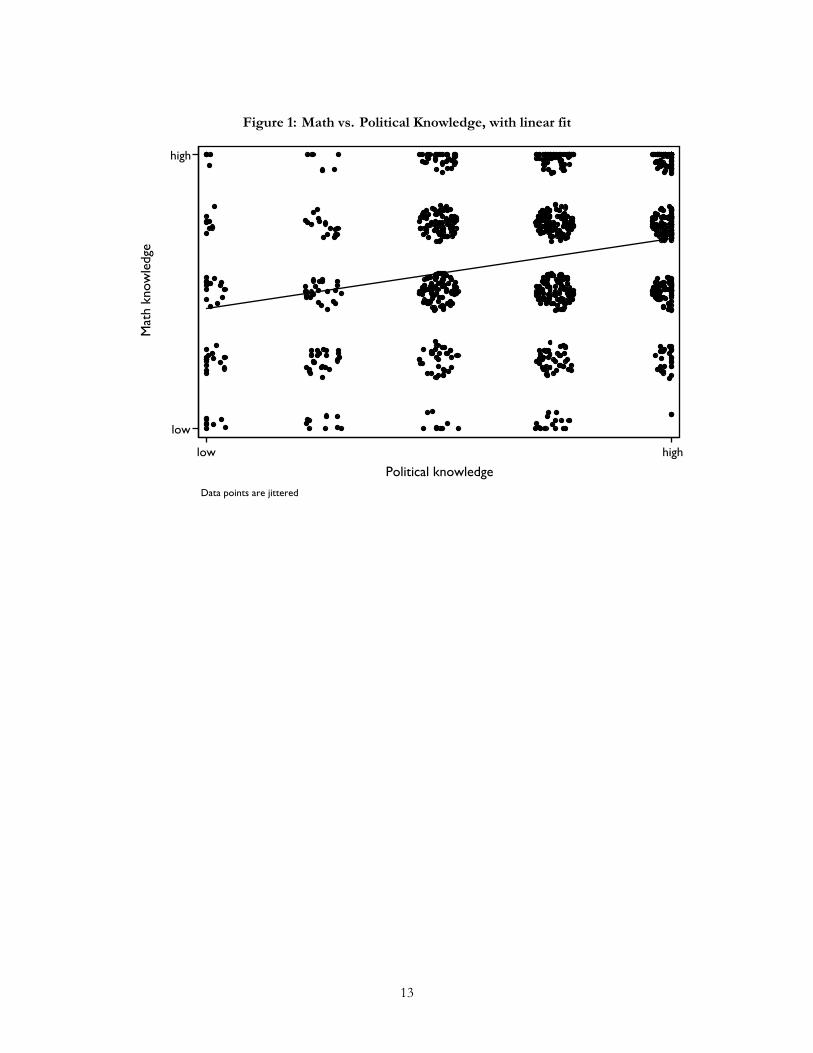
Figure 1: Math vs. Political Knowledge, with linear fitlow
low
lowhigh
high
highMath knowledgeM
ath
know
ledg
eMath knowledgelow
low
lowhigh
high
highPolitical knowledge
Political knowledge
Political knowledgeData points are jittered
Data points are jittered
Data points are jittered
13

Figure 2: Foreign Aid Estimates0
0
0.02
.02
.02.04
.04
.04.06
.06
.06.08
.08
.08DensityD
ensi
tyDensity0
0
020
20
2040
40
4060
60
6080
80
80Estimated percentage of federal budget spent on foreign aid
Estimated percentage of federal budget spent on foreign aid
Estimated percentage of federal budget spent on foreign aidMean estimate = 18.8%
Mean estimate = 18.8%
Mean estimate = 18.8%
14
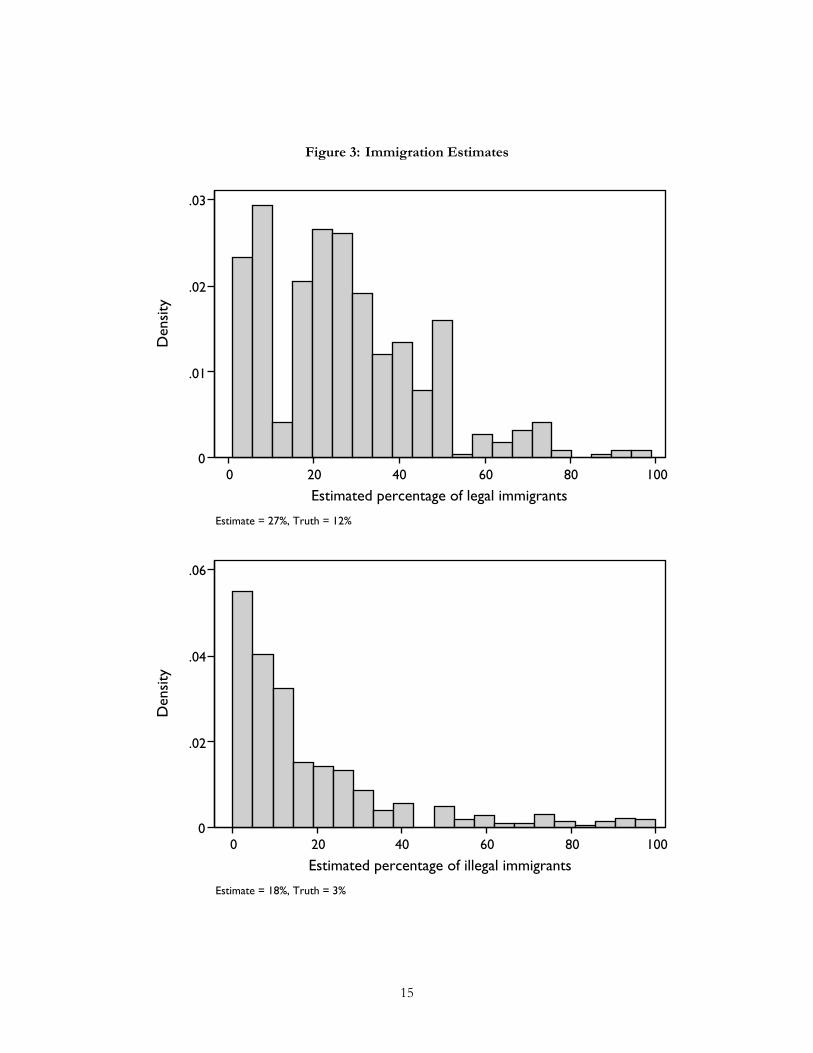
Figure 3: Immigration Estimates0
0
0.01
.01
.01.02
.02
.02.03
.03
.03DensityD
ensi
tyDensity0
0
020
20
2040
40
4060
60
6080
80
80100
100
100Estimated percentage of legal immigrants
Estimated percentage of legal immigrants
Estimated percentage of legal immigrantsEstimate = 27%, Truth = 12%
Estimate = 27%, Truth = 12%
Estimate = 27%, Truth = 12%0
0
0.02
.02
.02.04
.04
.04.06
.06
.06DensityD
ensi
tyDensity0
0
020
20
2040
40
4060
60
6080
80
80100
100
100Estimated percentage of illegal immigrants
Estimated percentage of illegal immigrants
Estimated percentage of illegal immigrantsEstimate = 18%, Truth = 3%
Estimate = 18%, Truth = 3%
Estimate = 18%, Truth = 3%
15

Table 1: Deficit and Foreign Aid Knowledge
Deficits Foreign Aid[probit] [OLS]
5 point political knowledge scale 0.172 -4.202(3.572) (-6.151)
5 point math knowledge scale -0.004 -0.981(-0.091) (-1.570)
High school education or less -0.154 0.261(-1.353) (0.165)
College degree or more 0.067 -3.515(0.525) (-2.698)
Democrat identifier 0.015 1.069(0.101) (0.513)
Republican identifier 0.233 1.622(1.529) (0.804)
Constant -0.403 33.007(-1.982) (11.376)
N 983 996R2 .034 0.114
Notes: The R2 for the probit estimates is a pseudo-R2. Cell entries are raw coefficients over robust z-statistics.
Estimates are weighted using survey weights. The baseline respondent is an independent with some college
education.
16

Table 2: Immigration Knowledge
Legal Illegal5 point political knowledge scale -2.797 -6.172
(-2.489) (-4.360)5 point math knowledge scale -2.827 -2.325
(-2.913) (-2.277)High school education or less -1.246 3.875
(-0.487) (1.398)College degree or more -7.192 1.892
(-3.137) (0.733)Democrat identifier -7.157 -1.875
(-1.738) (-0.485)Republican identifier -6.495 0.115
(-1.540) (0.030)Constant 39.293 37.485
(7.519) (6.678)N 457 460R2 0.123 0.158SER 18.356 20.898
Notes: The dependent variable here consists of the difference between the respondents’ estimates of the immi-
gration percentages and the true percentages. Cell entries are raw coefficients over robust z-statistics. Estimates
are weighted using survey weights. The baseline respondent is an independent with some college education.
17

Table 3: Kahneman and Tversky, unusual Asian disease experiment replication
% difference in support for risky treatment χ2 statistic, p-value
Baseline -39% 33.1 [1 df], p < .001+don’t know option -21% 11.9 [2 df], p ≈ .003
+don’t know & neutral option -24% 23.5 [3 df], p < .001
Notes: Each row represents one experimental comparison. The middle column shows the average difference
in support for the risky treatment, given the saving frame question wording. The first row replicates the original
design. The second and third rows add explicit “don’t know” and “neutral” options.
18
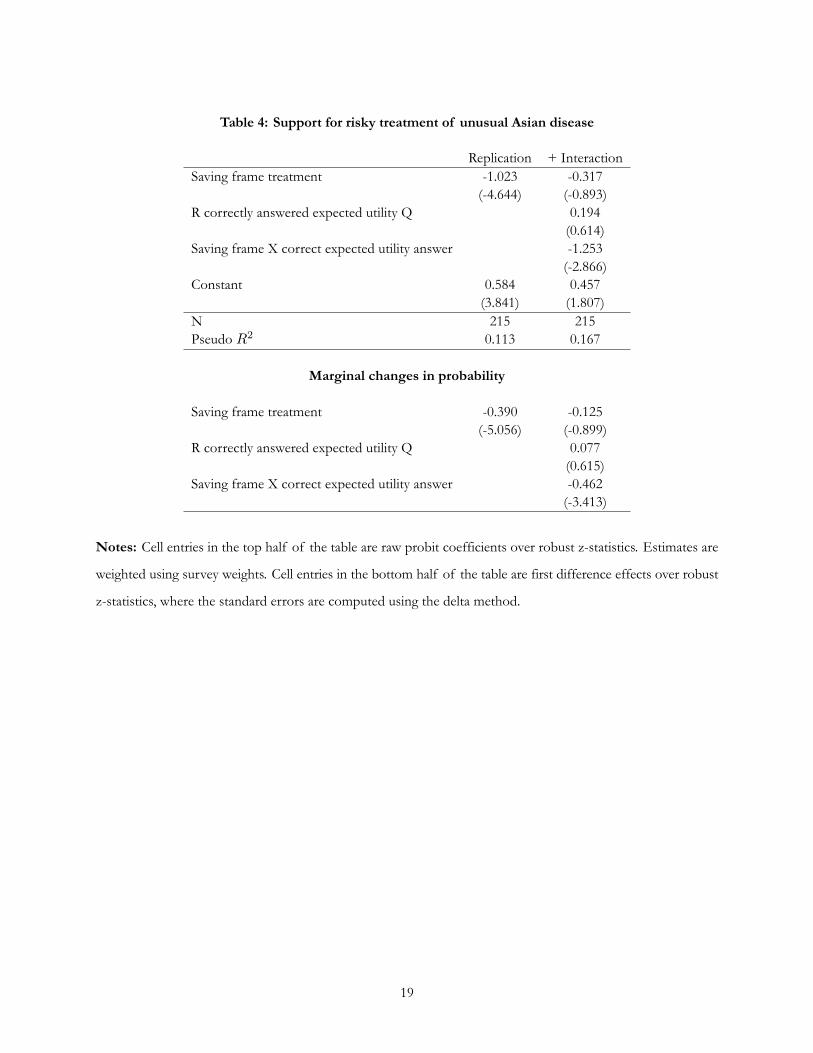
Table 4: Support for risky treatment of unusual Asian disease
Replication + InteractionSaving frame treatment -1.023 -0.317
(-4.644) (-0.893)R correctly answered expected utility Q 0.194
(0.614)Saving frame X correct expected utility answer -1.253
(-2.866)Constant 0.584 0.457
(3.841) (1.807)N 215 215Pseudo R2 0.113 0.167
Marginal changes in probability
Saving frame treatment -0.390 -0.125(-5.056) (-0.899)
R correctly answered expected utility Q 0.077(0.615)
Saving frame X correct expected utility answer -0.462(-3.413)
Notes: Cell entries in the top half of the table are raw probit coefficients over robust z-statistics. Estimates are
weighted using survey weights. Cell entries in the bottom half of the table are first difference effects over robust
z-statistics, where the standard errors are computed using the delta method.
19

Table 5: Don’t know and neutral responses, unusual Asian disease experiment
Don’t know Neutral5 point political knowledge scale -0.163 0.111
(-2.428) (1.004)R correctly answered exp. utility Q 0.125 -0.483
(0.723) (-1.889)High school education or less 0.011 0.234
(0.062) (0.843)College degree or more -0.035 -0.058
(-0.184) (-0.194)Constant -0.326 -0.797
(-1.459) (-2.296)N 460 235Pseudo R2 0.020 0.030
Marginal changes in probability, mean effect and 95% CI
Don’t know equation, 0 v. 5, political knowledge: -.22, [-.41, -.03]Neutral equation, correct math: -.15, [-.32, .01]
Notes: Cell entries in the top half of the table are raw probit coefficients over robust z-statistics. Estimates are
weighted using survey weights. Cell entries in the bottom half of the table are first difference effects over robust
z-statistics, where the standard errors are computed using the delta method. The baseline respondent has some
college and did not correctly answer the expected utility question.
20


![[OpenCamp 2010] You Don't Know Click: Measuring What Matters in Social Media](https://img.dokumen.tips/doc/110x75/545b8d0bb1af9f40378b5caa/opencamp-2010-you-dont-know-click-measuring-what-matters-in-social-media.jpg)


