Embed Size (px)
Citation preview

1
Matthew Gray & Heath Hagy
Department of Forestry, Wildlife, and Fisheries
University of Tennessee-Knoxville
WFS 536: Wetland Management
Lecture Outline
I. Annual Cycle of Waterfowl
II. Waterfowl Diet & Nutritional Requirements
III. Moist-soil Management
IV. Agriculture Management
What is the Annual Cycle?
• Series of inter-related events that occur during a
year in the life of an animal
• Think about “home range” size
• What is the home range of:– A Quail?
– A White-tailed Deer?
– A Black Bear?
– A Mallard?

2
Annual Cycle of WaterfowlThe complex of physiological & behavioral events experienced by
waterfowl during the course of a year.
1. Breeding
2. Fall Migration
3. Winter
4. Spring Migration
Post-Breeding
Nesting
MoltWinter
Fall Migration
Spring Migration
Pre-Nesting Brood Rearing
The Annual CycleDifferent needs at different times
What major events happen to a duck during the year?
• Species variation
• Latitudinal variation
• Cross-seasonal effects
• Management at all
stages
Post-Breeding
Nesting
MoltWinter
Fall Migration
Spring Migration
Pre-Nesting Brood Rearing

3
Nesting
• Most waterfowl nest in the northern U.S. and
Canada
- Exceptions? = CANG, WODU, HOME
• Laying requires lots of
protein = invertebrates!
• More resources
means more eggs
Nesting
Brood Rearing
• Same species that nest here
• Requirements similar to nesting phase
• Ducklings need– Invertebrates
– Cover
• Managing some
wetland area as
summer marsh
is beneficial
NestingBrood
Rearing
Post-Breeding
• Females and broods begin to move among wetlands
• Less need for cover– Drakes molting
– Hens nearing molt
– Switch to plant foods
• Loafing sites
Post-Breeding
NestingBrood
Rearing

4
Molt
• Energetically costly time of the year
• Wing molt requires lots of protein and essential
amino acids– Found in natural
wetland and
plant seeds
• Birds not mobile
Post-Breeding
Nesting
Molt
Spring Migration
Brood Rearing
Fall Migration• Mid-latitude stopover habitats are very important
• High energy foods (fatty) are very important – High carbohydrate foods
– M.S. / Ag. crops high in fat
• Thermal cover
• Refuge
• Hunting
• Slow & methodical
Post-Breeding
Nesting
Molt
Fall Migration
Spring Migration
Brood Rearing

5
1500 miles
Winter
• Pre-alternate / Pre-basic molt
• Pair bonds
• High energy needs
• Courtship
• Cross-seasonal effects
• Open water
• Hunting
Post-Breeding
Nesting
MoltWinter
Fall Migration
Brood Rearing
Fall - Winter: FIXED BIOLOGICAL DEMANDS
• Food– Body condition and survival, feather replacement
• Water– Provides habitat for food acquisition and resting
• Cover– Forested wetlands & emergent wetlands - Pairing
• Refuge– Survival, feeding, pair bonding, “source” for hunting,
philopatry

6
Patterns of body mass during WINTER
Oct Oct Nov Nov Dec Dec Jan Jan Feb Feb Mar Mar
LIP
ID IN
DE
X
Migration/Arrival
Gain Lipids
Use Lipids
Gain Lipids
Survive
Pairing - Courtship
Bulk-up Bulk-up
Spring Migration
• Often overlooked but critical stage
- relationship between spring condition and
reproduction
• Spring food low?
• Seeds invertebrates
• High-speed
Post-Breeding
Nesting
MoltWinter
Fall Migration
Spring Migration
Brood Rearing
Pre-Nesting• Stopover sites and temporary wetlands important
• Some ducks carry reserves to lay eggs (i.e., snow geese)
• Endogenous resources
• Some get protein at
breeding areas
(i.e., ruddy ducks)
• Exogenous resources
• Heavier birds nest
earlier and are
more successful
Post-Breeding
Nesting
MoltWinter
Fall Migration
Spring Migration
Pre-Nesting Brood Rearing
7
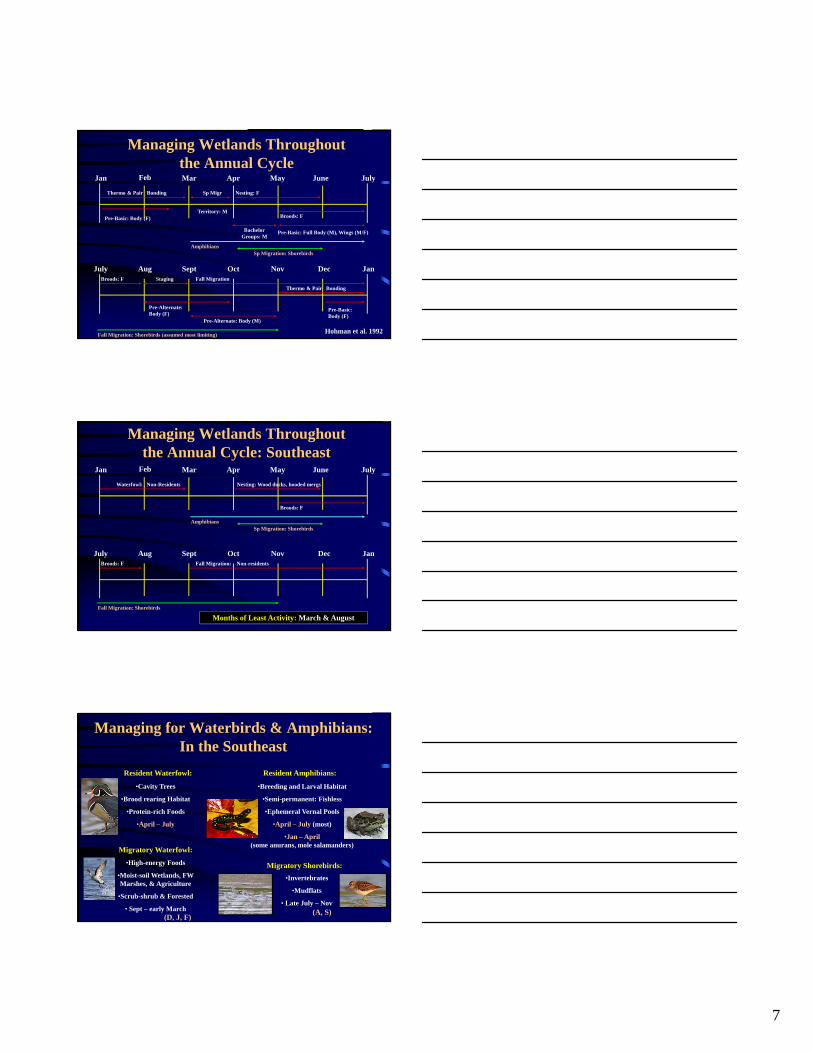
Managing Wetlands Throughout the Annual Cycle
Jan July
July Jan
Mar Apr June
Aug Sept Oct Nov Dec
Feb May
Thermo & Pair Bonding Sp Migr Nesting: F
Territory: MBroods: F
Thermo & Pair Bonding
Fall Migration
Pre-Basic: Full Body (M), Wings (M/F)Bachelor Groups: M
Pre-Alternate: Body (F)
Pre-Alternate: Body (M)
StagingBroods: F
Pre-Basic: Body (F)
Pre-Basic: Body (F)
Amphibians
Fall Migration: Shorebirds (assumed most limiting)
Sp Migration: Shorebirds
Hohman et al. 1992
Managing Wetlands Throughout the Annual Cycle: Southeast
Jan July
July Jan
Mar Apr June
Aug Sept Oct Nov Dec
Feb May
Waterfowl: Non-Residents Nesting: Wood ducks, hooded mergs
Broods: F
Fall Migration: Non-residentsBroods: F
Amphibians
Fall Migration: Shorebirds
Sp Migration: Shorebirds
Months of Least Activity: March & August
Managing for Waterbirds & Amphibians: In the Southeast
Resident Waterfowl:
•Cavity Trees
•Brood rearing Habitat
•Protein-rich Foods
•April – July
Resident Amphibians:
•Breeding and Larval Habitat
•Semi-permanent: Fishless
•Ephemeral Vernal Pools
•April – July (most)
•Jan – April(some anurans, mole salamanders)
Migratory Waterfowl:
•High-energy Foods
•Moist-soil Wetlands, FW Marshes, & Agriculture
•Scrub-shrub & Forested
• Sept – early March
Migratory Shorebirds:
•Invertebrates
•Mudflats
• Late July – Nov
(D, J, F)(A, S)

8
What do ducks eat?
What do Ducks Eat??
Pre-Laying
4555
Laying
75
25
Winter
90
Post-Laying
25
75
Life Cycle Events
•Fall Migration
•Courtship
•Thermoregulation
•Spring Migration
•Egg Production
•Feather Production
•Pre-Basic
•Growth
Proteinaceous Foods
Energy-rich Foods
Seeds and Invertebrates!!
•Pre-Alternate: Don’t Forget!
Ag. and M.S. Foods
“Waterfowl cannot maintain body weight on agricultural seeds alone!”
R. M. Kaminski and C. Loesch (1989)
Rice and Millet
Better than
Soybean and Corn
Mallards Metabolize
Less Energy from
Soybeans than other Ag
Grains
Trypsin Inhibitor in
Soybeans May Decrease Useable
Protein (35%)
3.5 kcal/g vs.
2.5 kcal/g
TME in Ag vs.
MS

9
Waterfowl Habitat Management Complex
(Or natural hardwood
bottomlands!)
Flooded Marsh
4th Important Component
5th Important Component
(1/3 of area)
Moist-soil WetlandsGeneral Definition
Intermittently to seasonally flooded wetlands that are dominated by annual and/or perennial
herbaceous hydrophytes.
Moist-soil Wetlands

10
Moist-soil WetlandsSpecific Definition: Cowardin et al. 1979
Palustrine
Emergent Wetland
Intermittently Flooded, Temporally Flooded, Saturated, Seasonally Flooded
Non-Persistent Persistent
(System)
(Class)
(Subclass)
(Water Regime)
Late Seral Stage
Early Seral Stage
Perennial AnnualRushes, Vines Grasses, Sedges
Smartweed
Moist-soil Waterbirds
Croplands – Agriculture
• Rice
• Soybeans
• Corn
• Milo
• Aquaculture

11
Agriculture Management
“Waterfowl cannot maintain body weight on agricultural seeds alone!” R. M. Kaminski and C. Loesch (1989)
Rice and Millet
Better than
Soybean and Corn
Mallards Metabolize
Less Energy
from Soybeansthan other Ag Grains
Trypsin Inhibitor in Soybeans
May Decrease Useable Protein (35%)
3.5 kcal/g vs.
2.5 kcal/g
TME in Ag vs. MS
Giving-up densityGreer et al. 2009 (JWM)
~71% decrease
Rice Availability in M.A.V.
Stafford et al. 2006August November
Food Available in Rice Fields
Decomposition 58%
Granivory14%
Germination8%
Potentially Available20%
Food Available in Rice FieldsManley et al. (2004), Stafford et al. (2005)
71%, 79-99% Decrease in Seed Availability
78 kg/ha Late Autumn271 kg/ha Post Harvest
(Near 50 kg/ha Threshold; Greer et al. 2009)Less Food (DED) Available!!
140 kg/ha 752 DED/ha325 DED/ha
Seed Fate
WHY?

12
Harvested Rice Field vs. Moist-Soil
HabitatMean
(kg/ha)DUDs
Rice 78 ± 15% 897
Moist-Soil 496 ± 13% 4,196
** 5-6 times more food and DUDs
Food Available in Rice Fields
Post-harvest Fates of Agricultural Seed in Tennessee Croplands
Matthew J. GrayUT Wetlands Program
SEAFWA19 October 2010
Melissa A. Foster, Craig A. Harper, Johnathan G. Walls, andRichard M. Kaminski

13
Federally-owned (TNWR)
State-owned (TWRA)
Privately-owned
Study AreasCorn, Grain Sorghum and Soybeans Fields
n = 105 harvested, n = 59 unharvested
Harvested Corn Mass: Temporal Declines
P < 0.001, R2 = 0.51
BIOMASS = 241.1 × e (-0.637 × TIME)
Giving-up Density50 kg/ha (Greer et al. 2009)
4.5X Faster than LMVJV Daily Loss Rate
2-3 mo PH
Harvested Soybean Mass: Temporal Declines
P < 0.001, R2 = 0.66
BIOMASS = 116.2 × e (-0.844 × TIME)
2.6X Faster than LMVJV Daily Loss Rate
<1 mo PH
14
0
100
200
300
400
500
600
0 1 2 3
kg/h
a
Months post-harvest
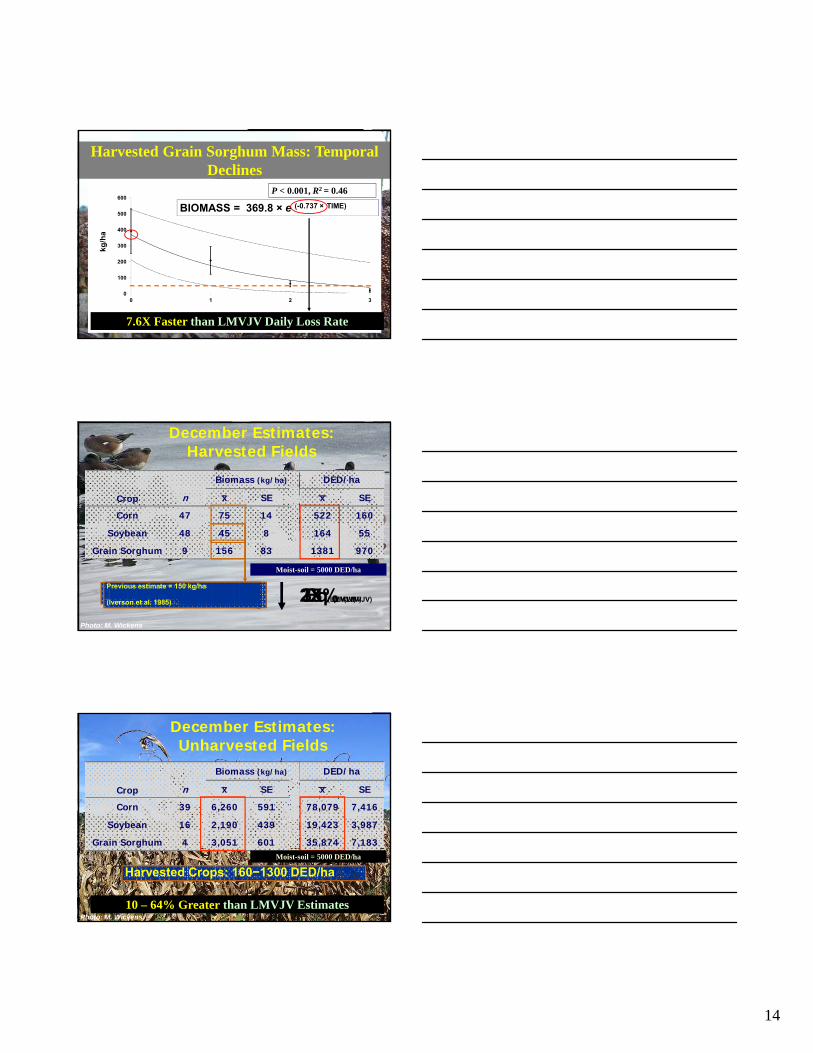
Harvested Grain Sorghum Mass: Temporal Declines
P < 0.001, R2 = 0.46
BIOMASS = 369.8 × e (-0.737 × TIME)
7.6X Faster than LMVJV Daily Loss Rate
2-3 mo PH
December Estimates: Harvested Fields
Crop
Biomass (kg/ha) DED/ha
n x SE x SE
Corn 47 75 14 522 160
Soybean 48 45 8 164 55
Grain Sorghum 9 156 83 1381 970
Photo: M. Wickens
Previous estimate = 150 kg/ha
(Krapu 2004)
Previous estimate = 60 kg/ha
(Mayeaux et al. 1980)
Previous estimate = 150 kg/ha
(Iverson et al. 1985) 2X (LMVJV)33% (LMVJV)Eq (LMVJV)
Moist-soil = 5000 DED/ha
December Estimates: Unharvested Fields
Crop
Biomass (kg/ha) DED/ha
n x SE x SE
Corn 39 6,260 591 78,079 7,416
Soybean 16 2,190 439 19,423 3,987
Grain Sorghum 4 3,051 601 35,874 7,183
Photo: M. Wickens
Harvested Crops: 160−1300 DED/ha
10 – 64% Greater than LMVJV Estimates
Moist-soil = 5000 DED/ha

15
Part II: QUANTIFYING SEED FATE
In harvested fields, there is
less available seed and it is
disappearingquickly.
What is happening to it?
Total Depredation(Harvest – January)
0
10
20
30
40
50
60
70
80
2006 2007
BB
A
A
AA*
*
0
10
20
30
40
50
60
70
80
2006 2007
BB
A
A
AA*
*
0
10
20
30
40
50
60
70
80
2006 2007
BB
A
A
AA
0
10
20
30
40
50
60
70
80
2006 2007
BB
A
A
AA*
*
Corn Soybean Grain SorghumCorn Soybean Grain Sorghum
Per
cent
Total Decomposition(Harvest – January)
Per
cent
0
10
20
30
40
50
60
70
80
2006 2007
B
A
AB
A
A
B *
*
Per
cent
0
10
20
30
40
50
60
70
80
2006 2007
B
A
AB
A
A
B *
*
0
10
20
30
40
50
60
70
80
2006 2007
B
A
AB
A
A
B
0
10
20
30
40
50
60
70
80
2006 2007
B
A
AB
A
A
B
0
10
20
30
40
50
60
70
80
2006 2007
B
A
AB
A
A
B *
*
Corn Soybean Grain SorghumCorn Soybean Grain Sorghum

16
Total Germination(Harvest – January)
0
10
20
30
40
50
60
70
80
2006 2007
A
A
A
A
B
AB
*
*▲
▲
Corn Soybean Grain Sorghum
0
10
20
30
40
50
60
70
80
2006 2007
A
A
A
A
B
AB
*
*▲
▲
0
10
20
30
40
50
60
70
80
2006 2007
A
A
A
A
B
AB
0
10
20
30
40
50
60
70
80
2006 2007
A
A
A
A
B
AB
0
10
20
30
40
50
60
70
80
2006 2007
A
A
A
A
B
AB
*
*▲
▲
Corn Soybean Grain Sorghum
Pe
rce
nt
- Corn was depredated- Grain sorghum & soybean decomposed
What have we learned?
1. Less food than we thought…
2. How do we mitigate decreased quality of foraging habitats?
Management
1. Moist-soil
2. Croplands
3. Complexes

17
Management of Moist-soil Wetlands for Waterfowl
Matthew J. Gray
University of Tennessee
Photo by: R. M. Kaminski
Moist-soil Management Unit
Moist-soil Management Complex
A location of moist-soil management, often surrounded by levees (impoundments)
A group of interconnected moist-soil impoundments that can be managed independently
<40 ha, 100 ac
Hydrologic Management(Fredrickson and Taylor 1982)
Spring Drawdown:
Irrigation:
Winter Flooding:
•Flooded shallowly (e.g., <10 cm)
•Offset drought
•Flood slow (2-4 weeks) & Sequential
•Flood shallow (e.g., 10-20 cm)
Duration Date
•Fast (2-3 days)
•Slow (2-3 weeks)
•Early (April)
•Late (July)
Plant Diversity and Foods Annuals & Breeding
Eco. Trap
2-3 Weeks
Sept.
Multiple Combinations
Good!

18
Hydrologic ManagementDrawdown
Hydrologic ManagementGrowth & Irrigation
Hydrologic ManagementVegetation Responses
EarlyEarly–Mid
Late

19
Hydrologic ManagementFall Flooding & Bird Response
Waterfowl Foods in Moist-soil Wetlands
Invertebrates
Tubers
Seed
Hydrologic ManagementWater Control Structures
Screw Gate
Drop-boardFlap Gate
“Tongue-and-Groove”

20
Hydrologic ManagementMoving Water
Gravity (reservoirs, rivers)
Towable PTO-Pumps
Diesel or PTO-Pumps & Wells
Electric Pump & WellsCrisafulli® & Gator®
Cheapest!
www.gator-pump.comwww.crisafulli.com
Evaluating Vegetative Quality and Waterfowl Use on Active and
Reduced Management Regimes in Moist-soil Wetlands on WRP lands in
Mississippi
Active management with late draw-down (early summer)
+ duck response
+ vegetation response compared to Active
Hydrologic Management – Case Study 1
Crayfish Harvest Potential and Ecosystem Services in
in Managed Moist-soil Wetlands
Active management with late draw-down (early summer)
+ Crayfish Harvest Potential (1 - 7.7 kg/ha/day)
+ water quality benefits
+ wildlife habitat
Hydrologic Management – Case Study 1

21
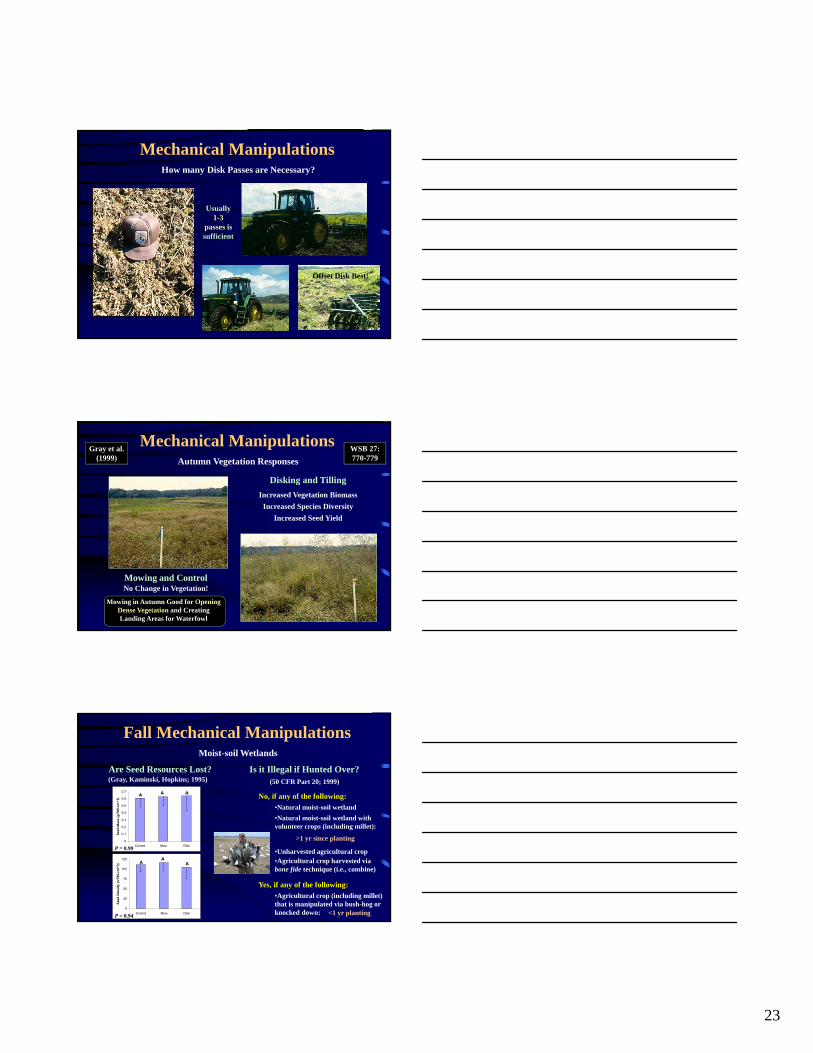
Mechanical Manipulations of Moist-soil Wetlands
(Fredrickson and Taylor 1982; Gray et al. 1999)
Spring Manipulations: (Historically: Northerly Approach)
Autumn Manipulations: (SE Approach)
(Disking, Tilling, Scraping or Mowing)
•Immediately after Early Spring Drawdown
•As soon as possible after Early or Late Drawdowns
Primary Goal: Set back Succession 2-3 Years
Heavy Precipitation, Breeding Waterfowl
•Long growing season and climate conditions can produce dense and continuous stands of hydrophytes
Delays
Secondary Goal: Waterfowl Access
Disking is Best!
(Rotation)
Fall Moist-soil Management
Natural Manipulations of Moist-soil Wetlands
Burning:
Grazing: (similar to mowing)
•Release Nutrients
•Increase Nutritive Quality
•Increase Plant H’
•Increase Aquatic Invert Biomass
Structural; Aquatic Invertebrates
(Use w/ Disking to set back succession)
(Early Succession)
Use Cattle to Open Dense Vegetation
Follow by Disking
(Coastal Wetlands)

22
Natural Manipulations of Moist-soil Wetlands
Rockefeller State Refuge
Other Manipulations of Moist-soil Wetlands
Herbicide Application
Agriculture
•Nuisance Plants
•2,4-D, Renovate 3: Broad-leaved
Sesbania, Xanthium
•Ag. Var. Hydrophytes
•Higher Elevations
•Mid-June•40 kg/ha; $150/ha
Japanese Millet
•Glyphosate (Rodeo): Non-selective
Release Grasses!
•Habitat (Imazapyr): Invasive Exotics
$
Why Forego Mechanical Manipulations until Autumn?
3 Primary Reasons
23
Mechanical ManipulationsHow many Disk Passes are Necessary?
Usually 1-3
passes is sufficient
Offset Disk Best!
Mechanical ManipulationsAutumn Vegetation Responses
Disking and Tilling
Increased Vegetation Biomass
Increased Species Diversity
Increased Seed Yield
Mowing and ControlNo Change in Vegetation!
Mowing in Autumn Good for Opening Dense Vegetation and Creating Landing Areas for Waterfowl
Gray et al. (1999)
WSB 27: 770-779
Fall Mechanical Manipulations
Are Seed Resources Lost? Is it Illegal if Hunted Over?(Gray, Kaminski, Hopkins; 1995) (50 CFR Part 20; 1999)
Moist-soil Wetlands
No, if any of the following:
•Natural moist-soil wetland
•Unharvested agricultural crop•Agricultural crop harvested via bone fide technique (i.e., combine)
Yes, if any of the following:
•Agricultural crop (including millet) that is manipulated via bush-hog or knocked down:
•Natural moist-soil wetland with volunteer crops (including millet):
>1 yr since planting
<1 yr planting
0
0.1
0.2
0.3
0.4
0.5
0.6
0.7
Control Mow Disk
See
d M
ass
(g/7
85-c
m^
3)
A A A
0
25
50
75
100
125
Control Mow Disk
See
d D
ensi
ty (
n/7
85-c
m^
3)
AA
A
P = 0.94
P = 0.99

24
Mechanical ManipulationsHemi-marsh Configuration
Hemi-marsh Concept
An approximate equal area of water and vegetation is ideal!
Greatest Abundance and Richness of Waterbirds
are Attracted
50:50 Ratio
Smith et al. (2004)
Aquatic Invertebrate
Biomass Greatest
Kaminski and Prince (1981)
WSB 32:474-480
Replication on Wintering Grounds
Weller (1970)
The Hemi-marsh
Mechanical Management of M.S. Vegetation

25
Tennessee
Control
Disk
MowBuffers
26
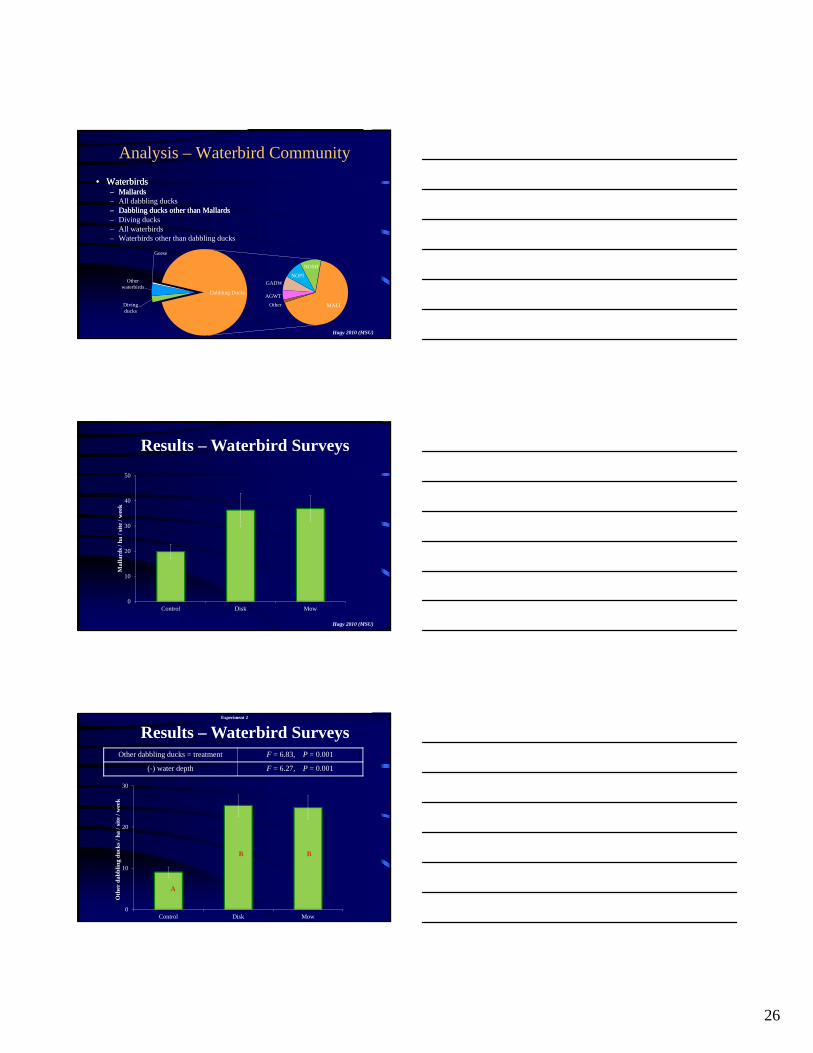
Analysis – Waterbird Community
• Waterbirds– Mallards– All dabbling ducks– Dabbling ducks other than Mallards– Diving ducks– All waterbirds– Waterbirds other than dabbling ducks
Diving ducks
Other waterbirds
Geese
AGWT
GADWNOPI
NOSH
MALLOther
Dabbling Ducks
• Waterbirds– Mallards
– Dabbling ducks other than Mallards
Hagy 2010 (MSU)
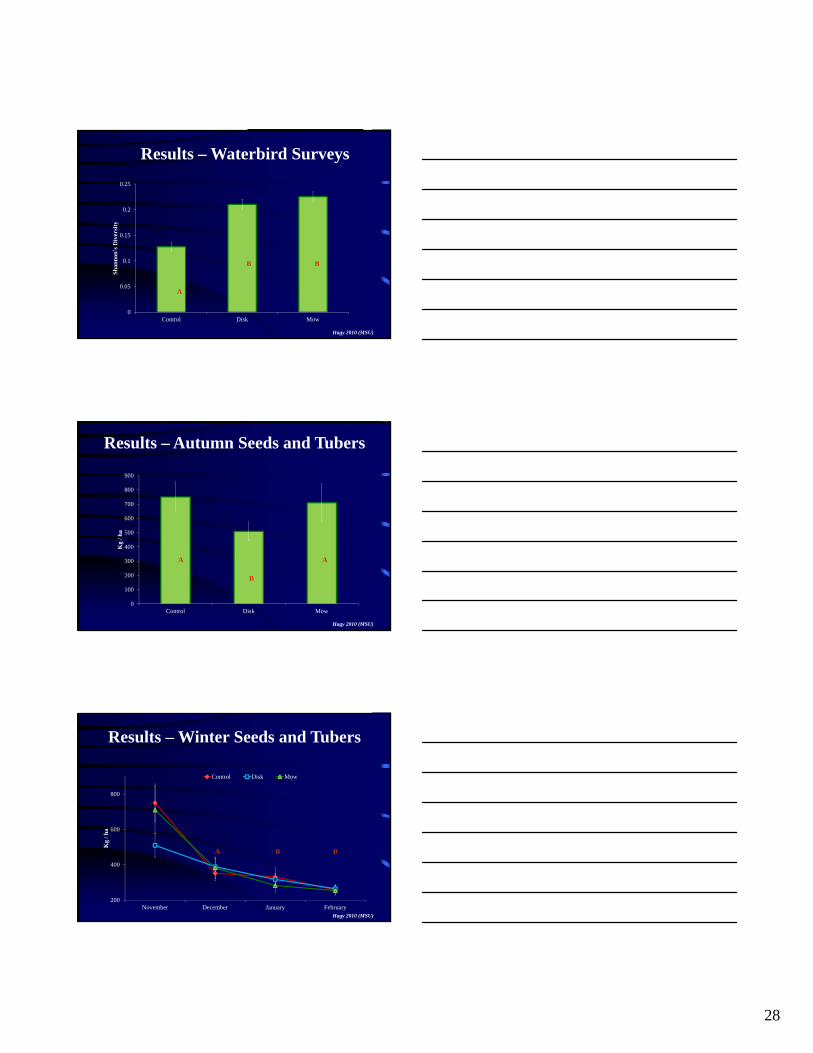
Results – Waterbird Surveys
0
10
20
30
40
50
Control Disk Mow
Mal
lard
s / h
a / s
ite
/ wee
k
Hagy 2010 (MSU)
Results – Waterbird SurveysOther dabbling ducks = treatment F = 6.83, P = 0.001
(-) water depth F = 6.27, P = 0.001
0
10
20
30
Control Disk Mow
Oth
er d
abbl
ing
duck
s / h
a / s
ite
/ wee
k
A
B B
Experiment 2

27
Results – Waterbird Surveys
0
10
20
30
40
50
60
1 2 3 4 5 6 7 8 9 10 11 12 13 14 15 16
November December January February
Pro
por
tion
Dab
bli
ng
Duc
ks /
ha /
site
Mow
Hagy 2010 (MSU)
Results – Waterbird Surveys
0
10
20
30
40
50
60
1 2 3 4 5 6 7 8 9 10 11 12 13 14 15 16
November December January February
Pro
por
tion
Dab
bli
ng
Duc
ks /
ha /
site
Disk Mow
Hagy 2010 (MSU)
Results – Waterbird Surveys
0
10
20
30
40
50
60
1 2 3 4 5 6 7 8 9 10 11 12 13 14 15 16
November December January February
Pro
por
tion
Dab
bli
ng
Duc
ks /
ha /
site
Control Disk Mow
Hagy 2010 (MSU)
28
Results – Waterbird Surveys
0
0.05
0.1
0.15
0.2
0.25
Control Disk Mow
Shan
non'
s D
iver
sity
A
BB
Hagy 2010 (MSU)
Results – Autumn Seeds and Tubers
0
100
200
300
400
500
600
700
800
900
Control Disk Mow
Kg
/ ha
A A
B
Hagy 2010 (MSU)
Results – Winter Seeds and Tubers
200
400
600
800
November December January February
Kg
/ ha
Control Disk Mow
A B B
Hagy 2010 (MSU)

29
Results – Invertebrates
0
1
2
3
November December January February
Kg
/ ha
Control Disk Mow
B
A
B
Hagy 2010 (MSU)
Fall mowed and disked moist-soil vegetation
0
10
20
30
40
50
60
70
0
100
200
300
400
500
600
700
800
900
Control Disk Mow
Du
cks
/ ha
Kg
/ h
a F
oo
ds
1. Surveyed food-use literature to identify taxa commonly consumed by dabbling ducks
2. Compared:i. observed seed abundances (core
sample estimates) ii. predicted seed abundances
(calculated using decomposition rates and November abundances)
3. Estimated effects of removing taxa not identified as “duck food”
Seed and Tuber Use

30
20
40
60
80
100
Initial December January February
Per
cent
Rem
aini
ng
Predicted Observed
60
80
100
120
Initial December January February
Per
cent
Rem
aini
ng
Seed and Tuber Use
Summary• Partial fall mowing
+ seeds and tubers
+ dabbling duck abundance and diversity
+ invertebrate abundance and diversity
• Shallow flooding (<16 cm)
• Similar winter seed and tuber abundances among treatments (260 kg/ha)
• Ducks don’t eat everything!
• Moist-soil wetlands must be managed to maximize food availability

31
Winter Cropland Management • Flooding
• Stubble manipulation
• Supplemental seeding
• Moist-soil borders and
patches
• Grassy crop remnants
• RatooningManley et al. 2005; 2009
Winter Flooding Benefits
• Food for waterfowl
• Decomposes crop residues
• Reduces winter weeds
• Reduces herbicide use in spring ($25-30/acre)
• Replenishes ground water
• Improves water quality
• Prevents soil loss
• Waterfowl hunting and wildlife watchingManley et al. 2005; 2009
Provided by Scott Manley

32
Agricultural Management
Provided by Scott Manley
Provided by Scott Manley
Provided by Scott Manley
Disk / Open
No-till / Flood
No-till / Open
Disk / Flood

33
Agricultural Management
Provided by Scott Manley
Dirty Corn
Agriculture Management
Green Browse
Corn + Moist-soil
Geese!
Crops Should be in Close Proximity to Natural
Wetlands!!
Thus, birds can acquire high energy ag grains without
flying long distances.
(Energy, Harvest Probability) Winter Wheat
Agricultural Management
Hagy et al. 2011 (SEAFWA)
Grassy Corn

34
Agriculture Management
Flooded Corn
Rice
Milo, soybeans, browntop millet, and common buckwheat (Fagopyrum esculentum)
Other Common Agricultural FoodsFlood
Shallowly
Hunting Agriculture
Harvested Fields
Flooded Fields
Agriculture Management
Moist-soil seeds decompose more slowly and retain their nutritional quality longer
than agricultural grains.
42–86%Decomposition
2–21%Decomposition
Moist-soil Seed
Ag Seed90 Days
Nealy (1956)Why not
Agriculture Only??
35
0
100
200
300
400
500
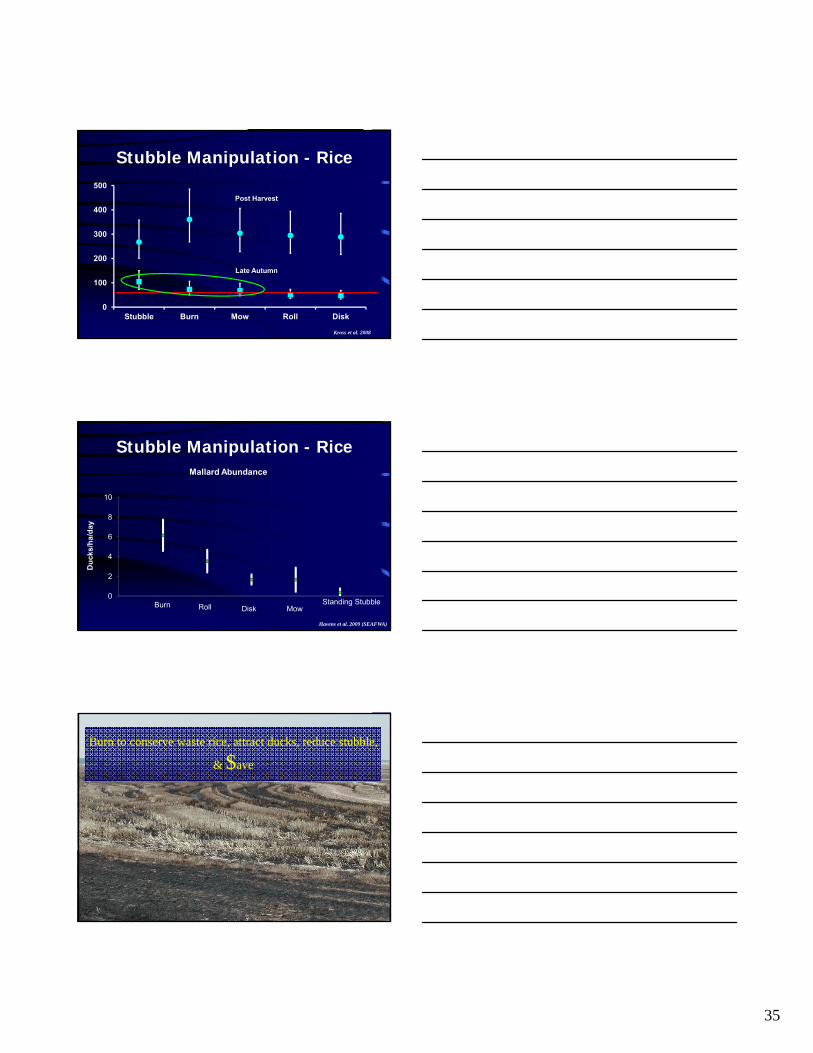
Stubble Burn Mow Roll Disk
Stubble Manipulation - Rice
Post Harvest
Late Autumn
Kross et al. 2008
Burn Roll Disk MowStanding Stubble
0
2
4
6
8
10
Du
cks/
ha/
day
Mallard Abundance
Stubble Manipulation - Rice
Havens et al. 2009 (SEAFWA)
Burn to conserve waste rice, attract ducks, reduce stubble,
& $ave

36
Ratooning?
“Ratoon” Rice for Ducks
Ratoon Rice
0
200
400
600
800
1000
1200
1400
Dry Stubble Rainfall flooding Delayed flooding Post-harvestflooding
Kg
/ h
a
Provided by Ken Reinecke (USGS)

37
Ratoon Milo
Ratoon Milo
0
10
20
30
40
50
60
70
80
Control Mow Crush
Dry
Mas
s (k
g/h
a)
Treatment
B
B
A
Wiseman et al. 2010 (SEAFWA)
Ratoon Milo
0
20
40
60
80
100
120
2006 2007
Dry
Mas
s (k
g/h
a)
Year
Fertilized Non-Fertilized
A
A
A
B
Wiseman et al. 2010 (SEAFWA)

38
Cropping for Ducks
Making Moist-soil “Hot”
– “Dirty” Rice
– “Grassy” Corn
– “Grassy” Milo
“Dirty Rice”
“Grassy Milo”

39
“Grassy Corn”
Moist-soil alone~2,320 DUDs/acre
Unharvested Corn~23,500 DUDs/acre
The Grassy Corn Difference
Field Borders, Patches, or Margins

40
Why all of the Habitats?
Habitat Complexes
Flooded Cropland
Natural Wetlands
Sanctuaries
Mallard Complexes
50% Croplands20% Forest
20% Seasonal Emergent
(‘moist-soil’)
10% PermanentPearse 2007 (MSU)

41
Why manage so intensively?
Little of no duck food in this bottom!Succession
• Pre-human habitat conditions will never be replaced
• Human needs vs. – Water Quality
– Wildlife
– Space
Less space = Better conditions in remaining natural habitat
Wetland Management Summary

42
Wetland Management Summary
• Natural wetlands have been highly altered or drained completely
• Private entities and conservation initiatives have stopped loss, but not replaced historical areas (e.g., WRP, CRP, Hunters, etc.)
• Natural wetlands may not ever be truly replaced– Altered flooding regimes– Timber demand– Cellulosic ethanol– People
Reduced Quantity = Increased Quality To fulfill Wildlife and Waterfowl Annual Cycle Needs
Create Hunting AccessWalk-in Access Ramps Boat Pull-over Sites
Hand or Power Winch