Embed Size (px)
Citation preview

WETLAND DESIGN IN THE PUTAH CREEK PRESERVE
ELLA VERLANDSCAPE ARECHITECTURESENIOR PROJECTUC DAVIS2010


SIGNATURES“WETLAND DESIGN IN THE PUTAH CREEK PRESERVE”A Senior ProjectPresented to the
Landscape Architecture Department ofthe University of California, Davis
in partial fulfillment of the requirementfor the Degree of
Bachelors of Science in Landscape ArchitectureJune 11, 2010
Accepted and Approved by:
_________________________________________________Mark Francis, Faculty, Senior Project Adviser
_________________________________________________Steve Greco, Associate Proffesor, Comittee member
_________________________________________________Eric Larsen, Associate Researcher, Comittee member
_________________________________________________Andrew Fulks, Putah Creek Manager, Comittee member

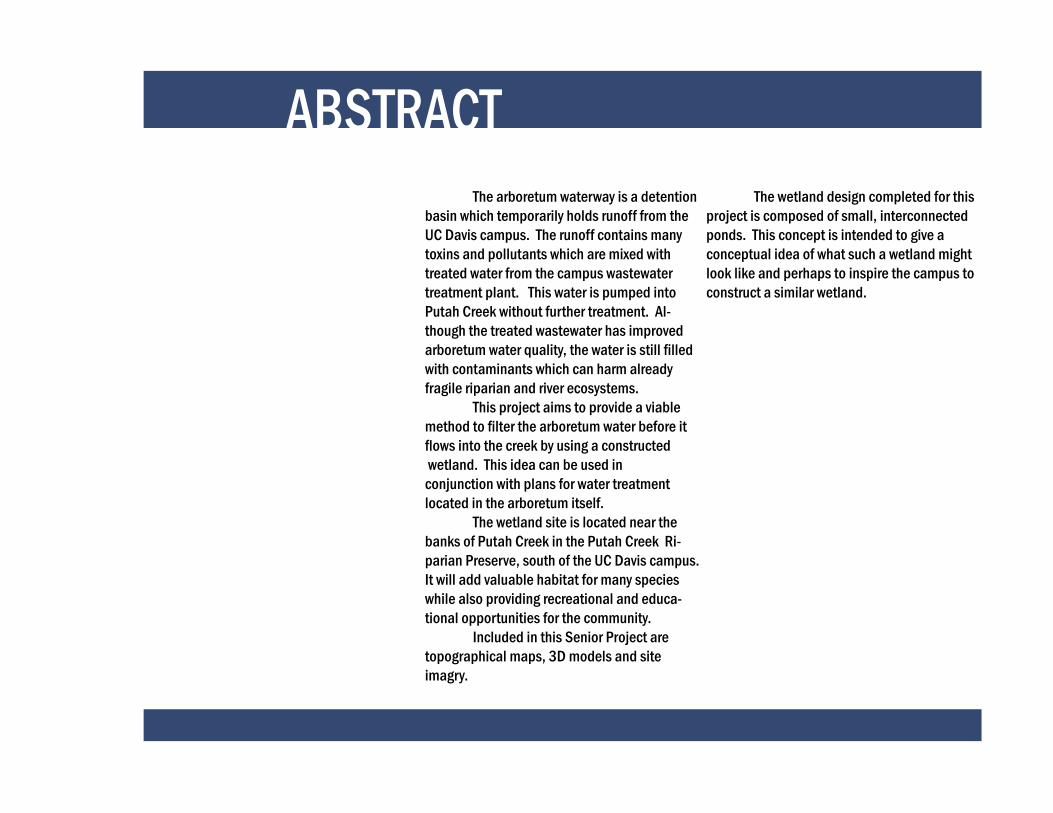
ABSTRACT The arboretum waterway is a detention basin which temporarily holds runoff from the UC Davis campus. The runoff contains many toxins and pollutants which are mixed with treated water from the campus wastewater treatment plant. This water is pumped into Putah Creek without further treatment. Al-though the treated wastewater has improved arboretum water quality, the water is still filled with contaminants which can harm already fragile riparian and river ecosystems. This project aims to provide a viable method to filter the arboretum water before it flows into the creek by using a constructed wetland. This idea can be used in conjunction with plans for water treatment located in the arboretum itself. The wetland site is located near the banks of Putah Creek in the Putah Creek Ri-parian Preserve, south of the UC Davis campus. It will add valuable habitat for many species while also providing recreational and educa-tional opportunities for the community. Included in this Senior Project are topographical maps, 3D models and site imagry.
The wetland design completed for this project is composed of small, interconnected ponds. This concept is intended to give a conceptual idea of what such a wetland might look like and perhaps to inspire the campus to construct a similar wetland.


ACKNOWLEDGEMENTS
i
I would like to thank members of
my committee Steve Greco, Eric Larsen, and
Andrew Fulks for helping me during the course
of producing this project. I acknowledge
Professor Steve Greco for bringing up the idea
of constructing a wetland in the Putah Creek
Riparian Preserve and for showing me how to
build models in GIS. I would like to thank Eric
Larsen for helping me along the way, especially
with water quality and editing. Thank you to
Andrew Fulks for his extensive knowledge on
the happenings in the Preserve and for help
with wetland layout and flow. Thank you to
everyone not on my committee who contributed
to this project, especially to David Phillips, for
answering all of my questions.
Thank you to my family for supporting
me during the past four years at UC Davis and
to my classmates who created a strong support
base for each other during the duration of the
Landscape Architecture program at UC Davis.

TABLE OF CONTENTSTopic
ii
Page Number
Introduction viiRelationship of Arboretum and Putah Creek 1The Arboretum Waterway 2
What is it? 2Water Improvement Projects 3 Flow Out of the Waterway 4Water Quality 5
Putah Creek 12Background 12The Monticello Dam 14Habitat 15
Constructed Wetlands 20Benefits 20Efficiency 22Design and Construction Guidlines 23Habitats 26

TABLE OF CONTENTS
iii
Topic Page Number
Site Analysis 29Context 30Site Descriptions 35Opportunities and Constraints 41Soils and Water 45
Design 46Intent 46Process 47Explanation 49Model 54Volume 58Planting 59Human Interaction 60
Conclusion 61Bibliography 62
LIST OF FIGURESILLUSTRATIONS, MAPS AND PHOTOS
iv
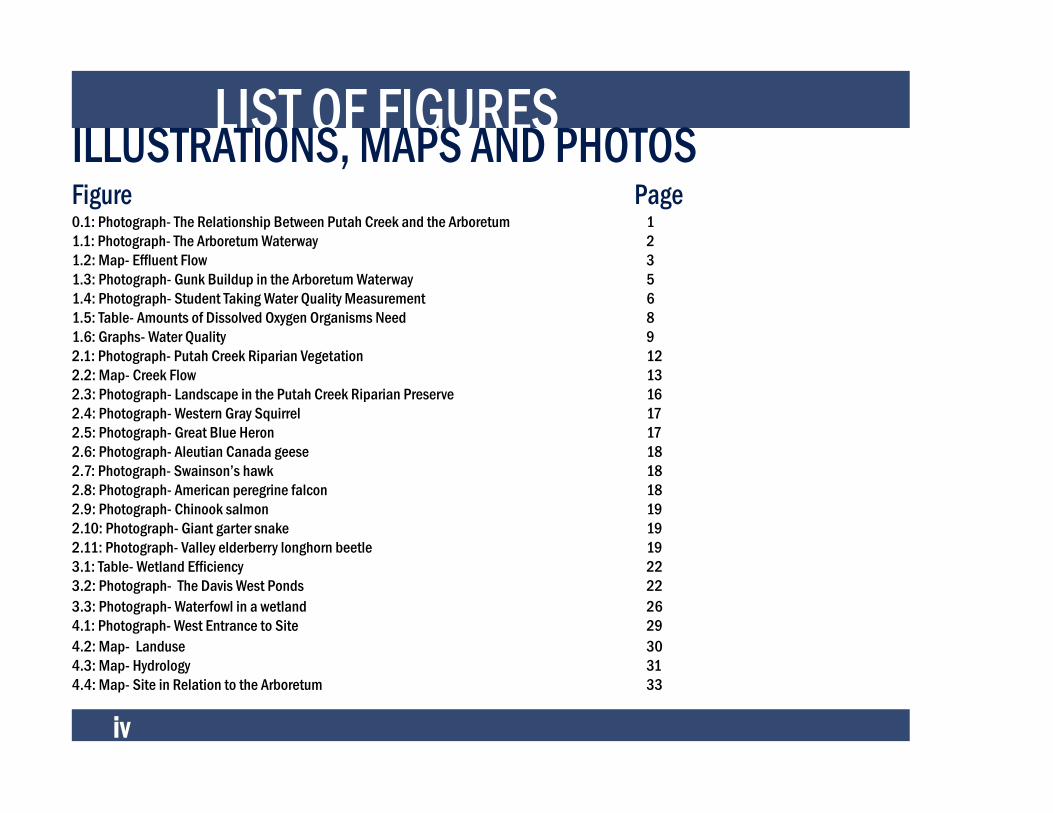
Figure0.1: Photograph- The Relationship Between Putah Creek and the Arboretum 1 1.1: Photograph- The Arboretum Waterway 21.2: Map- Effluent Flow 31.3: Photograph- Gunk Buildup in the Arboretum Waterway 51.4: Photograph- Student Taking Water Quality Measurement 61.5: Table- Amounts of Dissolved Oxygen Organisms Need 81.6: Graphs- Water Quality 92.1: Photograph- Putah Creek Riparian Vegetation 122.2: Map- Creek Flow 132.3: Photograph- Landscape in the Putah Creek Riparian Preserve 162.4: Photograph- Western Gray Squirrel 172.5: Photograph- Great Blue Heron 172.6: Photograph- Aleutian Canada geese 182.7: Photograph- Swainson’s hawk 182.8: Photograph- American peregrine falcon 182.9: Photograph- Chinook salmon 192.10: Photograph- Giant garter snake 192.11: Photograph- Valley elderberry longhorn beetle 193.1: Table- Wetland Efficiency 223.2: Photograph- The Davis West Ponds 223.3: Photograph- Waterfowl in a wetland 26 4.1: Photograph- West Entrance to Site 294.2: Map- Landuse 30 4.3: Map- Hydrology 314.4: Map- Site in Relation to the Arboretum 33
Page

LIST OF FIGURES
v
Figure4.5: Map- Site Close-up 344.6: Photograph- The west entrance 354.7: Photograph- Outflow pipe into Putah Creek 364.8: Photograph- Check Gate Valve 364.9: Photograph- Visitor walking on path 374.10: Photograph- Potential site for wetland construction 374.11: Photograph- Graffiti under the railroad bridge 384.12: Photograph- Native grasses area 394.13: Photograph- Bird box 394.14: Photograph- Putah Creek 404.15: Map- Opportunities and Constraints 414.16: Map- Soils 445.1: Map- Master Plan 485.2: Map- Grading Plan 50 5.3: Image- Section 1 515.4: Image- Section 2 515.5: Diagram- Flow 52 5.6: Model- View 1 545.7: Model- View 2 545.8: Model- View 3 555.9: Model- View 4 555.10: Image- Perspective 1 565.11: Image- Perspective 2 575.12: Table- Water Detention Time 585.13: Photograph- Viewing platform 60
Page

vi

INTRODUCTIONWETLAND CONSTRUCTION IN THE PUTAH CREEK PRESERVE
vii
This project is about solving an im-
portant problem. The problem is Arboretum
Waterway water being pumped into Putah
Creek without much prior treatment. The
waterway acts as a detention basin for run-
off from central campus. The water contains
some substances which can harm wildlife and
ecosystems in Putah Creek, along Putah Creek,
and ultimately in the ocean. As a university,
it is our responsibility to lead the way when it
comes to sustainability and social stewardship.
This issue provides a perfect opportunity for the
university to do just that.
One solution to this problem is to build
a wetland to filter the arboretum water. By
building a wetland in the Putah Creek Riparian
Preserve, UC Davis can drastically improve the
quality of the water coming into the creek. The
site selected for this wetland is a site which
sits near the banks of Putah Creek, just south
of the UC campus.
The wetland can not only improve
water quality, but also habitat quality in the
preserve. Its existence will take some stress
away from the already severely altered Putah
Creek. It is a viable solution to an issue the
university has been dealing with for a long time.
It can be built on its own, or in conjunction with
water quality improvement plans taking place
in the Arboretum Waterway itself.


1
RELATIONSHIPPUTAH CREEK TO THE ARBORETUM WATERWAYThe Arboretum waterway and Putah Creek were once one
and the same.
Before the University’s establishment, the Arboretum
Waterway was a flowing portion of Putah Creek. In the late 19th
century, engineers diverted the creek to a southern route, and the
remnant patch became the Arboretum Waterway. Originally, this
isolated portion of Putah Creek flowed eastwards, but now it flows
westwards due to dredging and grading. The storm water flows
west, through a weir, into a pipeline, and then into the South Fork of
Putah Creek (UC Davis Office of Resource Management and Plan-
ning, 2006).
Figure 0.1: The Relationship between Putah Creek and the Arbore-
Old North Fork
Arboretum Waterway
Putah Creek

2
THE ARBORETUM WATERWAYWHAT IS IT?
The Arboretum and its waterway
are a integral part of the UC Davis cam-
pus. Students, faculty, and community
members frequent the arboretum to enjoy
its variable plant collections and to lounge
on the grass bordering the waterway.
Volunteers help staff maintain the
vegetation and propagate it. At the center
of the Arboretum lies the waterway. Its
water is murky, yet nonetheless, populat-
ed by animals such as ducks, geese, fish,
and turtles.
The arboretum waterway is named
as such because it is not quite a lake and
not quite a river; it is a water detention
basin. It temporarily holds all the water
that runs off of the central UC Davis campus.
This is nutrient filled water contain-
ing all sorts of chemicals, pollutants, and
garbage. The feces from animals inhabiting
the arboretum adds to its putrid state and
during the summer, algae blooms color the
surface of the water a bright green hue. Even
though the arboretum waterway flow seems
stagnant, grading and pumping allows the
water to flow westwards. Once it reaches a
weir, the water flows into a pipe and directly
into the local section of Putah Creek.
Figure 1.1: Arboretum Waterway. Source: http://www.onegate.com/go/og/blog/7-reasons-to-live-in-davis-ca/>

THE ARBORETUM WATERWAYWATER IMPROVEMENT PROJECT Wastewater Treatment Plant
3
In 2006, the campus decided to improve the water quality situation
by pumping water into the arboretum from the campus Waste Water
Treatment plant. The treated waste water improves water quality by
keeping the water flowing year long. Before 2006, the water would
remain stagnant during the summer. This project involves divert-
ing the water into the east end of the Arboretum waterway using a
previously abandoned 18” pipeline. Occasionally, the waste water is
pumped directly into Putah Creek, so, nearly all of the campus waste
water flows into the arboretum waterway (David Phillips, 2010)
Through grading and pumping, the water flows west through
the arboretum, through a weir, then into a pump station which takes it
into Putah Creek (UCD Office of Resource Management and Planning,
2006).
Map illustrates pathway water takes before reaching Putah Creek.Source: David Phillips, Director of UC Davis Campus Facilities, 2010
Figure 1.2: Effluent Flow Map

4
THE ARBORETUM WATERWAYFLOW IN AND OUT OF THE WATERWAY
According to a graph from David Phil-
lips, Director of Facilities on campus, the mean
daily flow of water from the WWTP into the
arboretum is 1.5734 million gallons a day.
Unfortunately, when inquiring how
much water is pumped from the arboretum
waterway into Putah Creek, David Philips
informed me that the campus has just recently
installed meters to gauge flow in Putah Creek.
So, no information is available yet.
I found this to be surprising, especially
because the improvements project has been in
place since 2006. What prompted campus to
wait so long before finally installing measure-
ment devices?

THE ARBORETUM WATERWAYWATER QUALITYTypical Contents of Runoff
5
Stormwater runoff from the urban en-
vironment contains many substances harmful
to humans and to wildlife. As this water flows
over the constructed landscape it picks up a
variety of contaminants.
One major contaminant in storm water
is sediment from land uses such as construc-
tion. Sediment clouds the water and makes it
difficult for plants to grow. Another major issue
is excess nutrients from fertilizers used on
lawns and landscaping vegetation. When the
nutrients from fertilizers reach streams, they
cause an increase in algae growth. When the
algae dies, bacteira that consume it deplete
the dissolved oxygen in the water which may
cause major fish kills.
Bacteria and other pathogens from
sources such as pet feces are another major
problem, these are a health concern and can
cause beach closures. Household hazardous
wastes also end up in the storm water. This
includes pesticides, cleaning solutions, paint-
ing solvents, motor oil, and other motor fluids.
When these hazardous wastes end up in the
water, they can poison the wildlife and con-
taminate drinking water.
Debris from the streets also ends up
in the storm water. This includes used paper
cups, plastic bags, six pack rings, etc. These
are not only unsightly, but wildlife can also
choke, suffocate, or become disabled by them
Figure 1.3: Gunk building up in the West end of the waterway.

6
THE ARBORETUM WATERWAYWATER QUALITYWater Monitoring in the Arboretum Over several years, a geology class
taught at UC Davis has been working on the
Putah Creek Project. As part of this project,
the classes have been monitoring water quality
in the waterway and analyzing the waterway's
function as a system. The campus uses data
collected to asses water quality. Although this
project does not monitor levels of toxic chemi-
cals, it does monitor levels of dissolved oxygen
in the water. This is a useful indicator because
it is effected by pollution and is instrumental
for the survival of the aquatic organisms.
What is Dissolved Oxygen?
Many natural sources of dissolved
oxygen in the water exist. Oxygen in the atmo-
sphere exists in much higher levels (approxi-
mately 21 percent oxygen) than oxygen in
water (Less than 1 percent).
So, on the surface of the lake, where
air and water meet, the difference in levels
is so large that oxygen molecules from the
atmosphere dissolve into the water. More oxy-
gen dissolves into the water when the water
is turbulent because this increases surface
area for the oxygen to dissolve into (Water on
the Web, 2010).
Figure 1.4: Student taking water quality measurementsSource: Putah Creek Project, 2008 < https://www.geol-ogy.ucdavis.edu/~pcp/photos/index.html >

THE ARBORETUM WATERWAYWATER QUALITY
7
Photosynthesis by aquatic plants and
algae also produces dissolved oxygen. Water
temperature also affects dissolved oxygen
levels in water. Cold water can hold more
gasses than warm water. If the temperature
is high enough, fish may not be able to survive
in water even if it is 100 percent saturated.
(Water on the Web, 2010)
Fish and other aquatic animals
depend on oxygen to breath, as water passes
through their gills, oxygen passes through
and dissolves into their bloodstream. This
process is very efficient, but only if dissolved
oxygen content concentrations in the water
are above a certain content. So, dissolved
oxygen can be present in the water, even
though organisms cannot process it. Oxygen
is also needed by algae, Macrophytes, and
several chemical reactions (Water on the
Web, 2010).
In the Arboretum and other water
bodies, seasonal changes also influence dis-
solved oxygen levels. Warmer temperatures
during the summer months speed up the rate
of photosynthesis and decomposition. When
plants die at the end of the growing season
and decompose, bacteira which consumes
them takes up large amounts of oxygen which
during some years, even causes fish kills in
the arboretum.
Pollution impacts on Dissolved Oxygen
Pollution contributes some nutrients
that demand oxygen (lawn clippings and
sewage), and some nutrients that stimulate
growth of organic matter (Such as fertilizer).
Overall, pollution reduces dissolved oxygen
concentrations in the water. If the organic
matter, such as algae, is formed in the lake,
than some oxygen is produced to offset the
loss of oxygen from consumption of algae by
bacteria. However, in lakes where much of
the organic matter is brought in, oxygen pro-
duction and consumption are not balanced.
Anoxia (lacking dissolved oxygen)
occurs in some lakes during the summer.
8
THE ARBORETUM WATERWAYWATER QUALITY
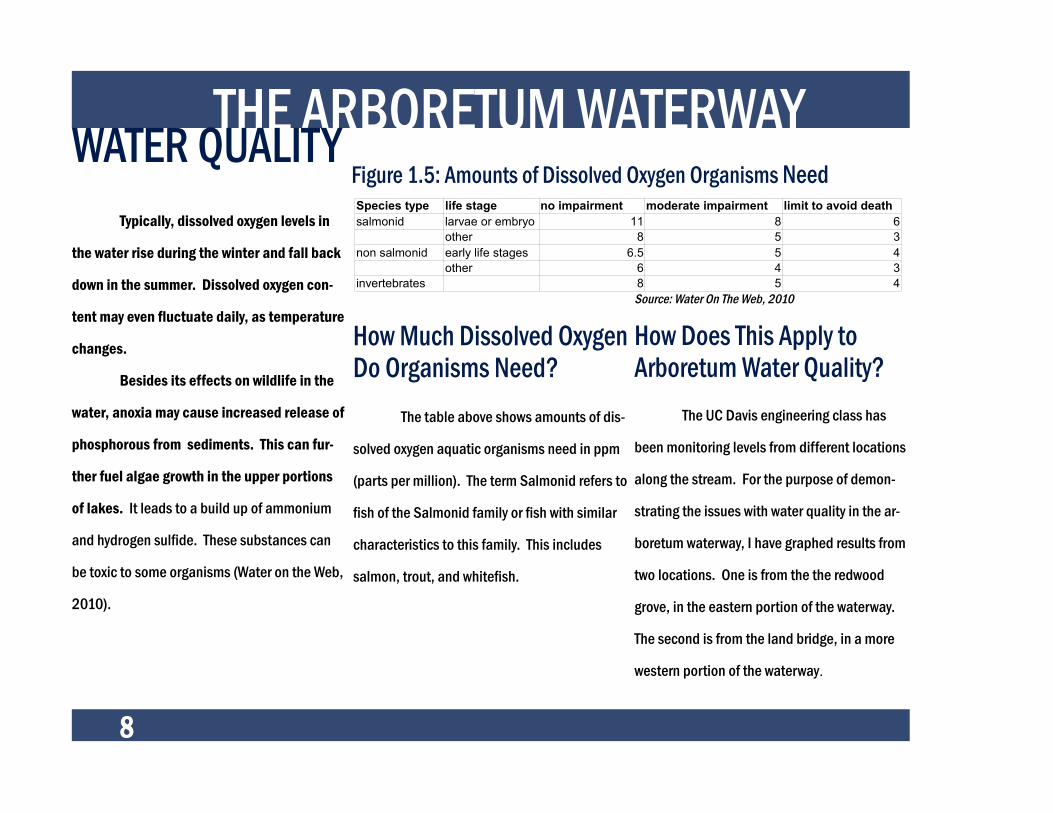
The table above shows amounts of dis-
solved oxygen aquatic organisms need in ppm
(parts per million). The term Salmonid refers to
fish of the Salmonid family or fish with similar
characteristics to this family. This includes
salmon, trout, and whitefish.
Typically, dissolved oxygen levels in
the water rise during the winter and fall back
down in the summer. Dissolved oxygen con-
tent may even fluctuate daily, as temperature
changes.
Besides its effects on wildlife in the
water, anoxia may cause increased release of
phosphorous from sediments. This can fur-
ther fuel algae growth in the upper portions
of lakes. It leads to a build up of ammonium
and hydrogen sulfide. These substances can
be toxic to some organisms (Water on the Web,
2010).
How Much Dissolved Oxygen Do Organisms Need?
������
�����
����������� ���������� �������������� ������������������� ��������������������
�������������� �� � �
����� � � �
��������������� ��� � �
����� � � �
������������� � � �
��������
�����������
Source: Water On The Web, 2010
How Does This Apply to Arboretum Water Quality?
The UC Davis engineering class has
been monitoring levels from different locations
along the stream. For the purpose of demon-
strating the issues with water quality in the ar-
boretum waterway, I have graphed results from
two locations. One is from the the redwood
grove, in the eastern portion of the waterway.
The second is from the land bridge, in a more
western portion of the waterway.
Figure 1.5: Amounts of Dissolved Oxygen Organisms Need
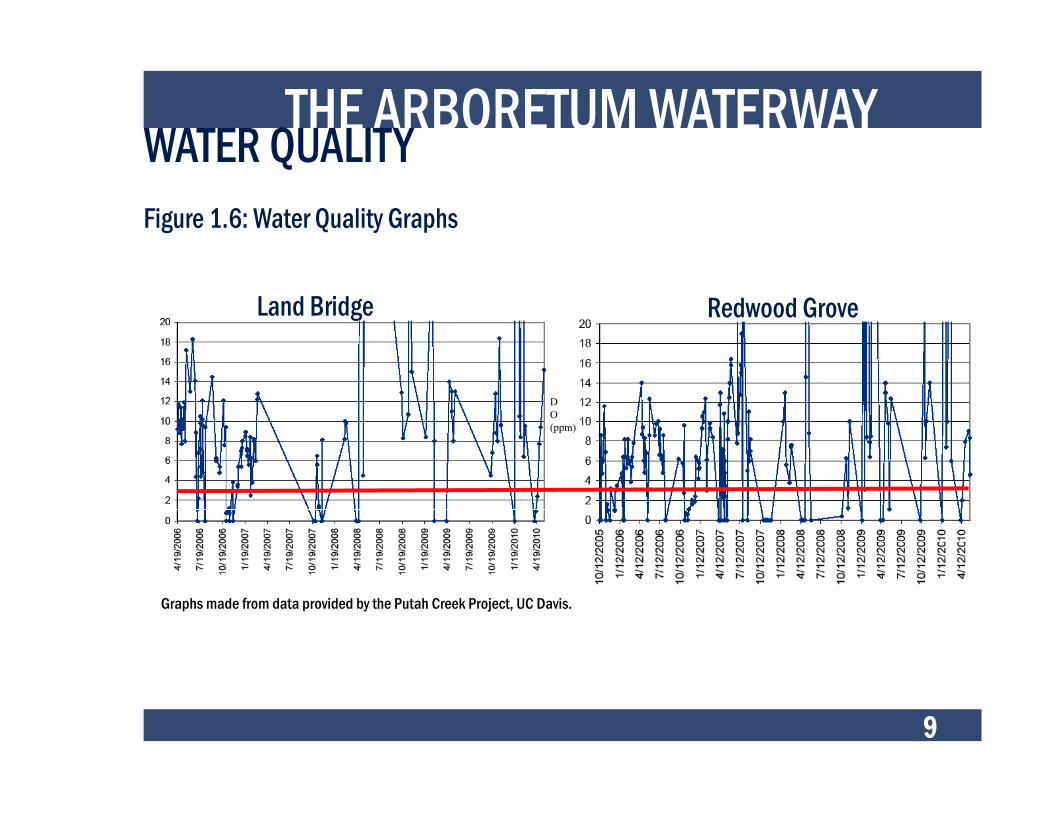
THE ARBORETUM WATERWAYWATER QUALITYFigure 1.6: Water Quality Graphs
9
Land Bridge Redwood Grove
DO(ppm)
Graphs made from data provided by the Putah Creek Project, UC Davis.

10
THE ARBORETUM WATERWAYWATER QUALITYGraph Interprentation The red line sits at 3 ppm, which is
the minimum amount of dissolved oxygen
for fishes to remain alive. Every point on the
graphs below this line represents a lethal
situation for wildlife.
The graphs show that levels of dis-
solved oxygen reached very low levels several
times throughout the course of monitoring.
This occurs even after 2006, when water from
the wastewater treatment plant started get-
ting pumped into the arboretum.
Potential Sources of ErrorThe dates on the graph indicate that
measurements were usually taken only once
daily (at most twice). Perhaps the low dis-
solved oxygen levels remained so low for very
short intervals of time. Dissolved oxygen levels
often change throughout the day as wind and
temperature changes.

11

12
PUTAH CREEKBACKGROUNDPutah Creek is the main waterway in
the Davis area. It originates from springs in the
Mayacamas Mountains located northwest of
campus. It flows into lake Berryessa, through
Winters, along the south boundary of the UC
campus, and into the Yolo Bypass. The North
Fork of Putah Creek follows the historic chan-
nel, however, it currently has no natural flow.
Several parts of the North Channel still
contain historic riparian patches. Other parts
are completely drained and used for raising
of sheep and cattle (UCD Office of Resource
Management and Planning, 2006).
Putah Creek is a valuable resource
enjoyed by many of the locals and students.
However, it is also an important resource for
native wildlife, providing valuable remnant
habitats and connective corridors for a variety
of native species including birds, fishes, and
invertebrates.
Human intervention along the creek
and lands surrounding it, have significantly
effected it. The damming of the creek has
changed its structure, while agriculture and
urban development have left portions of the
creek degraded and in need of restoration. In
some portions of the creek, only thin strips of
riparian habitat remain. These are extremely
valuable because only about 5 percent of ripar-
ian forests remain in tact today (Putah Creek
Council, 2008).
Figure 2.1: Putah Creek and riparian vegetation.

PUTAH CREEKFigure 2.2: CREEK FLOW MAP
13
Map shows Putah Creek flow from Lake Berryessa to the Yolo Bypass
Lake Berryessa
Upper Putah Creek
Lower Putah Creek
Yolo Bypass

14
PUTAH CREEKTHE MONTICELLO MONTICELLO DAMPutah Creek is separated into two dis-
tinct sections by the Monticello Dam. The first
section is the upper watershed which consists
of 50 miles of river located above the dam. The
lower Putah Creek is the second section which
flows below the dam and spans 30 miles. The
dam was completed in 1957 as part of the
Solano Project and its existence created the
reservoir called Lake Berryessa. The Solano
project also included the Putah Diversion Dam
and the Putah South Canal.
Dam’s Effects on the Creek The Dam effects Putah Creek structure
in several ways. High floods occur more rarely,
so the creek beds have become more silty. The
dams also prevent gravel from the hills to reach
lower Putah Creek.
Now, the main source of gravel to lower
Putah creek is a tributary called Dry Creek.
During floods, regulated water release from the
dam cause Putah Creek water to flow below the
level of its tributaries. This causes the water
flow from the tributaries to accelerate as it con-
verges with Putah Creek and leads to a faster
than historical flow in Putah Creek. The faster
flow leads to increased erosion and downcut-
ting of streambanks (Putah Creek Council,
2008).
The Dam also blocks and restricts the
passage of many species of fish to the lower
portion of the creek causing species of fish in
the upper portion of Putah Creek to be com-
pletely different from the species of fish found
in the lower portion of the creek. Lower flows
make it easier for invasive species to ground
themselves along the shores.
Many of the invasive species grow in
clumps along the creek. These clumps slow
water flow and cause sediment buildup. In
turn, the water is deflected into steambanks
which causes even more erosion. (Putah Creek
Counil, 2008).

PUTAH CREEKHABITAT
15
Habitat Improvements Habitats in and along the banks of
the creek have been recovering due to several
changes in management of Putah Creek, Lake
Barryessa and the Putah Diversion Dam. In
1979, the California Department of Water
Resources scaled back vegetation clearing in
and along the creek. This increased vegetation
cover, stabilized the creek bed and creating an
overall more natural stream.
In 2000, the signing of the Putah
Creek Accord, ensured a minimal flow to Lower
Putah Creek. It required scheduled seasonal
flows to ensure the passage of migratory fish
such as the Chinook salmon and the steelhead.
The Accord also secured permanent funding to
monitor and restore Putah Creek habitats and
appointed a streamkeeper to watch over the
creek (Putah Creek Council, 2008).

16
PUTAH CREEKHABITATVegetation
Riparian woodlands are amongst the
most valuable habitats in the central valley.
The combination of surface water, ground
water, fertile soils, nutrient availability, and
layered vegetation in the riparian woodland,
provides diverse conditions and habitats that
can support a wide variety of species (US Army
Corps of Engineers, 1996).
The mixed riparian woodland along
Putah Creek consists of a multi layered canopy
which is dominated by deciduous trees and
shrubs. The dominant trees in the overstory
include Fremont's cottonwood, Goodding’s
Black Willow, black walnut and Valley oak. In
the secondary layer, species such as Sandbar
willow and Box Elder are typical. The herba-
ceous layer that grows along the creek banks
includes several native and non native spe-
cies. The native species in this area includes
native wild rye, and purple needle grass. (US
Army Corps of Engineers, 1996) Some of the
predominant invasive species that grow in this
habitat are arundo, eucalyptus, Himalayan
blackberry, and wild oat.
Figure 2.3: Landscape in the Putah Creek Riparian Preserve

PUTAH CREEK HABITATWildlife
17
The mature native trees along the creek
provide habitat suitable for nesting and resting
for a variety of birds. This includes Swainson's
hawks, red-tailed hawks, great horned owls,
wood ducks, and American crows. Some birds
roost in mature trees and forage in the creek
and uplands. These include Great blue herons,
great egrets, snowy egrets, and black crowned
night herons. Some species nest in cavities
inside the mature strands such as western
gray squirrels, woodpeckers, and bats US Army
Corps of Engineers, 1996)
The river and riparian habitat also
support a variety of insects and invertebrates.
They provide food for resident and migratory
birds and bats.
Lower Putah Creek supports at least
26 species of fish 17 of which are permanent
residents. These species are composed of an-
adramous fish, resident native fish, introduced
resident game fish, and introduced resident
non-game fish (Army Corps of Engineers,
1996).
Figure 2.5: Great Blue HeronSource: Shari Green ,http://sharigreen.wordpress.com/2009/07/18/entertainment
Figure 2.4: Western gray squirrelSource: North American Mammals , http://www.wildlifenorthamerica.com/ylang/es/Mammal/Western-Gray-Squirrel/Sciurus/griseus.html

PUTAH CREEK HABITATEndangered Species
18
Several endangered species can be found in the vicinity of the
site. Here is a brief list as listed by the US Army Corps of Engineers
(1996).
Aleutian Canada goose (Branta canadensis leucopareia)Listed as Federally Threatened. It roosts in large marshes, flooded fields, stock ponds, and reservoirs. It forages in pastures, meadows, and grainfields and prefers corn. Rare occurrences spotted in Yolo Bypass.
American peregrine falcon (Falco peregrius anatum) Listed as Federally and California Endangered. Nests on protected ledges of cliffs adjacent to water bodies that support large populations of birds. Occasional winder occurrences in Yolo Basin and the Sacra- mento River.
Swainson's hawk (Buteo swainson) Listed as California Threatened. Nests on oaks or cottonwoods in or near riparian habitat. For ages in grasslands, irrigated pastures, and grain fields. Nests along the Sacramento River, Yolo Bypass, and Putah Creek.
Above:Figure 2.6: Aleutian Canada geese Source: Oceanwonderers mhttp://www.oceanwanderers.com/CAGO.Subspecies.html
Left: Figure 2.7: Swainson’s hawkSource: Dana Beaton, http://www.buttehcp.com/
Figure 2.8: American peregrine falconSource: Bird Forum, http://birdforum.net/opus/index.php?title=Peregrine_Falcon&diff=cur&oldid=119438

PUTAH CREEK HABITAT
19
Giant Garter snake (Thamnophis gigas)Listed as Federally and State Threatened. Lives in sloughs, canals, and other small waterways. Prays on small fish and amphibians. Requires grass banks and emer- gent vegetation for basking and high ground protected from flooding. Occurrences observed in Yolo Bypass.
Valley elderberry longhorn beetle (Desmocerus californicus dimophus) Listed as Federally Threatened. Lives in riparian and oak savannah habitats containing elder berry shrubs. Suitable habitat in Yolo bypass.
Winter-run chinook salmon (Oncorhynchus tshawytscha)Federally listed as Threatened. Occurs in riverine habitats. Occurs in the Delta and along the Sacramento river.
Several species listed as Threatened or Endangered can benefit
from the addition of a wetland in the Putah Creek Riparian Preserve.
For example, the Canada goose can roost in the wetland habitat and
forage in surrounding farmland and meadows. The Swainson's hawk
can roost in cottonwoods planted near the wetland and forage in the
nearby farmland.
Figure 2.9 Chinook SalmonSource: wildernessclassroom.com
Figure 2.10: Giant Garter SnakeSource: Wikipedia, http://en.wikipedia.org/wiki/Thamnophis_gigas
Figure 2.11: Valley elderberry longhorn beetleSource: http://courses.cit.cornell.edu/icb344/abstracts/valley-elderberry-beetle.htm

20
CONSTRUCTED WETLANDSBENEFITS
Hydrological
Contaminant Sinks
Constructed wetlands are engineered
water basins that aim to treat water by utilizing
natural processes. Aside from treating runoff,
wetlands can be utilized as the final treatments
of sewage waste water.
Over time, humans have altered the
natural hydrology of many landscapes by build-
ing dams and levees that restrict natural water
flow. Wetlands have been routinely drained
for other uses such as agriculture and urban
development. This led to a 50 percent loss of
wetlands in the United States, and in several
particular states, wetland loss is as high as 90
percent.
Regions that have lost large percent-
ages of wetlands also tend to suffer from flood-
ing impacts. This is due to wetlands' ability
to absorb excess stormwater runoff and then
slowly release the stored water. This reduces
peak flows while lessening chances of flooding.
By constructing wetlands and restoring natu-
ral systems of wetlands, regions can benefit
from less flooding and reduced peak flows
(France,2003) .
Wetlands also act as contaminant
sinks. This involves physical, chemical, and
biological pathways.
Physically, contaminants are removed
from the water as the water moves through
the system through sedimentation, filtration,
absorption, and volatilization (France, 2003).
Sedimentation refers to the process
in which suspended solids in the water settle
due to gravity. The rate in which debris settles
relates to its characteristics (EB, 2010).
Filtration occurs when water passes
through vegetation and soils in the wetland
and separates the fluids from the solids thus,
cleansing the water.
Absorption refers to the process in
which the soils and plants take in nutrients and
contaminants and retain them. Volatilization
refers to the evaporation and vaporization of
water and contaminants from the wetland.

CONSTRUCTED WETLANDSBENEFITS Chemical Breakdown
21
Chemical reactions within a wetland
transform one compound into another. An
example is the process of denitrification which
involves the reduction of nitrates into nitrite.
This process is aided by bacteria and enzymes
which break down compounds (Merriam-Web-
ster, 2010).
Wetlands cycle nutrients repeatedly
through the process of growth and decomposi-
tion. This contributes to the accumulation of
organic matter in wetlands. Removal mecha-
nisms and rates depend on the specific wet-
lands and their surroundings (France, 2003).
Biodiversity Wetland shorelines are dynamic and
contain fluctuating water levels. This at-
tracts a wide range of terrestrial and aquatic
plant and animal species many of which are
endangered. They are also among the most
botanically productive ecosystems and sup-
port a high ratio of animals for their surface
area. Varied water depths provide habitat
suitable for the life history needs of many
aquatic animals providing habitat for breed-
ing, spawning, nesting, feeding, etc.
Downstream ecosystem also benefit
from wetlands because they feed from the
materials that flow down the river (France,
2003).
HumansWetlands have an aesthetic value and
provide naturalistic open spaces. They can be
used for recreational activities such as: jog-
ging, biking, bird watching, walking, photog-
raphy, painting, and picnicking. Additionally,
they can be used as an educational resource
for surrounding communities with the usage of
informative signage, guided tours, and school
field trips (France, 2003).

CONSTRUCTED WETLANDSEFFICIENCY
22
������
�����
��������� �����������������
����������������� ������
��������������� ������
������������� ������
�� ���!��
"��� ���#��
������$��%
Wetlands are efficient at removing toxins from the water. The
table below shows representative removal rates reported by several dif-
ferent studies of retention and detention basins. Removal rates are usu-
ally higher for retention basins because they hold water permanently, or
until it evaporates or dissolves into the ground.
Source: Marsh, 2005. Based on a compilation of various sources by Michael Sullivan Associates, Austin, Texas.
Figure 3.2: The Davis West Ponds, a functional constructed wetland system for runoff and flood management.
Figure 5.1: Wetland Efficiency

CONSTRUCTED WETLANDSDESIGN AND CONSTRUCTION GUIDELINES
23
To function properly, wetlands must
be graded and constructed properly. There are
several main guidelines that come into play
when it comes to constructed wetlands.
Here, I will briefly discuss several
guidelines which I used to design the wetland
in the Putah Creek Preserve.
SizeAccording to France, constructed
wetlands must be a certain size in order
properly serve their surroundings. In general
wetland size should be two to four percent of
the watershed it serves in order to hold enough
water and treat it. This number can be reduced
to one or two percent if pre-treatment of water
is incorporated.
It should take the water ten to fifteen
days to pass through the system for it to effec-
tively remove most contaminants. It will take
variable amounts of time for each contaminant
to be removed.
Structure Several small wetlands offer an op-
portunity to more easily avoid sensitive areas
on site. They also increase the surface area
interface (France, 2003).
When it comes to maintenance, a wet-
land with multiple cells is much easier to man-
age because one or two ponds can be drained
at a time without closing the entire wetland
complex. It also allows for more control of the
water levels in the complex and for cells to spe-
cialize in removal of a particular contaminant
(EPA, 2000).
ShapeConstructed wetlands must avoid rect-
angular shapes, straight channels, and rigid
edges. They should be constructed with sinu-
ous paths and borders and incorporate existing
landforms when possible (EPA 2000). This
minimizes impact on site, raises surface area,
and reduces chances of dead edges (edges
with no water movement).
They should also incorporate a variety
of different side slopes. This increases the sur-
face area interface and allows for increased in-
teractions between the water, soil, plants, and
animals. It provides more irregular shorelines
which add habitats for animal populations .
Additionally, rounded edges minimize the pos-
sibility of dead edges, which are areas where

24
CONSTRUCTED WETLANDSDESIGN AND CONSTRUCTION GUIDELINES
Slopes
water filtration does not occur. This naturalistic
approach to design also adds aesthetic value
to the wetlands(France, 2003).
Slopes are also an important aspect
because they help to regulate water flow.
Longitudinal slopes should be very gradual
and not exceed 0.5-1.0 percent. On level sites,
treatments can include berms and dikes and
on sloped sites, cells can be terraced into the
landscape.
Vertical slopes, or slopes of the
shorelines of ponds should be graded between
the ratios of 3:1 to 5:1 to provide access for
wildlife and limit erosion. This also provides
opportunities for water levels to gradually drop
and rise.
The varied slopes add habitat value for
a variety of different plants. Marginal trenches
can be used to prevent plants colonizing the
open water areas in a wetland (France, 2003).
IslandsIslands are another important aspect
of wetland design. Their existence promotes
water storage by increasing the flow travel
time. Islands more than half an acre in size,
provide sanctuary for wildlife from humans
and predators. Low and irregular islands make
ideal water fowl habitats because their shape
increases edge habitat.
Islands reduce the distance that waves
travel, which decreases the opportunity for
solids to become re-suspended in the water
and for transport of solids downstream (France,
2003).

CONSTRUCTED WETLANDSDESIGN AND CONSTRUCTION GUIDLINES
25
Buffer zones provide a natural tran-
sition zone. Riparian habitats in this zone
provide nesting habitat for birds and shade
they provide helps regulate wetland tempera-
ture. When planting these buffer zones, it is
important to consider and design natural cor-
ridors which connect the wetland habitats to
the rest of the landscape. Corridors will allow
for populations to intermix and travel to and
from the wetland (EPA, 2000). When possible,
these zones should be at least 3oo feet wide to
provide adequate habitat.
These buffer zones also provide safety
zones which can store additional storm water
during a major flooding event (France, 2003).
Buffer Zones

26
CONSTRUCTED WETLANDSHABITATSThe design features of this wetland
will provide habitats for many different spe-
cies. Even though the wetland will cut into the
existing riparian corridor, it will provide riparian
habitat along its edges and new habitats for
many species.
Design Features Here are some of the design features
and the species which will use them. Taken
from the Wildlife Habitat Enhancement and
Management Plan for West Davis Pond, 1989.
Small Islands will provide habitat for shore-
birds and waterfowl for nesting and resting.
Permanently flooded channels will provide
habitat for waterfowl, warm water fish, frogs,
and crustaceans.
Mudflats and seasonal wetlands will provide
seasonal habitat for fish and crustaceans and
will provide sources for feeding of waterfowl.
Shoreline riparian and wetland planting will
provide wildlife cover and waterfowl food
production.
Basin slopes will provide foraging habitats for
waterfowl and songbirds. Will also provide
nesting habitats for ground squirrels and bur-
rowing owls.
Native planting will act as wildlife cover, song-
bird feeding habitat, and roosting habitat.
Figure 3.3: Waterfowl in a wetlandSource: www.sierraclubcalifornia.org/wetlands.html

27

28

SITE ANALYSIS
29
On my first visit to the site, I instantly
fell in love with it; I also instantly knew why. It
is an in between sort of place, the kind of place
that organically evolved over time. Nobody
really planned it or had a grand notion of what
it must be. It represents the convergence
between human activities and nature. The
two elements together extenuate each other’s
beauty.
The first time I came to the site, I
entered through the west end. The highway
bridges welcomed me in as gates. The place
has a magical feel. Walking into it is like dis-
covering Terabithia; a secret and wonderful sort
of world.
Figure 4.1: West Entrance

30
SITE ANALYSISCONTEXT
Davis
Sacramento
Woodland
Lake Berryessa
Lower Putah Creek
Upper Putah Creek
LanduseAgricultureInvasiveUrbanShrublandWoodlandRiparianWaterWetland Site
Figure 4.2: Landuse Map

SITE ANALYSISCONTEXT
31
ElementsUrbanLevee100 Year FloodplainStreamThe Site
Davis
Sacramento
Woodland
Monticello Dam
Lake Berryessa
Figure 4.3: Hydrology Map

32
SITE ANALYSISCONTEXTContext-Landuse Map The map on page 27 shows the context
of the site. It sits on the banks of Putah Creek
near the UC Davis campus. Its located in the
Central Valley of California. The map shows
Lake Berryessa as well as surrounding cities,
roads, and vegetation types. It also shows that
the site is surrounded by agricultural land. The
surrounding mountains contain chaparral,
various types of woodland vegetation, riparian
vegetation, and extensive invasive vegetation.
Regional Hydrology MapThe map on page 28 shows the region-
al hydrology of the site. In red are the levees
and dams. The map depicts levees along Putah
Creek and the Yolo Bypass. It also shows areas
that are in the 100 year floodplain.
The map shows the site as part of a
larger water system and how the site relates to
its regional watersheds.

SITE ANALYSISFigure 4.4: THE SITE IN RELATION TO THE ARBORETUM
33
Central Campus of UC Davis
Potential Wetland Site
North Fork Arboretum
Old Levee Road
Putah Creek
Highway 80
Railroa
d
113
This map shows the the location of the
potential wetland site in relation to the cam-
pus, the arboretum waterway, the levee, and
surrounding roads.

34
SITE ANALYSISFigure 4.5: SITE CLOSEUP
113
RAIL
ROAD
LEVEE ROAD
TRAC
KS
1
2
1
6
5
UNIVERSITY OWNED FARMLAND
PRIVATE FARMLAND
LEV
3
7 6
8
4
1
Central Campus of UC Davis
Potential Wetland Site
North Fork Arboretum
Old Levee Road
Putah Creek
Highway 80
Railroa
d
113
Refer to page 35-40 for detailed descriptions of each number.

SITE ANALYSISSITE DESCRIPTIONS
#1 Entrances
35
This site is a remnant, defined by what is around it. A hodge-
podge of uses and purposes have evolved here over time. Its sense of
place and identity evolved over time, piece by piece, and not usually by
intentional design. These elements came together to create the site as
we see it today.
The site itself is off the beaten path. Locating it can be fairly
difficult. There are two ways to enter.
One way is by traveling on the old levee road along the former
Putah Creek channel. Once reaching the gate of the Putah Creek Pre-
serve, walk or bike 2/3 of a mile on the levee towards the convergence
of highway 113 and I80. Once reaching the highway bridge, the road
dips down into the site.
Another method of entering the site is by driving down Old Davis
Road, past the Wastewater Treatment Plant and making a right at the
Levee Road. From there, just walk down the footpath towards the West. Figure 4.6: The West Entrance.

SITE ANALYSISSITE DESCRIPTIONS#2 Pipework
36
On my first site visit, the primary thing I needed to do was
look for the arboretum water outflow pipe. Not surprisingly, this pipe
was fairly hard to find. I actually found it pretty quickly, but the open-
ing itself was submerged underwater to the extent that I could not see
the water leaving the pipe. I expected the pipe to be more visible and
noisy, so I continued to look for it even after I found it. The outflow is
underneath a metal mesh surrounded by riparian trees and shrubs.
When walking in a straight line from the outflow pipe to the
levee, I could see a concrete box on top of the levee. This is a check
gauge valve for the Arboretum Waterway discharge pipes. It keeps
debris out of the pipe during low flow, and can also be used to re-
strict flow. Looking through the mesh on the gauge, one can see the
water flowing through the pipe.
Top: Figure 4.7: Outflow pipe into Putah Creek
Figure 4.8: The Check Gate valve box

SITE ANALYSISSITE DESCRIPTIONS#3 Pathways
37
Formal and informal pathways weave
through the site. After the rain, the pathways
become very muddy. It appears that horses
regularly use these paths because the hoof
#4 Wetland PotentialThis area borders a terrace to the
north. It contains potholes which sometimes
fill with water during the winter. This is a good
potential area for the wetland because of its
natural contours and location in proximity to
the check gate valve.
prints they leave behind dot the trails.
Many visitors take a hike and bring
friends, family members, or pets with them.
Some of the visitors remain on the levee road
and do not pass under the bridge or walk
through the riparian preserve. I have not en-
countered anyone sitting or observing the site.
Figure 4.9: Visitor walking on path.
Figure 4.10: Site near the East end, with potential for wetland construction.
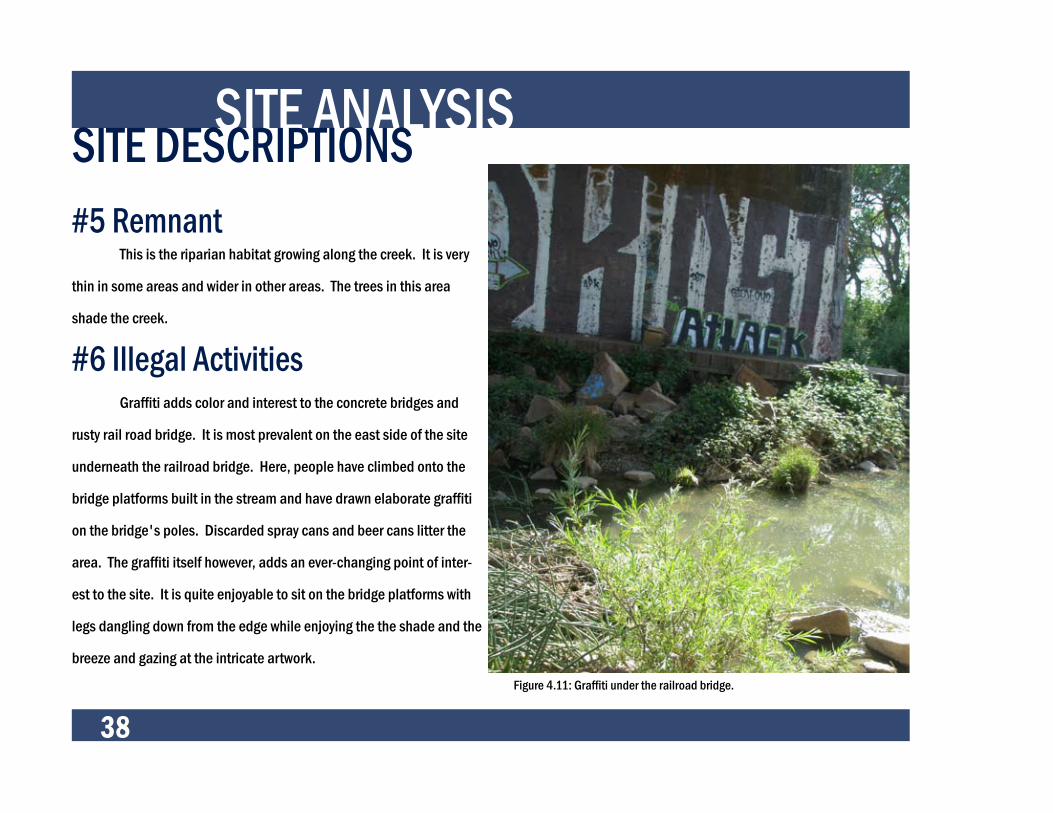
SITE ANALYSISSITE DESCRIPTIONS#5 Remnant
38
This is the riparian habitat growing along the creek. It is very
thin in some areas and wider in other areas. The trees in this area
shade the creek.
#6 Illegal ActivitiesGraffiti adds color and interest to the concrete bridges and
rusty rail road bridge. It is most prevalent on the east side of the site
underneath the railroad bridge. Here, people have climbed onto the
bridge platforms built in the stream and have drawn elaborate graffiti
on the bridge's poles. Discarded spray cans and beer cans litter the
area. The graffiti itself however, adds an ever-changing point of inter-
est to the site. It is quite enjoyable to sit on the bridge platforms with
legs dangling down from the edge while enjoying the the shade and the
breeze and gazing at the intricate artwork.
Figure 4.11: Graffiti under the railroad bridge.

SITE ANALYSISSITE DESCRIPTIONS#7 Restoration Efforts
39
Efforts to maintain the site and provide habitat for wildlife are
apparent on site. The yellow area has been seeded with native grasses.
Young eucalyptus trees lie in piles along the site showing the efforts of
management to eradicate them. Bird boxes also hang from many of the
trees.
Left: Figure 4.12: Native grasses areaTop: Figure 4.13: A bird box

SITE ANALYSISSITE DESCRIPTIONS#8 Oak Planting
40
This upper terrace has been planted with oak seedlings accord-
ing to Andrew Fulks, Manager of the Putah Creek Preserve. They can
provide shade for the the potential wetland and will provide valuable
habitat for birds, mammals, and insects.
Overall Over time, the site has been shaped by the urban infrastructure
surrounding it, by the native remnants of historical ecosystems, by the
river running through it, by human restoration efforts, and by visitor ac-
tivities (whether legal or not). All these factors came together to create
the site as we see it today. It is a tranquil place not frequented by many
visitors and a good place to visit for a nice walk along the creek.
Figure 4.14: Putah Creek, the riparian corridor, and the railroad bridge. This shows the relationship between infrastructure and nature.

SITE ANALYSISFigure 4.15: OPPORTUNITIES AND CONSTRAINTS
41
113
LEVEE ROAD
113
UNIVERSITY OWNED FARMLAND
PRIVATE FARMLAND
RAIL
ROAD
TRA
CKS
1
3
2
6
8
5
7
4
9
10
CatagoriesConstraintOpportunityBothNumbers refer to explanations on next page.
Central Campus of UC Davis
Potential Wetland Site
North Fork Arboretum
Old Levee Road
Putah Creek
Highway 80
Railroa
d
113

42
SITE ANALYSISOPPORTUNITIES AND CONSTRAINTS DESCRIPTIONS#1 Highway
The bridge is a constraint on the site
because it adds noise, air, and visual pollution.
Cars driving by sometimes drop garbage from
windows.
#2 UnderpassThe underpass is an opportunity
because it allows wildlife to pass underneath
the highway. The bridges frame the site and
provide an interesting entrance.
#3 Levee RoadLevee road is an opportunity because
it connects the site to the rest of Davis. Service
vehicles and visitors can use this road to get to
the wetland or for maintenance purposes.
The Levee road is a constraint because
it restricts the types of structures which can be
built in the area. The levee also acts as a wall,
separating the site from its surroundings.
#4 Lower Terrace This area is near the check gate valve,
it has natural topographical variations and
borders the creek. It is an appropriate location
to construct a wetland.
#5 Private Farmland The south side of the bank is privately
owned, so it is out of limits when it comes to
design and usage.
#4 Lower Terrace
#6 RemnantThe riparian remnant is a corridor for
wildlife. It also shades the river, which creates
niches for aquatic wildlife. The Wetland will
add riparian areas to this corridor.
#7 UCD FarmlandThis farmland is already owned by
the university, so this gives the opportunity to
design elements that include the farmland.

SITE ANALYSIS
43
OPPORTUNITIES AND CONSTRAINTS DESCRIPTIONS#8 Railroad Bridge
A constraint because it is noisy and
rusty. People who leave graffiti on this site also
tend to leave garbage (particularly spray and
soda bottles).
An opportunity because the areas
underneath it are points of interest on site.
#9 Oak Planting AreaMostly an opportunity because it will
add a riparian buffer zone around the wetland
which will increase wildlife habitat. The trees
can provide shade for some of the pools.
It is a slight constraint because the
wetlands cannot be build here due to oak
plantings.
#10 Trails Already existing trails can be used in
the design to get visitors to the site.

44
SITE ANALYSISFigure 4.16: SOILS 607000
607000
607100
607100
607200
607200
607300
607300
607400
607400
607500
607500
607600
607600
607700
607700
607800
607800
607900
607900
608000
608000
608100
608100
608200
608200
608300
608300
608400
608400
4263
600
4263
600
4263
700
4263
700
4263
800
4263
800
4263
900
4263
900
4264
000
4264
000
4264
100
4264
100
4264
200
4264
200
4264
300
4264
300
4264
400
4264
400
4264
500
4264
500
4264
600
4264
600
0 800 1,600 2,400400Feet
0 200 400 600100Meters
38° 31' 23''
121°
45'
19'
'
38° 30' 49''
121°
45'
20'
'
38° 30' 50''
38° 31' 24''
121°
46'
25'
'12
1° 4
6' 2
5''
Map Scale: 1:7,530 if printed on A size (8.5" x 11") sheet.
Soil Map—Solano County, California(soil map pic)
Natural ResourcesNatural ResourcesNatural ResourcesNatural ResourcesConservation ServiceConservation ServiceConservation ServiceConservation Service
Web Soil SurveyNational Cooperative Soil Survey
5/13/2010Page 1 of 3
RW
YO

SITE ANALYSISSOILS AND WATERRW-Riverwash
45
The wetland site is mostly located on
this type of soil. Riverwash is classified as "Ex-
cessively Drained" which means that water is
removed from the soil very rapidly. The parent
soil is sandy or gravely alluvium. This type of
soil is also frequently flooded (USDA, 2010).
YO-Yolo Loam The north part of the site is located
on this type of soil. It is classified as "Well
Drained" meaning that water is removed from
the soil fairly quickly, but not rapidly. The par-
ent soil is alluvium derived from sedimentary
rock (USDA, 2010).
Flooding According to Andrew Fulks, the site
floods occasionally even though the Monticello
Dam and Solano Diversion Dam have prevent-
ed Lower Putah Creek from flooding as it would
historically.
When the site does flood, the wetland
design must accommodate the extra water and
drain it back into the river.
Accomidation for SoilsSince the site contains well drained
soils, it will most likely be necessary to line the
pools with 16-20in of clay. This will prevent
major leakage of contaminated water into the
water table.

46
DESIGNINTENT As landscape designers we are inclined
to give our landscapes some kind of great pur-
pose. We want to design them and make them
more useful in one way or another. However,
as designers, it is also important to know when
our expertise is not needed and recognize that
sometimes organic growth is more appropriate
than purposeful design.
Even though I aim to instal a wetland
on this unnamed site, I want it to keep its char-
acter because, as populations grow and cities
expand, every scrap of space becomes utilized
for a defined purpose. Even in a public park,
visitors are instructed on where to eat, to sit,
to play, and to walk, by the layout of the park
and placement of structures. However, I see
importance in leaving some of these patches
of remnant space as is, or only making minor
changes. People need spaces that are not
necessarily free of restrictions, but that retain
the feeling of being free of restrictions. This
site certainly portrays an air of tranquility and
freedom seldom found in intensely designed
landscapes.

DESIGNPROCESS
47
I assessed the site by doing research
and conducting a site analysis. Then, I cre-
ated several concepts for the potential wet-
land. Initially, I intended to design a single
large pond on site, however, due to the shape
and size of the site, I was advised to design a
series of smaller ponds . This is to control water
residence time by pooling the water and thus,
slowing it down. Smaller pools are also easier
for maintenance
I started designing the ponds by
drawing their outlines. Then, graded them
in AutoCAD and moved the file into ArcGIS.
Throughout the grading process, I made several
changes in my design. Initially, the ponds
drained from north to south, but I changed
them to drain from west to east ( in the direc-
tion of Putah Creek's flow).
In ArcGIS, I created a model of the wet-
land and realized that my slopes are extremely
steep. So, I regraded them, this lowers their
water residence time, but should render them
more functional.
The final design includes a model, two
sections, and some illustrative perspectives.
I added a pathway and a viewing platform for
visitors and staff.
The design itself is intended to give a
conceptual representation of what this wetland
would look like. Due to some missing data, I
could not gauge how much water the wetland
will actually need to hold. So, some further
research is defiantly needed to ensure the suc-
cess of the wetland.
48
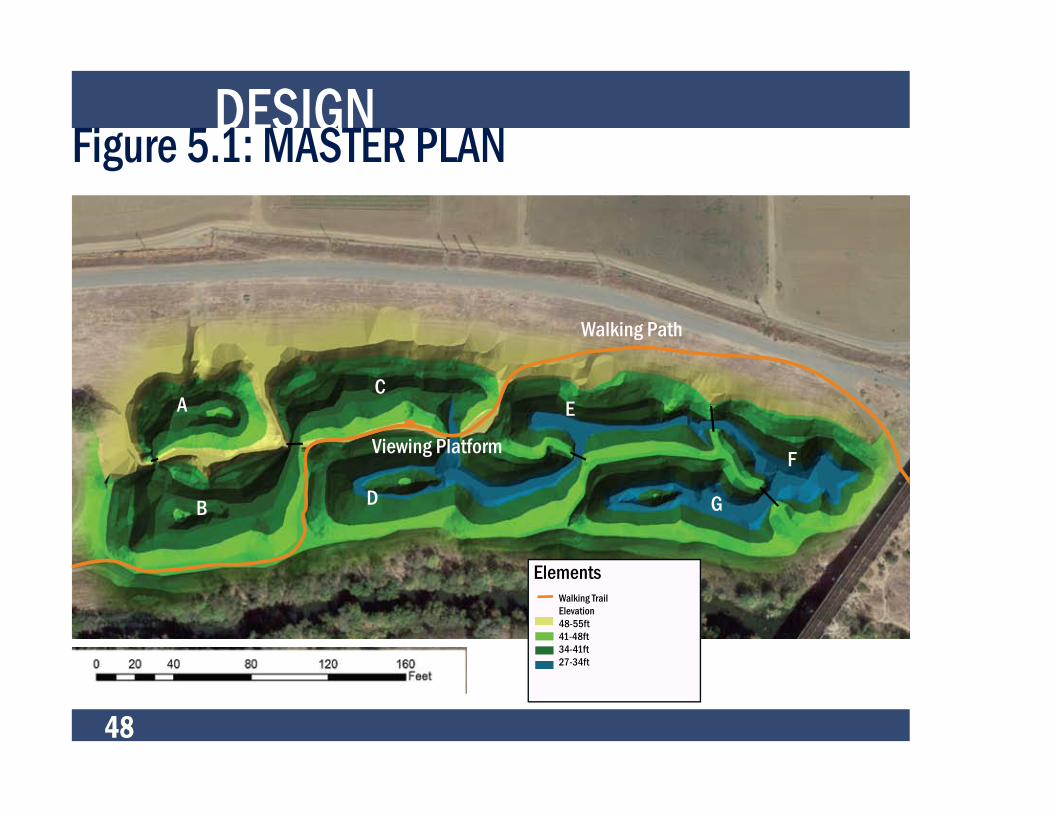
DESIGNFigure 5.1: MASTER PLAN
ElementsWalking TrailElevation48-55ft41-48ft34-41ft27-34ft
A
B
C
D
E
F
G
Walking Path
Viewing Platform
DESIGNEXPLANATION
49
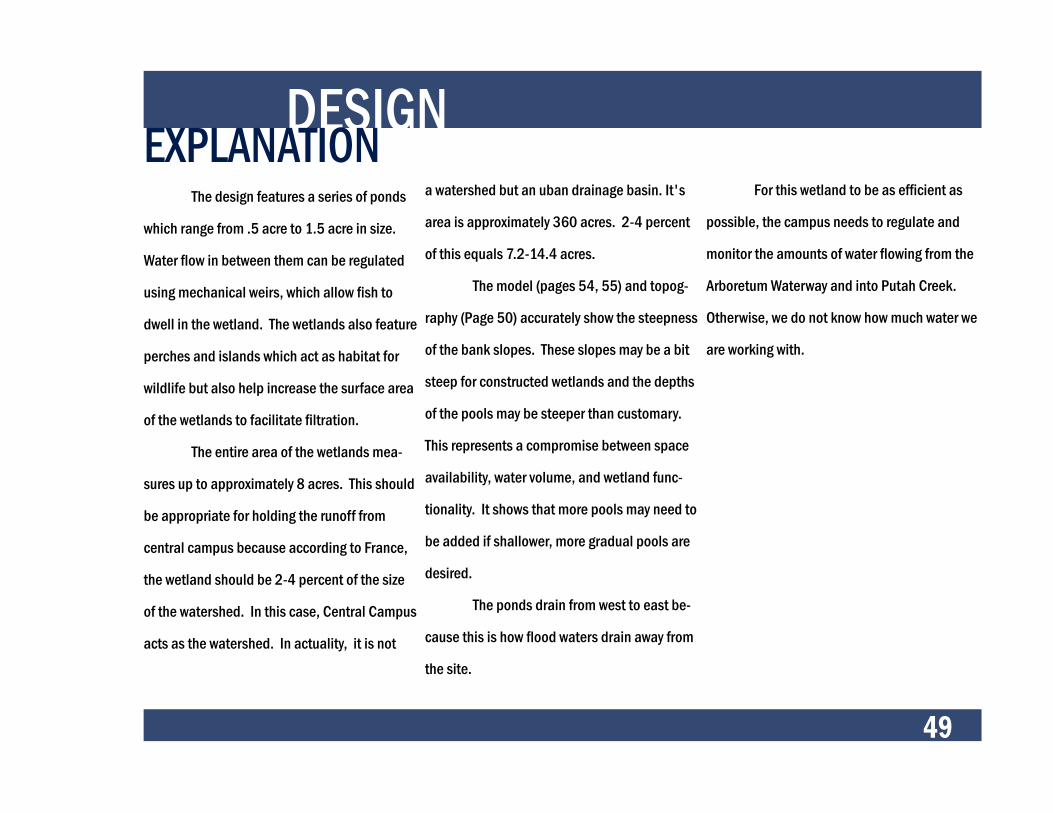
The design features a series of ponds
which range from .5 acre to 1.5 acre in size.
Water flow in between them can be regulated
using mechanical weirs, which allow fish to
dwell in the wetland. The wetlands also feature
perches and islands which act as habitat for
wildlife but also help increase the surface area
of the wetlands to facilitate filtration.
The entire area of the wetlands mea-
sures up to approximately 8 acres. This should
be appropriate for holding the runoff from
central campus because according to France,
the wetland should be 2-4 percent of the size
of the watershed. In this case, Central Campus
acts as the watershed. In actuality, it is not
a watershed but an uban drainage basin. It's
area is approximately 360 acres. 2-4 percent
of this equals 7.2-14.4 acres.
The model (pages 54, 55) and topog-
raphy (Page 50) accurately show the steepness
of the bank slopes. These slopes may be a bit
steep for constructed wetlands and the depths
of the pools may be steeper than customary.
This represents a compromise between space
availability, water volume, and wetland func-
tionality. It shows that more pools may need to
be added if shallower, more gradual pools are
desired.
The ponds drain from west to east be-
cause this is how flood waters drain away from
the site.
For this wetland to be as efficient as
possible, the campus needs to regulate and
monitor the amounts of water flowing from the
Arboretum Waterway and into Putah Creek.
Otherwise, we do not know how much water we
are working with.
50
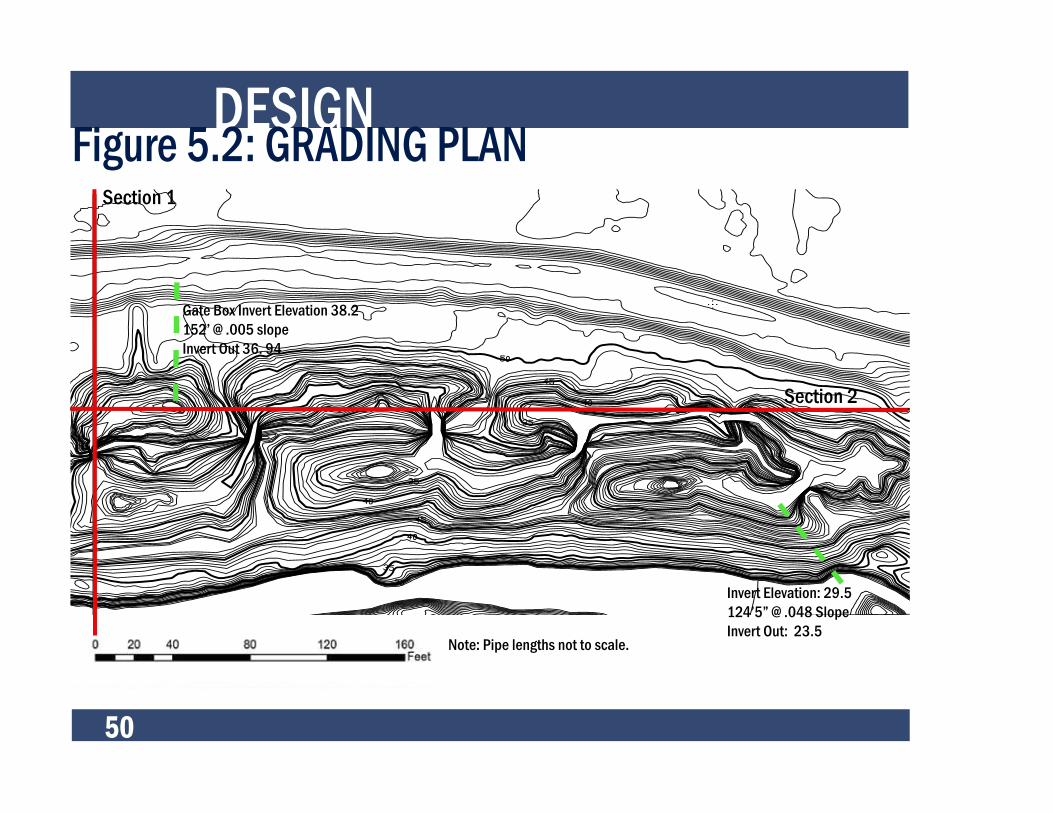
DESIGNFigure 5.2: GRADING PLAN
PROD
UCED
BY
AN A
UTOD
ESK
EDUC
ATIO
NAL
PROD
UCT
PRODUCED BY AN AUTODESK EDUCATIONAL PRODUCT
PRODUCED BY AN AUTODESK EDUCATIONAL PRODUCTPRODUCED BY AN AUTODESK EDUCATIONAL PRODUCT
Note: Pipe lengths not to scale.
Gate Box Invert Elevation 38.2152’ @ .005 slopeInvert Out 36. 94
Invert Elevation: 29.5124’5” @ .048 SlopeInvert Out: 23.5
Section 1
Section 2

DESIGNSECTIONSFigure 5.3: Section 1
51
Figure 5.4: Section 2
25’
WeirLevee
Pool APool B
Slight elevation change from pool to pool.
Pool A Pool C
Pool D
50’ 100’ 200’ 400’
25’ 50’100’ 200’ 400’

DESIGNFigure 5.5: FLOW DIAGRAM
52
A
B
C
D
E
FG
Inflow
Outflow

DESIGNFLOW DIAGRAMExplanation
53
The flow diagram shows the direction
in which water will move through the wetland.
The wider arrows show the major flow while the
thinner arrows show minor flows. The pools
are separated by weirs, so they will fill up to a
certain, controlled height before water moves
on to the next pool.
DESIGNMODEL
54
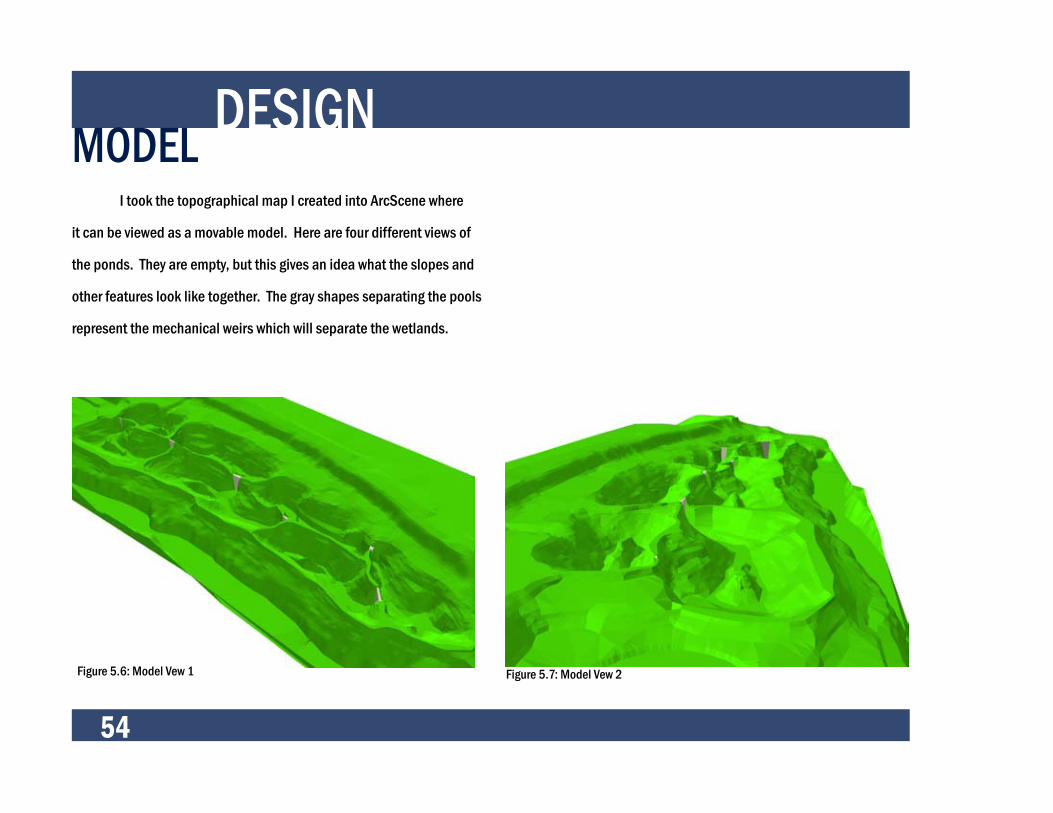
I took the topographical map I created into ArcScene where
it can be viewed as a movable model. Here are four different views of
the ponds. They are empty, but this gives an idea what the slopes and
other features look like together. The gray shapes separating the pools
represent the mechanical weirs which will separate the wetlands.
Figure 5.6: Model Vew 1 Figure 5.7: Model Vew 2

DESIGNMODEL
55
Figure 5.8: Model Vew 3 Figure 5.9: Model Vew 4

56
DESIGNPERSPECTIVES
Figure 5.10: What the wetlands might look like in the winter.

DESIGNPERSPECTIVE
57
Figure 5.11: What wetlands might look like in the summer.

58
DESIGNVOLUMECalculations
When it comes to the water holding
capacity and retention time of the wetlands
I had no concrete number to work with. So,
I used the average daily flow measurements
of water coming into the arboretum from the
Waste Water Treatment plant. I calculated how
long the ponds will hold water (before they fill)
for the mean amount, the low amount, and the
high amount of flow. I did this to figure out how
wetland water holding capacity will change
with changes in water flow rate.
I made the assumption that ponds
start empty and that if the pools are full, the
water will be displaced at a rate similar to the
infil rate.
First I found the volume of each pond
in cubic feet, then, I converted the number into
gallons. After this, I divided the volume (in gal-
lons) by the amount of daily flow.
Figure 5.12: The table above shows the volume and detention time of each pond and for all of
the ponds together.
������
�����
��������������������������
���� ���������������
� ������� � �! " !� � #�
$ %�!%��% � �� � "! % !�
& %���%�� � �% " ## % ��
� �#%"�!� % � � �� � �!
' ������! " # � �# � �
( %%�"�%� � � " #� % ��
����� ���"#!#� # %� � ## �� ��
��������������������������
���� ���������������
� �%!""%% " � " �� � ��
$ %��!��! � �� " �# % %!
& %""%��% � %� " �� % ��
� �"��!�! � #% � � � %
' �����%� � �! " !� � #�
( %"����� � %� " �� % ��
) %"����� � %# " �� % ��
����� ��%#%��" # � � �# �� �#
������*��+,� �!��������������
��-���*��+,% ����������������
����+*��+," #���������������
������*��+,� �!��������������
��-���*��+,% ����������������
����+*��+," #���������������

DESIGNPLANTING
59
The different elements of the wetland
will be seeded and planted according to their
slopes and frequency of flooding. Several dif-
ferent planting zones exist. Flood tolerant spe-
cies are planted on slopes and banks in lower
elevations and on basin floors. While drought
tolerant plants will be placed on basin rims and
higher contours. Mudflats are seeded with a
plant mix specialized for waterfowl food.
Ponds E, F, and G will not have any tree
cover while ponds A, B, C, and D will be shaded
by riparian trees (refer to page 48 for pool ID).
The trees near the pools will provide habitat for
birds to nest while the pools themselves will
provide foraging habitat. The pools that are not
shaded will provide habitats for waterfowl.
Another reason for this tree planting
scheme is the railroad bridge, it is better to
avoid planting trees near such infrestructure.
Some plants to use on basin floors and
mudflats are rushes, sedges, and tules. Some
plants to place in higher elevations are wild rye,
barley, rescue, and purple needle grass.
The riparian areas include cottonwoods, box
elders, willows, , buckeye, elderberry, and wild
grape.
For more detailed plant selection and guide-
lines refer to:
Calflora, "Information on Wild California
Plants for Conservation, Education, and Appre-
ciation". <http://www.calflora.org/>
A good source for detailed informa-
tion about California native species and their
habitats.
West Davis Ponds Report. 1989. Wildlife Habi-
tat Enhancement Plan for the West Davis Pond.
A good source for guidelines, manage-
ment plans and planting lists.

DESIGNHUMAN INTERACTIONPathways
60
Viewing Platform
Visitors will be able to interact with the site by walking through
the pathway provided. There may be a need to construct fences to pro-
tect and screen the wildlife from people. The pathways are also needed
for maintenance purposes.
A viewing platform will be a good addition to the wetland
because it will allow people to stand and observe the wildlife in the
wetland. It can include benches, but must include a wooden barrier to
hide people's legs from the wildlife. Figure 5.13: The viewing platform might look something like this one, but instead of mesh in between the wooden poles, I recommend using wooden panels. Source: http://sciblogs.co.nz/science-life/2009/10/29/orokonui-ecosanctu-ary-to-open/

CONCLUSION
61
A constructed wetland in the Putah
Creek Riparian Preserve is a viable and plausi-
ble solution to the problem of low water quality
leaving the Arboretum Waterway. Sometimes
the water quality in the Waterway is so low,
that dissolved oxygen levels kill resident fish in
the Arboretum. Building a wetland will help to
protect wildlife and ecosystems in and along
the creek. Wildlife on site will also benefit
from added habitats. The wetland will give the
university another great opportunity to act as a
steward to nature.
To make a constructed wetland func-
tional, many different elements must come
together. The biggest challenge in the process
of creating the thesis was gathering informa-
tion.
The first step the University must take
in the case of wetland construction in the Putah
Creek Riparian Preserve, is to monitor water
volume leaving the Arboretum Waterway. The
volume of flow can drastically change the num-
ber, depths, and placement of pools for this
wetland.
The wetland will not solve water qual-
ity problems in the Arboretum itself, but will
prevent the arboretum water from harming and
stressing habitats in and along the creek.
This thesis is aimed at raising aware-
ness for the issue at stake and to help open a
door for a new possibility in the Putah Creek
Riparian Preserve.

62
BIBLIOGRAPHY“Dissolved Oxygen”. Water on the Web. Web 10 June 2010 <http://waterontheweb.org/under/waterquality/oxygen.html>
Encyclopedia Britannica. “Sedimentation”. Web 10 June 2010 <http://www.britannica.com/EBchecked/topic/532291/sedimentation>
France, Robert L. Wetland Design; Principles and Practices for Landscape Architects and Land-Use Planners. New York: W. W. Norton. 2003
Fulks, Andrew. Maneger of Putah Creek Riparian Preserve. Verbal correspondence. 2010
Jones & Stokes Associates, Inc. Wildlife Habitat Enhancement and Management Plan for West Davis Pond. Prepared for West Davis Associates. Sacramento, 1989
Marsh, William M. Landscape Planning ; Environmental Applications. Fourth Edition. John Wily & Sons Inc. 2005
Merriam Webster. “Dentrification- Definition”. Merriam Webster on the Web. Web 10 June 2010 <http://www.merriam-webster.com/dic tionary/denitrification>
Phillips, David. Director of Facilities for UC Davis. Email correspondence. 2010.
Putah Creek Council. Putah Creek; Flowing Through Our Communities and Our Lives. Sacramento: EDAW, AECOM, 2008
University of California Davis Department of Geology. “The Putah Creek Project”. UC Davis. Web 10 June 2010 <https://www.geology. ucdavis.edu/~pcp/>
University of California Davis, Office of Resource Management and Planning. Arboretum Waterway Improvements Project; Draft Tiered Initial Study and Proposed Mitigated Negative Declaration. Davis, California, 2006

BIBLIOGRAPHY
63
United States Army Corps of Engineers, Sacramento District. Environmental Assessment; Putah Creek South Fork Preserve, California. 1996
United States Department of Agriculture. Map Unit Description: Riverwash - Solano County , California; Soil Map. Web Soil Survey. National Cooperative Soil Survey. 2010
United States Department of Agriculture. Map Unit Description: Yolo Loam- Solano County , California; Soil Map. Web Soil Survey. National Cooperative Soil Survey. 2010
United States Environmental Protection Agency, Office of Wetlands Oceans and Watersheds. Guiding Principles for Constructed Treatment Wet lands; Providing for Water Quality and Wildlife Habitat. Washington DC. 2000
United States Environmental Protection Agency. “Polluted Runoff (Nonpoint Source Pollution)”. U.S. Environmental Protection Agency. Web 10 June 2010 < http://www.epa.gov/owow/nps/whatis/html>
All photographs taken Ella Ver, unless otherwise noted on the page.
Maps and other imagry created with the aid of AutoCAD, ESRI, and Adobe Master Collection.
Picture Sources