Embed Size (px)
Citation preview

Wetland and Waterbody Delineation
PORT OF EAST ST. LOUIS – NORTH CAHOKIA TRACT SAUGET, ILLINOIS
October 2013
Prepared for:
TERRA ENGINEEIRNG, LTD.
SCI No. 2013-3194.30
Port of East St. Louis EA Appendix E - Wetland Delineation
Page E-1 of 18

October 23, 2013 Mr. George Ghareeb Terra Engineering, Ltd. 401 N. Main Street, Suite 1130 Peoria, Illinois 61602 RE: Wetland and Waterbody Delineation Port of East St. Louis – North Cahokia Tract Sauget, Illinois SCI No. 2013-3194.30 Task 200 Dear Mr. Ghareeb: We are pleased to submit our report entitled Wetland and Waterbody Delineation – PORT OF EAST ST. LOUIS – NORTH CAHOKIA TRACT – SAUGET, ILLINOIS, dated October 2013. As described in our September 13, 2013 proposal, our field investigation focused on the areas that were suspect for wetland characteristics within the project site boundary, since the project site is located within the Mississippi River 100-year floodplain. Our field investigation identified no wetlands or waterbodies within the project boundaries. However, the USACE has the sole authority to determine if any areas of the site would be under their jurisdiction. SCI is available to assist with the Section 404 and Section 401 Permit application as you advance in your planning of the project. If you have any questions or concerns, please contact Scott Harding at (618) 206-3041 or [email protected]. Respectfully, SCI ENGINEERING, INC. Michelle Goodare Wetland Scientist Scott D. Harding, CPSS/SC Vice President JAF/MDG/SDH/tlw Enclosure \\scieng\shared\OFallon\emtapps\PROJECT FILES\!2013 Projects\2013-3194 Port of East St. Louis\NR\30\North Cahokia Real Estate\20133194.30 Wetland Delineation Report - North Cahokia Real Estate.doc
Port of East St. Louis EA Appendix E - Wetland Delineation
Page E-2 of 18

TABLE OF CONTENTS
1.0 INTRODUCTION ............................................................................................................................ 1
2.0 SITE LOCATION ............................................................................................................................ 1
3.0 SOIL SURVEY AND TOPOGRAPHIC RESEARCH ................................................................. 1
4.0 SITE RECONNAISSANCE AND CONDITION SUMMARY .................................................... 2
5.0 CONCLUSION ................................................................................................................................. 2
6.0 LIMITATION .................................................................................................................................. 3
FIGURES Figure 1 – Vicinity and Topographic Map Figure 2 – National Wetlands Inventory Map Figure 3 – Wetland Delineation and Aerial Photograph
APPENDICES Appendix A – Photographic Summary Appendix B – Wetland Determination Data Forms – Midwest Region
Port of East St. Louis EA Appendix E - Wetland Delineation
Page E-3 of 18
Wetland and Waterbody Delineation
PORT OF EAST ST. LOUIS – NORTH CAHOKIA TRACT SAUGET, ILLINOIS
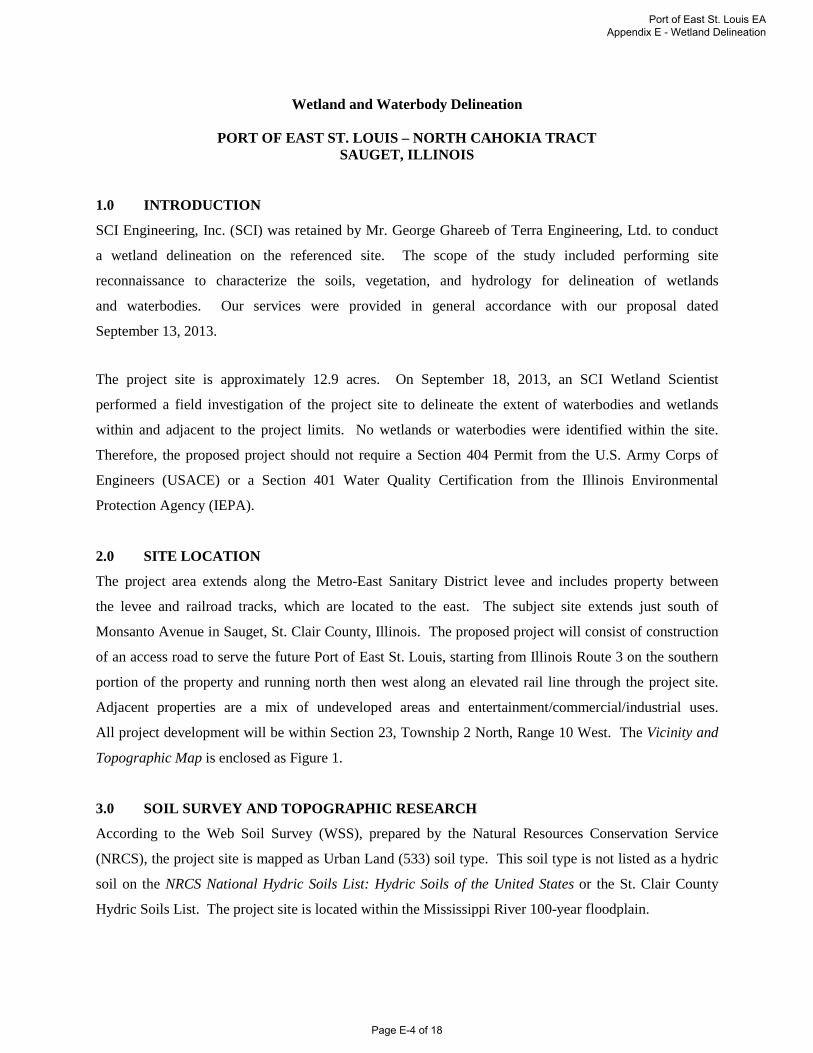
1.0 INTRODUCTION
SCI Engineering, Inc. (SCI) was retained by Mr. George Ghareeb of Terra Engineering, Ltd. to conduct
a wetland delineation on the referenced site. The scope of the study included performing site
reconnaissance to characterize the soils, vegetation, and hydrology for delineation of wetlands
and waterbodies. Our services were provided in general accordance with our proposal dated
September 13, 2013.
The project site is approximately 12.9 acres. On September 18, 2013, an SCI Wetland Scientist
performed a field investigation of the project site to delineate the extent of waterbodies and wetlands
within and adjacent to the project limits. No wetlands or waterbodies were identified within the site.
Therefore, the proposed project should not require a Section 404 Permit from the U.S. Army Corps of
Engineers (USACE) or a Section 401 Water Quality Certification from the Illinois Environmental
Protection Agency (IEPA).
2.0 SITE LOCATION
The project area extends along the Metro-East Sanitary District levee and includes property between
the levee and railroad tracks, which are located to the east. The subject site extends just south of
Monsanto Avenue in Sauget, St. Clair County, Illinois. The proposed project will consist of construction
of an access road to serve the future Port of East St. Louis, starting from Illinois Route 3 on the southern
portion of the property and running north then west along an elevated rail line through the project site.
Adjacent properties are a mix of undeveloped areas and entertainment/commercial/industrial uses.
All project development will be within Section 23, Township 2 North, Range 10 West. The Vicinity and
Topographic Map is enclosed as Figure 1.
3.0 SOIL SURVEY AND TOPOGRAPHIC RESEARCH
According to the Web Soil Survey (WSS), prepared by the Natural Resources Conservation Service
(NRCS), the project site is mapped as Urban Land (533) soil type. This soil type is not listed as a hydric
soil on the NRCS National Hydric Soils List: Hydric Soils of the United States or the St. Clair County
Hydric Soils List. The project site is located within the Mississippi River 100-year floodplain.
Port of East St. Louis EA Appendix E - Wetland Delineation
Page E-4 of 18

A U.S. Geological Survey (USGS) Topographic Map and National Wetlands Inventory (NWI) map were
reviewed for information concerning the project site. The USGS map is a reproduction of a portion of the
USGS topographic map for the Cahokia, Illinois-Missouri quadrangle, dated 1993 (photo-revised 1998).
Copies of the USGS topographic and NWI maps are enclosed as Figures 1 and 2, respectively. According
to these maps, the topography of the project site is relatively level. Surface topography observed on the
date of the field investigation appeared to generally coincide with the topography depicted on the USGS
map. It was evident that the majority of the project site has been previously disturbed from historical
construction of the levee and railroad which brackets the boundaries of the property.
4.0 SITE RECONNAISSANCE AND CONDITION SUMMARY
Since the site is located east of the Mississippi River and within the 100-year floodplain and based on
historical topographic maps and the NWI maps, suspect areas on the site were explored for wetland and
waterbody characteristics. A photographic summary of the representative site conditions is included as
Appendix A. Included in Appendix B are the Wetland Determination Data Forms - Midwest Region for
the suspect wetland areas. The conditions summarized below are mapped on the Wetland Delineation
and Aerial Photograph, enclosed as Figure 3.
The site is undeveloped, with the exception of the levee, railroad tracks, and the recently-placed gravel fill
that has been placed for an access road (See Appendix A). The site exists between the levee and railroad
tracks, which border the site to the east. Monsanto Avenue exists near the southern boundary. Predominant
vegetation consists of Festuca arundinaea, Pooidaea spp., Ambrosia trifida, and Carex alopedoidea.
During our September 18, 2013 site visit, no wetlands or waterbodies were observed within the site
boundaries. SCI also surveyed the northern portion of the subject site in 2012. During that site visit, no
wetlands were observed within the subject site boundaries.
5.0 CONCLUSION
Based on our September 2013 field investigation, no wetlands were identified within the project site.
Therefore, a Section 404 Permit from the USACE and a Section 401 Water Quality Certification from the
IEPA should not be required. The USACE has the sole authority to determine if wetlands or waterbodies
exist on the site.
Port of East St. Louis EA Appendix E - Wetland Delineation
Page E-5 of 18

6.0 LIMITATION
This report has been prepared for the exclusive use of Terra Engineering. SCI is not responsible for
independent conclusions or recommendations made by others. Furthermore, written consent must be
provided by SCI should anyone other than our client wish to excerpt, or rely on the contents of this report.
The findings of this report are valid as of the present date of the delineation. SCI is not responsible for
surveys, calculations, or plans that were prepared by others.
Changes in surface and subsurface conditions of a property can occur with the passage of time, whether
due to natural processes or the works of man on this or adjacent properties. In addition, changes in
applicable or appropriate standards may occur, whether they result from legislation, the broadening of
knowledge, or other reasons. Accordingly, the findings of this report may be invalidated in whole or in
part by changes outside our control.
Port of East St. Louis EA Appendix E - Wetland Delineation
Page E-6 of 18

® SCALE 1" = 2000' FIGURE 1
PROJECT NAMEPORT OF EAST SAINT LOUIS -NORTH CAHOKIA TRACT
SAUGET, ILLINOIS
VICINITY AND TOPOGRAPHIC MAPRCVDRAWN BY
CHECKED BY JAFJOB NUMBER
2013-3194.30DATE
10/2013
GENERAL NOTES/LEGENDUSGS TOPOGRAPHIC MAPCAHOKIA, ILLINOIS QUADRANGLEDATED 199810' CONTOURS
NOT TO SCALE
SITE
SITE
Port of East St. Louis EA Appendix E - Wetland Delineation
Page E-7 of 18

PEMC
PSS1A
PUBFx
PSS1Cx
PEMC
PEM/SS1APEM/SS1A
PEMC
PEMC
PSS1/EMAPUBGx
PEMA
PSS1A
PSS1A
PEMA
PUBFx
PFO1C
PEMC
PEM/SS1A
PUBGx
PSS1A
PEMC
PEMC
PEMC
PEMA
PUBGx
PUBG
PEMA
PUBGx
PEMA
PEMA
PEMA
PEMA
PEMC
PEMC
PEMA
PEMA
PUBGx
PUBFx
PEMC
PEMC
PEMC
PEMC
PEMA
PEMAPFO1A
PFO1Cx
PUBGx
PEMA
PSS1A
PUBGx
PUBGx
PFO1A
PEMA
PUBGx
PUBGx
PEMCh
PEMA
PFO1A
PSS1A
PEM/SS1C
PSS1/EMA
PEMAf
PSS1/EMA
PEM/FO1A
PFO1A
PFO1A
PEMC
PEMC
PEMA
PEMC
PEMFx
PEM/SS1A
PEMC
PUBFx
PFO1C
PEMA
PSS1C
PUBF
PEMC
PUBGx
PEMA
PSS1A
PSS1A
PUBGx
PFO1A
PUBGx
PEMC
PFO1A
PFO1A
PUBGx
PSS1/EMC
PEMC
PEMA
PUBGx
PUBGx
PEMA
PEMC
PEMC
R2UBH
® SCALE 1" = 1500' FIGURE 2
PROJECT NAMEPORT OF EAST SAINT LOUIS -NORTH CAHOKIA TRACT
SAUGET, ILLINOIS
NATIONAL WETLAND INVENTORY MAPRCVDRAWN BY
CHECKED BY JAFJOB NUMBER
2013-3194.30DATE
10/2013
GENERAL NOTES/LEGEND
USGS TOPOGRAPHIC MAPCAHOKIA, ILLINOIS QUADRANGLEDATED 199810' CONTOURS
SITE
NATIONAL WETLAND INVENTORY DATA OBTAINED FROM www.fws.gov.
Port of East St. Louis EA Appendix E - Wetland Delineation
Page E-8 of 18

!U
!U
!U
!U
fÐ #fÐ
#f Ð#
fÐ#f
Ð#
f
Ð#
APPROXIMATESITE BOUNDARY
S1 (2013)
S2(2013)
S6 (2012)
S9 (2012)
1
2
3 4
56
® SCALE 1" = 300' FIGURE 3
PROJECT NAMEPORT OF EAST SAINT LOUISNORTH CAHOKIA TRACT
SAUGET, ILLINOISWETLAND DELINEATION AND
AERIAL PHOTOGRAPHRCVDRAWN BY
CHECKED BY JAFJOB NUMBER2013-3194.30
DATE10/2013
GENERAL NOTES/LEGEND
AERIAL PHOTOGRAPH OBTAINED FROM ARCGIS ONLINE.DIMENSIONS AND LOCATIONS ARE APPROXIMATE; ACTUAL MAY VARY.DRAWING SHALL NOT BE USED OUTSIDE THE CONTEXT OF THE REPORTFOR WHICH IT WAS GENERATED.
+U INDICATES APPROXIMATE SOIL BORING LOCATIONINDICATES APPROXIMATE LOCATION AND DIRECTION OF PHOTOGRAPH
Port of East St. Louis EA Appendix E - Wetland Delineation
Page E-9 of 18

Appendix A
Port of East St. Louis EA Appendix E - Wetland Delineation
Page E-10 of 18

Photo 1. Facing east
Photo 2. Looking at new fill road, facing southeast
Port of East St. Louis EA Appendix E - Wetland Delineation
Page E-11 of 18

Photo 3. Base of levee, facing south
Photo 4. Standing on top of new fill road, facing north
Port of East St. Louis EA Appendix E - Wetland Delineation
Page E-12 of 18

Photo 5. Standing on top of new fill road, facing south
Photo 6. Standing on top of new fill road looking at levy, facing west
Port of East St. Louis EA Appendix E - Wetland Delineation
Page E-13 of 18

Appendix B
Port of East St. Louis EA Appendix E - Wetland Delineation
Page E-14 of 18

US Army Corps of Engineers Midwest Region – Interim Version
WETLAND DETERMINATION DATA FORM – Midwest Region Project/Site: City/County: Sampling Date:
Applicant/Owner: State: Sampling Point:
Investigator(s): Section, Township, Range:
Landform (hillslope, terrace, etc.): Local relief (concave, convex, none):
Slope (%): Lat: Long: Datum:
Soil Map Unit Name: NWI or WWI classification:
Are climatic / hydrologic conditions on the site typical for this time of year? Yes No (If no, explain in Remarks.)
Are Vegetation , Soil , or Hydrology significantly disturbed? Are “Normal Circumstances” present? Yes No
Are Vegetation , Soil , or Hydrology naturally problematic? (If needed, explain any answers in Remarks.)
SUMMARY OF FINDINGS – Attach site map showing sampling point locations, transects, important features, etc.
Hydrophytic Vegetation Present? Yes No Hydric Soil Present? Yes No Wetland Hydrology Present? Yes No
Is the Sampled Area within a Wetland? Yes No
Remarks:
VEGETATION – Use scientific names of plants.Dominance Test worksheet: Number of Dominant Species That Are OBL, FACW, or FAC: (A) Total Number of Dominant Species Across All Strata: (B) Percent of Dominant Species That Are OBL, FACW, or FAC: (A/B)
Prevalence Index worksheet: Total % Cover of: Multiply by: OBL species x 1 = FACW species x 2 = FAC species x 3 = FACU species x 4 = UPL species x 5 = Column Totals: (A) (B)
Prevalence Index = B/A = Hydrophytic Vegetation Indicators: Dominance Test is >50% Prevalence Index is 3.01 Morphological Adaptations1 (Provide supporting data in Remarks or on a separate sheet) Problematic Hydrophytic Vegetation1 (Explain) 1Indicators of hydric soil and wetland hydrology must be present, unless disturbed or problematic.
Absolute Dominant Indicator Tree Stratum (Plot size: ) % Cover Species? Status 1. 2. 3. 4. 5. = Total Cover Sapling/Shrub Stratum (Plot size: ) 1. 2. 3. 4. 5. = Total Cover Herb Stratum (Plot size: ) 1. 2. 3. 4. 5. 6. 7. 8. 9. 10. = Total Cover Woody Vine Stratum (Plot size: ) 1. 2. = Total Cover
Hydrophytic Vegetation Present? Yes No
Remarks: (Include photo numbers here or on a separate sheet.)
Port of East St. Louis-North Cahokia Real Estate Sauget/St. Clair 9/18/13
North Cahokia Real Estate IL S-1
M. Goodare and M. Eldridge S23-T2N-R10W
levee flat
N/A UTM 83
Urban Land (533) N/A
30'5
5
Y
FACWPopulus deltoides 1
3
33.33
15'
0 05 10
15 4520 80
5'70 350
Pooidaea spp.Toxicodenron radicans
Johnson grassAmbrosia trifidaSolidago spp.
50205101010
105
YYNNNN
UPLUPLFAC
FACUFAC
FACU
110 485Festuca arundinaea
4.41
Print FormReset FormPort of East St. Louis EA
Appendix E - Wetland Delineation
Page E-15 of 18
US Army Corps of Engineers Midwest Region – Interim Version
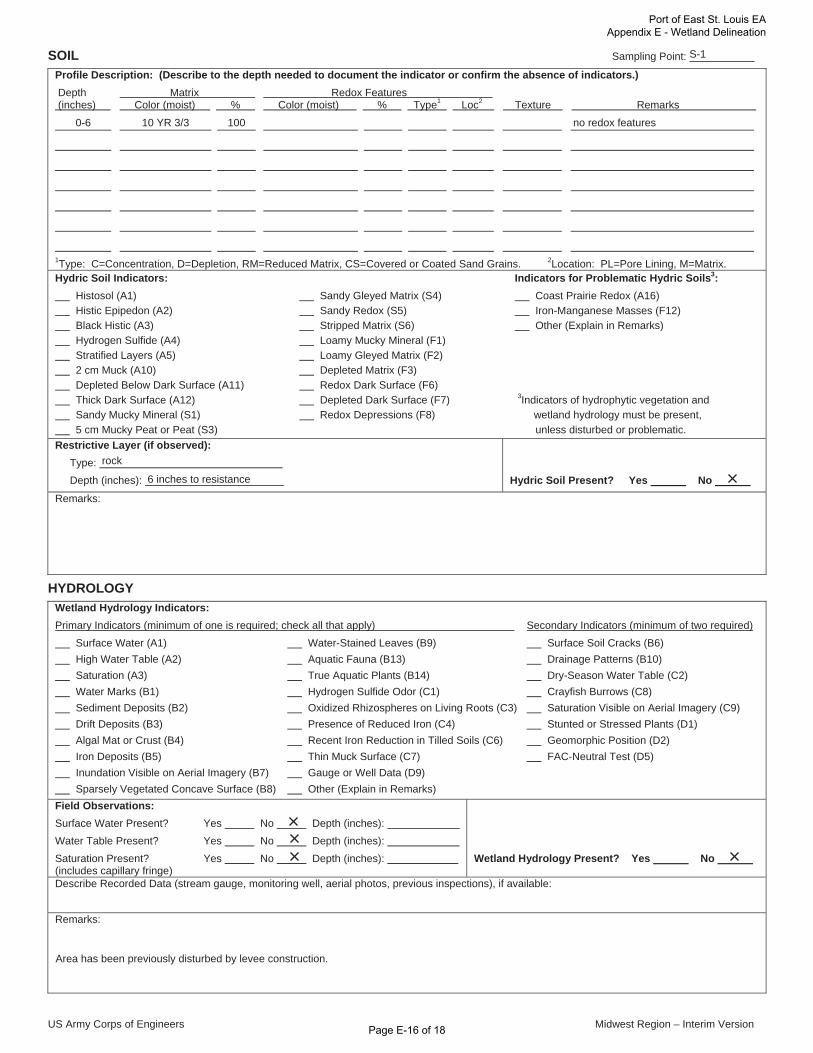
SOIL Sampling Point:
Profile Description: (Describe to the depth needed to document the indicator or confirm the absence of indicators.) Depth Matrix Redox Features (inches) Color (moist) % Color (moist) % Type1 Loc2 Texture Remarks
1Type: C=Concentration, D=Depletion, RM=Reduced Matrix, CS=Covered or Coated Sand Grains. 2Location: PL=Pore Lining, M=Matrix.Hydric Soil Indicators: Indicators for Problematic Hydric Soils3: Histosol (A1) Sandy Gleyed Matrix (S4) Coast Prairie Redox (A16) Histic Epipedon (A2) Sandy Redox (S5) Iron-Manganese Masses (F12) Black Histic (A3) Stripped Matrix (S6) Other (Explain in Remarks) Hydrogen Sulfide (A4) Loamy Mucky Mineral (F1) Stratified Layers (A5) Loamy Gleyed Matrix (F2) 2 cm Muck (A10) Depleted Matrix (F3) Depleted Below Dark Surface (A11) Redox Dark Surface (F6) Thick Dark Surface (A12) Depleted Dark Surface (F7) 3Indicators of hydrophytic vegetation and Sandy Mucky Mineral (S1) Redox Depressions (F8) wetland hydrology must be present, 5 cm Mucky Peat or Peat (S3) unless disturbed or problematic. Restrictive Layer (if observed): Type: Depth (inches):
Hydric Soil Present? Yes No
Remarks:
HYDROLOGY Wetland Hydrology Indicators: Primary Indicators (minimum of one is required; check all that apply) Secondary Indicators (minimum of two required) Surface Water (A1) Water-Stained Leaves (B9) Surface Soil Cracks (B6) High Water Table (A2) Aquatic Fauna (B13) Drainage Patterns (B10) Saturation (A3) True Aquatic Plants (B14) Dry-Season Water Table (C2) Water Marks (B1) Hydrogen Sulfide Odor (C1) Crayfish Burrows (C8) Sediment Deposits (B2) Oxidized Rhizospheres on Living Roots (C3) Saturation Visible on Aerial Imagery (C9) Drift Deposits (B3) Presence of Reduced Iron (C4) Stunted or Stressed Plants (D1) Algal Mat or Crust (B4) Recent Iron Reduction in Tilled Soils (C6) Geomorphic Position (D2) Iron Deposits (B5) Thin Muck Surface (C7) FAC-Neutral Test (D5) Inundation Visible on Aerial Imagery (B7) Gauge or Well Data (D9) Sparsely Vegetated Concave Surface (B8) Other (Explain in Remarks) Field Observations: Surface Water Present? Yes No Depth (inches): Water Table Present? Yes No Depth (inches): Saturation Present? Yes No Depth (inches): (includes capillary fringe)
Wetland Hydrology Present? Yes No
Describe Recorded Data (stream gauge, monitoring well, aerial photos, previous inspections), if available:
Remarks:
S-1
0-6 10 YR 3/3 100 no redox features
rock
6 inches to resistance
Area has been previously disturbed by levee construction.
Port of East St. Louis EA Appendix E - Wetland Delineation
Page E-16 of 18

US Army Corps of Engineers Midwest Region – Interim Version
WETLAND DETERMINATION DATA FORM – Midwest Region Project/Site: City/County: Sampling Date:
Applicant/Owner: State: Sampling Point:
Investigator(s): Section, Township, Range:
Landform (hillslope, terrace, etc.): Local relief (concave, convex, none):
Slope (%): Lat: Long: Datum:
Soil Map Unit Name: NWI or WWI classification:
Are climatic / hydrologic conditions on the site typical for this time of year? Yes No (If no, explain in Remarks.)
Are Vegetation , Soil , or Hydrology significantly disturbed? Are “Normal Circumstances” present? Yes No
Are Vegetation , Soil , or Hydrology naturally problematic? (If needed, explain any answers in Remarks.)
SUMMARY OF FINDINGS – Attach site map showing sampling point locations, transects, important features, etc.
Hydrophytic Vegetation Present? Yes No Hydric Soil Present? Yes No Wetland Hydrology Present? Yes No
Is the Sampled Area within a Wetland? Yes No
Remarks:
VEGETATION – Use scientific names of plants.Dominance Test worksheet: Number of Dominant Species That Are OBL, FACW, or FAC: (A) Total Number of Dominant Species Across All Strata: (B) Percent of Dominant Species That Are OBL, FACW, or FAC: (A/B)
Prevalence Index worksheet: Total % Cover of: Multiply by: OBL species x 1 = FACW species x 2 = FAC species x 3 = FACU species x 4 = UPL species x 5 = Column Totals: (A) (B)
Prevalence Index = B/A = Hydrophytic Vegetation Indicators: Dominance Test is >50% Prevalence Index is 3.01 Morphological Adaptations1 (Provide supporting data in Remarks or on a separate sheet) Problematic Hydrophytic Vegetation1 (Explain) 1Indicators of hydric soil and wetland hydrology must be present, unless disturbed or problematic.
Absolute Dominant Indicator Tree Stratum (Plot size: ) % Cover Species? Status 1. 2. 3. 4. 5. = Total Cover Sapling/Shrub Stratum (Plot size: ) 1. 2. 3. 4. 5. = Total Cover Herb Stratum (Plot size: ) 1. 2. 3. 4. 5. 6. 7. 8. 9. 10. = Total Cover Woody Vine Stratum (Plot size: ) 1. 2. = Total Cover
Hydrophytic Vegetation Present? Yes No
Remarks: (Include photo numbers here or on a separate sheet.)
Port of East St. Louis-North Cahokia Real Estate Sauget/St. Clair 9/18/13
North Cahokia Real Estate IL S-2
M. Goodare and M. Eldridge S23-T2N-R10W
fill road flat
N/A UTM 83
Urban Land (533) N/A
Data point taken on top of new fill road at southern tip of site.
30'
NI 0
2
0
15'
0 05 100 00 0
5'70 350
Pooidaea spp.Carex alopedoidea
50205
75
YYN
UPLUPL
FACWNININI
75 360Festuca arundinaea
4.80
Data point taken on top of new fill road at southern tip of site. Vegetation appears new and sparse.
Print FormReset FormPort of East St. Louis EA
Appendix E - Wetland Delineation
Page E-17 of 18
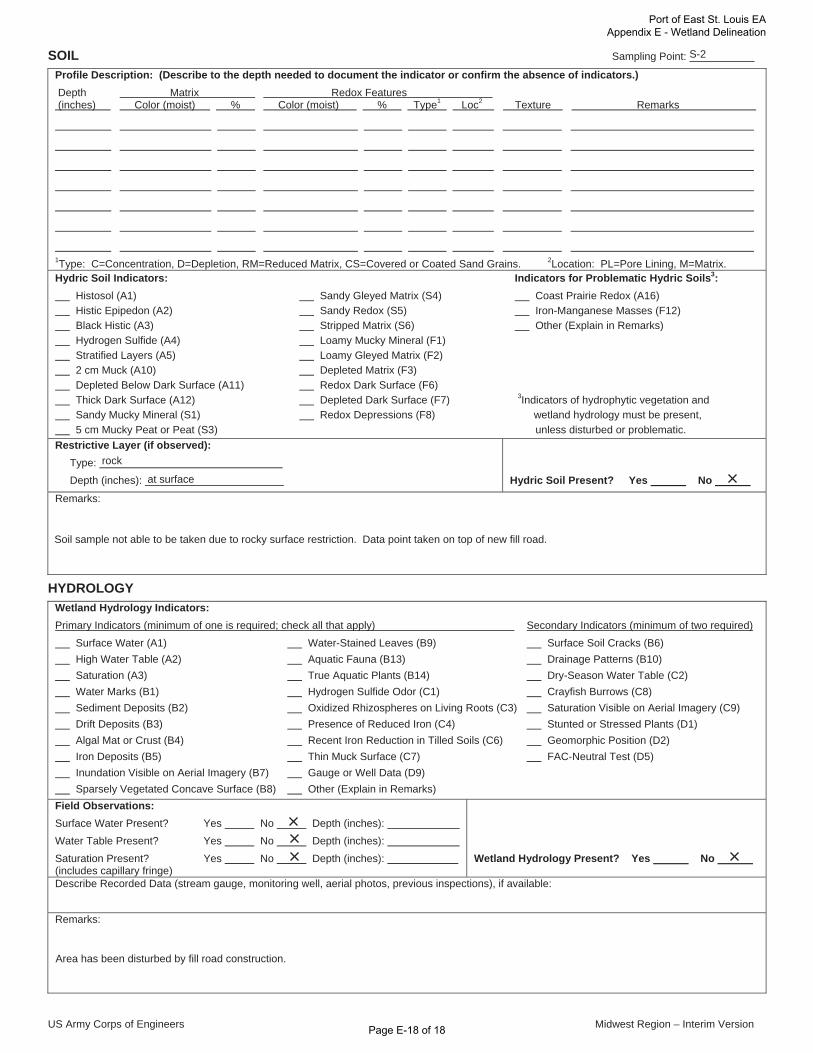
US Army Corps of Engineers Midwest Region – Interim Version
SOIL Sampling Point:
Profile Description: (Describe to the depth needed to document the indicator or confirm the absence of indicators.) Depth Matrix Redox Features (inches) Color (moist) % Color (moist) % Type1 Loc2 Texture Remarks
1Type: C=Concentration, D=Depletion, RM=Reduced Matrix, CS=Covered or Coated Sand Grains. 2Location: PL=Pore Lining, M=Matrix.Hydric Soil Indicators: Indicators for Problematic Hydric Soils3: Histosol (A1) Sandy Gleyed Matrix (S4) Coast Prairie Redox (A16) Histic Epipedon (A2) Sandy Redox (S5) Iron-Manganese Masses (F12) Black Histic (A3) Stripped Matrix (S6) Other (Explain in Remarks) Hydrogen Sulfide (A4) Loamy Mucky Mineral (F1) Stratified Layers (A5) Loamy Gleyed Matrix (F2) 2 cm Muck (A10) Depleted Matrix (F3) Depleted Below Dark Surface (A11) Redox Dark Surface (F6) Thick Dark Surface (A12) Depleted Dark Surface (F7) 3Indicators of hydrophytic vegetation and Sandy Mucky Mineral (S1) Redox Depressions (F8) wetland hydrology must be present, 5 cm Mucky Peat or Peat (S3) unless disturbed or problematic. Restrictive Layer (if observed): Type: Depth (inches):
Hydric Soil Present? Yes No
Remarks:
HYDROLOGY Wetland Hydrology Indicators: Primary Indicators (minimum of one is required; check all that apply) Secondary Indicators (minimum of two required) Surface Water (A1) Water-Stained Leaves (B9) Surface Soil Cracks (B6) High Water Table (A2) Aquatic Fauna (B13) Drainage Patterns (B10) Saturation (A3) True Aquatic Plants (B14) Dry-Season Water Table (C2) Water Marks (B1) Hydrogen Sulfide Odor (C1) Crayfish Burrows (C8) Sediment Deposits (B2) Oxidized Rhizospheres on Living Roots (C3) Saturation Visible on Aerial Imagery (C9) Drift Deposits (B3) Presence of Reduced Iron (C4) Stunted or Stressed Plants (D1) Algal Mat or Crust (B4) Recent Iron Reduction in Tilled Soils (C6) Geomorphic Position (D2) Iron Deposits (B5) Thin Muck Surface (C7) FAC-Neutral Test (D5) Inundation Visible on Aerial Imagery (B7) Gauge or Well Data (D9) Sparsely Vegetated Concave Surface (B8) Other (Explain in Remarks) Field Observations: Surface Water Present? Yes No Depth (inches): Water Table Present? Yes No Depth (inches): Saturation Present? Yes No Depth (inches): (includes capillary fringe)
Wetland Hydrology Present? Yes No
Describe Recorded Data (stream gauge, monitoring well, aerial photos, previous inspections), if available:
Remarks:
S-2
rock
at surface
Soil sample not able to be taken due to rocky surface restriction. Data point taken on top of new fill road.
Area has been disturbed by fill road construction.
Port of East St. Louis EA Appendix E - Wetland Delineation
Page E-18 of 18