Embed Size (px)
Citation preview

Western Sydney Regional Odour Assessment
Prepared for the NSW Environment
Protection Authority
Eastern Creek, Kemps Creek & Erskine Park, NSW
Volume 1 - Main Report
February 2013

DISCLAIMER
This report was prepared by The Odour Unit Pty Ltd in good faith exercising all due care and attention, but no representation or warranty, express or implied, is made as to the relevance, accuracy, completeness or fitness for purpose of this document in respect of any particular user’s circumstances. Users of this document should satisfy themselves concerning its application to, and where necessary seek expert advice in respect of, their situation. The views expressed within are not necessarily the views of the Environment Protection Authority (EPA) and may not represent EPA policy.
© Copyright State of NSW and the Environment Protection Authority

THE ODOUR UNIT PTY LIMITED
PREPARED FOR THE NSW EPA WESTERN SYDNEY REGIONAL ODOUR ASSESSMENT P A G E | III
CONTENTS
1 INTRODUCTION ................................................................................................ 1
2 ASSESSMENT PHILOSOPHY .............................................................................. 3
2.1 Assessment Programme .......................................................................................... 3
2.2 Waste Management and Composting Facilities ....................................................... 5
2.2.1 Locations ............................................................................................................. 5 2.2.2 Principal operations ............................................................................................. 6
2.3 Complaints History ................................................................................................... 7
3 FIELD AMBIENT ODOUR ASSESSMENT METHODOLOGY ...................................... 9
3.1 Preamble .................................................................................................................. 9
3.2 FAOA Surveys Objective ....................................................................................... 10
3.3 FAOA Survey Measurements Methodology ........................................................... 19
3.4 Surveys Assessment Period .................................................................................. 22
3.5 Surveys Meteorological Conditions ........................................................................ 22
3.6 FAOA Odour Key Descriptors ................................................................................ 22
3.7 Odour Intensity Categories .................................................................................... 25
3.8 Odour Intensity & Frequency Criterion ................................................................... 26
3.9 Selection of Assessors ........................................................................................... 26
3.10 Size of Panel .......................................................................................................... 27
3.11 Recording of Meteorological Conditions ................................................................ 28
3.11.1 Wind conditions description ............................................................................... 29
3.12 Description of Assessment Areas .......................................................................... 31
4 INTERPRETATION OF RESULTS ........................................................................ 32
4.1 FAOA Map Plot Result ........................................................................................... 32
4.2 Interpretation of Survey Findings ........................................................................... 32

THE ODOUR UNIT PTY LIMITED
PREPARED FOR THE NSW EPA WESTERN SYDNEY REGIONAL ODOUR ASSESSMENT P A G E | IV
5 RESULTS ...................................................................................................... 35
5.1 3 September 2012 – Morning ................................................................................ 36
5.2 3 September 2012 – Evening ................................................................................ 41
5.3 4 September 2012 – Morning ................................................................................ 47
5.4 4 September 2012 – Evening ................................................................................ 51
5.5 5 September 2012 – Morning ................................................................................ 59
5.6 5 September – Evening ......................................................................................... 62
5.7 6 September – Morning ......................................................................................... 68
5.8 6 September – Evening ......................................................................................... 72
5.9 10 September 2012 – Evening .............................................................................. 76
5.10 11 September 2012 – Evening .............................................................................. 84
5.11 12 September 2012 – Afternoon ............................................................................ 92
5.12 Likely Sources of Non-Waste Based Facility Odours ............................................ 98
6 DISCUSSION ................................................................................................ 101
6.1 Main Findings ....................................................................................................... 102
6.2 Likely Sources of Waste-Based Facility Odours .................................................. 102
6.2.1 Global Renewables Facility Eastern Creek ..................................................... 102 6.2.2 Waste Management Assets Corporation Landfill ............................................ 104 6.2.3 SITA SAWT Facility Kemps Creek .................................................................. 105
6.3 Non-Detectable Waste Facilities .......................................................................... 107
6.4 Other Odour Sources ........................................................................................... 107
6.5 Likely Process Sources of Significant odours ...................................................... 108
7 CONCLUSIONS ............................................................................................ 111
8 REPORT SIGNATURE PAGE .......................................................................... 113
8.1 Acknowledgements .............................................................................................. 114

THE ODOUR UNIT PTY LIMITED
PREPARED FOR THE NSW EPA WESTERN SYDNEY REGIONAL ODOUR ASSESSMENT P A G E | V
FIGURES, PHOTO, TABLES & APPENDICS FIGURES Figure 2.1 – Overview Map: Western Sydney Waste & Composting Facilities ......................... 5
Figure 2.2- Odour Complaints November 2011 to August 2012 .............................................. 8
Figure 3.1 – Area 1 FAOA Survey Map Template .................................................................. 11
Figure 3.10 – Key odour descriptors used for the Western Sydney Regional Odour
Assessment .......................................................................................................................... 23
Figure 3.2 – Area 2 FAOA Survey Map Template ................................................................... 12
Figure 3.3 – Area 3 FAOA Survey Map Template ................................................................... 13
Figure 3.4 – Area 4 FAOA Survey Map Template ................................................................... 14
Figure 3.5 – Area 5 FAOA Survey Map Template ................................................................... 15
Figure 3.6 – Area 6 FAOA Survey Map Template ................................................................... 16
Figure 3.7 – Area 7 FAOA Survey Map Template ................................................................... 17
Figure 3.8 – Area 8 FAOA Survey Map Template ................................................................... 18
Figure 3.9 – An example of a survey map plot result showing 11 discrete measurements in
Assessment Area 4 .............................................................................................................. 21
Figure 3.11 – Description of wind conditions on FAOA map plots .......................................... 30
Figure 4.1 – Example of a map plot result ............................................................................... 34
PHOTO Photo 3.1 – Kestrel Anemometer apparatus in operation ........................................................ 28
TABLES Table 2.1 – Assessment programme August - October 2012 .................................................... 4
Table 2.2 – Principal activities at the facilities to date (October 2012) ...................................... 6
Table 2.3 – Colour scheme for logged odour complaints .......................................................... 7
Table 3.1 - VDI 3882 (Part 1) Odour Intensity Categories ....................................................... 25
Table 3.2 – Description of Assessment Areas ......................................................................... 31
Table 5.1 – List of odours detected but not characterised on the map plots ........................... 35
Table 5.2 – Non-waste facilities odour locations ...................................................................... 99

THE ODOUR UNIT PTY LIMITED
PREPARED FOR THE NSW EPA WESTERN SYDNEY REGIONAL ODOUR ASSESSMENT P A G E | VI
Table 6.1 – Global Renewables Facility odours detected, likely on-site process source and
mitigation ............................................................................................................................ 109
Table 6.2 – SITA SAWT Facility odours detected, likely on-site process source and mitigation
........................................................................................................................................... 110
Table 6.3 – WAMC Landfill odours detected, likely on-site process source and mitigation .. 110
APPENDICES APPENDIX A: FAOA Survey Result Logsheets

THE ODOUR UNIT PTY LIMITED
PREPARED FOR THE NSW EPA WESTERN SYDNEY REGIONAL ODOUR ASSESSMENT P A G E | 1
1 INTRODUCTION
In August 2012, NSW Environment Protection Authority (NSW EPA) engaged The
Odour Unit Pty Ltd (TOU) to conduct a baseline regional odour assessment covering
the Eastern Creek, Erskine Park and Kemps Creek Precincts of Western Sydney. The
request for this assessment was in response to community odour complaints and
concerns in recent times regarding the level of odours suspected to be originating
from the activities undertaken at ten waste management and composting facilities (the
facilities) within these Precincts. The facilities covered in this assessment included:
Eastern Creek Precinct:
o Global Renewables Resource Recovery Facility (UR-3R Facility);
o Australian Native Landscapes (Eastern Creek);
o Waste Assets Management Corporation (WAMC) Landfill; and
o Veolia Environmental Services (Horsley Park) Landfill.
Kemps Creek Precinct:
o SITA SAWT Facility (Kemps Creek Landfill);
o Australian Native Landscapes (Badgerys Creek);
o Brandown Resource Recycling Facility and Landfill; and
o NSW Investments Landfill.
Erskine Park Precinct (includes St Clair, Colyton and Minchinbury areas):
o Dial-a-dump (Genesis) Landfill; and
o Transpacific Industries Landfill (Enviroguard).
The assessment commenced by the undertaking of a reconnaissance visit to all the
facilities on 30 August 2012 by TOU assessors, in order to become familiar with the
on-site processes and evaluating the potential odours that could be generated at the
facilities. The reconnaissance visit was followed by a series of Field Ambient Odour
Assessment (FAOA) surveys over a two week period, namely 3 - 12 September 2012,
covering morning, afternoon and evening periods.
The objective of the FAOA surveys was to develop a baseline assessment and
evaluate the extent of odour detectable beyond the site boundary of the facilities that

THE ODOUR UNIT PTY LIMITED
PREPARED FOR THE NSW EPA WESTERN SYDNEY REGIONAL ODOUR ASSESSMENT P A G E | 2
have the potential to adversely impact on sensitive receptors. The techniques
employed in the surveys were able to quantify and / or qualify the odour intensity,
odour character, extent of odour plume and the likely source of odours detected near
and far-field from the facilities. TOU understands that NSW EPA will use the
information generated in this assessment in ongoing community and industry
consultation, and to assist in prioritising odour mitigation efforts at those facilities
where the need for improvement is identified. The results presented in this study
reflect the state of the facilities during the undertaking of the FAOA surveys, and it
should not be presumed that they would prevail under similar conditions at any other
time.
The following odour assessment report summarises the results from the FAOA
surveys conducted at the facilities in the Eastern Creek, Erskine Park and Kemps
Creek Precincts of Western Sydney.

THE ODOUR UNIT PTY LIMITED
PREPARED FOR THE NSW EPA WESTERN SYDNEY REGIONAL ODOUR ASSESSMENT P A G E | 3
2 ASSESSMENT PHILOSOPHY
2.1 ASSESSMENT PROGRAMME
The project was divided into eight major components as follows:
1. Preliminary review of complaints history logged by the NSW EPA and any
relevant background material to the assessment that assisted in the
undertaking of the FAOA surveys;
2. Reconnaissance visit on 30 August 2012 by TOU assessors in order to become
familiar with on-site processes and the potential odours that could be generated
at the facilities;
3. Undertaking of FAOA Surveys between 3 – 12 September 2012;
4. Local Media field briefing on 10 September 2012 by NSW EPA and Terry
Schulz
5. Preliminary data entry and analysis;
6. Licensee consultation meeting on 17 September 2012 to discuss preliminary
results;
7. Community consultation meeting on 20 September 2012 to discuss preliminary
results; and
8. Final data entry and analysis plus reporting.
The schedule for the project has been summarised in Table 2.1. In total, 11 surveys
were carried out over the survey assessment period.

THE ODOUR UNIT PTY LIMITED
PREPARED FOR THE NSW EPA WESTERN SYDNEY REGIONAL ODOUR ASSESSMENT P A G E | 4
Table 2.1 – Assessment programme August 2012 - January 2013 Date FAOA Survey No. Time (hrs) Assessors
30 August Reconnaissance visit by TOU assessors
3 September 1 0600 – 1200 Team 1 2 1700 - 0000 Teams 2 & 3
4 September 3 0600 – 1300 Team 1 4 1630 - 2330 Teams 2 & 3
5 September 5 0600 – 1310 Team 1 6 1700 - 2200 Teams 2 & 3
6 September 7 0600 – 1200 Team 1 8 1700 – 2300 Teams 2 & 3
10 September Local Media briefing by NSW EPA and Terry Schulz 10 September 9 1900 - 0000 Team 1, 2 & 3 11 September 10 1900 - 0015 Team 1, 2 & 3 12 September 11 1330 – 1830 Team 1, 2 & 3
17 September 2012 Licensee consultation meeting 20 September 2012 Community consultation meeting
October 2012 – January 2013 Reporting

THE ODOUR UNIT PTY LIMITED
PREPARED FOR THE NSW EPA WESTERN SYDNEY REGIONAL ODOUR ASSESSMENT P A G E | 5
2.2 WASTE MANAGEMENT AND COMPOSTING FACILITIES
2.2.1 Locations The facilities that were assessed are spread over a large geographical area in the
Eastern Creek, Kemps Creek and Erskine Park Precincts. Figure 2.1 below illustrates
the nominal location of the facilities at these Precincts.
Figure 2.1 –Overview Map: Western Sydney Waste & Composting Facilities
(Map source: Google Earth Maps)
THE ODOUR UNIT PTY LIMITED
PREPARED FOR THE NSW EPA WESTERN SYDNEY REGIONAL ODOUR ASSESSMENT P A G E | 6
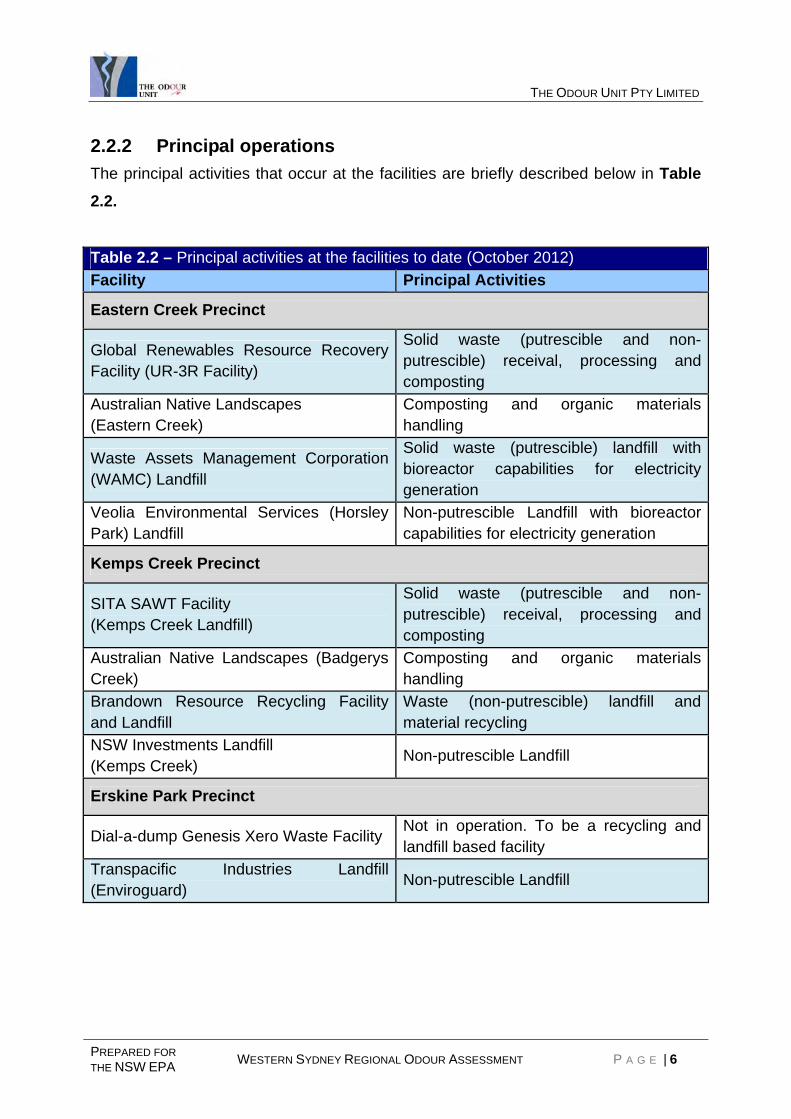
2.2.2 Principal operations The principal activities that occur at the facilities are briefly described below in Table 2.2.
Table 2.2 – Principal activities at the facilities to date (October 2012) Facility Principal Activities
Eastern Creek Precinct
Global Renewables Resource Recovery Facility (UR-3R Facility)
Solid waste (putrescible and non-putrescible) receival, processing and composting
Australian Native Landscapes (Eastern Creek)
Composting and organic materials handling
Waste Assets Management Corporation (WAMC) Landfill
Solid waste (putrescible) landfill with bioreactor capabilities for electricity generation
Veolia Environmental Services (Horsley Park) Landfill
Non-putrescible Landfill with bioreactor capabilities for electricity generation
Kemps Creek Precinct
SITA SAWT Facility (Kemps Creek Landfill)
Solid waste (putrescible and non-putrescible) receival, processing and composting
Australian Native Landscapes (Badgerys Creek)
Composting and organic materials handling
Brandown Resource Recycling Facility and Landfill
Waste (non-putrescible) landfill and material recycling
NSW Investments Landfill (Kemps Creek) Non-putrescible Landfill
Erskine Park Precinct
Dial-a-dump Genesis Xero Waste Facility Not in operation. To be a recycling and landfill based facility
Transpacific Industries Landfill (Enviroguard) Non-putrescible Landfill

THE ODOUR UNIT PTY LIMITED
PREPARED FOR THE NSW EPA WESTERN SYDNEY REGIONAL ODOUR ASSESSMENT P A G E | 7
2.3 COMPLAINTS HISTORY
The complaints history can provide valuable information about the odours being
experienced by the complainants. For the purposes of this study, complaints were
used as a means of mapping locations where incidences of odour complaints had
been logged, in order to ensure that the coverage of the surveys addressed those
areas experiencing adverse odour impact. According to data supplied by NSW EPA,
there have been over 400 formal odour complaints logged between November 2011
and August 2012 within the Eastern Creek, Kemps Creek and Erskine Park Precincts.
Figure 2.2 illustrates the coverage of formal complaints logged to the NSW EPA
EnviroLine Department Service. The colour-coding of each complaint point in Table 2.3 below refers to the complainant’s opinion on the source of the odour/s detected.
Table 2.3 – Colour scheme for logged odour complaints Label Colour Source
Blue SITA Eastern Creek ^ Light blue Genesis Dial-A-Dump Green Erskine Park Landfill Yellow SITA Kemps Creek Red Australian Native Landscapes White No source given ^ presumably referring to the Waste Assets Management Corporation Landfill

THE ODOUR UNIT PTY LIMITED
PREPARED FOR THE NSW EPA WESTERN SYDNEY REGIONAL ODOUR ASSESSMENT P A G E | 8
Figure 2.2- Odour Complaints November 2011 to August 2012 (Map source: Google Earth Maps)

THE ODOUR UNIT PTY LIMITED
PREPARED FOR THE NSW EPA WESTERN SYDNEY REGIONAL ODOUR ASSESSMENT P A G E | 9
3 FIELD AMBIENT ODOUR ASSESSMENT METHODOLOGY
Given the large geographical coverage in which the assessment had to span (see
Section 2: Figure 2.1), the surveys were conducted by three teams, with each team
consisting of two odour assessors. Each odour assessor was fully calibrated and
trained, with between 1 and 10 years of experience. Initially, each team was directed
to carry out a survey in either the morning, afternoon or evening periods, with each
covering a different area. The first four morning surveys were carried out by one team,
with the late afternoon / evening surveys carried out by the other two teams. This
technique was modified after the first week of assessments, such that all three teams
conducted evening surveys simultaneously across the entire assessment area. Based
on complaint data, the most frequent time complaints are lodged in the evenings. In an
effort to coincide the surveys with stronger wind conditions an afternoon session was
carried out on the final day of the fieldwork (see Assessment program Section 2: Table 2.1).
The following section details the FAOA survey methodology utilised for this
assessment.
3.1 PREAMBLE
The undertaking of a FAOA survey by TOU is based on the German Standard VDI
3940 “Measurement of Odour Impact by Field Inspection”. This standard prescribes
the methods by which field technicians (assessors) determine, define and document
observed ground level odours and the manner in which the determination of these
odours is defined in relation to odour character, frequency of odours observed and the
odour intensity of those individual observations as a quantitative scale of measure.
With this method, a panel of calibrated and experienced assessors conduct a single
measurement(s) at discrete measurement points (a grid defined within the surveyed
odour plume) within a pre-determined assessment area downwind of the odour
source(s). For this assessment, the Eastern Creek, Kemps Creek and Erskine Park
Precincts where divided into 8 separate (but conjoined) map areas. These map areas

THE ODOUR UNIT PTY LIMITED
PREPARED FOR THE NSW EPA WESTERN SYDNEY REGIONAL ODOUR ASSESSMENT P A G E | 10
and corresponding grid reference points were used as map templates to guide the
assessors strategically upwind and downwind of the facilities, according to the
prevailing wind condition at the time of undertaking the survey. Put simply, each
assessment area was selected on the basis of the prevailing wind condition as it
related to the odour source being assessed.
Figures 3.1-3.8 present the map templates for each assessment area and highlight
the facilities existing within that region.
3.2 FAOA SURVEYS OBJECTIVE
In general, the objective of a survey was to determine the ‘decay’ or loss of intensity of
odours observed downwind of the odour source/s, thus defining the actual odour
impact and the impact range. Within the impact range the magnitude of the potential
odour impact can be defined by determining the maximum distance at which the
clearly recognisable odour is detectable. It is important to understand that it was not
necessary for the odour to be present at problematic odour levels at either the
assessment point or in neighbouring residential areas during the surveys for the
assessment procedure to be successful, since the primary objective of the project was
to identify those waste facilities with the potential to be a cause of a portion of the
odour complaints received. As it happened, the relatively light winds encountered
during the surveys resulted in clear indications of air and odour movement from
several facilities into the community, due to the sensitivity of the assessment
methodology, and despite a general finding of relatively low levels of waste-based
odour beyond the plant boundaries. It is reasonable to qualitatively extrapolate survey
findings under light wind conditions to winds of stronger intensity, as it is to project
what is likely to happen if odour emission rates from the waste facility sources were to
be greater than those prevailing during the survey period.

THE ODOUR UNIT PTY LIMITED
PREPARED FOR THE NSW EPA
WESTERN SYDNEY REGIONAL ODOUR ASSESSMENT P A G E | 11
Figure 3.1 – Area 1 FAOA Survey Map Template (Map source: nearmap)

THE ODOUR UNIT PTY LIMITED
PREPARED FOR THE NSW EPA
WESTERN SYDNEY REGIONAL ODOUR ASSESSMENT P A G E | 12
Figure 3.2 – Area 2 FAOA Survey Map Template (Map source: nearmap)

THE ODOUR UNIT PTY LIMITED
PREPARED FOR THE NSW EPA
WESTERN SYDNEY REGIONAL ODOUR ASSESSMENT P A G E | 13
Figure 3.3 – Area 3 FAOA Survey Map Template
(Map source: nearmap)

THE ODOUR UNIT PTY LIMITED
PREPARED FOR THE NSW EPA
WESTERN SYDNEY REGIONAL ODOUR ASSESSMENT P A G E | 14
Figure 3.4 – Area 4 FAOA Survey Map Template
(Map source: nearmap)

THE ODOUR UNIT PTY LIMITED
PREPARED FOR THE NSW EPA
WESTERN SYDNEY REGIONAL ODOUR ASSESSMENT P A G E | 15
Figure 3.5 – Area 5 FAOA Survey Map Template
(Map source: nearmap)

THE ODOUR UNIT PTY LIMITED
PREPARED FOR THE NSW EPA
WESTERN SYDNEY REGIONAL ODOUR ASSESSMENT P A G E | 16
Figure 3.6 – Area 6 FAOA Survey Map Template
(Map source: nearmap)

THE ODOUR UNIT PTY LIMITED
PREPARED FOR THE NSW EPA
WESTERN SYDNEY REGIONAL ODOUR ASSESSMENT P A G E | 17
Figure 3.7 – Area 7 FAOA Survey Map Template
(Map source: nearmap)

THE ODOUR UNIT PTY LIMITED
PREPARED FOR THE NSW EPA
WESTERN SYDNEY REGIONAL ODOUR ASSESSMENT P A G E | 18
Figure 3.7 – Area 7 FAOA Survey Map Template
Figure 3.8 – Area 8 FAOA Survey Map Template
(Map source: nearmap)

THE ODOUR UNIT PTY LIMITED
PREPARED FOR THE NSW EPA WESTERN SYDNEY REGIONAL ODOUR ASSESSMENT P A G E | 19
3.3 FAOA SURVEY MEASUREMENTS METHODOLOGY
Each measurement cycle comprised 60 individual ‘grab’ assessments of odour every
10 seconds for a single measurement cycle of 10 minutes. When plotted each grab
measurement resulted in a single data point. Where no odours were detectable within
5 minutes of the assessment, the measurement cycle was truncated to 30 grab
measurements over the 5-minute period. This truncation was necessary to cover a
reasonable amount of ground, given the extent of survey coverage, and focus mainly
on those locations where odour was most likely to be prevalent.
By its nature, a FAOA survey result comprises the individual discrete assessment
results for each assessor at each location tested, as well as the combined results for
each member of the three teams of two, across the selected assessment area. This
technique generated a large database of results; in this case approximately 30,000
individual ‘sniffs’ by the assessors.
Overall, each survey utilised a panel of six assessors, divided in teams of two, with
each assessor undertaking 6-15 single measurement sets over the assessment areas.
Given the size of the raw data set for this project it was determined that the data would
best be interpreted by a visual-based method whereby each team assessment finding
would be plotted and colour-coded over an aerial photo of the assessment area.
For every single measurement the panel assesses the presence, character and
intensity of any observed odours, and records the prevailing wind direction and speed.
Each survey was designed to collect a multitude of single measurements per
measurement day, over a 5-6 hour period, and interpret those results in an easily-
understood manner.
The study was less about finding adverse odour impacts and more about determining
the source of odours present in the community.

THE ODOUR UNIT PTY LIMITED
PREPARED FOR THE NSW EPA WESTERN SYDNEY REGIONAL ODOUR ASSESSMENT P A G E | 20
An example of how the results are presented in this assessment is shown in Figure 3.9; which represents survey results on the evening of 4 September 2012 at
Assessment Area 4 between 1630hrs to 2330hrs. In this instance, the survey was
conducted by recording 2 single measurement sets (i.e. 1 per assessor) at 11 discrete
measurement points within the assessment area. The outcome of that survey provided
a dataset of 22 single measurement sets over the assessment area on that
measurement day. For each measurement point, the odour intensity, character and
likely source was determined.

THE ODOUR UNIT PTY LIMITED
PREPARED FOR THE NSW EPA
WESTERN SYDNEY REGIONAL ODOUR ASSESSMENT P A G E | 21
Figure 3.9 – An example of a survey map plot result showing 11 discrete measurements in Assessment Area 4
(Map source: nearmap)

THE ODOUR UNIT PTY LIMITED
PREPARED FOR THE NSW EPA WESTERN SYDNEY REGIONAL ODOUR ASSESSMENT P A G E | 22
3.4 SURVEYS ASSESSMENT PERIOD
The surveys periods were selected after consultation with the NSW EPA. This resulted
in the need to complete the field work for the project in a relatively short period of time,
prior to the planned second public meeting in late September 2012. As a result the
surveys were carried out from 3 - 12 September 2012.
3.5 SURVEYS METEOROLOGICAL CONDITIONS
Ideally, FAOA surveys should be carried out over a range of meteorological
conditions, from near-calm to moderate to strong wind speeds, and under differing
wind directions. The result of each FAOA survey would then determine the impact
range within that assessment area for that survey, and the overall finding represent a
broader picture of possible adverse odour impacts.
Unfortunately, the relatively short duration of the project coincided with a relatively
narrow range of wind speeds, although there was a reasonable range of wind
directions available for assessment. The findings of this project are therefore
restricted to the wind and weather conditions prevailing at the time of the assessment,
and the nature and condition of the various processes and activities carried out at
each of the ten waste facilities under investigation.
3.6 FAOA ODOUR KEY DESCRIPTORS
The odour sources at the facilities have their origins from the processes occurring at
each individual facility. Based on TOU’s experience, the reconnaissance visit and
early FAOA fieldwork, key odour descriptors were allocated, as shown Figure 3.10. The odour characters were divided into two categories, namely:
1. Waste facility odour: odour likely to be generated from the facilities; and
2. Non-waste facility odour: odour generated from other non-waste facility
based sources such as poultry farms, piggeries, animal manures, and

THE ODOUR UNIT PTY LIMITED
PREPARED FOR THE NSW EPA WESTERN SYDNEY REGIONAL ODOUR ASSESSMENT P A G E | 23
deodoriser sprays (used along the boundary fences on some of the waste
facilities).
Figure 3.10 – Key odour descriptors used for the Western Sydney Regional Odour
Assessment
The definition for each odour character presented in Figure 3.10 is as follows:
A = Biofilter / Earthy: refers to any odour generated from Alternative Waste
Treatment (AWT) Facilities biofilter-based odour control system (specifically
applies to Global Renewables Facility as no biofilter-based odours were found
to be within the vicinity of the SITA SAWT Facility and was restricted to the
Eastern Creek Precinct);
NB: MSW = Municipal Solid Waste, LFG = Landfill Gas, OGM = Organic Growth Medium. It is a
specific odour stemming from the Global Renewables Facility only

THE ODOUR UNIT PTY LIMITED
PREPARED FOR THE NSW EPA WESTERN SYDNEY REGIONAL ODOUR ASSESSMENT P A G E | 24
B = MSW / Garbage / Cheesy: refers to any odour arising from the handling
and/or processing of domestic municipal garbage/putrescible waste;
C = LFG / Mercaptan / Sulphur: refers to odour arising from the presence of
Landfill Gas and is specific for all active landfills capable of producing biogas;
D = Greenwaste / Herbacious: refers to any odour from the handling and/or
processing of municipal greenwaste;
E = OGM / Dry Compost: this odour character refers to two explicitly different
types of compost-based odours, that is:
o OGM – where explicitly stated, it refers to the MSW-derived compost
produced by the Global Renewables Facility.
o Dry Compost – where explicitly stated, it refers to any compost-derived
odour/s NOT originating from the MSW-derived compost (i.e. OGM)
produced by the GRL Facility. This character includes compost derived
odours originating from greenwaste, animal manures, and other
compostable material from either waste or non-waste based sources
(with the exception of GRL). This is based on TOU assessors over the
course of the study identifying that OGM has a unique odour character
than other compost based odours originating from other sources
detected in this study.
Both terms are used explicitly in this report unless the assessors determined
that they were detecting both types of the above compost odours
simultaneously.
F = Septic / Stale / Stagnant: refer to any odours from septic tanks and stale
dirty water;
G = Manure / Dirty: refers to odour arising from agricultural activities. It also
includes odours from piggery farm operations;
H = Deodoriser Spray: refers to odour arising from the masking agent used in
the spray systems around several of the facilities’ boundaries. This odour is
classified as non-waste facility based as it does not directly arise from
processing operations;

THE ODOUR UNIT PTY LIMITED
PREPARED FOR THE NSW EPA WESTERN SYDNEY REGIONAL ODOUR ASSESSMENT P A G E | 25
I = Poultry / Chicken Manure: refers to odour arising mainly from poultry and
chicken farm operations;
J = Ammonia: arising from soil enrichment products used around the farming
regions of Badgerys Creek and Kemps Creek region. It also refers an
ammonia-based odour generated at the SITA SAWT and Global Renewables
Facilities, where applicable; and K = Citrus / Fruity refers to odour detected that had a pleasant fruity character
whose source however could not be determined.
3.7 ODOUR INTENSITY CATEGORIES
The observed off-site odours are quantified according to the German Standard VDI
3882 Part 1. The category scale for judging odour intensity in the field is a quantitative
reference scale where assessors award one of the attributes in the Table 3.1 (below)
to the assessor’s odour impression.
An odour is clearly recognised (category of intensity 1) when the odour quality can be
clearly assigned.
Table 3.1 - VDI 3882 (Part 1) Odour Intensity Categories
Odour Strength Intensity Rank (code)
TOU Interpretation (meaning)
Not detectable 0 No odour detected
Very Weak 1 Odour recognised and where possible assigned to the odour source
Weak 2 Odour is weak but not yet distinct
Distinct 3 Odour is clearly distinct
Strong 4 Strong odour detectable
Very Strong 5 Very strong odour detectable
Extremely Strong 6 Extremely strong odour detectable

THE ODOUR UNIT PTY LIMITED
PREPARED FOR THE NSW EPA WESTERN SYDNEY REGIONAL ODOUR ASSESSMENT P A G E | 26
3.8 ODOUR INTENSITY & FREQUENCY CRITERION
Although outside the scope of work for this project, and referring to the Odour Intensity
Categories listed and described in Table 3.1 above, a particular odour intensity level
can often be linked to a possible odour impact from the facilities. This criterion,
whether it is Category 2 (Weak) or Category 3 (Distinct), will be dependent upon the
sensitivity of the receptor areas, the nature / offensiveness of the odours present and
the frequency of exposure. Odour Intensity Category 1 (very weak) would rarely, if
ever, correspond to adverse odour impacts.
Where more than one assessor has assessed that measurement point within the
FAOA survey, the results of the odour results documented are averaged to derive the
average frequency of each individually observed odour intensity i.e. for 2 assessors
assessing a single measurement point, the assessment is based on 120 individual
odour determinations.
3.9 SELECTION OF ASSESSORS
For the selection of assessors, as it relates to the VDI 3940 standard, the most
important selection criterion is currently odour sensitivity to n-butanol in nitrogen.
TOU specialises in, and stringently carries out Dynamic Olfactometry according to
Australian Standard AS/NZS4323.3:2001. TOU performs assessor n-butanol
calibrations before all olfactometry testing sessions in our laboratories, in addition to
the required primary calibration where each assessor is calibrated against n-butanol
from at least 10 dilution series collected on 3 different, non-consecutive days.
TOU has considerable data history on each panellist for their individual sensitivity to
the calibration reference gas n-butanol. Each assessor was selected from TOU’s pool
of calibrated odour panelists. VDI 3940 additionally recommends assessor calibration
data history for the reference gas hydrogen sulphide (H2S) when assessing hedonic
tone in concert with odour intensity. This methodology statement is only for odour
intensity determination and, as such, this recommendation is not applicable.

THE ODOUR UNIT PTY LIMITED
PREPARED FOR THE NSW EPA WESTERN SYDNEY REGIONAL ODOUR ASSESSMENT P A G E | 27
Optional tests, from VDI 3940, are used to determine the assessors’ ability to
discriminate odours of different intensities. The first test involves ranking 7 flasks of
different n-butanol concentrations (derived from VDI 3940). TOU has previously
undertaken this optional test on more than one occasion for other FAOA surveys and
found the results of this as poor, with only 2 of the panelists ranking them successfully.
The assessors considered the solutions ‘relatively weak’ and ‘too similar’ to be
compared to the VDI intensity scale. As such TOU does not rely on this optional test
when selecting assessors.
The second optional test utilises the triangle method where each assessor must
discern between 3 bags of odorants, 2 identical and 1 different, to identify the different
sample by either intensity or quality. This test is routinely chosen to be performed
before each survey when TOU considers that the assessors have been ‘out of
practice’ for undertaking FAOA surveys. The assessors are not aware which bag has
the reference gas n-butanol. This method was used for this assessment, where 2
identical bags were filled with pure nitrogen gas (N2) and 1 with n-butanol gas was
used to calibrate each assessor before the commencement of each FAOA survey.
As a general rule, TOU’s Sydney office undertakes dynamic olfactometry
assessments within the range of 500 – 900 odour tests annually. As a consequence
TOU’s assessors are highly skilled for olfactory analyses. As part of TOU’s laboratory
olfactometry analyses, TOU also undertakes laboratory derived intensity assessments
on individual odour samples where the assessors are exposed to laboratory conditions
of odour intensity determination. Additionally, TOU also undertakes a high volume of
FAOA surveys annually which exposes assessors to a variety of odour sources in the
field.
3.10 SIZE OF PANEL
According to the German Standard VDI 3940 “the pool of assessors should consist of
four times as many assessors as are needed for one measurement day, and of not
less than ten persons. The size of the panel should be chosen appropriate to the
objective of the survey”.

THE ODOUR UNIT PTY LIMITED
PREPARED FOR THE NSW EPA WESTERN SYDNEY REGIONAL ODOUR ASSESSMENT P A G E | 28
Typically, 2 to 3 FAOA assessors per measurement day are required. If for example
the plume was considered wide reaching, the objective of the survey may be to
observe the entire plume width and intensity and therefore more than 3 persons may
be deployed.
TOU utilised 2 assessors as a minimum per FAOA survey, one of which acts as a
coordinator for the group of assessors.
3.11 RECORDING OF METEOROLOGICAL CONDITIONS
Meteorological conditions were recorded using a Kestrel 4500 Pock Weather Tracker
Anemometer (see Photo 3.1 for illustration of setup). At each measurement point on
the maps, the team would setup the anemometer apparatus enabling for real-time
measurement of local temperature, wind speed and direction at a measurement
location point (see Section 4 for details) over each 10-min measurement cycle. This
was undertaken during every survey at each measurement point.
Photo 3.1 – Kestrel Anemometer apparatus in operation (Source: The Odour Unit Pty Ltd)

THE ODOUR UNIT PTY LIMITED
PREPARED FOR THE NSW EPA WESTERN SYDNEY REGIONAL ODOUR ASSESSMENT P A G E | 29
3.11.1 Wind conditions description
The prevailing wind condition presented in each map plot result reflects the wind
speed and direction at the time of survey based on local meteorological stations. As
mentioned later in Section 4.2, there is a range of factors that determine wind
direction and speed at a given point in time and therefore the local wind condition
experienced at particular MLP may differ slightly from the prevailing winds reported for
the survey period. Figure 3.11 describes how the wind condition labels on the FAOA
map plots should be interpreted.

THE ODOUR UNIT PTY LIMITED
PREPARED FOR THE NSW EPA
WESTERN SYDNEY REGIONAL ODOUR ASSESSMENT P A G E | 30
Figure 3.11 – Description of wind conditions on FAOA map plots
(Map source: nearmap)
Prevailing wind condition based on local meteorological stations
Local wind direction experienced at a MLP (as measured by the Kestrel Anemometer)

THE ODOUR UNIT PTY LIMITED
PREPARED FOR THE NSW EPA WESTERN SYDNEY REGIONAL ODOUR ASSESSMENT P A G E | 31
3.12 DESCRIPTION OF ASSESSMENT AREAS
Table 3.2 lists the facilities residing in each of the assessment areas. Depending on
wind condition, each assessment area enabled an assessor to gauge upwind and
downwind impacts from the facilities (where suitable access was available).
Table 3.2 – Description of Assessment Areas
Assessment Area No Precinct Facilities within assessment area
1 Erskine Park ^ Dial-a-dump (Genesis) Landfill
2 Erskine Park n / a
3 Erskine Park^ Transpacific Industries Landfill (Enviroguard)
4 Eastern Creek
Global Renewables Resource Recovery Facility (UR-3R Facility)
Australian Native Landscapes (Eastern Creek)
Waste Assets Management Corporation (WAMC) Landfill Veolia Environmental Services (Horsley Park) Landfill
5 Kemps Creek n / a
6 Kemps Creek SITA SAWT Facility (Kemps Creek Landfill)
7 Kemps Creek
Australian Native Landscapes (Badgerys Creek) NSW Investments Landfill
8 Kemps Creek Brandown Resource Recycling Facility and Landfill
^ as previously mentioned this includes St Clair, Colyton and Minchinbury areas

THE ODOUR UNIT PTY LIMITED
PREPARED FOR THE NSW EPA WESTERN SYDNEY REGIONAL ODOUR ASSESSMENT P A G E | 32
4 INTERPRETATION OF RESULTS
4.1 FAOA MAP PLOT RESULT
The following section contains the findings of each FAOA Survey conducted over the
7 day assessment period. The logsheets for each FAOA survey, showing the raw field
data, have been appended as Appendix A.
4.2 INTERPRETATION OF SURVEY FINDINGS
Each map plot result shown consists of several features. These are generally depicted
on a pie chart and wind vane indicator on each map plot. The features include:
A measurement location point (MLP): these are strategic points on the
map were designed to enable assessors to pursue upwind and downwind
effects from the facilities;
Location wind conditions: the local wind direction and speed at each MLP
has been indicated by a yellow arrow. In the event a wind direction has not
been indicated, the conditions at the time were calm (i.e. < 1 m/s) and wind
direction was unable to be accurately determined. The recorded wind
conditions at each MLP varied at time from the prevailing wind conditions
(see further details below);
Prevailing wind: this is the wind conditions that existed in the general
Sydney precinct at the time of the assessment and has been obtained from
the local meteorological stations. Given the complex meteorological
dynamics that can occur arising (such as local terrain, topography, katabatic
channelling and effects from natural and built environments) affecting wind
direction and speed, the local wind conditions experienced at some
measurement points varied from the prevailing wind condition; and

THE ODOUR UNIT PTY LIMITED
PREPARED FOR THE NSW EPA WESTERN SYDNEY REGIONAL ODOUR ASSESSMENT P A G E | 33
Odour descriptors: at each MLP where a measurement cycle was
undertaken, key parameters were recorded in the event an odour was
detected (methodology for this has been previously described in Section 3).
The key descriptors shown on the maps includes the intensity of odour (how
strong the smell was) based on the VDI 3882 German Odour Intensity
Scale. In addition, the odour character was also recorded based on an
odour character inventory developed by TOU to describe the range of
odours encountered throughout the course of the surveys. These have been
categorised as either waste or non-waste facility based odour (i.e. whether
the odour detected at a MLP originated from the facilities or others). Where
an odour character has not been assigned at a particular MLP, it is
representative that the odour detected could not be characterised as either
a waste or non-waste facility odour. The occurrences of these events over
the course of the study have been summarised in Section 5: Table 5.1.
As previously mentioned in Section 3, given the large geographic distances between
each assessment precinct, the survey maps were divided in eight conjoined
assessments areas (i.e. Areas 1 – 8). Each assessment area consists of location
points indicating the nominal location where a measurement cycle was undertaken.
The location points are uniquely identified by a 3 digit numeric system. The first digit
indicates the Assessment Area No. with the subsequent two digits indicating the
unique MLP.
An example of a survey map plot result is shown in Figure 4.1. In this case, MLP 4-18
indicates that a discrete measurement was carried out at assessment area 4 at
location point 18. At each MLP, the Kestrel Anemometer was setup to record
important meteorological parameters at that point (see Section 3.8 for details).

THE ODOUR UNIT PTY LIMITED
PREPARED FOR THE NSW EPA
WESTERN SYDNEY REGIONAL ODOUR ASSESSMENT P A G E | 34
Figure 4.1 – Example of a map plot result
(Map source: nearmap)