Embed Size (px)
Citation preview
IN WESTERN AUSTRALIAPETROLEUM
WESTERN AUSTRALIA’S DIGEST OF PETROLEUM EXPLORATION, DEVELOPMENT AND PRODUCTION
SEPTEMBER 2014

PWA SEPTEMBER 2014 1
Contents
Drilling Senecio 3
Pho
to ©
DM
P
ARTICLES
03 Minister’s message
04 Executive Director’s message
06 Release of 2014 Explorer’s Guide
08 A brief overview of activities in 2013/2014
10 Company focus: Buru operations update
14 Grant of petroleum titles
16 State areas released for petroleum exploration September 2014
19 Towards a deeper understanding of the Canning Basin
21 Is geothermal energy dead in WA?
24 Shale gas resource assessment in the Merlinleigh Sub-basin, Carnarvon Basin
30 A review of AS/NZS ISO 31000:2009 Risk Management
32 Geomechanical characterisation of CO2 storage sites
TABLES
40 Table 1. 2013 Production by field and cumulative production WA onshore and State waters as at 31 December 2013
41 Table 2a. Petroleum reserves estimates by basin for WA onshore, State waters and Territorial waters as at 31 December 2013 (metric units)
41 Table 2b. Petroleum reserves estimates by basin for WA onshore, State waters and Territorial waters as at 31 December 2013 (field units)
42 Table 3. Petroleum wells in Western Australia – onshore and State waters 2013/2014
42 Table 4. Surveys in Western Australia – onshore and State waters 2013/2014
43 Table 5. List of Petroleum and Geothermal Titles and Holders in Western Australia – onshore and State waters as at 4 August 2014
Department of Mines and Petroleum Petroleum Division Mineral House, 100 Plain Street East Perth, Western Australia 6004Tel: +61 8 9222 3622 Fax: +61 8 9222 3799www.dmp.wa.gov.au
Cover: Loading operations at the Port of Wyndham Photo © Buru Energy
Editor: Karina JonassonEmail: [email protected]
Disclaimer: The information contained in this publication is provided in good faith and believed to be reliable and accurate at the time of publication. However, the information is provided on the basis that a reader will be solely responsible for making their own assessment of the information and its veracity and usefulness.
The State shall in no way be liable, in negligence or howsoever, for any loss sustained or incurred by anyone relying on the information, even if such information is or turns out to be wrong, incomplete, out of date or misleading.

Government of Western AustraliaDepartment of Mines and Petroleum
Government of Western AustraliaDepartment of Mines and PetroleumEnvironment
FURTHER INFORMATIONRichard BrucePetroleum Division Department of Mines and PetroleumTelephone: +61 8 9222 3314Email: [email protected]: www.dmp.wa.gov.au/acreage_release
www.dmp.wa.gov.au/acreage_release
WESTERN AUSTRALIAOpportunities to ExploreBIDS INVITED FOR ACREAGE
PETROLEUM ACREAGECanning BasinInterest in the Canning Basin has revived significantly in recent years, with the oil discovery at Ungani and large estimates for shale gas. Mitsubishi, ConocoPhillips, Hess, and as of 2013, PetroChina and Apache are participating in Canning Basin exploration. There are four release areas in platform areas (Broome and Crossland Platforms), with one area partly in the Kidson Sub-basin. Area size ranges from 1770 km2 to 2407 km2. These release areas became available for gazettal by statutory relinquishment at the end of permit terms from Buru Energy Exploration Permits. The areas may be prospective for sub-salt Ordovician plays.
Southern Carnarvon BasinThere is one release area in the onshore Southern Carnarvon Basin. Area size is 1265 km2. Although an under-explored basin, geochemical studies indicate that Devonian and Permian oil and gas-prone source intervals are present across the
basin. The release area is considered prospective for Permian shale gas or tight gas, as well as pre-Permian oil.
Officer BasinThere are four large release areas (ranging in size from 10,925 km2 to 15,413 km2) in the Neoproterozoic central Officer Basin adjacent to the South Australian border. It appears that all the elements of a petroleum system are present. Good source beds and proven reservoirs capped by thick sections of salt or shale have been intersected. There may be sub-salt and unconventional hydrocarbons present. The Officer Basin resembles Neoproterozoic successions in Oman and Russia that contain commercial hydrocarbon resources.
Bids close on Thursday 23 April 2015.
Acreage release disk packages are available from DMP and a web version is also available: www.dmp.wa.gov.au/acreage_release
Acreage release packages contain relevant information about the release areas, land access and how to make a valid application for an Exploration Permit.
GEOTHERMAL ACREAGE Acreage is available for the whole of the State not covered by permits or applications. Application is by a Geothermal Special Prospecting Authority (GSPA) with Acreage Option (AO).
Companies are invited to apply for areas each with size up to 160 5’x5’ graticular blocks.
Companies interested in geothermal acreage are allowed to bid for multiple areas and are expected to drill at least one well during the first two years of obtaining a geothermal title.
Geothermal acreage information is available from DMP on the web at: www.dmp.wa.gov.au/acreage_release
Courtesy Key Petroleum
3PWA APRIL 2014
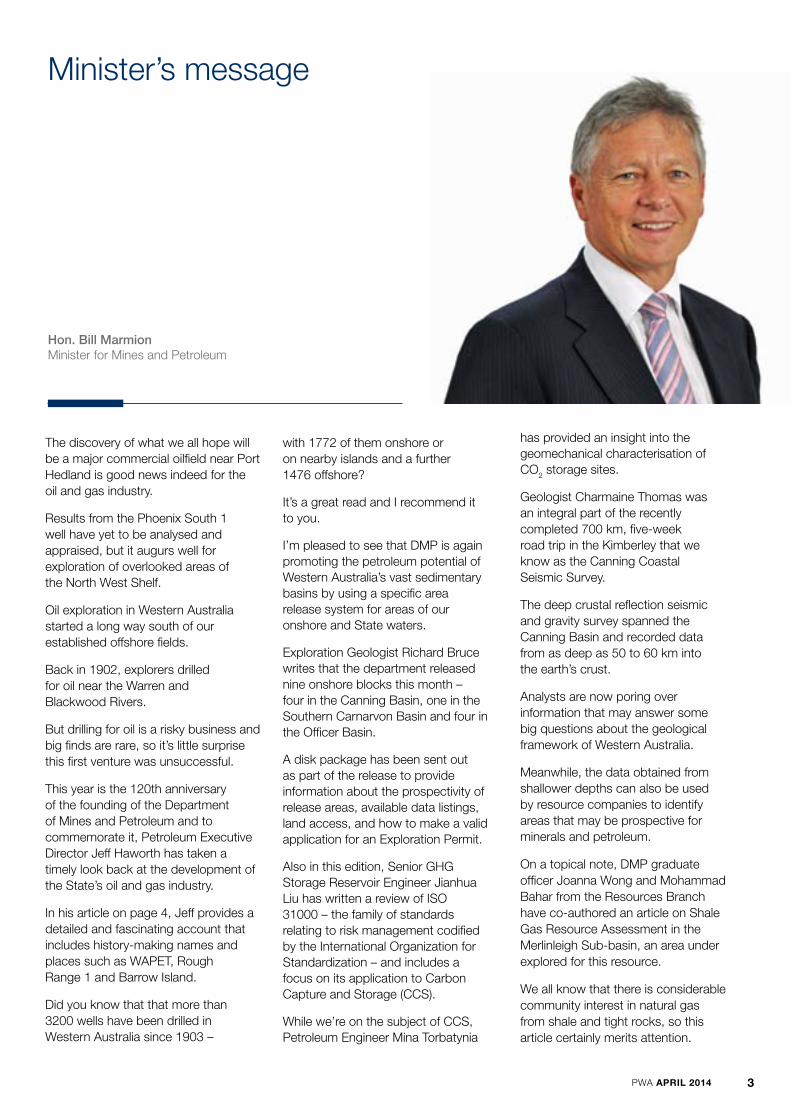
Minister’s message
Hon. Bill MarmionMinister for Mines and Petroleum
The discovery of what we all hope will be a major commercial oilfield near Port Hedland is good news indeed for the oil and gas industry.
Results from the Phoenix South 1 well have yet to be analysed and appraised, but it augurs well for exploration of overlooked areas of the North West Shelf.
Oil exploration in Western Australia started a long way south of our established offshore fields.
Back in 1902, explorers drilled for oil near the Warren and Blackwood Rivers.
But drilling for oil is a risky business and big finds are rare, so it’s little surprise this first venture was unsuccessful.
This year is the 120th anniversary of the founding of the Department of Mines and Petroleum and to commemorate it, Petroleum Executive Director Jeff Haworth has taken a timely look back at the development of the State’s oil and gas industry.
In his article on page 4, Jeff provides a detailed and fascinating account that includes history-making names and places such as WAPET, Rough Range 1 and Barrow Island.
Did you know that that more than 3200 wells have been drilled in Western Australia since 1903 –
with 1772 of them onshore or on nearby islands and a further 1476 offshore?
It’s a great read and I recommend it to you.
I’m pleased to see that DMP is again promoting the petroleum potential of Western Australia’s vast sedimentary basins by using a specific area release system for areas of our onshore and State waters.
Exploration Geologist Richard Bruce writes that the department released nine onshore blocks this month – four in the Canning Basin, one in the Southern Carnarvon Basin and four in the Officer Basin.
A disk package has been sent out as part of the release to provide information about the prospectivity of release areas, available data listings, land access, and how to make a valid application for an Exploration Permit.
Also in this edition, Senior GHG Storage Reservoir Engineer Jianhua Liu has written a review of ISO 31000 – the family of standards relating to risk management codified by the International Organization for Standardization – and includes a focus on its application to Carbon Capture and Storage (CCS).
While we’re on the subject of CCS, Petroleum Engineer Mina Torbatynia
has provided an insight into the geomechanical characterisation of CO2 storage sites.
Geologist Charmaine Thomas was an integral part of the recently completed 700 km, five-week road trip in the Kimberley that we know as the Canning Coastal Seismic Survey.
The deep crustal reflection seismic and gravity survey spanned the Canning Basin and recorded data from as deep as 50 to 60 km into the earth’s crust.
Analysts are now poring over information that may answer some big questions about the geological framework of Western Australia.
Meanwhile, the data obtained from shallower depths can also be used by resource companies to identify areas that may be prospective for minerals and petroleum.
On a topical note, DMP graduate officer Joanna Wong and Mohammad Bahar from the Resources Branch have co-authored an article on Shale Gas Resource Assessment in the Merlinleigh Sub-basin, an area under explored for this resource.
We all know that there is considerable community interest in natural gas from shale and tight rocks, so this article certainly merits attention.

4 PWA SEPTEMBER 2014
Executive Director’s message
Jeff Haworth Executive DirectorPetroleum Division
This year is the 120th anniversary of the creation of the Department of Mines and Petroleum, so I thought I would reminisce a little on the development of the petroleum industry in Western Australia and focus on the Department’s regulatory role during this time.
The first petroleum exploration wells, drilled in the Blackwood and Warren rivers area in 1902, were unsuccessful and other early exploration of the State was sporadic and also brought little success. The first concerted exploration drilling campaign began in the 1950s with West Australian Petroleum (WAPET) drilling the Rough Range 1 well near North West Cape and finding non-commercial oil in 1955. WAPET continued a statewide exploration campaign drilling wells in the Canning, Perth and Carnarvon Basins, but it wasn’t until 1964 that a commercially viable oilfield was discovered on Barrow Island.
The strategic value of oil and gas was recognised by the Commonwealth Government which created the Petroleum Search Subsidy Act 1957. This provided incentives to industry for petroleum exploration throughout Australia. The discovery of oil at Barrow Island was a part of this program.
During this period the Western Australian Government regulated the industry under the Petroleum Act 1936.
In 1967 the Petroleum Act 1967 (now the Petroleum and Geothermal Energy Resources Act 1967 [PGERA67]) together with the Commonwealth Petroleum (Submerged Lands) Act 1967 were passed to regulate the industry.
Oil and gas was discovered in the Mid West in 1966 at the Dongara field, which came into production in 1971 when the Parmelia gas pipeline was constructed to deliver gas to the metropolitan area. Several other gasfields were also discovered around Dongara, including Mondarra, Woodada, Warro, Yardarino and Gingin; some proved to be commercial while others were not. Further discoveries were made in the 1990s and 2000s, including the Tubridgi and Beharra Springs gasfields, the Eremia, Jingemia and Hovea oilfields and the offshore Cliff Head oil- and gasfield. More than 3200 wells have been drilled in Western Australia since 1903, 1772 of which were onshore or on nearby islands with a further 1476 offshore.
Woodside (then, the Burmah Oil Company of Australia) started exploring, along with others, off the coast in the North West Shelf area in the 1970s. During this time, there were significant gas discoveries made, such as North Rankin, Goodwyn, Gorgon, Scott Reef, and Scarborough to name a few, however these were not commercially viable at the time.
DMP regulated this exploration in the onshore areas and on behalf of the Commonwealth in the offshore as the Designated Authority. Regulation was conducted under a set of Schedules of Requirements for both areas and all activities conducted by companies required assessment and approval by DMP before commencement. All were subject to audit during operations by DMP inspectors.
In the 1980s the State Government underwrote the construction of the Dampier to Bunbury Natural Gas Pipeline which provided domestic gas from the North West Shelf to customers in the South West. The North Rankin and Goodwyn fields started production in 1984 and 1995, respectively, with Liquefied Natural Gas (LNG) export to Japan commencing in 1989.
It was also in the 1980s, 6 July 1988 to be specific, that the Piper Alpha disaster in the North Sea took place, killing 167 people. The subsequent Cullen Inquiry into the disaster recommended that regulation should move from prescriptive legislation to “objective based” regulation with a focus on risk identification and management. The Commonwealth, the States and the Northern Territory agreed to adopt this style of legislation in 1994 and moved towards replacing the existing Schedules with a set of regulations. The Commonwealth

PWA SEPTEMBER 2014 5
started this process first and Western Australia followed, with changes to its legislation starting in 2010. These included the Safety Regulations for the three State Acts, PGERA67, Petroleum (Submerged Lands) Act 1982 and the Petroleum Pipelines Act 1969. The Environment Regulations were introduced in 2012 and the final set of regulations, the Resource Management and Administration Regulations, are due to be introduced in the later part of this year.
The real boom in the offshore occurred from the 1990s onwards with the introduction of floating technology, subsea manifolds, multi-lateral wells and horizontal drilling in the North West Shelf. The introduction of floating production storage and offloading facilities (FPSOs), especially, allowed previously unviable oilfields to be brought into production. Again, DMP was heavily involved in the regulation of these new technologies, including the construction and management of high pressure, high volume gas production wells in deep water, ensuring the legislation and regulatory framework dealt with the safe, environmentally responsible development of the industry.
During this offshore boom time, the onshore gasfields were reaching the end of their commercial life and in recent years only one new commercial gasfield has been brought into production, the Red Gully/Gingin West field. Much has been said about the potential resources of natural gas in shale and tight rocks in Western Australia and this is seen as a potential replacement of the North West Shelf domestic gas supply, which is due to decline in 2020.
This industry is in its infancy in WA with only a few exploration wells drilled specifically for this target and no commercially viable fields discovered as yet. The US industry is harnessing technologies that have advanced from the days they were first used onshore, specifically horizontal drilling and hydraulic fracture stimulation. As mentioned previously, DMP has been regulating horizontal drilling in offshore areas since the 1990s and this type of hydraulic fracturing since early 2000.
As part of DMP’s regulatory role, it reviews other jurisdictions’ regulation of the industry, both nationally and internationally, and compares this to our own. The shale and tight rocks development has been around since
the 1980s in the US and officers of the DMP have watched its development with keen interest, as well as some officers visiting shale gas well sites in the US.
DMP had an independent review of its legislation in 2010, which concluded that the current regulation of the industry was robust. However, some changes were recommended to improve transparency. These recommendations have been implemented by DMP.
This department, along with other agencies in government, treats the shale and tight rock industry with the same due diligence as the rest of the petroleum industry to ensure operations are conducted in a safe, environmentally responsible manner. DMP manages this through a rigorous assessment and approvals system, followed up by compliance auditing of the operations. As the regulator, this department will continue to monitor the development of the onshore and offshore petroleum industry to ensure best practices are adhered to as it has done in the past, now and into the future, on behalf of the people of Western Australia.
DMP inspector auditing the Ungani facility
Pho
to ©
DM
P

6 PWA SEPTEMBER 2014
201
4 ED
ITIO
N
Western Australia’sPetroleum and Geothermal Explorer’s Guide
Wes
tern
Aus
tralia
’s P
etro
leum
and
Geo
ther
mal
Exp
lore
r’s G
uide
201
4 ED
ITIO
N
Release of Western Australia’s Petroleum and Geothermal Explorer’s Guide – 2014 Edition The 2014 edition of this highly sought after publication has been revised and updated to reflect recent changes to the legislation and regulations governing the petroleum and geothermal industries in Western Australia, in particular the Environment regulations and the Resource Management and Administration regulations.
The Explorer’s Guide provides general information to companies interested in exploring and investing in Western Australia’s upstream petroleum and geothermal energy industries.
Information in this guide relates to petroleum and geothermal energy resources in the State of Western Australia, its onshore and State Waters areas, including islands which are administered under the Petroleum and Geothermal Energy Resources Act 1967, the Petroleum (Submerged Lands) Act 1982, the Petroleum Act 1936 and the Petroleum Pipelines Act 1969.
All petroleum and geothermal operations must comply with all the relevant legislation.
This guide assists explorers with information on:
• The role of Government
• The geology and prospectivity of Western Australia’s sedimentary basins
• Geothermal energy resources
• Carbon capture and storage projects in Western Australia
• How to access data
• Petroleum and geothermal legislation and administration, resource management and environmental assessment and legislation
• Native title and land access
• Occupational safety and health
• Taxation and commercial aspects relating to petroleum and geothermal production
A digital copy of the Explorer’s Guide can be accessed via the DMP online ‘Publications Systems’ link at: www.dmp.wa.gov.au/8481.aspx
or from the petroleum publications page at: www.dmp.wa.gov.au/5592.aspx
Copies of this publication are available from: Public Counter, 1st Floor Mineral House, 100 Plain Street, East Perth.
The Public Counter is open from 8.30 am to 4.30 pm Monday to Friday.
7PWA SEPTEMBER 2014
Pho
to ©
AW
E L
imite
d

8 PWA SEPTEMBER 2014
A brief overview of activities in 2013/2014
Karina Jonasson Petroleum Resource GeologistPetroleum Division
Drilling
It has been quiet on the drilling front during the period from July 2013 to June 2014. Only two new wells were drilled since January, to add to the two others drilled between July and December as reported in the April edition of Petroleum in Western Australia. Summary tables for wells, seismic, and the 2013 production and reserves can be found at the back of this magazine.
On Barrow Island, two wells were drilled in July 2013 for the Gorgon Project as water disposal wells for the Gorgon Plant. These are Disposal Wells Z-WI1 and Z-WI2.
Ungani 3 spudded on 14 January 2014 in EP 391 in the Canning Basin. The well is located about 1000 m east of the central Ungani field. It was interpreted from the Ungani 3D seismic data to be a separate structure, targeting the Ungani Dolomite. Early reports indicated poor reservoir development in the main reservoir section. However wireline logs confirmed at least one zone with reservoir potential that will require further testing.
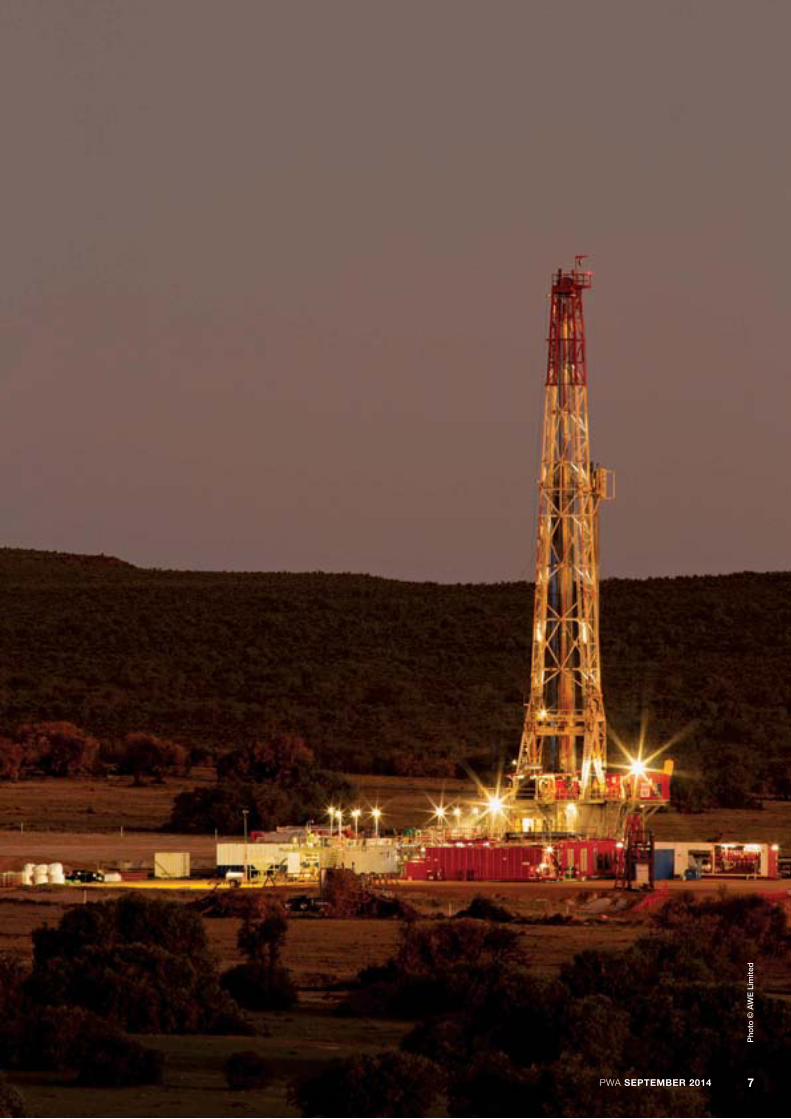
In the Perth Basin, the Drover 1 exploration well was spudded on 29 June 2014 by AWE in EP 455. Drover 1 is located on pastoral land in the Shire of Coorow, approximately
18 km southeast of Green Head and 220 km north of Perth.
The Drover 1 exploration well will be drilled vertically to a planned total depth of 2400 m and is designed to evaluate the unconventional gas potential in the southern area of AWE’s Perth Basin acreage.
Drover 1 is targeting the Kockatea and Carynginia shale formations, the Irwin River Coal Measures and the High Cliff Sandstone. A total of 21.5 m of core samples were collected from the Kockatea Shale and sent for analysis as well as a set of sidewall cores from the target formations. The well is expected to reach the total depth in mid-July.
Surveys
Five surveys were carried out in Exploration Permits during the period, all in the Canning Basin: EP 449 Airborne Gradiometry Survey for Hess; the EP 448 Geochemical Survey for Key Petroleum; and the Frome Rocks 2D Seismic Survey, Southern Canning Airborne Gravity Survey, and Ungani 3D Seismic Survey Resumption, all for Buru Energy.
Two surveys were carried out under Special Prospecting Authorities, both in the Perth Basin: the AGG-HRAM 2013 Aeromagnetic Survey for Finder Petroleum; and the Murgoo Gravity Survey for Palatine Energy.Enerdrill rig 3 at Drover 1 in the northern Perth Basin
Seismic line crew
Pho
to ©
Bur
u E
nerg
y
Pho
to ©
DM
P
PWA SEPTEMBER 2014 9
Workover Activity
Workover activities include one or more of a variety of remedial operations on a producing well to try to increase the production, maintain the well integrity or change the purpose of the well. Remedial operations can include setting a plug to isolate a water zone, tubing/packer replacement, squeeze cement and so on.
One recent example involves a plug set to isolate a lower production zone followed by perforation and testing of an upper zone at Red Gully 1. Another example is Whicher Range 4 ST1 where the well was suspended with a loss of tubing integrity. The workover was done to retrieve the existing tubing string and replace it with a new string of tubing.
Production
Thevenard Island is the hub where crude oil from six Chevron-operated offshore petroleum fields – Saladin, Roller, Skate, Yammaderry, Cowle, and Crest – is processed and prepared for shipment by ocean tanker to Australian refineries. The first oil from Thevenard Island operations flowed in 1989, and subsequent fields were brought into production in a staged development.
In December 2013, Chevron applied for abandonment of the Thevenard island fields, and received approval from DMP. Chevron indicated that all the fields ceased production in April 2014.
Two onshore fields continue on extended production tests, the Ungani oilfield in the Canning Basin (EP 391) and the Corybas gasfield in the northern Perth Basin (L 2).
Oil from the Ungani wells is trucked to the Port of Wyndham where it is loaded onto a tanker for shipment to Southeast Asian markets.
Gingin West 1 and Red Gully 1, located 80 km north of Perth, discovered commercial quantities of natural gas and condensate. The wells were drilled in 2010 and 2011.
The processing facility consists of the development of these two wells, which are still in the commissioning phase as the project’s performance has been hampered by continuing design and
commissioning issues. The onshore gas and condensate facility officially began production in June last year and is now supplying gas to bauxite miner Alcoa.
The Red Gully processing facility is designed to produce 8 TJ/day of natural gas and 64 kL/d (400 bbl/d) of condensate.
Tight Gas Proposal Upheld
In June, WA Environment Minister Albert Jacob upheld the Environmental Protection Authority’s (EPA) determination in regard to Buru Energy’s tight gas testing proposal in the Canning Basin. The program is known as the Laurel Formation Tight Gas Pilot Exploration Program.
In dismissing the appeals against the EPA decision, the Minister said the EPA had concluded that Buru’s “small scale, limited duration ‘proof of concept’ exploration proposal is unlikely to have a significant effect on the environment”.
The proposal is being further evaluated by the Department of Mines and Petroleum and Department of Water to meet the EPA’s objectives for the environmental factors identified for the proposal.
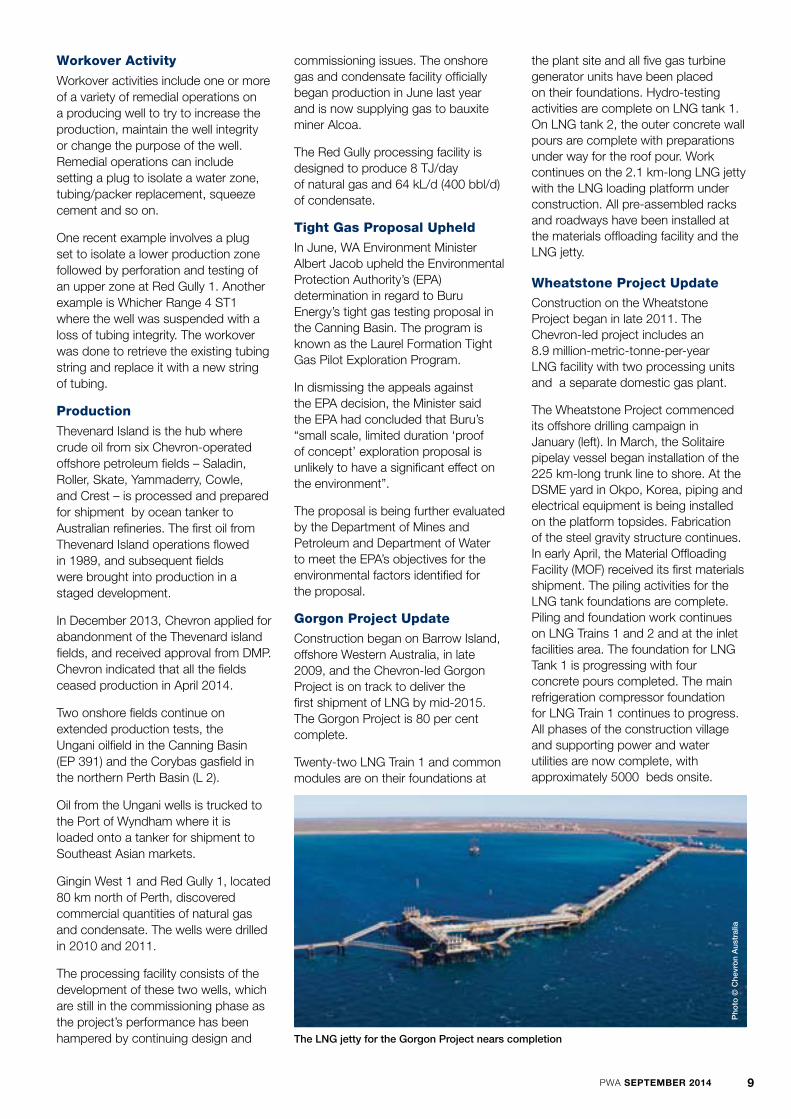
Gorgon Project Update
Construction began on Barrow Island, offshore Western Australia, in late 2009, and the Chevron-led Gorgon Project is on track to deliver the first shipment of LNG by mid-2015. The Gorgon Project is 80 per cent complete.
Twenty-two LNG Train 1 and common modules are on their foundations at
the plant site and all five gas turbine generator units have been placed on their foundations. Hydro-testing activities are complete on LNG tank 1. On LNG tank 2, the outer concrete wall pours are complete with preparations under way for the roof pour. Work continues on the 2.1 km-long LNG jetty with the LNG loading platform under construction. All pre-assembled racks and roadways have been installed at the materials offloading facility and the LNG jetty.
Wheatstone Project Update
Construction on the Wheatstone Project began in late 2011. The Chevron-led project includes an 8.9 million-metric-tonne-per-year LNG facility with two processing units and a separate domestic gas plant.
The Wheatstone Project commenced its offshore drilling campaign in January (left). In March, the Solitaire pipelay vessel began installation of the 225 km-long trunk line to shore. At the DSME yard in Okpo, Korea, piping and electrical equipment is being installed on the platform topsides. Fabrication of the steel gravity structure continues. In early April, the Material Offloading Facility (MOF) received its first materials shipment. The piling activities for the LNG tank foundations are complete. Piling and foundation work continues on LNG Trains 1 and 2 and at the inlet facilities area. The foundation for LNG Tank 1 is progressing with four concrete pours completed. The main refrigeration compressor foundation for LNG Train 1 continues to progress. All phases of the construction village and supporting power and water utilities are now complete, with approximately 5000 beds onsite.
The LNG jetty for the Gorgon Project nears completion
Pho
to ©
Che
vro
n A
ustr
alia
10 PWA SEPTEMBER 2014
Company focus — Buru operations update
Buru Energy Limited 14 July 2014
Buru Energy Limited
Buru Energy Limited is pleased to provide the following update on the Company’s operations.
Summary
• UnganiEPTprogressingverywellwith fifth oil cargo sold
• Appraisalactivityincludingwelltestsplanned for Ungani 3, Ungani North 1 and Paradise 1
• Fouroilfocusedexplorationwellsproposed for remainder of 2014
• 2014seismicprogramunderwaywith first 2D program acquisition commencing shortly
• TGS(LaurelFormationTightGasPilot Exploration Program) phasing optimised with main program early in 2015 dry season to maximise environmental, operational and cost benefits.
Ungani Extended Production Test (EPT)
Production:
The Ungani 2 well continues to produce strongly with production above 1590 kL/d (1000 bbl/d) at current choke settings, with very low water cut of ~1% in accordance with current modelling predictions. The production from Ungani to date is as follows:
• ProductionTestPhase1–31May2012 to 30 March 2013: 16.1 ML (101,278 bbl)
• ProductionTestPhase2–9December 2013 – 30 June 2014: 27.4 ML (172,535 bbl)
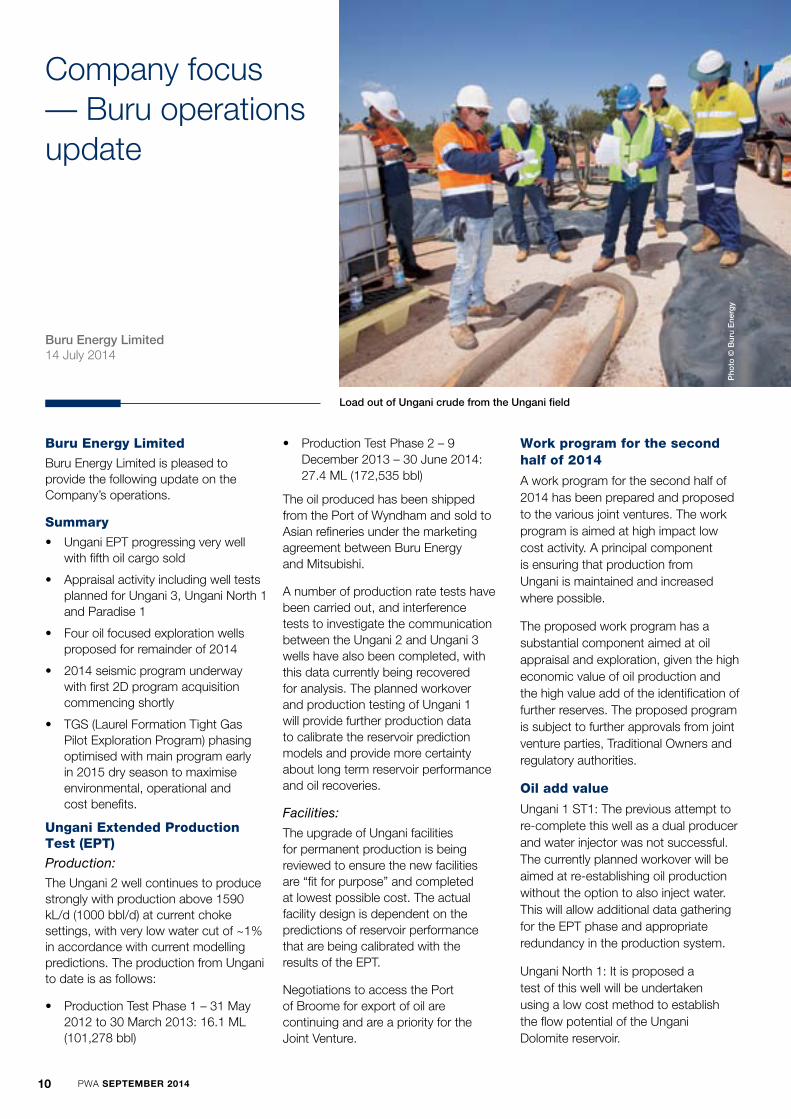
The oil produced has been shipped from the Port of Wyndham and sold to Asian refineries under the marketing agreement between Buru Energy and Mitsubishi.
A number of production rate tests have been carried out, and interference tests to investigate the communication between the Ungani 2 and Ungani 3 wells have also been completed, with this data currently being recovered for analysis. The planned workover and production testing of Ungani 1 will provide further production data to calibrate the reservoir prediction models and provide more certainty about long term reservoir performance and oil recoveries.
Facilities:
The upgrade of Ungani facilities for permanent production is being reviewed to ensure the new facilities are “fit for purpose” and completed at lowest possible cost. The actual facility design is dependent on the predictions of reservoir performance that are being calibrated with the results of the EPT.
Negotiations to access the Port of Broome for export of oil are continuing and are a priority for the Joint Venture.
Work program for the second half of 2014
A work program for the second half of 2014 has been prepared and proposed to the various joint ventures. The work program is aimed at high impact low cost activity. A principal component is ensuring that production from Ungani is maintained and increased where possible.
The proposed work program has a substantial component aimed at oil appraisal and exploration, given the high economic value of oil production and the high value add of the identification of further reserves. The proposed program is subject to further approvals from joint venture parties, Traditional Owners and regulatory authorities.
Oil add value
Ungani 1 ST1: The previous attempt to re-complete this well as a dual producer and water injector was not successful. The currently planned workover will be aimed at re-establishing oil production without the option to also inject water. This will allow additional data gathering for the EPT phase and appropriate redundancy in the production system.
Ungani North 1: It is proposed a test of this well will be undertaken using a low cost method to establish the flow potential of the Ungani Dolomite reservoir.
Load out of Ungani crude from the Ungani field
Pho
to ©
Bur
u E
nerg
y
PWA SEPTEMBER 2014 11
Ungani 3: A re-completion to fully isolate the water zone will allow a definitive test of the upper zone from which oil was swabbed in the recent test.
Paradise 1: This well has an identified oil zone in the Winifred member of the Grant Formation which was noted in the original drilling of the well in 2010, and from which free oil was recovered in 2012 during well remediation operations. A simple low cost testing operation is planned to verify the oil productivity of this zone which is a significant “play opener”.
Exploration drilling
The Company intends to drill up to four exploration wells in the remainder of this year, focused on shallow, high value, oil targets.
Coastal wells:
The Coastal farmout to Apache Corporation included the commitment by Apache to drill two wells at Apache’s cost.
These wells have been identified as Olympus and Commodore and are both located in the Kidson Sub-basin and have both conventional and unconventional prospectivity. Both wells are relatively shallow (less than 1500 metres) and will be drilled with a low cost, fit for purpose rig. The joint venture is currently in final negotiations for the supply of the rig from one of a number of rig providers who have submitted bids.
In addition, the Company is in negotiations to use the DCA7 rig which is currently drilling in the Perth Basin for the workover of Ungani 1. This rig would then also be available for the drilling of additional wells in the basin at low cost.
Fitzroy Trough exploration wells:
Ungani trend: The Company has identified a number of shallow oil prospects on the greater Ungani trend that could be drilled with either of the two rigs it intends to contract, and is working with the various joint venture parties and other stakeholders to ensure that at least one of these prospects is drilled this year.
EP129: This permit in the Blina area is currently held 100 per cent by Buru Energy and contains a number of shallow, high value oil targets that could be drilled with either of the two proposed rigs. The Company is currently in preliminary farmout discussions with a number of parties for them to farm in to this permit and participate in this year’s drilling program.
Seismic programsThe Company has 2D and 3D seismic programs planned for 2014 to mature drilling targets for 2015 and to meet permit commitments.
2D seismic program: The Terrex seismic crew has commenced line clearing for the 123 km Commodore West Seismic Survey in EP 471, and the data acquisition is expected to commence in approximately 10 days. There are up to a total of 800 km of seismic planned in various permits that are currently subject to the receipt of heritage reports and various other approvals.
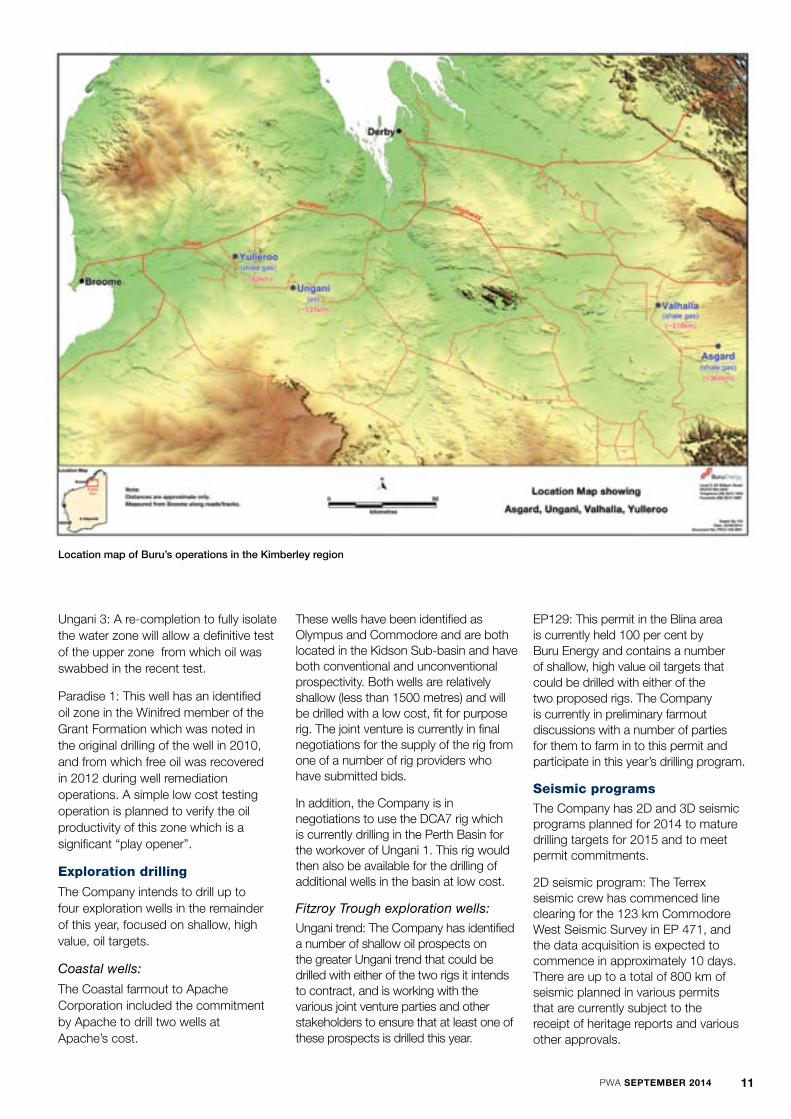
Location map of Buru’s operations in the Kimberley region
12 PWA SEPTEMBER 2014
3D seismic program: The planned Jackaroo 3D seismic program is located between Yulleroo and Ungani and will join the two existing 3D grids to give seamless 3D coverage from Yulleroo to Ungani. It covers the currently identified Jackaroo prospect and a number of other oil prospects along trend. All regulatory approvals and heritage clearances have been obtained for this survey and the Terrex 3D seismic crew is available to undertake the survey subject to final joint venture approval.
TGS (Laurel Formation Tight Gas Pilot Exploration Program)
The previous success of the trial low impact reservoir simulation of the Laurel Formation in the Yulleroo 2 well has demonstrated that the Laurel Formation will produce high quality wet gas at potentially economic rates with a relatively minor stimulation program, and this has led to the drilling of a series of exploration wells that have defined a major gas accumulation in the Laurel Formation. The Company
is now preparing to undertake a larger scale program known as the TGS or Laurel Formation Tight Gas Pilot Exploration Program, to attempt to quantify the commercial viability of this accumulation by undertaking fracs and flow testing on a number of these wells.
The Company has now received all regulatory approvals required for the TGS program after undertaking a full and transparent consultation process that has included the extensive involvement of independent experts and the sourcing of world class technical expertise. These robust and thorough consultations and approval programs have been in train for nearly two years and have resulted in transparent and fact based approvals for the program.
The extensive and iterative nature of these approvals has also meant that the operational timeframes for undertaking the program have been compressed, as it was not possible to
commence initial site and preparatory work until the approvals were received. In light of the fact the approvals have only recently been received, it has been necessary to undertake a full review of the planned execution and timing of the program.
This review has included operational considerations such as the availability of specialised technical equipment, the ability to complete the program prior to the wet season (including completing the flow back and testing program), and the costs of the program (which are affected by timing of the program), and the ability to compete it in a way that maximises efficient equipment utilisation.
The results of this review have led the joint venture to adopt a three-phased program. This phasing will ensure the program is undertaken in the most cost effective way and will also ensure the program meets all regulatory requirements and environmental standards.
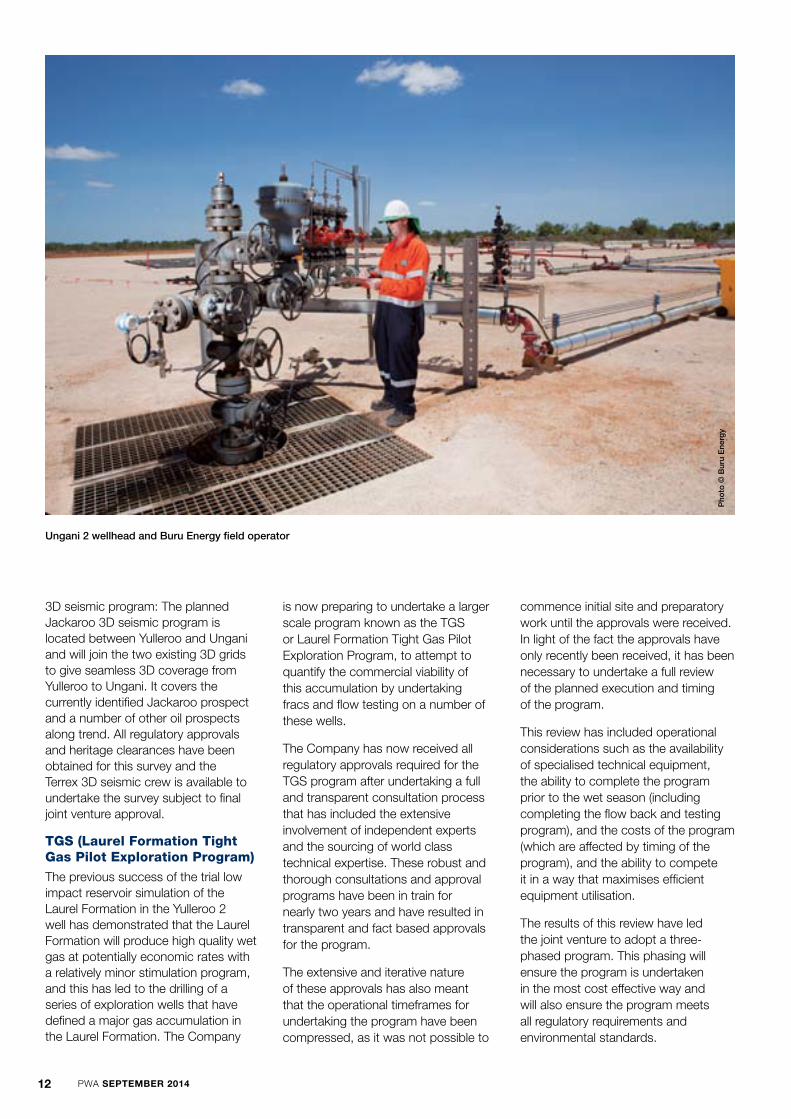
Ungani 2 wellhead and Buru Energy field operator
Pho
to ©
Bur
u E
nerg
y

PWA SEPTEMBER 2014 13
Buru Energy’s stakeholders, the Kimberley community and the wider WA community can be assured that this phased approach ensures the best environmental outcome from the program with the highest probability of delivering definitive results.
The phased approach will consist of the following steps:
Phase 1: August to October 2014
• Wellsitepreparationandcivilworksincluding the construction of the water holding and flowback fluid retention ponds, flare pits, and associated civil works. This work is complete at the Asgard site and underway at the Valhalla North site. These are major civil works required to support the currently planned frac configuration.
• Wellconditioningtoensurethewellbores contain an operationally appropriate brine solution. This work will be undertaken with a coiled tubing unit.
• Cementbondloggingtoconfirmpreviously obtained data.
• Conductingof“mini-fracs”orDiagnostic Fracture Injection Tests (DFITs). These are routinely conducted as part of frac programs and consist of fracs of a single zone by perforating the zone and injecting brine and observing the resultant pressure responses. This operation does not involve any flow back from the well and is performed with a relatively small crew and equipment package that does not require the mobilisation of the full frac crew. The data from these mini-fracs is used to optimise the design of the main fracs to ensure they provide definitive results at the lowest cost.
Phase 2: August 2014 to March 2015
Phase 2 will take place during the Kimberley wet season. This is a planning, validation and optimisation phase to ensure all operations and logistics are optimised and all contracts are the most cost effective. The design of the fracs will also be reviewed incorporating the results from the DFITs to ensure the highest probability
of obtaining definitive results at the lowest cost.
Phase 3: March to August 2015
This phase will include mobilisation of the frac spread, undertaking the fracs, and then a three month flow back period to ensure the data obtained will allow definitive decline curves to be calculated.
The current estimated total cost of the three phase program is in excess of $40 million. Buru Energy’s 50 per cent share of this cost will be covered by the previously announced agreement with Alcoa.
Corporate and Administrative
A program of staff and cost reduction and internal re-organisation has been implemented to ensure the company’s structure is fit for purpose. These changes will substantially reduce overheads and introduce stringent cost controls into the business. This program is substantially complete and together with the recent Board changes, have positioned Buru Energy to be a cost-competitive and efficient operator.
Loading operations for Ungani crude at the Port of Wyndham
Pho
to ©
Bur
u E
nerg
y

14 PWA SEPTEMBER 2014
Grant of petroleum titles
Undertaking seismic work in the Canning Basin
Richard BruceExploration GeologistPetroleum Division
State Awards
From 1 January 2014 to the end of June 2014, the following petroleum titles were awarded in State areas:
Petroleum Exploration Permits
In March 2014, EP 487 in the Canning Basin was awarded to Backreef Oil Proprietary Limited. The firm two-year period includes a 500 km 2D seismic survey and two exploration wells to an estimated value of $5,750,000.
The remaining program includes four exploration wells and a 200 km 2D seismic survey to an estimated value of $7,100,000.
In May 2014, EP 488 in the Perth Basin was awarded to UIL Energy Limited. The firm two-year period includes 66 km and 100 km 2D seismic surveys to an estimated value of $1,600,000. The remaining program includes two exploration wells and a 35 km2
seismic survey to an estimated value of $11,500,000.
In May 2014, EP 489 in the Perth Basin was awarded to UIL Energy Limited.
The firm two-year period includes 35 km and 40 km 2D seismic surveys to an estimated value of $750,000. The remaining program includes one exploration well and a 40 km 2D seismic survey to an estimated value of $5,700,000.
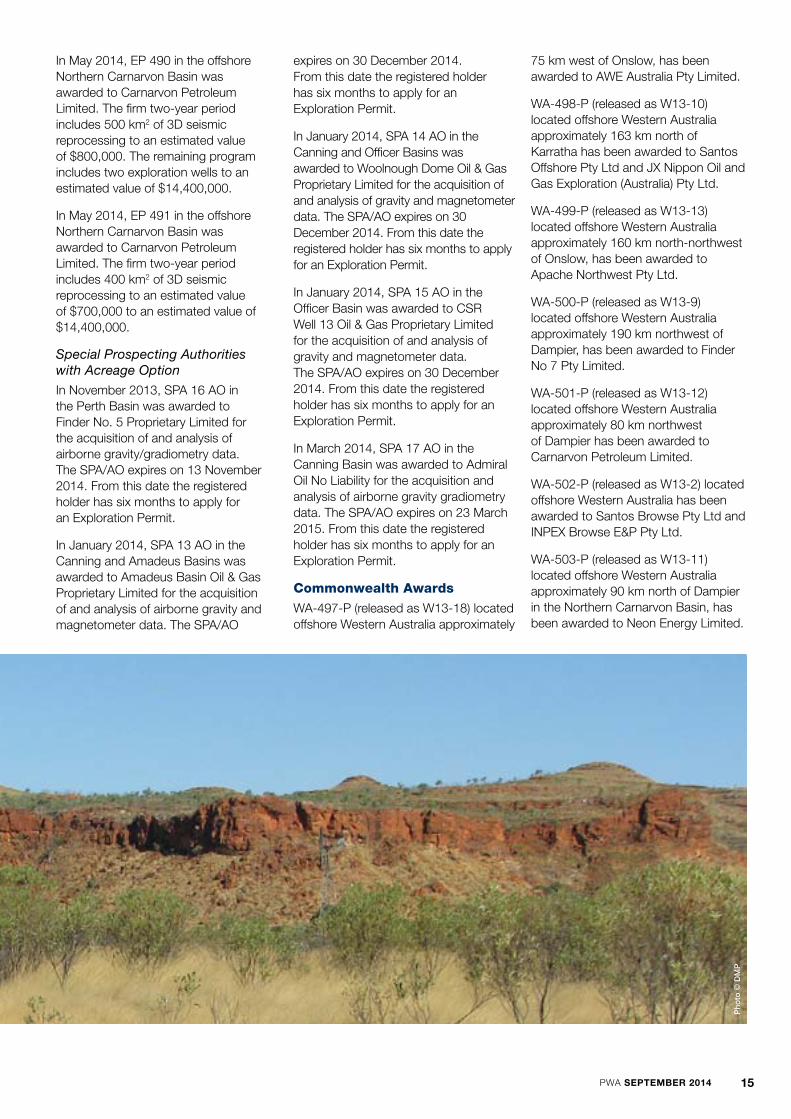
Poole Range, Canning Basin
Pho
to ©
Bur
u E
nerg
y
PWA SEPTEMBER 2014 15
In May 2014, EP 490 in the offshore Northern Carnarvon Basin was awarded to Carnarvon Petroleum Limited. The firm two-year period includes 500 km2 of 3D seismic reprocessing to an estimated value of $800,000. The remaining program includes two exploration wells to an estimated value of $14,400,000.
In May 2014, EP 491 in the offshore Northern Carnarvon Basin was awarded to Carnarvon Petroleum Limited. The firm two-year period includes 400 km2 of 3D seismic reprocessing to an estimated value of $700,000 to an estimated value of $14,400,000.
Special Prospecting Authorities with Acreage Option
In November 2013, SPA 16 AO in the Perth Basin was awarded to Finder No. 5 Proprietary Limited for the acquisition of and analysis of airborne gravity/gradiometry data. The SPA/AO expires on 13 November 2014. From this date the registered holder has six months to apply for an Exploration Permit.
In January 2014, SPA 13 AO in the Canning and Amadeus Basins was awarded to Amadeus Basin Oil & Gas Proprietary Limited for the acquisition of and analysis of airborne gravity and magnetometer data. The SPA/AO
expires on 30 December 2014. From this date the registered holder has six months to apply for an Exploration Permit.
In January 2014, SPA 14 AO in the Canning and Officer Basins was awarded to Woolnough Dome Oil & Gas Proprietary Limited for the acquisition of and analysis of gravity and magnetometer data. The SPA/AO expires on 30 December 2014. From this date the registered holder has six months to apply for an Exploration Permit.
In January 2014, SPA 15 AO in the Officer Basin was awarded to CSR Well 13 Oil & Gas Proprietary Limited for the acquisition of and analysis of gravity and magnetometer data. The SPA/AO expires on 30 December 2014. From this date the registered holder has six months to apply for an Exploration Permit.
In March 2014, SPA 17 AO in the Canning Basin was awarded to Admiral Oil No Liability for the acquisition and analysis of airborne gravity gradiometry data. The SPA/AO expires on 23 March 2015. From this date the registered holder has six months to apply for an Exploration Permit.
Commonwealth Awards
WA-497-P (released as W13-18) located offshore Western Australia approximately
75 km west of Onslow, has been awarded to AWE Australia Pty Limited.
WA-498-P (released as W13-10) located offshore Western Australia approximately 163 km north of Karratha has been awarded to Santos Offshore Pty Ltd and JX Nippon Oil and Gas Exploration (Australia) Pty Ltd.
WA-499-P (released as W13-13) located offshore Western Australia approximately 160 km north-northwest of Onslow, has been awarded to Apache Northwest Pty Ltd.
WA-500-P (released as W13-9) located offshore Western Australia approximately 190 km northwest of Dampier, has been awarded to Finder No 7 Pty Limited.
WA-501-P (released as W13-12) located offshore Western Australia approximately 80 km northwest of Dampier has been awarded to Carnarvon Petroleum Limited.
WA-502-P (released as W13-2) located offshore Western Australia has been awarded to Santos Browse Pty Ltd and INPEX Browse E&P Pty Ltd.
WA-503-P (released as W13-11) located offshore Western Australia approximately 90 km north of Dampier in the Northern Carnarvon Basin, has been awarded to Neon Energy Limited.
Pho
to ©
DM
P
16 PWA SEPTEMBER 2014
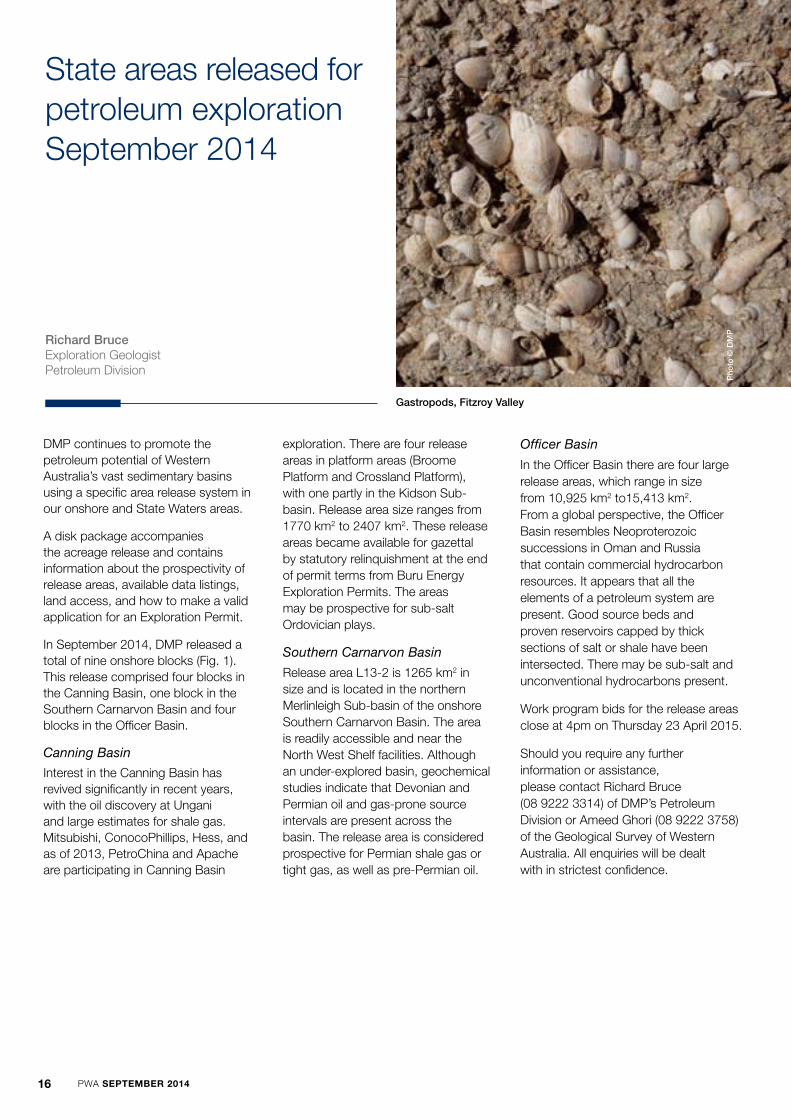
State areas released for petroleum exploration September 2014
Gastropods, Fitzroy Valley
Pho
to ©
DM
P
Richard BruceExploration GeologistPetroleum Division
DMP continues to promote the petroleum potential of Western Australia’s vast sedimentary basins using a specific area release system in our onshore and State Waters areas.
A disk package accompanies the acreage release and contains information about the prospectivity of release areas, available data listings, land access, and how to make a valid application for an Exploration Permit.
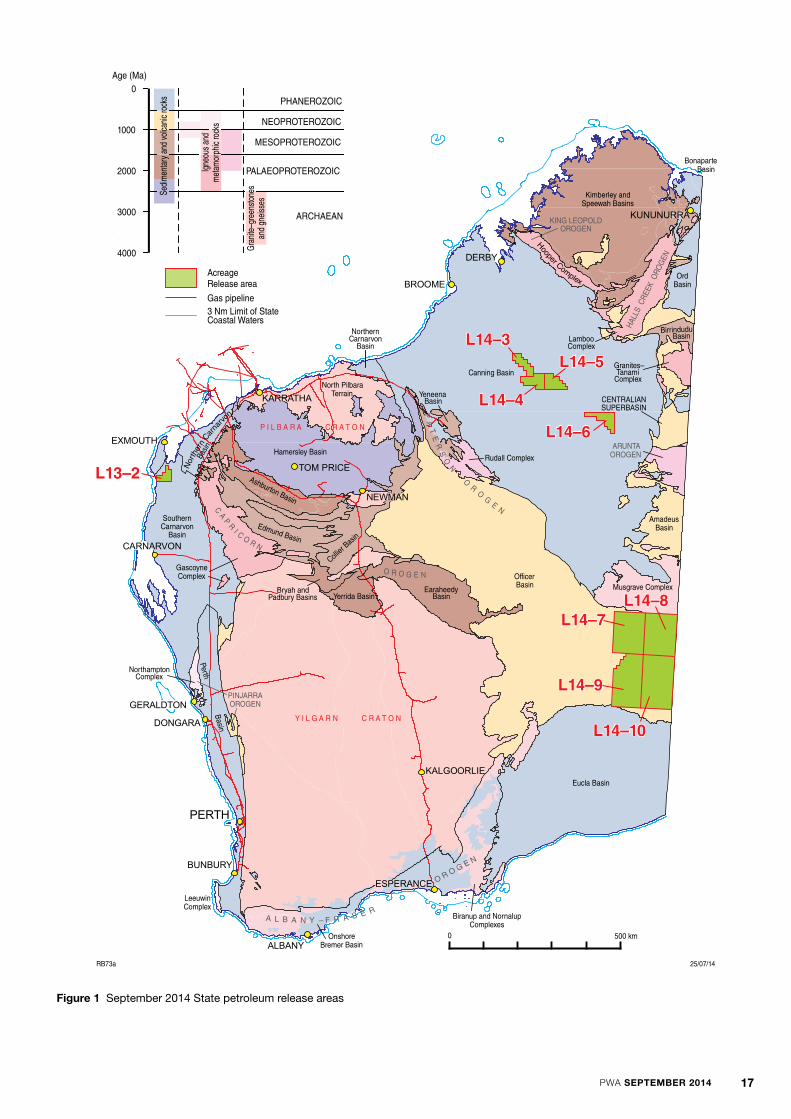
In September 2014, DMP released a total of nine onshore blocks (Fig. 1). This release comprised four blocks in the Canning Basin, one block in the Southern Carnarvon Basin and four blocks in the Officer Basin.
Canning Basin
Interest in the Canning Basin has revived significantly in recent years, with the oil discovery at Ungani and large estimates for shale gas. Mitsubishi, ConocoPhillips, Hess, and as of 2013, PetroChina and Apache are participating in Canning Basin
exploration. There are four release areas in platform areas (Broome Platform and Crossland Platform), with one partly in the Kidson Sub-basin. Release area size ranges from 1770 km2 to 2407 km2. These release areas became available for gazettal by statutory relinquishment at the end of permit terms from Buru Energy Exploration Permits. The areas may be prospective for sub-salt Ordovician plays.
Southern Carnarvon Basin
Release area L13-2 is 1265 km2 in size and is located in the northern Merlinleigh Sub-basin of the onshore Southern Carnarvon Basin. The area is readily accessible and near the North West Shelf facilities. Although an under-explored basin, geochemical studies indicate that Devonian and Permian oil and gas-prone source intervals are present across the basin. The release area is considered prospective for Permian shale gas or tight gas, as well as pre-Permian oil.
Officer Basin
In the Officer Basin there are four large release areas, which range in size from 10,925 km2 to15,413 km2. From a global perspective, the Officer Basin resembles Neoproterozoic successions in Oman and Russia that contain commercial hydrocarbon resources. It appears that all the elements of a petroleum system are present. Good source beds and proven reservoirs capped by thick sections of salt or shale have been intersected. There may be sub-salt and unconventional hydrocarbons present.
Work program bids for the release areas close at 4pm on Thursday 23 April 2015.
Should you require any further information or assistance, please contact Richard Bruce (08 9222 3314) of DMP’s Petroleum Division or Ameed Ghori (08 9222 3758) of the Geological Survey of Western Australia. All enquiries will be dealt with in strictest confidence.
PWA SEPTEMBER 2014 17
Figure 1 September 2014 State petroleum release areas
Biranup and NornalupComplexes
KING LEOPOLDOROGEN
NorthamptonComplex
Rudall Complex
Musgrave Complex
GascoyneComplex
Canning Basin
Eucla Basin
Perth Basin
BirrinduduBasin
YeneenaBasin
Hamersley Basin
AmadeusBasin
Ashburton Basin
Edmund Basin
Yerrida BasinEaraheedy
Basin
P I L B A R A C R A T O N
Y I L G A R N C R A T O N
HALL
S C
REEK
ORO
GEN
LeeuwinComplex
OfficerBasin
0 500 km
BonaparteBasin
Collier
Basin
Basin
NorthernCarnarvon
Basin
OrdBasin
LambooComplex
CENTRALIANSUPERBASINP
AT
ER
SO
N
OR
OG
ENC
AP
R
I CO R N
O R O G E N
PINJARRAOROGEN
OnshoreBremer Basin
North PilbaraTerrain
SouthernCarnarvon
Basin
Granites�Tanami
Complex
Kimberley andSpeewah Basins
Bryah andPadbury Basins
A L B A N Y � F R A S E R
RB73a 25/07/14
O R O G E N
ARUNTAOROGEN
novranraC nrehtroN
0
1000
2000
3000
Age (Ma)
PHANEROZOIC
NEOPROTEROZOIC
MESOPROTEROZOIC
PALAEOPROTEROZOIC
ARCHAEAN
Sedim
enta
ry a
nd vo
lcanic
rock
s
4000
Igne
ous a
ndm
etam
orph
ic ro
cks
Gran
ite�g
reen
stone
san
d gn
eisse
sAcreage Release area
Gas pipeline3 Nm Limit of StateCoastal Waters
L1���
Hooper Complex
L1���
L1���
L1���
L1���
L1��10
L1���
L1���L1���
PERTH
DERBY
NEWMAN
BROOME
ALBANY
EXMOUTH
BUNBURY
GERALDTON
KARRATHA
TOM PRICE
KUNUNURRA
ESPERANCE
CARNARVON
KALGOORLIE
DONGARA

18 PWA SEPTEMBER 2014
Pho
to ©
Geo
scie
nce
Aus
tral
ia

PWA SEPTEMBER 2014 19
Towards a deeper understanding of the Canning Basin
Above and facing page:Signs and traffic management for the survey conducted along active road corridors
Charmaine ThomasGeologist GSWA
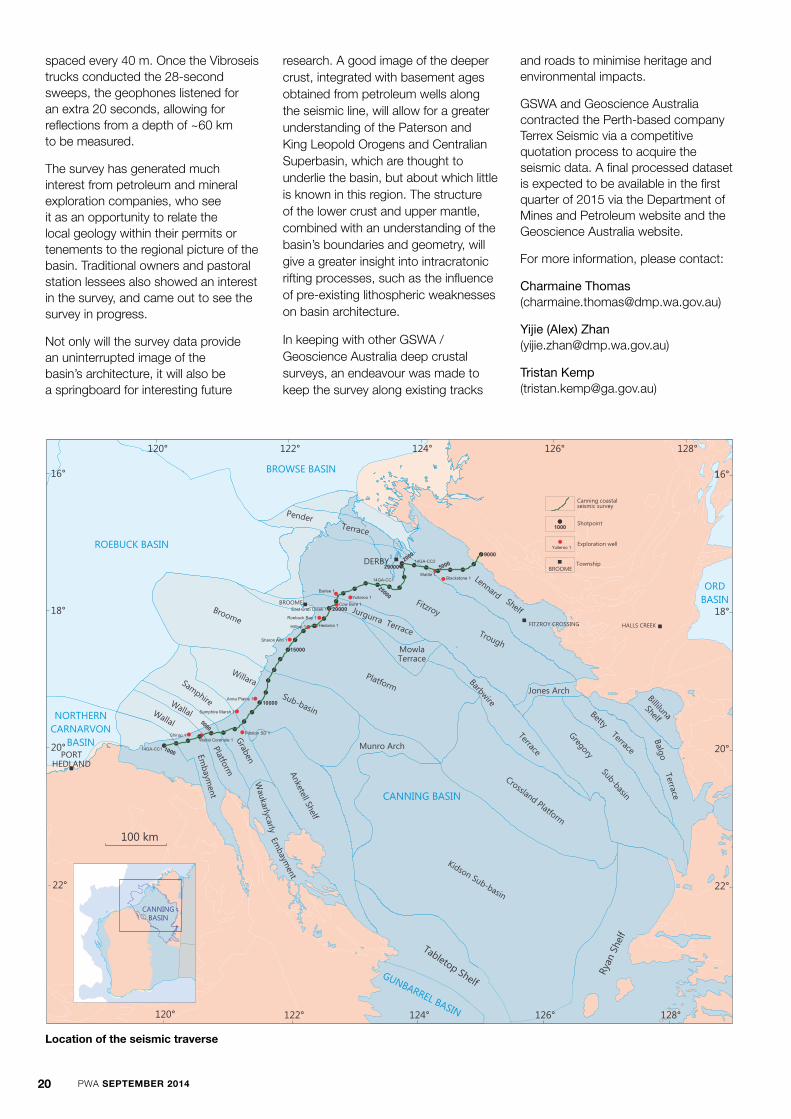
The Geological Survey of Western Australia (GSWA) and Geoscience Australia have just completed the Canning Coastal Seismic Survey, a 700 km-long, deep crustal reflection seismic and gravity survey spanning the entire cross-strike width of the Canning Basin, which will provide clues as to the nature of the basin’s boundaries with the Pilbara and Kimberley Cratons, and its structure and basement.
Data acquisition was funded by the Western Australian State Government’s
Royalties for Regions Exploration Incentive Scheme (EIS), with co-funding for the seismic processing provided by the Australian Government to evaluate the region for CO2 storage potential.
The reflection seismic survey commenced on 21 May with a period of thorough testing to determine the best acquisition parameters. These parameters differed from those used in other deep crustal surveys acquired by the State and Federal governments, such as the Yilgarn–Officer–Musgrave
(YOM) and Albany–Fraser Orogen (AFO) surveys, because of the need to adequately image the younger, shallower basin as well as the deep basement.
150-fold data were recorded on 600 live channels over a 12 km-spread, with a geophone group interval of 20 m in an in-line array. The energy source was an in-line array of three Hemi-50 vibrators that each conducted a single linear sweep of 6 – 96 Hz per Vibroseis source point (VP), which were
Seismic Energy Source: 3 X Hemi 50,000 pound vibrators
Pho
to ©
Geo
scie
nce
Aus
tral
iaP
hoto
© G
eosc
ienc
e A
ustr
alia
20 PWA SEPTEMBER 2014
spaced every 40 m. Once the Vibroseis trucks conducted the 28-second sweeps, the geophones listened for an extra 20 seconds, allowing for reflections from a depth of ~60 km to be measured.
The survey has generated much interest from petroleum and mineral exploration companies, who see it as an opportunity to relate the local geology within their permits or tenements to the regional picture of the basin. Traditional owners and pastoral station lessees also showed an interest in the survey, and came out to see the survey in progress.
Not only will the survey data provide an uninterrupted image of the basin’s architecture, it will also be a springboard for interesting future
128°
128°
126°
126°
124°
124°
122°
122°120°
16° 16°
18° 18°
20° 20°
22°22°
120°
DERBY
BROOME
HALLS CREEK
PORTHEDLAND
FITZROY CROSSING
BROWSE BASIN
ROEBUCK BASIN
NORTHERN
CARNARVON
BASIN
CANNING BASIN
Kidson Sub-basin
Rya
n S
hel
f
Fitzroy
Trough
Platform
Crossland Platform
Anketell Sh
elf
Lennard
Shelf
Tabletop Shelf
Gregory
Sub-basin
GUNBARREL BASIN
Willara
Sub-basin
Balg
o Terrace
BettyTerrace
Barbwire
Terrace
Billiluna
Shelf
Jurgurra Terrace
Munro Arch
MowlaTerrace
Pender Terrace
ORD
BASIN
Jones ArchSam
phire
Grab
en
Wallal
Platform
Wallal
Emb
aymen
t
Embaym
ent
Wau
karlycarly
CANNINGBASIN
9000
5000
2000
5000
1000
25000
20000
15000
10000
29000
Yulleroo 1
Barlee 1
Cow Bore 1East Crab Creek 1
Roebuck Bay 1
Hedonia 1Hilltop 1
Sharon Ann 1
Anna Plains 1
Samphire Marsh 1
Wallal Corehole 1Chirup 1 Pittston SD 1
14GA-CC1
14GA-CC1
14GA-CC2
Wattle 1Blackstone 1
Broome
1000
Yulleroo 1
BROOME
Canning coastalseismic survey
Shotpoint
Exploration well
Township
100 km
Location of the seismic surveyLocation of the seismic traverse
research. A good image of the deeper crust, integrated with basement ages obtained from petroleum wells along the seismic line, will allow for a greater understanding of the Paterson and King Leopold Orogens and Centralian Superbasin, which are thought to underlie the basin, but about which little is known in this region. The structure of the lower crust and upper mantle, combined with an understanding of the basin’s boundaries and geometry, will give a greater insight into intracratonic rifting processes, such as the influence of pre-existing lithospheric weaknesses on basin architecture.
In keeping with other GSWA /Geoscience Australia deep crustal surveys, an endeavour was made to keep the survey along existing tracks
and roads to minimise heritage and environmental impacts.
GSWA and Geoscience Australia contracted the Perth-based company Terrex Seismic via a competitive quotation process to acquire the seismic data. A final processed dataset is expected to be available in the first quarter of 2015 via the Department of Mines and Petroleum website and the Geoscience Australia website.
For more information, please contact:
Charmaine Thomas ([email protected])
Yijie (Alex) Zhan ([email protected])
Tristan Kemp ([email protected])

PWA SEPTEMBER 2014 21
Is geothermal energy dead in WA?
Control room for geothermal plant in Perth
Mike F. MiddletonGeneral Manager ResourcesPetroleum Division
Introduction
There are currently no geothermal energy exploration permits active in Western Australia. By the end of 2014, all geothermal exploration permits (GEPs) will have been surrendered. From this process, it would appear that the geothermal concept, and the introduction of “geothermal” into the Petroleum and Geothermal Energy Resources Act 1967 (PGERA67) has not had a successful outcome. However, this may not actually be the case.
From the present experience, there is no commercial appetite for geothermal energy to create electricity in Western Australia. The lack of funding towards geothermal exploration for electricity has led to similar experiences being encountered elsewhere in Australia, for example, in the Paralana Project in South Australia and difficulties with the Innaminka Project in the Cooper Basin. Nevertheless, geothermal energy is being increasingly used to replace electricity for water heating and air conditioning. Some 14 projects of this nature are recognised in the Perth metropolitan area.
Only one geothermal exploration borehole has been drilled in Western Australia under the PGERA67, and this was in GEP 48 near Esperance, on the assumption that low heat conducting granites may provide insulation over higher heat producing granites.
Greenpower Energy Limited drilled this first geothermal borehole in 2013.
The company considered the borehole to be a “technical success”, but not a commercial success, and has subsequently proposed to relinquish the GEP. Recognising the company’s initiative, the Department of Mines and Petroleum (DMP) Resources Branch has re-investigated the findings of this first geothermal well, Mt Ridley 1. This study is being conducted in the light of on-going studies of heat generation of granitoids by DMP in Western Australia, and these studies are being carried out with specific reference to a commitment for geothermal energy in the State.
Heat Generation in Granitoids
Granitoids are granite-like rocks, and capture a large group of igneous rocks with such characteristics. Granitoids underlie many sedimentary rocks in the Perth, Carnarvon and Canning Basins in Western Australia, and contribute to heat flow in these basins.
Previous work by DMP (Middleton and Stevens 2013) has shown that radiogenic heat from granitoids may contribute to possible geothermal energy in the South West of Western Australia. Some of the largest heat-generating granitoids in Australia have been observed in the Vasse region of Western Australia, and may present a unique renewable energy source for that region.
Mt Ridley 1 – Measurements
The future of geothermal energy in Western Australia largely hinges on the outcome of the science from Mt Ridley 1, north of Esperance (Fig. 1). This article looks at the probable temperatures found at Mt Ridley 1 and possible economic implications.
The most direct implications from the drilling of the Mt Ridley 1 geothermal borehole are:
1. An uncorrected geothermal gradient of 14.75 ºC/km which supports a temperature of 17.5 ºC at the surface and 23.4 ºC at the bottomhole depth of 405 m. This thermal is quite low, but is not atypical of thermal gradients in the granitoid region of the southwest of Western Australia (Sass et al. 1976).
2. The Thorium/Uranium ratio is about 10, which has implications for heat generation from the granitoids of the region.
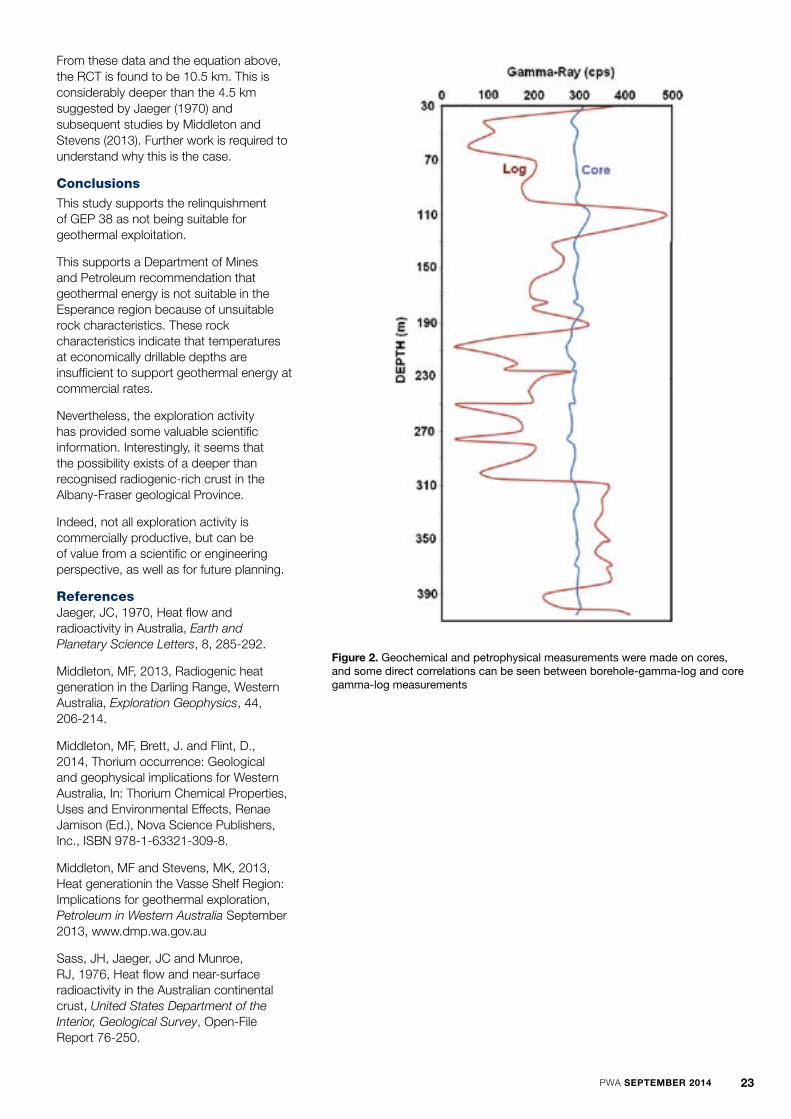
3. Geochemical and petrophysical measurements were made on cores, and some direct correlations can be seen between borehole-gamma-log and core gamma-log measurements (Fig. 2). The absolute measurement values of the core-based measurements versus the borehole measurements are uncertain.
Pho
to ©
DM
P

22 PWA SEPTEMBER 2014
Figure 1. Location of Mt Ridley 1
4. Uncertainty exists between the field-scillintometer Potassium (K), Uranium (U) and Thorium (Th) elemental concentrations reported by the company and the actual values. This is because the measurements were made on a core field-scillintometer, but without a known reference (i.e. laboratory or other field calibration). Nevertheless, the core-measurement-based Potassium (K) concentrations appear to be consistent with independent laboratory measurements. It is assumed that real (i.e. real rock volume) Uranium and Thorium concentrations are similar to those quoted in the report. Independent corroboration with core analyses will be made, when core is made available to DMP.
Mt Ridley 1 – Technical implications
Figure 2 shows the gamma-log and core-gamma measurements versus depth. There is a reasonable correlation, although the magnitude of the counts-per-second (cps) is significantly different. The difference is due to the difference of volume being sampled by the core instrument (core samples) as opposed to the actual
rock-volume being sampled by the down-hole-gamma probe, and also the different types of instrumentation.
This difference in the magnitude in the down-hole gamma tool versus the core measurement device (an FS hand-held scintillometer) does pose some scientific questions about the comparison of the numerical results. Such questions still need to be resolved for this dataset. Nevertheless,
some general observations and calculations can be made (Table 1).
The derived heat generation in the Mt Ridley borehole is 1.77 mWm-3. This is considerably lower than other granitoid regions in Western Australia. By comparison, heat generation in the Darling Range can be as high as 10.2 mWm-3, and 15.7 mWm-3 in the Leeuwin Complex (Middleton et al. 2014). This lower heat generation in Mt Ridley 1 is the principal reason why temperatures and geothermal gradients are low in the Esperance region.
Scientific Implications: Radiogenic Crustal Thickness in Western Australia
On the basis of geothermal and heat flow measurements, Jaeger (1970) proposed that the thickness of the radiogenic crust to be approximately 4.5 km. The present information from Mt Ridley 1 allows us to test this proposal.
Radiogenic crustal thickness (RCT) is given by the formula:
RCT = (Surface Heat Flow – Mantle Heat Flow) / Heat Generation
From the Mt Ridley 1 borehole, one can calculate a surface heat flow from the equation above to be 44.74 μWm2, where the mantle heat flow is generally accepted to be 25.6 μWm2 (Jaeger, 1970; Middleton 2013). The heat generation is assumed to be 1.77 mWm-3, which is based on Mt Ridley 1 data (Table 1).
Table 1. Mt Ridley 1 – preliminary evaluation by DMP
Observed geothermal gradient 14.75 ºC/km
Surface temperature 17.5 ºC
Approximate temperature @ 3 km 59 ºC
Potassium concentration (upper 400 m) 2 per cent
Thorium/Uranium ratio 8
Surface Thorium (GA map) 7.2 ppm
Mean Uranium content over 400 m 2 ppm
Mean Thorium content over 400 m 15 ppm
Maximum core Thorium 28.3 ppm @ 375 m
Minimum core Thorium 4.7 ppm @ 272.1 m
Mean heat generation 1.77 mWm-3
PWA SEPTEMBER 2014 23
From these data and the equation above, the RCT is found to be 10.5 km. This is considerably deeper than the 4.5 km suggested by Jaeger (1970) and subsequent studies by Middleton and Stevens (2013). Further work is required to understand why this is the case.
ConclusionsThis study supports the relinquishment of GEP 38 as not being suitable for geothermal exploitation.
This supports a Department of Mines and Petroleum recommendation that geothermal energy is not suitable in the Esperance region because of unsuitable rock characteristics. These rock characteristics indicate that temperatures at economically drillable depths are insufficient to support geothermal energy at commercial rates.
Nevertheless, the exploration activity has provided some valuable scientific information. Interestingly, it seems that the possibility exists of a deeper than recognised radiogenic-rich crust in the Albany-Fraser geological Province.
Indeed, not all exploration activity is commercially productive, but can be of value from a scientific or engineering perspective, as well as for future planning.
ReferencesJaeger, JC, 1970, Heat flow and radioactivity in Australia, Earth and Planetary Science Letters, 8, 285-292.
Middleton, MF, 2013, Radiogenic heat generation in the Darling Range, Western Australia, Exploration Geophysics, 44, 206-214.
Middleton, MF, Brett, J. and Flint, D., 2014, Thorium occurrence: Geological and geophysical implications for Western Australia, In: Thorium Chemical Properties, Uses and Environmental Effects, Renae Jamison (Ed.), Nova Science Publishers, Inc., ISBN 978-1-63321-309-8.
Middleton, MF and Stevens, MK, 2013, Heat generationin the Vasse Shelf Region: Implications for geothermal exploration, Petroleum in Western Australia September 2013, www.dmp.wa.gov.au
Sass, JH, Jaeger, JC and Munroe, RJ, 1976, Heat flow and near-surface radioactivity in the Australian continental crust, United States Department of the Interior, Geological Survey, Open-File Report 76-250.
Figure 2. Geochemical and petrophysical measurements were made on cores, and some direct correlations can be seen between borehole-gamma-log and core gamma-log measurements

24 PWA SEPTEMBER 2014
Shale gas resource assessment in the Merlinleigh Sub-basin, Carnarvon Basin
A Buru Energy gas site development
Joanna Wong Graduate Officer
Mohammad BaharSenior Reservoir EngineerPetroleum Division
Introduction
The rapid progression of shale gas developments and the rise of improved technologies in the US have encouraged Western Australia to explore our own potentially massive shale gas resources.
Unlike conventional petroleum systems, shale gas plays consist of source rock and are commonly independent of structural and stratigraphic traps and can cover extremely large areas. These source rocks are thermally mature and have retained substantial amounts of hydrocarbons. The key to unlocking these residual hydrocarbons is a comprehensive understanding of the geochemical, geomechanical and petrophysical properties of the source rocks, in order to employ directional drilling and hydraulic fracturing activities (Ghori 2013).
Geology of the Carnarvon Basin
Situated on the northwest coast of Western Australia, the Carnarvon Basin covers an onshore area of approximately 115,000 km2 and an offshore area of about 535,000 km2. The Carnarvon Basin is split into the mostly offshore Northern Carnarvon Basin and mostly onshore Southern Carnarvon Basin; the onshore Carnarvon Basin consists of four sub-basins: the Peedamullah Shelf,
Gascoyne Platform, Byro Sub-basin and Merlinleigh Sub-basin (Fig. 1).
The Gascoyne Platform is the largest sub-basin in the Southern Carnarvon Basin and contains a mainly Silurian-Devonian succession unconformably overlain by thin Cretaceous and Cenozoic cover. In the Merlinleigh Sub-basin, the Silurian-Devonian succession is overlain by a thick Permian-Carboniferous succession, except along its eastern margin (Fig. 2, Ghori 2013). According to previous geological and geochemical studies, the Merlinleigh Sub-basin contains the best gaseous source rocks in the Carnarvon Basin, in the Byro and Wooramel Groups. Other source intervals are present in the Gneudna Formation and the Dirk Hartog Group. In this study, geochemical and petrophysical data from four wells were analysed to determine source rock quality: Quail 1, Burna 1, Kennedy Range 1 and Gascoyne 1.
Geochemistry parameters
Petroleum geochemistry is the most effective technique used to evaluate the hydrocarbon-generating capacity of source rocks, by identifying and determining the amount, type and maturation level of the organic matter. It is a highly important method for the shale gas industry in that the target source rocks can be better characterised to reduce the inherent
Pho
to ©
Bur
u E
nerg
y
uncertainty in exploration and production of these generally poorly-known plays. Geochemical testing can be performed on outcrop samples, formation cuttings, sidewall cores and conventional cores. Some geochemical techniques include kerogen typing, vitrinite reflectance analysis, gas chromatography and laboratory pyrolysis (McCarthy et al. 2011).
In order to identify the source potential of each shale layer in the Merlinleigh Sub-basin, geochemical data obtained from each well was analysed for four main parameters:
• Typeofkerogen
• Totalorganiccarbon
• Generationpotential
• Thermalmaturity/vitrinitereflectance.
Kerogen is a naturally occurring organic matter found in source rocks and is capable of expelling hydrocarbons when heated. There are three types of kerogen: Type I, which consists of mainly algal material that is likely to produce oil; Type 2, which is a mix of terrestrial and marine organic matter that can generate waxy oil; and Type 3, a woody, terrestrial source material that is highly prone to generating gas. By identifying the type of kerogen in a source rock, we can anticipate what kinds of hydrocarbons are most likely to be produced by that source rock.

PWA SEPTEMBER 2014 25
Figure 1. Map showing tectonic units of the Carnarvon Basin, WA (Ghori 2013)
Figure 2. Generalised stratigraphy and source rock locations of the onshore Carnarvon Basin (Ghori 2013)
ARG187b 01.11.12
GascoynePlatform
MerlinleighSub-basin
PeedamullahShelf
ByroSub-basin
PerthBasin
EdelTerrace
114° 115°
Ballythanna 1
Barrabiddy 1A
BMR 6, 7
BMR 8
BMR 9
Burna 1
Cane River 2
Cape Cuvier 1
Cape Range 1
Coburn 1
Dirk Hartog 17B
Echo Bluff 1
Garden Mill 1
Gascoyne 1
Giralia 1
Gneudna 1
Hamelin Pool 1
Kalbarri 1
KennedyRange 1
Kybra 1
Mooka 1
Onslow 1
Pendock 1
Quail 1
Quobba 1
Remarkable Hill 1
Rough Range 1
Rough Range South 5
Tamala 1
Warroora 1
Woodleigh 2A
Yanrey 1
Yaringa 1
Yaringa East 1
Northern Carnarvon Basin
27°
26°
25°
24°
23°
22°
21°
Palaeozoic - Mesozoic
Mainly Permian
Devonian - Ordovician
Basement
North WestCape Area
OnslowTerrace
???
?
Oil & gas source
Absent
Gaseous source
250
260
270
280
290
300
310
320
330
340
350
360
370
380
390
400
410
420
430
440
Ma Rock Unit
GP MS BS PS
Byro Group
WooramelGroup
LyonsGroup
Ear
lyL
ate
Stephanian
Westphalian
Namurian
Visean
Tournaisian
Kazanian
UfimianKungurian
Artinskian
Sakmarian
Asselain
Mid
dle
Lat
eE
arly
Famennian
Frasnian
Givetian
Eifelian
Emsian
Pragian
Lochkovian
Pridoli
Ludlow
Wenlock
Llandovery
Munabia Ss.
GneudnaFormation
Nannyarra Ss.
Silu
rian
Dev
on
ian
Car
bo
nif
ero
us
Per
mia
n
?
? ?
TumblagoodaSandstone
Callytharra Formation
QuailFormation
MoogooreeLimestone
Yindagindy Fm.
WilliamburySandstone
WillaradieFm.
Formation
Ordovician
KennedyGroup
GP = Gascoyne PlatformMS = Merlinleigh Sub-basinBS = Byro Sub-basinPS = Peedamullah Shelf
Sweeney MiaFormation
Kopke Ss.Faure Fm.
Dirk
Har
tog
Gro
up
Time
ARG188c 01.11.12
?
?
?
Coburn
YaringaAjana

26 PWA SEPTEMBER 2014
Total organic carbon (TOC) indicates the quantity of organic material in a source rock. Measured by percentage weight (wt%), a source rock that contains greater than 2% TOC is considered to have excellent kerogen quantity and therefore would favour the presence of shale gas.
The generation potential of a source rock is the amount of hydrocarbon that can be generated per gram of rock (mg hydrocarbon/g rock). It is determined by rock pyrolysis: a geochemical analysis in which a rock sample is subject to controlled heating until hydrocarbons are generated. This enables the quality of the source rock to be assessed and is instrumental in evaluating shale gas plays. During the controlled heating event, the rock sample emits various gases that are detected by specialised sensors and are shown as peaks on a pyrogram. Typically, five emission peaks are formed that are denoted S1, S2, S3, S4 and S5. The S1 and S2 peaks represent the free hydrocarbons generated by the rock prior to kerogen cracking and the hydrocarbons generated by kerogen cracking, respectively. The S3, S4 and S5 peaks represent the CO2 emitted during pyrolysis, oxidation and carbon decomposition, respectively. The generation potential is then equivalent to the sum of the S1 and S2 peaks (McCarthy et al. 2011). A generation potential of 10 mg/g is considered very good in terms of source rock quality.
Lastly, the thermal maturity of a source rock is classified according to the quality of vitrinite reflectance. Vitrinite is a coal maceral formed through the thermal alteration of lignin and cellulose in plant cell walls, which responds optically to increasing levels of thermal maturity. For a source rock to be gas-prone, vitrinite reflectance levels would ideally lie between 1 and 1.5%, corresponding to a thermal maturity of mature to over-mature.
Source potential of the Merlinleigh Sub-basin
The Lower Permian section in the Merlinleigh Sub-basin contains the best gas-prone source beds in the Carnarvon Basin, and their maturity ranges from immature along the
margins of the sub-basin to over-mature towards the centre (Ghori et al. 2005).
The widespread Artinskian Wooramel Group of the Merlinleigh Sub-basin is up to 380 m thick and contains interbedded organic-rich shales with good to fair source potential that are predominantly gas-prone (Fig. 3). TOC values are up to 16%, with an average of 7%, and their maximum potential yield is 12 mg/g, with an average of 6 mg/g. The formation is 250 m thick in Wandagee 1 and the adjacent Quail 1, and 115 m thick in Burna 1. The Wooramel Group is found to be over-mature in Kennedy Range 1, which is
understood to be the result of a local intrusion rather than a regional heating event (Ghori 2013).
The next best quality source rocks is the Byro Group, where good to fair gas-prone source rock intervals are present through a 700 m thick interval in Kennedy Range 1. The Byro Group is immature and missing section in the studied wells, except in Kennedy Range 1, where it ranges from immature to over-mature (Ghori 2013). Thin source rock intervals have also been identified in the Gneudna Formation, with good to fair organic richness and generating potential. This information is summarised in Table 1.
Table 1. Summary of potential source rock layers (Ghori 1996)
Formation Organic Richness Generating Potential Kerogen Type
Gneudna Formation Good to Fair Good to Fair Oil and gas
Wooramel Group Very good to Fair Very good to Fair Mainly gas
Byro Group Very good to Fair Good to Fair Mainly gas
Figure 3. Maturity map of the top Wooramel Group (lasky et al. 2005)
Burna 1
Gascoyne 1
Quail 1
114°
10'
114°30' 115°00' 115°30'
25°00'
115°
50'
25°20'
24°30'
24°00'
23°30'
115°
50'
24°00'
24°30'
25°00'
20 km
114°30' 115°00' 115°30'
25°20'
114°
10'
23°30'
KennedyRange 1
ARG2 22.04.98
Seismic control
Well control
Early generation (10% to 25%)
Main phase (25% to 65%)
Late generation (65% to 90%)
Oil window based on kerogenkinetics using 25% type II, 50%
type III and 25% type IV kerogen
BMR 7
0.0
Wandagee
Fault
Fault
Fault
Fault
Paddys
Group
KennedyR
ange
Birdrong
SubcroppingWooramel
Wooramel Group
0.54
8.7
4.9
15.0
80.8
9.10
10.0
1.2
83.1
90.8
0.5
2.9
1.379.1
Faults
Highly mature

PWA SEPTEMBER 2014 27
Surfer® maps
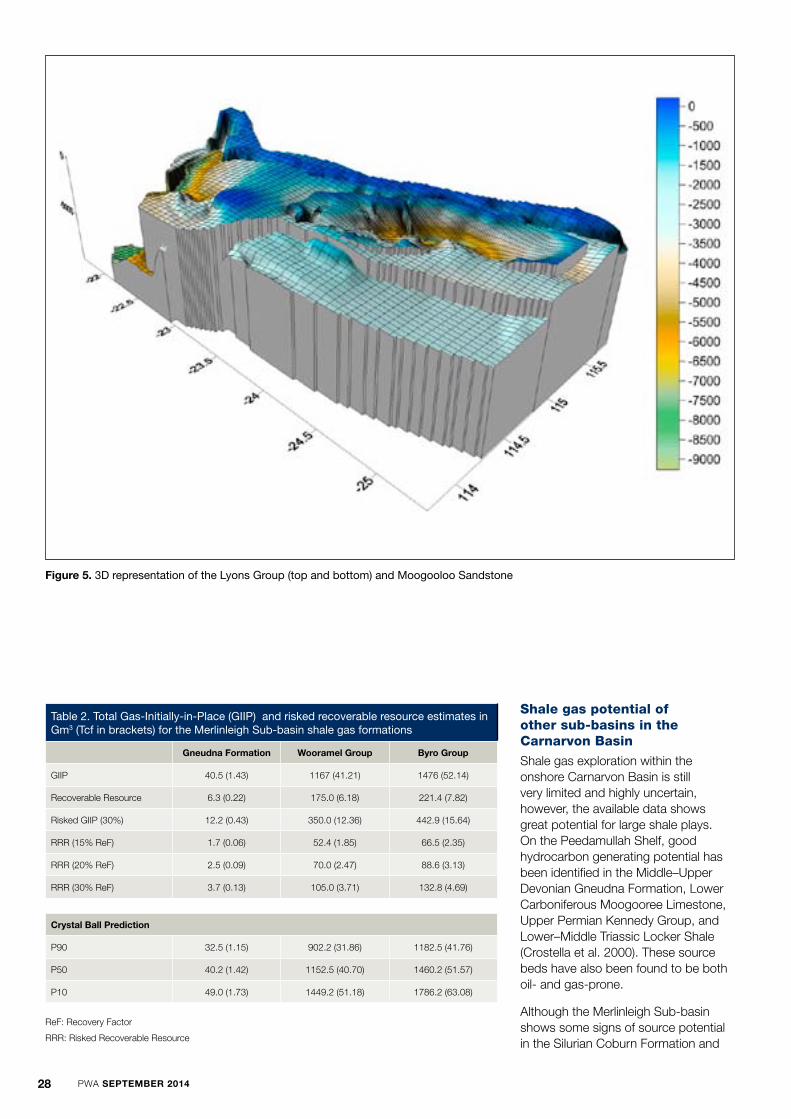
Formation maps of the Merlinleigh Sub-basin subsurface were created using Didger® 4 and Surfer® 11 software. The depth map of the Moogooloo Sandstone, which is a part of the Permian Wooramel Group, is shown in Figure 4 with the location of the intersecting wells and geological faults. A 3D compilation of three formation layers (top and bottom of the Lyons Group and Moogooloo Sandstone) was also created for enhanced visual representation (Fig. 5).
The depth of the Moogooloo Sandstone ranges from the surface down to approximately 700 m close to Kennedy Range 1, where maturity levels are also the highest, owing to a combination of temperature increase with depth and a local intrusion.
The top and bottom contours of the Lyons Group in the 3D map can be seen extending into the Peedamullah Shelf in the Northern Carnarvon Basin and plunging significantly to approximately 2745 m in the North West Exmouth region. The Moogooloo Sandstone effectively covers the entire Merlinleigh Sub-basin with concentric dip towards the centre.
TOC calculation from logs
Source rocks such as shales and lime-mudstones are known for their significant organic matter content. An alternative method to geochemical analysis utilises the responses of common well logging tools to identify organic matter in a formation. This enables geochemical data to be validated against calculated values from log data.
Observations from Passey et al. (1990) suggest that resistivity increases dramatically in mature source rocks, presumably in response to the generation of non-conductive hydrocarbons. Data with relatively high resistivity and either relatively high transit time or low bulk density represent a probable source rock; otherwise, the rock is probably barren of organic matter.
This highly successful technique is called the ‘rlogR’ method, where organic-rich intervals can be identified by the separation between the resistivity and porosity logs. GS Software was used to overlay the Resistivity and Sonic Porosity logs from four wells in the Merlinleigh Sub-basin for comparison with geochemical and log-calculated TOC values. Both the geochemical data and the calculated TOC values were found to produce a good match, thereby validating both sets of data.
Resource estimations
Resource estimations of shale gas volumes in three formations
were performed using both a deterministic and probabilistic approach. From the calculations involved in the deterministic approach, the resource estimations for the Gneudna Formation, Wooramel Group and Byro Group were found to be 40.5 Gm3 (1.43 Tcf), 1167 Gm3 (41.21 Tcf) and 1476 Gm3 (52.14 Tcf), respectively. A Monte Carlo method in Crystal Ball used probabilistic estimates to obtain P50 values that were very similar to the deterministic method, providing increased confidence in our volumetric assessment (Table 2).
Figure 4. Moogooloo Sandstone base contour map
28 PWA SEPTEMBER 2014
Table 2. Total Gas-Initially-in-Place (GIIP) and risked recoverable resource estimates in Gm3 (Tcf in brackets) for the Merlinleigh Sub-basin shale gas formations
Gneudna Formation Wooramel Group Byro Group
GIIP 40.5 (1.43) 1167 (41.21) 1476 (52.14)
Recoverable Resource 6.3 (0.22) 175.0 (6.18) 221.4 (7.82)
Risked GIIP (30%) 12.2 (0.43) 350.0 (12.36) 442.9 (15.64)
RRR (15% ReF) 1.7 (0.06) 52.4 (1.85) 66.5 (2.35)
RRR (20% ReF) 2.5 (0.09) 70.0 (2.47) 88.6 (3.13)
RRR (30% ReF) 3.7 (0.13) 105.0 (3.71) 132.8 (4.69)
Crystal Ball Prediction
P90 32.5 (1.15) 902.2 (31.86) 1182.5 (41.76)
P50 40.2 (1.42) 1152.5 (40.70) 1460.2 (51.57)
P10 49.0 (1.73) 1449.2 (51.18) 1786.2 (63.08)
ReF: Recovery Factor
RRR: Risked Recoverable Resource
Shale gas potential of other sub-basins in the Carnarvon Basin
Shale gas exploration within the onshore Carnarvon Basin is still very limited and highly uncertain, however, the available data shows great potential for large shale plays. On the Peedamullah Shelf, good hydrocarbon generating potential has been identified in the Middle–Upper Devonian Gneudna Formation, Lower Carboniferous Moogooree Limestone, Upper Permian Kennedy Group, and Lower–Middle Triassic Locker Shale (Crostella et al. 2000). These source beds have also been found to be both oil- and gas-prone.
Although the Merlinleigh Sub-basin shows some signs of source potential in the Silurian Coburn Formation and
Figure 5. 3D representation of the Lyons Group (top and bottom) and Moogooloo Sandstone

PWA SEPTEMBER 2014 29
the Devonian Gneudna Formation, these beds are conventionally considered to contain much higher potential in the Gascoyne Platform. Oil-prone source rock intervals were identified in Yaringa East 1 (southern part of the platform) and Barrabiddy 1A (northern part) consisting of thin, organic rich, laminated mudstone within carbonate facies. The Silurian source beds have an organic richness of up to 7.43% TOC, generation potential of up to 38.1 mg/g rock, and a hydrogen index of up to 505. Devonian source beds have an organic richness of up to 13.56% TOC, potential yield of up to 40.09 mg/g rock, and a hydrogen index of up to 267 (Iasky et al. 2003).
The potential for shale gas in the onshore Carnarvon Basin is in need of investigation by industry in order for exploration and data acquisition to increase. Large resource estimates have been established for shale gas plays in the Canning and Perth Basins. The resources of the Carnarvon Basin potential predict an even more exciting future for shale gas exploration and development in Western Australia.
Acknowledgements
The authors would like to acknowledge the Executive Director Petroleum, Jeff Haworth, and DMP’s Innovation Group for their support of this project.
References
Crostella, A, Iasky, RP, Blundell, KA, Yasin, AR and Ghori, KAR, 2000, Petroleum Geology of the Peedamullah Shelf and Onslow Terrace, Northern Carnarvon Basin, Western Australia: Western Australia Geological Survey, Report 73, 119p.
Ghori, KAR, 1996, Petroleum Source Rocks Merlinleigh and Byro Sub-basins, Carnarvon Basin, Western Australia: Western Australia Geological Survey, Record 1995/5, 108p.
Ghori, KAR, 2013, Emerging Unconventional Shale Plays in Western Australia. APPEA Journal (1): 313-336.
Ghori, KAR, Mory, AJ, Iasky, RP, 2005, Modelling petroleum generation in the Paleozoic of the Carnarvon Basin Western Australia: Implications for prospectivity. AAPG Bulletin (89): 27-40.
Iasky, RP, D’Ercole, C, Ghori, KAR, Mory, AJ, and Lockwood, AM, 2003, Structure and Petroleum Prospectivity of the Gascoyne Platform, Western Australia: Western Australia Geological Survey, Report 87, 56p.
Iasky, RP, Mory, AJ, Ghori, KAR, and Shevchenko, SI, 2005, Structure and petroleum potential of the Southern Merlinleigh Sub-basin Carnarvon Basin Western Australia: Western Australia Geological Survey, Report 61, 63p.
McCarthy, K, Rojas, K, Niemann, M, Palmowski, D, Peters, K and Stankiewicz, A, 2011, Basic Petroleum Geochemistry for Source Rock Evaluation. Schlumberger. http://www.slb.com/~/media/Files/resources/oilfield_review/ors11/sum11/basic_petroleum.pdf.
Passey, QR, Creaney, S, Kulla, JB, Moretti, FJ, and Stroud, JD, 1990, A Practical Model for Organic Richness from Porosity and Resistivity Logs. The American Association of Petroleum Geologists Bulletin 72 (12): 1777-1794.
Flat-lying outcrop of the Kennedy Group on the eastern side of Kennedy Range
Pho
to ©
DM
P
30 PWA SEPTEMBER 2014
A review of AS/NZS ISO 31000:2009 Risk Management – principles and guidelines
Jianhua LiuSenior GHG Storage Reservoir EngineerPetroleum Division
Introduction
ISO 31000 is the ISO standard for risk management. It is intended to be a family of standards relating to risk management codified by the International Organization for Standardization. ISO 31000:2009 provides principles and guidelines on the implementation of risk management. It is understood that in 2009 the Australian and New Zealand Standards Committee approved the adoption of this new standard as AS/NZS ISO 31000:2009.
AS/NZS ISO 31000:2009 can be applied throughout the life of an organisation, and to a wide range of activities, including strategies and decisions, operations, processes, functions, projects, products, services and assets. It can be used by the public, private and industry sectors. It can be applied to any type of risk, whatever its nature, whether having positive or negative impacts. However, it is not intended to promote uniformity of risk management nor is it intended for certification purposes.
This report briefly reviews the contents of AS/NZS ISO 31000:2009.
What are risk and risk management?
In AS/NZS ISO 31000:2009, risk is defined as the “effect of uncertainty on objectives”. Note that an effect may be positive, negative, or a deviation from the expected; an objective may be financial,
related to health and safety, or defined in other terms. Risk is often referred to potential events or consequences, or a combination of these. It is often expressed in terms of a combination of the consequences of an event, including changes in circumstances, and associated likelihood of occurrence. Uncertainty is the state, even partial, of deficiency of information related to understanding or knowledge of an event, its consequences, or likelihood.
Risk management refers to the architecture of managing risks effectively, which includes the principles, framework and process of risk management.
The components of AS/NZS ISO 31000:2009
The relationship between the risk management framework, principles and process is shown in Figure 1.
For a risk management plan to be effective, there are 11 explicitly stated principles that an organisation should comply with (see the left column of Fig. 1).
The success of the risk management will depend on the effectiveness of management framework, as described by clause 4 shown in the middle column of the above figure. It focuses on Plan, Do, Check and Act. In the Plan stage, framework has
to be designed; in the Do stage, risk management will be implemented; in the Check stage, the framework is monitored and reviewed; and in the Act stage, the framework will be improved continually.
The risk management process in the AS/NZS ISO 31000:2009 comprises five key elements.
• Communicationandconsultation– throughout the risk management process, various forms of communications (written or verbal) between risk manager, risk owner, and stakeholders will continue to occur.
• Establishingcontext–settingboundaries or parameters about risk appetite and risk management activities, considering internal factors (strategy, resources and capabilities), and external factors (social, cultural, political and economic).
• Riskassessment–identifying,analysing and evaluating risks. This is at the centre of risk management process, and comprises of three distinct steps of risk identification, risk analysis and risk evaluation.
• Risktreatment–whenthelevelofriskis intolerable, risk should be treated by avoiding risk, treating risk sources, modifying likelihood, changing consequences, or sharing elements of risks until the risk level is acceptable.
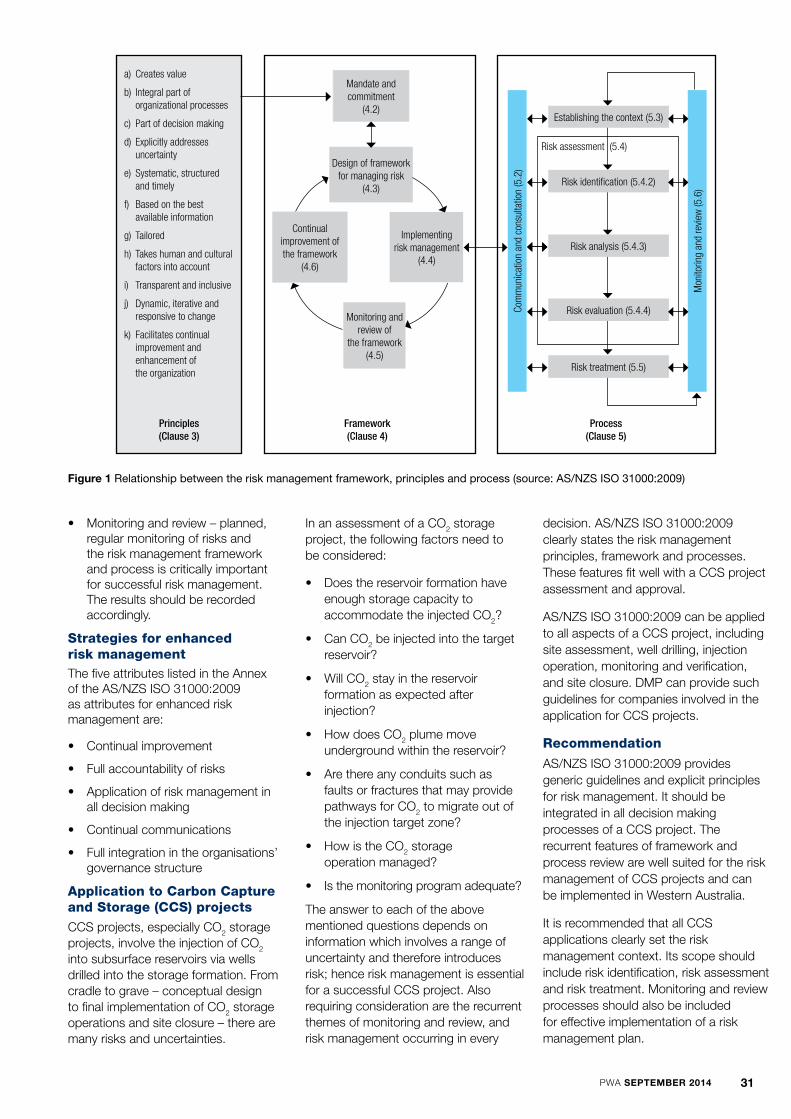
PWA SEPTEMBER 2014 31
• Monitoringandreview–planned,regular monitoring of risks and the risk management framework and process is critically important for successful risk management. The results should be recorded accordingly.
Strategies for enhanced risk managementThe five attributes listed in the Annex of the AS/NZS ISO 31000:2009 as attributes for enhanced risk management are:
• Continualimprovement
• Fullaccountabilityofrisks
• Applicationofriskmanagementinall decision making
• Continualcommunications
• Fullintegrationintheorganisations’governance structure
Application to Carbon Capture and Storage (CCS) projects
CCS projects, especially CO2 storage projects, involve the injection of CO2 into subsurface reservoirs via wells drilled into the storage formation. From cradle to grave – conceptual design to final implementation of CO2 storage operations and site closure – there are many risks and uncertainties.
In an assessment of a CO2 storage project, the following factors need to be considered:
• Doesthereservoirformationhaveenough storage capacity to accommodate the injected CO2?
• CanCO2 be injected into the target reservoir?
• WillCO2 stay in the reservoir formation as expected after injection?
• HowdoesCO2 plume move underground within the reservoir?
• Arethereanyconduitssuchasfaults or fractures that may provide pathways for CO2 to migrate out of the injection target zone?
• HowistheCO2 storage operation managed?
• Isthemonitoringprogramadequate?
The answer to each of the above mentioned questions depends on information which involves a range of uncertainty and therefore introduces risk; hence risk management is essential for a successful CCS project. Also requiring consideration are the recurrent themes of monitoring and review, and risk management occurring in every
decision. AS/NZS ISO 31000:2009 clearly states the risk management principles, framework and processes. These features fit well with a CCS project assessment and approval.
AS/NZS ISO 31000:2009 can be applied to all aspects of a CCS project, including site assessment, well drilling, injection operation, monitoring and verification, and site closure. DMP can provide such guidelines for companies involved in the application for CCS projects.
Recommendation
AS/NZS ISO 31000:2009 provides generic guidelines and explicit principles for risk management. It should be integrated in all decision making processes of a CCS project. The recurrent features of framework and process review are well suited for the risk management of CCS projects and can be implemented in Western Australia.
It is recommended that all CCS applications clearly set the risk management context. Its scope should include risk identification, risk assessment and risk treatment. Monitoring and review processes should also be included for effective implementation of a risk management plan.
Figure 1 Relationship between the risk management framework, principles and process (source: AS/NZS ISO 31000:2009)
Mon
itorin
g an
d re
view
(5.6
)
a) Creates value
b) Integral part of organizational processes
c) Part of decision making
d) Explicitly addresses uncertainty
e) Systematic, structured and timely
f) Based on the best available information
g) Tailored
h) Takes human and cultural factors into account
i) Transparent and inclusive
j) Dynamic, iterative and responsive to change
k) Facilitates continual improvement and enhancement of the organization
Principles(Clause 3)
Monitoring and review of
the framework (4.5)
Mandate and commitment
(4.2)
Design of framework for managing risk
(4.3)
Continual improvement of the framework
(4.6)
Framework(Clause 4)
Process(Clause 5)
Risk assessment (5.4)
Establishing the context (5.3)
Risk identification (5.4.2)
Risk analysis (5.4.3)
Risk evaluation (5.4.4)
Risk treatment (5.5)
Com
mun
icat
ion
and
cons
ulta
tion
(5.2
)
Implementing risk management
(4.4)

32 PWA SEPTEMBER 2014
Geomechanical characterisation of CO2 storage sites
Carbon dioxide compression module, Gorgon Project
Mina TorbatyniaPetroleum EngineerPetroleum Division
Introduction
One of the more efficient methods for reducing the amount of carbon dioxide (CO2) being emitted into the atmosphere is geological sequestration, which has been successfully undertaken in many places around the globe. Here in Western Australia, the Gorgon CO2 injection project on Barrow Island and at the South West Hub near Harvey are two major CO2 storage projects in the pipeline.
CO2 extracted from natural gas before it is converted to liquefied natural gas (LNG) can be stored underground in a suitable reservoir such as a deep brine-filled sandstone or a depleted oil and/or gasfield. CO2 can also be stored in coal seams, and can be used for enhanced oil and gas recovery (Fig. 1).
The best candidate reservoirs for CO2 storage are the ones with good porosity to provide sufficient storage space and good permeability to allow fluid flow and injection. Most importantly a good storage site must have an impervious cap rock and a suitable geological structure to trap the CO2. Potential damage to the reservoir must be avoided.
Consideration of the geomechanical properties of the reservoir rock and seal layers is essential for quantifying
the risks associated with CO2 sequestration. Geomechanical analysis predicts the evolution of effective stresses in the reservoir and seal rocks during injection, as CO2 could possibly breach the containment of the storage reservoir. The critical outcome of establishing a geomechanical model is to determine the maximum sustainable fluid pressure of the reservoir rock and seal layer. Increased pore pressure and consequent stress changes can decrease rock strength and lead to brittle failure. Fault and fracture stability and maximum sustainable pore pressure are the main parameters that are dealt with in geomechanical analysis. Repeated measurement of horizontal stresses during CO2 injection can indicate effective stress changes. Micro-seismic monitoring is also a useful tool to survey the migration pathways and to detect unexpected seismic events in the area, which may be triggered by fault slippage or the creation of fractures.
A geomechanical model is built based on the detailed geological and geomechanical characterisation of the site. In-situ stresses, fault strength data, formation pore pressure and mechanical rock properties are the main inputs for any geomechanical modelling, with detailed attention paid to plausible failure mechanisms in the rocks and to existing discontinuities such as faults and fractures.
This article discusses the various aspects of geomechanical modelling for CO2 sequestration.
In-situ stressesA common assumption in most geomechanical analyses is that one of the principal stress directions is always vertical and the other two are horizontal. This hypothesis is only valid in stable tectonic areas where all the stresses have been relaxed following an earlier tectonic event (Fjaer 2008); therefore, expecting such a stress regime in an active tectonic area is not a persuasive assumption. However, as CO2 storage sites are purposefully chosen in tectonically stable areas, this assumption is considered valid.
Maximum and minimum horizontal stresses – orientation and magnitudeIn the absence of a Diagnostic Fracture Injection Test (DFIT) in a borehole, borehole breakout and drilling-induced tensile fracture are the main indicators of the orientation of in-situ horizontal stresses at the injection site. To detect the compressive and tensile failures along the borehole walls, the bore-hole logs (calliper or image logs) must be taken after drilling. Compressive (or shear) failures occur in a direction parallel to the minimum horizontal stress, causing so-called breakouts and the ellipticity of the borehole as a result (Fig. 2).
Pho
to ©
Che
vro
n A
ustr
alia

PWA SEPTEMBER 2014 33
The tensile failures occur parallel to the maximum horizontal stress if the well mud pressure is high enough to induce such fractures.
Minimum horizontal stress (
Document1 - Error! Unknown document property name. Page 1 of 1Release Classification: - Error! Unknown document property name.
{√ }
∫ ( )
)magnitude is estimated from leak-off tests and mini-frac test data. If the tests are not carried out in a vertical well, the impact of the well bore trajectory on the measured stress needs to be considered. Low confidence information can also be
obtained from Formation Integrity tests (FIT). Quality control is necessary, since inaccuracies can lead to an erroneous estimation of
Document1 - Error! Unknown document property name. Page 1 of 1Release Classification: - Error! Unknown document property name.
{√ }
∫ ( )
and consequently an inaccurate stress profile in the geomechanical model.
The magnitude of maximum horizontal stress cannot simply be measured at site, though it is possible to constrain the value of
Document1 - Error! Unknown document property name. Page 1 of 1Release Classification: - Error! Unknown document property name.
{√ }
∫ ( )
by applying frictional faulting theory with respect to faulting regime in the area (Sibson 1974). The frictional limit to the stresses is given by:
Document1 - Error! Unknown document property name. Page 1 of 1Release Classification: - Error! Unknown document property name.
{√ }
∫ ( )
where
Document1 - Error! Unknown document property name. Page 1 of 1Release Classification: - Error! Unknown document property name.
{√ }
∫ ( )
Document1 - Error! Unknown document property name. Page 1 of 1Release Classification: - Error! Unknown document property name.
{√ }
∫ ( )
are the maximum and minimum principal stresses,
Document1 - Error! Unknown document property name. Page 1 of 1Release Classification: - Error! Unknown document property name.
{√ }
∫ ( )
is the pore pressure and
Document1 - Error! Unknown document property name. Page 1 of 1Release Classification: - Error! Unknown document property name.
{√ }
∫ ( )
is the coefficient of sliding friction on the fault plane.
and
Vertical Stress
Vertical stress (
Document1 - Error! Unknown document property name. Page 1 of 1Release Classification: - Error! Unknown document property name.
{√ }
∫ ( )
) at any point is caused by the weight of overlying rocks and fluid. Vertical stress is calculated by integrating the bulk density of the overburden rocks and
Induced fractures
Breakouts
�
�
ℎ
𝛨𝛨
Figure 1. Schematic diagram of the various geological storage mechanisms for CO2 (CO2CRC)
Figure 2. Illustration of breakouts, induced tensile fractures and maximum and minimum horizontal stress direction when a well is drilled along the vertical stress pathway (Fjaer 2008)
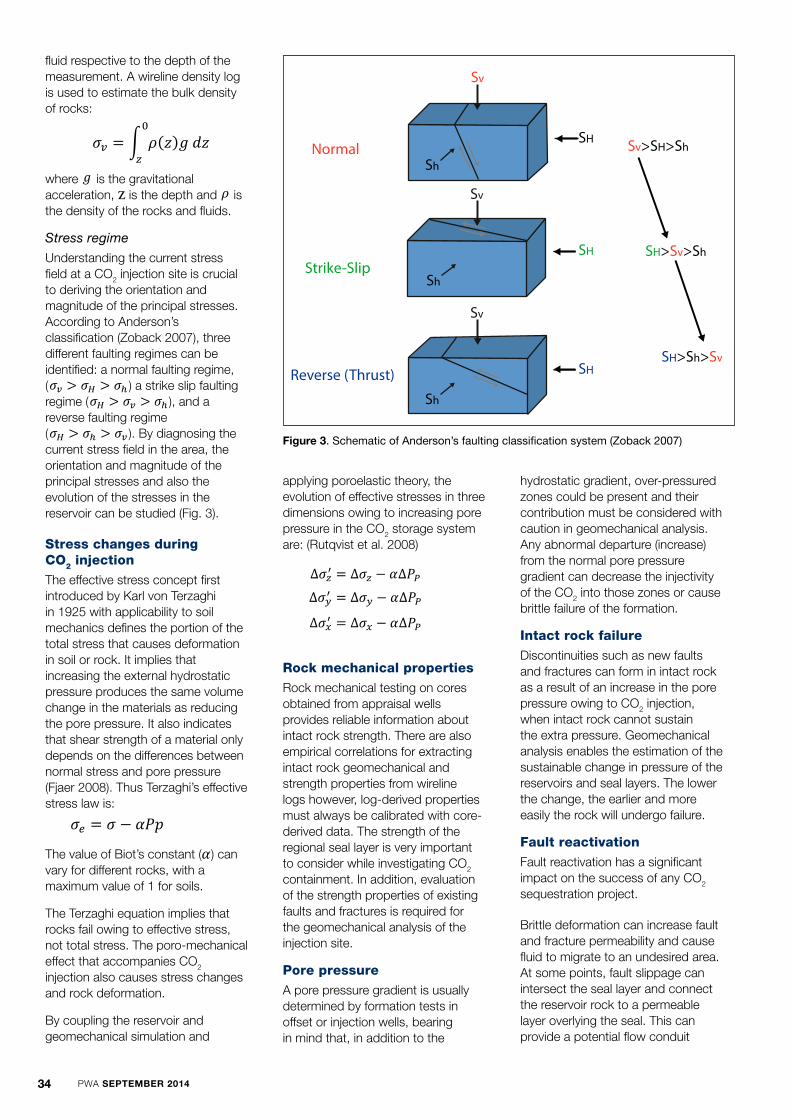
34 PWA SEPTEMBER 2014
fluid respective to the depth of the measurement. A wireline density log is used to estimate the bulk density of rocks:
Document1 - Error! Unknown document property name. Page 1 of 1Release Classification: - Error! Unknown document property name.
{√ }
∫ ( )
where
Document1 - Error! Unknown document property name. Page 1 of 1Release Classification: - Error! Unknown document property name.
{√ }
∫ ( )
is the gravitational acceleration, z is the depth and
Document1 - Error! Unknown document property name. Page 1 of 1Release Classification: - Error! Unknown document property name.
{√ }
∫ ( )
is the density of the rocks and fluids.
Stress regime
Understanding the current stress field at a CO2 injection site is crucial to deriving the orientation and magnitude of the principal stresses. According to Anderson’s classification (Zoback 2007), three different faulting regimes can be identified: a normal faulting regime, (
Document1 - Error! Unknown document property name. Page 1 of 1Release Classification: - Error! Unknown document property name.
{√ }
∫ ( )
) a strike slip faulting regime (
Document1 - Error! Unknown document property name. Page 1 of 1Release Classification: - Error! Unknown document property name.
{√ }
∫ ( )
), and a reverse faulting regime (
Document1 - Error! Unknown document property name. Page 1 of 1Release Classification: - Error! Unknown document property name.
{√ }
∫ ( )
). By diagnosing the current stress field in the area, the orientation and magnitude of the principal stresses and also the evolution of the stresses in the reservoir can be studied (Fig. 3).
Stress changes during CO2 injection
The effective stress concept first introduced by Karl von Terzaghi in 1925 with applicability to soil mechanics defines the portion of the total stress that causes deformation in soil or rock. It implies that increasing the external hydrostatic pressure produces the same volume change in the materials as reducing the pore pressure. It also indicates that shear strength of a material only depends on the differences between normal stress and pore pressure (Fjaer 2008). Thus Terzaghi’s effective stress law is:
Document1 - Error! Unknown document property name. Page 1 of 1Release Classification: - Error! Unknown document property name.
{√ }
∫ ( )
The value of Biot’s constant (
Document1 - Error! Unknown document property name. Page 1 of 1Release Classification: - Error! Unknown document property name.
{√ }
∫ ( )
) can vary for different rocks, with a maximum value of 1 for soils.
The Terzaghi equation implies that rocks fail owing to effective stress, not total stress. The poro-mechanical effect that accompanies CO2 injection also causes stress changes and rock deformation.
By coupling the reservoir and geomechanical simulation and
Normal
Strike-Slip
Reverse (Thrust)
Sv>SH>Sh
SH>Sv>Sh
SH>Sh>Sv
SH
SH
SH
Sh
Sh
Sh
Sv
Sv
Sv
applying poroelastic theory, the evolution of effective stresses in three dimensions owing to increasing pore pressure in the CO2 storage system are: (Rutqvist et al. 2008)
extra equations - Error! Unknown document property name. Page 1 of 1Release Classification: - Error! Unknown document property name.
Rock mechanical properties
Rock mechanical testing on cores obtained from appraisal wells provides reliable information about intact rock strength. There are also empirical correlations for extracting intact rock geomechanical and strength properties from wireline logs however, log-derived properties must always be calibrated with core-derived data. The strength of the regional seal layer is very important to consider while investigating CO2 containment. In addition, evaluation of the strength properties of existing faults and fractures is required for the geomechanical analysis of the injection site.
Pore pressure
A pore pressure gradient is usually determined by formation tests in offset or injection wells, bearing in mind that, in addition to the
hydrostatic gradient, over-pressured zones could be present and their contribution must be considered with caution in geomechanical analysis. Any abnormal departure (increase) from the normal pore pressure gradient can decrease the injectivity of the CO2 into those zones or cause brittle failure of the formation.
Intact rock failure
Discontinuities such as new faults and fractures can form in intact rock as a result of an increase in the pore pressure owing to CO2 injection, when intact rock cannot sustain the extra pressure. Geomechanical analysis enables the estimation of the sustainable change in pressure of the reservoirs and seal layers. The lower the change, the earlier and more easily the rock will undergo failure.
Fault reactivation
Fault reactivation has a significant impact on the success of any CO2 sequestration project.
Brittle deformation can increase fault and fracture permeability and cause fluid to migrate to an undesired area. At some points, fault slippage can intersect the seal layer and connect the reservoir rock to a permeable layer overlying the seal. This can provide a potential flow conduit
Figure 3. Schematic of Anderson’s faulting classification system (Zoback 2007)
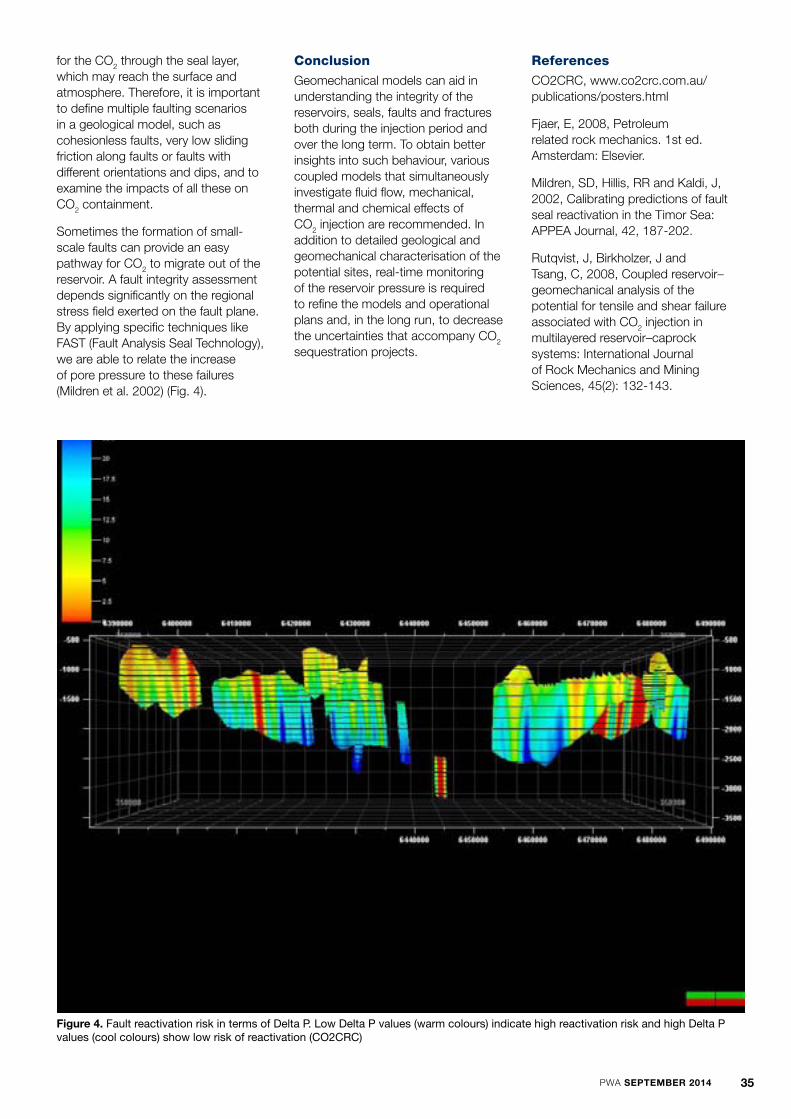
PWA SEPTEMBER 2014 35
for the CO2 through the seal layer, which may reach the surface and atmosphere. Therefore, it is important to define multiple faulting scenarios in a geological model, such as cohesionless faults, very low sliding friction along faults or faults with different orientations and dips, and to examine the impacts of all these on CO2 containment.
Sometimes the formation of small-scale faults can provide an easy pathway for CO2 to migrate out of the reservoir. A fault integrity assessment depends significantly on the regional stress field exerted on the fault plane. By applying specific techniques like FAST (Fault Analysis Seal Technology), we are able to relate the increase of pore pressure to these failures (Mildren et al. 2002) (Fig. 4).
Conclusion
Geomechanical models can aid in understanding the integrity of the reservoirs, seals, faults and fractures both during the injection period and over the long term. To obtain better insights into such behaviour, various coupled models that simultaneously investigate fluid flow, mechanical, thermal and chemical effects of CO2 injection are recommended. In addition to detailed geological and geomechanical characterisation of the potential sites, real-time monitoring of the reservoir pressure is required to refine the models and operational plans and, in the long run, to decrease the uncertainties that accompany CO2 sequestration projects.
References
CO2CRC, www.co2crc.com.au/publications/posters.html
Fjaer, E, 2008, Petroleum related rock mechanics. 1st ed. Amsterdam: Elsevier.
Mildren, SD, Hillis, RR and Kaldi, J, 2002, Calibrating predictions of fault seal reactivation in the Timor Sea: APPEA Journal, 42, 187-202.
Rutqvist, J, Birkholzer, J and Tsang, C, 2008, Coupled reservoir–geomechanical analysis of the potential for tensile and shear failure associated with CO2 injection in multilayered reservoir–caprock systems: International Journal of Rock Mechanics and Mining Sciences, 45(2): 132-143.
Figure 12: Fault reactivation risk for all faults looking west. Faults are coloured according to reactivationrisk (Delta P). High values of Delta P (cool colours) indicate low reactivation risk, whereas low values of Delta-P (warm colours) indicate high reactivation risk.
Detailed fault reactivation risk analyses were undertaken on 20 faults with known geometries(Figure 12). Fault reactivation risk was calculated using the cohesionless fault scenario (Table 5). The majority of faults in the study area are not resolvable above the reservoir level. These faults are unlikely to be a containment risk to any CO2 storage project within the Gage Sandstone. The Badaminna Fault System extends beyond the regional seal (South Perth Shale) and could present a containment risk to CO2 storage within the Gage Sandstone. The risk of fault reactivation is low to moderate for most of the fault segments modelled (cool colours in Figure 12 and Figure 13). These fault segments are unlikely to reactivate in the current stress field. Segments on some of the faults have a high reactivation risk, indicating that they may reactivate in the current stress field (warm colours in Figure 12 and Figure 13).
20
Figure 4. Fault reactivation risk in terms of Delta P. Low Delta P values (warm colours) indicate high reactivation risk and high Delta P values (cool colours) show low risk of reactivation (CO2CRC)

36 PWA SEPTEMBER 2014
Sibson, RH, 1974, Frictional constraints on thrust, wrench and normal faults: Nature, 249, 542-544.
Zoback, M, 2007, Reservoir geomechanics, 1st ed. Cambridge: Cambridge University Press.
Bibliography
Gidley, J, 1989, Recent advances in hydraulic fracturing. 1st ed. Richardson, TX: Henry L. Doherty Memorial Fund of AIME, Society of Petroleum Engineers.
Langhi, L, Zhang, Y, Nicholson, C, Bernardel, G, Rollet, N, Schaubs, P, Kempton, R and Kennard, J, 2012, Geomechanical modelling of trap integrity in the northern offshore Perth Basin. CSIRO Open File Report EP12425, CSIRO Australia.
Streit, J and Siggins, A, 2005, Predicting, monitoring and controlling geomechanical effects of CO2 injection, in ES Rubin, DW Keith, and CF Kilboy, Conference on Greenhouse Gas Control Technologies: Oxford, Elsevier, v. 1:643-651.
Tenthorey, E and van Ruth, P, 2007. Geomechanical assessment of CO2 storage in the southern Browse Basin (Barcoo Sub-basin): Cooperative Research Centre for Greenhouse Gas Technologies, Canberra, Australia, CO2CRC Publication Number RPT07-0949. 19p.
Van Ruth, P, Nelson, E and Hill, R, 2006, Fault reactivation potential during CO2 injection in the Gippsland Basin, Australia. Exploration Geophysics, 37(1): 50-59.
Van Ruth, P, 2006, Geomechanics: Vlaming Sub-basin, Western Australia: CO2CRC Report number RPT06-0043.
Pho
to ©
AW
E L
imite
d

PWA SEPTEMBER 2014 37PWA SEPTEMBER 2014

38 PWA SEPTEMBER 2014
Canning Coastal Seismic Survey

39PWA SEPTEMBER 2014
Pho
to ©
Geo
scie
nce
Aus
tral
ia

PWA SEPTEMBER 201440
TABLE 1. 2013 PRODUCTION BY FIELD AND CUMULATIVE PRODUCTION WA ONSHORE AND STATE WATERS AS AT 31 DECEMBER 2013
Field Operator
2013 Production by Field Cumulative Production
PermitOil Condensate Gas Oil Condensate Gas
kL kL 103 m3 kL kL 103 m3
Agincourt Apache 13,304.8 50.1 2,894.2 559,603.42 4,269.61 41,873.22 TL/1
Albert Apache 3,214.4 242.1 7,117.3 77,419.80 379.80 16,674.10 TL/6
Bambra Apache 19,648.4 186.2 15,026.8 403,023.10 158,301.20 1,362,609.30 TL/1
Barrow Island Chevron 300,609.0 0.0 32,994.3 51,204,658.93 0.00 5,407,368.71 L1H
Beharra Springs Origin 0.0 146.4 13,937.9 0.00 24,357.53 2,293,909.30 L11
Beharra Springs N Origin 0.0 44.1 4,168.3 0.00 2,056.34 210,398.26 L11
Blina Buru Energy 27.0 0.0 0.0 298,725.15 0.00 0.00 L6
Boundary Buru Energy 32.0 0.0 0.0 21,212.14 0.00 0.00 L6
Corybas AWE 0.0 109.7 6,103.3 0.00 342.40 18,546.33 L2
Crest Chevron 343.0 0.0 1,526.0 275,808.00 108.00 65,773.00 L12, L13
Dongara AWE 542.8 0.0 15,971.9 195,612.78 49,681.21 12,943,461.67 L1, L2
Double Island Apache 2.0 0.0 1.1 708,512.10 2,943.10 59,150.70 TL/9
Gingin West Empire 0.0 1,010.8 52,339.1 0.00 1,010.79 52,339.06 EP 389
Harriet Apache 41.6 0.0 79.8 8,232,695.10 61,226.35 1,510,761.58 TL/1
Hovea AWE 0.0 0.0 25.2 1,170,005.35 251.09 104,855.44 L1
Lee Apache 309.1 9,118.4 62,325.3 313.50 119,212.30 788,360.20 TL/1
Linda Apache 0.0 6,120.0 42,185.8 0.00 301,453.80 1,205,096.00 TL/1
Little Sandy Apache 163.2 0.5 83.3 95,352.90 491.64 15,989.80 TL/6
Mohave Apache 6,654.2 62.7 1,743.5 174,510.90 648.50 40,788.10 TL/6
Pedirka Apache 1,173.1 6.2 486.8 341,249.50 1,373.10 45,924.50 TL/6
Red Gully Empire 0.0 6,576.8 21,147.9 0.00 6,576.80 21,147.87 EP 389
Redback Origin 0.0 259.3 138,106.5 0.00 691.74 450,091.91 L11
Roller Chevron 26,611.0 0.0 11,433.0 7,211,390.00 0.00 793,215.00 TL/7
Rose Apache 3,342.4 1,239.7 14,318.1 6,383.50 210,146.40 1,052,087.90 TL/1
Saladin Chevron 60,523.0 0.0 26,407.0 15,645,337.00 0.00 1,811,653.00 TL/4
Simpson Apache 649.9 271.5 325.1 857,914.57 14,570.99 90,524.45 TL/1
South Plato Apache 12,757.6 9.0 503.9 717,546.10 908.60 52,287.00 TL/6
Sundown Buru Energy 95.0 0.0 0.0 74,207.18 0.00 0.00 L8
Tarantula Origin 0.0 175.7 15,850.7 0.00 4,102.83 331,300.40 L11
Ungani Buru Energy 6,442.0 0.0 11.4 18,537.00 0.00 15.81 EP 391
Victoria Apache 1,573.5 10.9 416.6 62,587.50 481.20 11,790.70 TL/6
West Cycad Apache 1,281.9 10.9 409.5 218,676.00 546.80 36,990.60 TL/9
West Terrace Buru Energy 13.0 0.0 0.0 39,602.35 0.00 0.00 L8
Wonnich Apache 0.0 2,556.1 27,898.1 0.00 479,450.13 4,856,471.08 TL/8
Yammaderry Chevron 0.0 0.0 13,442.0 858,332.0 0.0 142,396.0 TL/4
Total 459,353.9 28,207.1 529,279.5 89,469,215.9 1,445,582.3 35,833,851.0
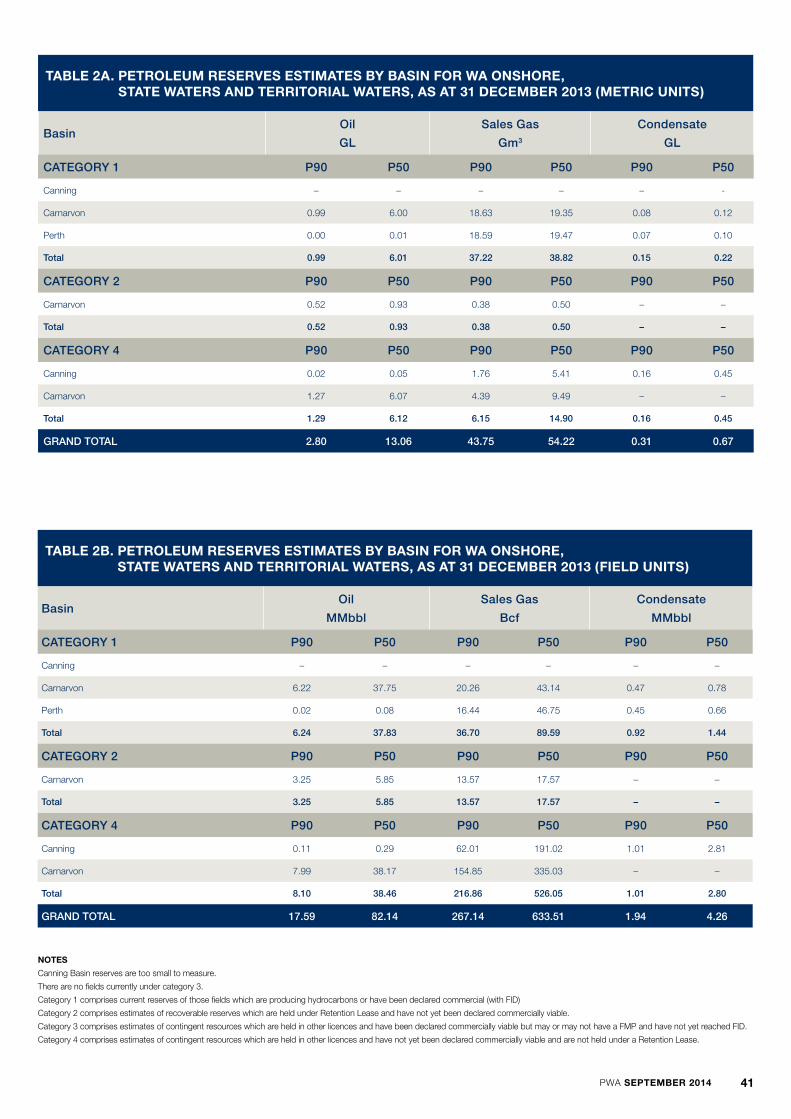
PWA SEPTEMBER 2014 41
TABLE 2A. PETROLEUM RESERVES ESTIMATES BY BASIN FOR WA ONSHORE, STATE WATERS AND TERRITORIAL WATERS, AS AT 31 DECEMBER 2013 (METRIC UNITS)
BasinOil
GL
Sales Gas
Gm3
Condensate
GL
CATEGORY 1 P90 P50 P90 P50 P90 P50
Canning – – – – – -
Carnarvon 0.99 6.00 18.63 19.35 0.08 0.12
Perth 0.00 0.01 18.59 19.47 0.07 0.10
Total 0.99 6.01 37.22 38.82 0.15 0.22
CATEGORY 2 P90 P50 P90 P50 P90 P50
Carnarvon 0.52 0.93 0.38 0.50 – –
Total 0.52 0.93 0.38 0.50 – –
CATEGORY 4 P90 P50 P90 P50 P90 P50
Canning 0.02 0.05 1.76 5.41 0.16 0.45
Carnarvon 1.27 6.07 4.39 9.49 – –
Total 1.29 6.12 6.15 14.90 0.16 0.45
GRAND TOTAL 2.80 13.06 43.75 54.22 0.31 0.67
TABLE 2B. PETROLEUM RESERVES ESTIMATES BY BASIN FOR WA ONSHORE, STATE WATERS AND TERRITORIAL WATERS, AS AT 31 DECEMBER 2013 (FIELD UNITS)
BasinOil
MMbbl
Sales Gas
Bcf
Condensate
MMbbl
CATEGORY 1 P90 P50 P90 P50 P90 P50
Canning – – – – – –
Carnarvon 6.22 37.75 20.26 43.14 0.47 0.78
Perth 0.02 0.08 16.44 46.75 0.45 0.66
Total 6.24 37.83 36.70 89.59 0.92 1.44
CATEGORY 2 P90 P50 P90 P50 P90 P50
Carnarvon 3.25 5.85 13.57 17.57 – –
Total 3.25 5.85 13.57 17.57 – –
CATEGORY 4 P90 P50 P90 P50 P90 P50
Canning 0.11 0.29 62.01 191.02 1.01 2.81
Carnarvon 7.99 38.17 154.85 335.03 – –
Total 8.10 38.46 216.86 526.05 1.01 2.80
GRAND TOTAL 17.59 82.14 267.14 633.51 1.94 4.26
NOTES
Canning Basin reserves are too small to measure.
There are no fields currently under category 3.
Category 1 comprises current reserves of those fields which are producing hydrocarbons or have been declared commercial (with FID)
Category 2 comprises estimates of recoverable reserves which are held under Retention Lease and have not yet been declared commercially viable.
Category 3 comprises estimates of contingent resources which are held in other licences and have been declared commercially viable but may or may not have a FMP and have not yet reached FID.
Category 4 comprises estimates of contingent resources which are held in other licences and have not yet been declared commercially viable and are not held under a Retention Lease.
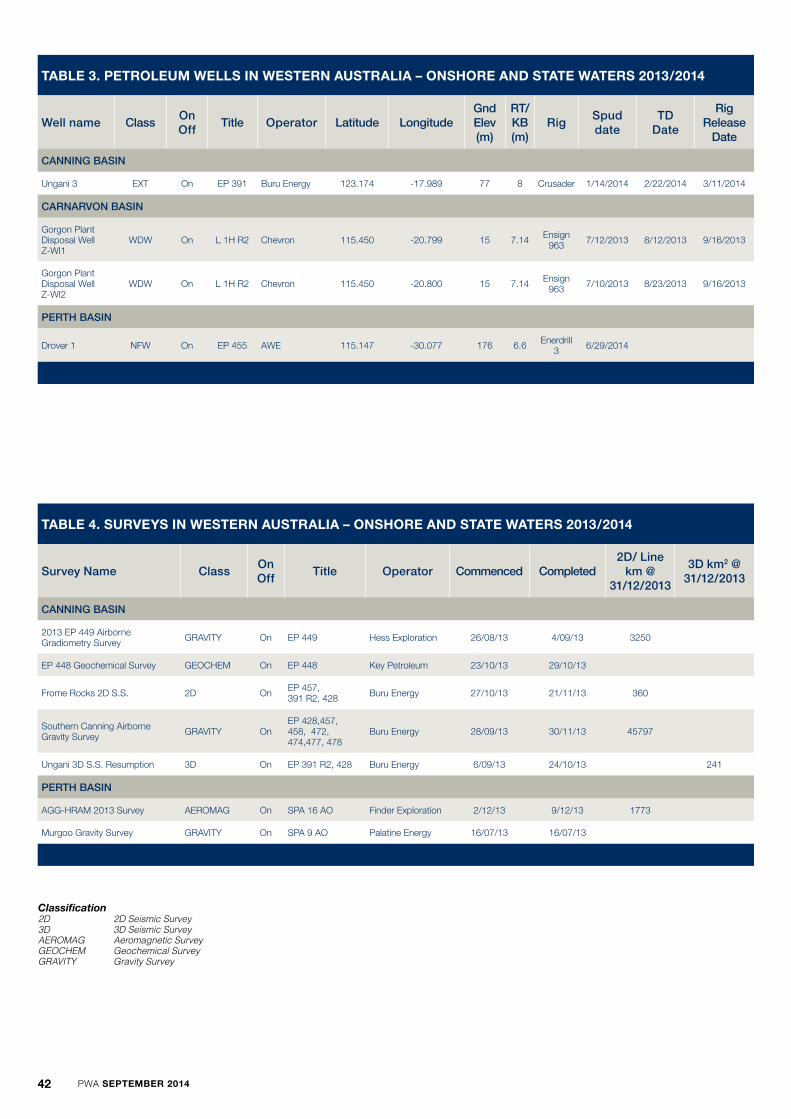
42 PWA SEPTEMBER 2014
TABLE 3. PETROLEUM WELLS IN WESTERN AUSTRALIA – ONSHORE AND STATE WATERS 2013/2014
Well name ClassOn Off
Title Operator Latitude LongitudeGnd Elev (m)
RT/KB (m)
RigSpud date
TD Date
Rig Release
Date
CANNING BASIN
Ungani 3 EXT On EP 391 Buru Energy 123.174 -17.989 77 8 Crusader 1/14/2014 2/22/2014 3/11/2014
CARNARVON BASIN
Gorgon Plant Disposal Well Z-WI1
WDW On L 1H R2 Chevron 115.450 -20.799 15 7.14 Ensign 963 7/12/2013 8/12/2013 9/16/2013
Gorgon Plant Disposal Well Z-WI2
WDW On L 1H R2 Chevron 115.450 -20.800 15 7.14 Ensign 963 7/10/2013 8/23/2013 9/16/2013
PERTH BASIN
Drover 1 NFW On EP 455 AWE 115.147 -30.077 176 6.6 Enerdrill 3 6/29/2014
TABLE 4. SURVEYS IN WESTERN AUSTRALIA – ONSHORE AND STATE WATERS 2013/2014
Survey Name ClassOn Off
Title Operator Commenced Completed2D/ Line
km @ 31/12/2013
3D km2 @ 31/12/2013
CANNING BASIN
2013 EP 449 Airborne Gradiometry Survey GRAVITY On EP 449 Hess Exploration 26/08/13 4/09/13 3250
EP 448 Geochemical Survey GEOCHEM On EP 448 Key Petroleum 23/10/13 29/10/13
Frome Rocks 2D S.S. 2D On EP 457, 391 R2, 428 Buru Energy 27/10/13 21/11/13 360
Southern Canning Airborne Gravity Survey GRAVITY On
EP 428,457, 458, 472, 474,477, 478
Buru Energy 28/09/13 30/11/13 45797
Ungani 3D S.S. Resumption 3D On EP 391 R2, 428 Buru Energy 6/09/13 24/10/13 241
PERTH BASIN
AGG-HRAM 2013 Survey AEROMAG On SPA 16 AO Finder Exploration 2/12/13 9/12/13 1773
Murgoo Gravity Survey GRAVITY On SPA 9 AO Palatine Energy 16/07/13 16/07/13
Classification2D 2D Seismic Survey3D 3D Seismic SurveyAEROMAG Aeromagnetic SurveyGEOCHEM Geochemical SurveyGRAVITY Gravity Survey
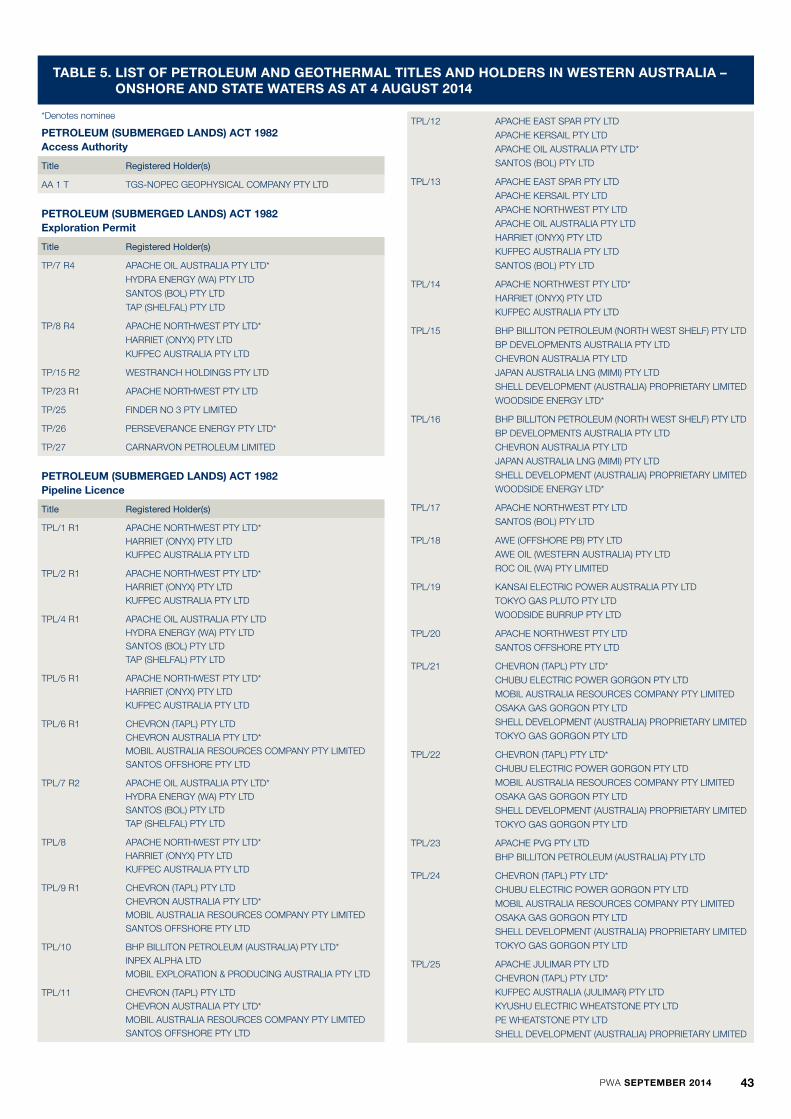
PWA SEPTEMBER 2014 43
TABLE 5. LIST OF PETROLEUM AND GEOTHERMAL TITLES AND HOLDERS IN WESTERN AUSTRALIA – ONSHORE AND STATE WATERS AS AT 4 AUGUST 2014
*Denotes nominee
PETROLEUM (SUBMERGED LANDS) ACT 1982Access Authority
Title Registered Holder(s)
AA 1 T TGS-NOPEC GEOPHYSICAL COMPANY PTY LTD
PETROLEUM (SUBMERGED LANDS) ACT 1982Exploration Permit
Title Registered Holder(s)
TP/7 R4 APACHE OIL AUSTRALIA PTY LTD*
HYDRA ENERGY (WA) PTY LTD
SANTOS (BOL) PTY LTD
TAP (SHELFAL) PTY LTD
TP/8 R4 APACHE NORTHWEST PTY LTD*
HARRIET (ONYX) PTY LTD
KUFPEC AUSTRALIA PTY LTD
TP/15 R2 WESTRANCH HOLDINGS PTY LTD
TP/23 R1 APACHE NORTHWEST PTY LTD
TP/25 FINDER NO 3 PTY LIMITED
TP/26 PERSEVERANCE ENERGY PTY LTD*
TP/27 CARNARVON PETROLEUM LIMITED
PETROLEUM (SUBMERGED LANDS) ACT 1982Pipeline Licence
Title Registered Holder(s)
TPL/1 R1 APACHE NORTHWEST PTY LTD*HARRIET (ONYX) PTY LTDKUFPEC AUSTRALIA PTY LTD
TPL/2 R1 APACHE NORTHWEST PTY LTD*HARRIET (ONYX) PTY LTDKUFPEC AUSTRALIA PTY LTD
TPL/4 R1 APACHE OIL AUSTRALIA PTY LTDHYDRA ENERGY (WA) PTY LTDSANTOS (BOL) PTY LTDTAP (SHELFAL) PTY LTD
TPL/5 R1 APACHE NORTHWEST PTY LTD*HARRIET (ONYX) PTY LTDKUFPEC AUSTRALIA PTY LTD
TPL/6 R1 CHEVRON (TAPL) PTY LTDCHEVRON AUSTRALIA PTY LTD*MOBIL AUSTRALIA RESOURCES COMPANY PTY LIMITEDSANTOS OFFSHORE PTY LTD
TPL/7 R2 APACHE OIL AUSTRALIA PTY LTD*HYDRA ENERGY (WA) PTY LTDSANTOS (BOL) PTY LTDTAP (SHELFAL) PTY LTD
TPL/8 APACHE NORTHWEST PTY LTD*HARRIET (ONYX) PTY LTDKUFPEC AUSTRALIA PTY LTD
TPL/9 R1 CHEVRON (TAPL) PTY LTDCHEVRON AUSTRALIA PTY LTD*MOBIL AUSTRALIA RESOURCES COMPANY PTY LIMITEDSANTOS OFFSHORE PTY LTD
TPL/10 BHP BILLITON PETROLEUM (AUSTRALIA) PTY LTD*INPEX ALPHA LTDMOBIL EXPLORATION & PRODUCING AUSTRALIA PTY LTD
TPL/11 CHEVRON (TAPL) PTY LTDCHEVRON AUSTRALIA PTY LTD*MOBIL AUSTRALIA RESOURCES COMPANY PTY LIMITEDSANTOS OFFSHORE PTY LTD
TPL/12 APACHE EAST SPAR PTY LTD
APACHE KERSAIL PTY LTD
APACHE OIL AUSTRALIA PTY LTD*
SANTOS (BOL) PTY LTD
TPL/13 APACHE EAST SPAR PTY LTD
APACHE KERSAIL PTY LTD
APACHE NORTHWEST PTY LTD
APACHE OIL AUSTRALIA PTY LTD
HARRIET (ONYX) PTY LTD
KUFPEC AUSTRALIA PTY LTD
SANTOS (BOL) PTY LTD
TPL/14 APACHE NORTHWEST PTY LTD*
HARRIET (ONYX) PTY LTD
KUFPEC AUSTRALIA PTY LTD
TPL/15 BHP BILLITON PETROLEUM (NORTH WEST SHELF) PTY LTD
BP DEVELOPMENTS AUSTRALIA PTY LTD
CHEVRON AUSTRALIA PTY LTD
JAPAN AUSTRALIA LNG (MIMI) PTY LTD
SHELL DEVELOPMENT (AUSTRALIA) PROPRIETARY LIMITED
WOODSIDE ENERGY LTD*
TPL/16 BHP BILLITON PETROLEUM (NORTH WEST SHELF) PTY LTD
BP DEVELOPMENTS AUSTRALIA PTY LTD
CHEVRON AUSTRALIA PTY LTD
JAPAN AUSTRALIA LNG (MIMI) PTY LTD
SHELL DEVELOPMENT (AUSTRALIA) PROPRIETARY LIMITED
WOODSIDE ENERGY LTD*
TPL/17 APACHE NORTHWEST PTY LTD
SANTOS (BOL) PTY LTD
TPL/18 AWE (OFFSHORE PB) PTY LTD
AWE OIL (WESTERN AUSTRALIA) PTY LTD
ROC OIL (WA) PTY LIMITED
TPL/19 KANSAI ELECTRIC POWER AUSTRALIA PTY LTD
TOKYO GAS PLUTO PTY LTD
WOODSIDE BURRUP PTY LTD
TPL/20 APACHE NORTHWEST PTY LTD
SANTOS OFFSHORE PTY LTD
TPL/21 CHEVRON (TAPL) PTY LTD*
CHUBU ELECTRIC POWER GORGON PTY LTD
MOBIL AUSTRALIA RESOURCES COMPANY PTY LIMITED
OSAKA GAS GORGON PTY LTD
SHELL DEVELOPMENT (AUSTRALIA) PROPRIETARY LIMITED
TOKYO GAS GORGON PTY LTD
TPL/22 CHEVRON (TAPL) PTY LTD*
CHUBU ELECTRIC POWER GORGON PTY LTD
MOBIL AUSTRALIA RESOURCES COMPANY PTY LIMITED
OSAKA GAS GORGON PTY LTD
SHELL DEVELOPMENT (AUSTRALIA) PROPRIETARY LIMITED
TOKYO GAS GORGON PTY LTD
TPL/23 APACHE PVG PTY LTD
BHP BILLITON PETROLEUM (AUSTRALIA) PTY LTD
TPL/24 CHEVRON (TAPL) PTY LTD*
CHUBU ELECTRIC POWER GORGON PTY LTD
MOBIL AUSTRALIA RESOURCES COMPANY PTY LIMITED
OSAKA GAS GORGON PTY LTD
SHELL DEVELOPMENT (AUSTRALIA) PROPRIETARY LIMITED
TOKYO GAS GORGON PTY LTD
TPL/25 APACHE JULIMAR PTY LTD
CHEVRON (TAPL) PTY LTD*
KUFPEC AUSTRALIA (JULIMAR) PTY LTD
KYUSHU ELECTRIC WHEATSTONE PTY LTD
PE WHEATSTONE PTY LTD
SHELL DEVELOPMENT (AUSTRALIA) PROPRIETARY LIMITED

44 PWA SEPTEMBER 2014
PETROLEUM (SUBMERGED LANDS) ACT 1982Production Licence
Title Registered Holder(s)
TL/1 R1 APACHE NORTHWEST PTY LTD*
HARRIET (ONYX) PTY LTD
KUFPEC AUSTRALIA PTY LTD
TL/2 R1 APACHE OIL AUSTRALIA PTY LTD*
HYDRA ENERGY (WA) PTY LTD
SANTOS (BOL) PTY LTD
TAP (SHELFAL) PTY LTD
TL/3 R1 CHEVRON (TAPL) PTY LTD
CHEVRON AUSTRALIA PTY LTD*
MOBIL AUSTRALIA RESOURCES COMPANY PTY LIMITED
SANTOS OFFSHORE PTY LTD
TL/4 R1 CHEVRON (TAPL) PTY LTD
CHEVRON AUSTRALIA PTY LTD*
MOBIL AUSTRALIA RESOURCES COMPANY PTY LIMITED
SANTOS OFFSHORE PTY LTD
TL/5 R1 APACHE NORTHWEST PTY LTD*
HARRIET (ONYX) PTY LTD
KUFPEC AUSTRALIA PTY LTD
TL/6 R1 APACHE NORTHWEST PTY LTD*
HARRIET (ONYX) PTY LTD
KUFPEC AUSTRALIA PTY LTD
TL/7 CHEVRON (TAPL) PTY LTD
CHEVRON AUSTRALIA PTY LTD*
MOBIL AUSTRALIA RESOURCES COMPANY PTY LIMITED
SANTOS OFFSHORE PTY LTD
TL/8 APACHE NORTHWEST PTY LTD*
HARRIET (ONYX) PTY LTD
KUFPEC AUSTRALIA PTY LTD
TL/9 APACHE NORTHWEST PTY LTD*
HARRIET (ONYX) PTY LTD
KUFPEC AUSTRALIA PTY LTD
TL/10 APACHE NORTHWEST PTY LTD
HARRIET (ONYX) PTY LTD
KUFPEC AUSTRALIA PTY LTD
PETROLEUM (SUBMERGED LANDS) ACT 1982Retention Lease
Title Registered Holder(s)
TR/1 R2 APACHE NORTHWEST PTY LTD*
HARRIET (ONYX) PTY LTD
KUFPEC AUSTRALIA PTY LTD
TR/3 R2 APACHE NORTHWEST PTY LTD
TR/4 R1 CHEVRON (TAPL) PTY LTD
CHEVRON AUSTRALIA PTY LTD*
MOBIL AUSTRALIA RESOURCES COMPANY PTY LIMITED
SANTOS OFFSHORE PTY LTD
TR/5 R1 BP DEVELOPMENTS AUSTRALIA PTY LTD
JAPAN AUSTRALIA LNG (MIMI BROWSE) PTY LTD
PETROCHINA INTERNATIONAL INVESTMENT
(AUSTRALIA) PTY LTD
SHELL DEVELOPMENT (AUSTRALIA) PROPRIETARY LIMITED
WOODSIDE BROWSE PTY. LTD.
TR/6 CHEVRON (TAPL) PTY LTD
CHEVRON AUSTRALIA PTY LTD
MOBIL AUSTRALIA RESOURCES COMPANY PTY LIMITED
SANTOS OFFSHORE PTY LTD
PETROLEUM (SUBMERGED LANDS) ACT 1982Special Prospecting Authority
Title Registered Holder(s)
SPA 1 T TGS-NOPEC GEOPHYSICAL COMPANY PTY LTD
PETROLEUM AND GEOTHERMAL ENERGY RESOURCES ACT 1967Access Authority
Title Registered Holder(s)
AA 5
AA 6 TGS-NOPEC GEOPHYSICAL COMPANY PTY LTD
PETROLEUM AND GEOTHERMAL ENERGY RESOURCES ACT 1967Drilling Reservation
Title Registered Holder(s)
DR 11 TITAN ENERGY LTD
PETROLEUM AND GEOTHERMAL ENERGY RESOURCES ACT 1967Exploration Permit
Title Registered Holder(s)
EP 61 R7 CHEVRON (TAPL) PTY LTD
CHEVRON AUSTRALIA PTY LTD*
MOBIL AUSTRALIA RESOURCES COMPANY PTY LIMITED
SANTOS OFFSHORE PTY LTD
EP 62 R7 CHEVRON (TAPL) PTY LTD
CHEVRON AUSTRALIA PTY LTD*
MOBIL AUSTRALIA RESOURCES COMPANY PTY LIMITED
SANTOS OFFSHORE PTY LTD
EP 104 R5 ARC ENERGY PTY LIMITED
FAR LTD
GULLIVER PRODUCTIONS PTY LTD
INDIGO OIL PTY LTD
PANCONTINENTAL OIL & GAS NL
PHOENIX RESOURCES PLC
EP 110 R5 PANCONTINENTAL OIL & GAS NL
STRIKE ENERGY WESTERN AUSTRALIA PTY LIMITED
EP 129 R5 BURU ENERGY LIMITED
EP 307 R5 APACHE NORTHWEST PTY LTD*
HARRIET (ONYX) PTY LTD
KUFPEC AUSTRALIA PTY LTD
EP 320 R4 AWE (BEHARRA SPRINGS) PTY LTD
ORIGIN ENERGY DEVELOPMENTS PTY LIMITED*
EP 321 R3 ALCOA OF AUSTRALIA LIMITED
LATENT PETROLEUM PTY LTD*
EP 325 R3 ADVENT ENERGY LTD
BOW ENERGY PTY LTD
ROUGH RANGE OIL PTY LTD
STRIKE ENERGY WESTERN AUSTRALIA PTY LIMITED
EP 357 R3 CHEVRON (TAPL) PTY LTD
CHEVRON AUSTRALIA PTY LTD*
MOBIL AUSTRALIA RESOURCES COMPANY PTY LIMITED
SANTOS OFFSHORE PTY LTD
EP 358 R3 APACHE NORTHWEST PTY LTD*
HARRIET (ONYX) PTY LTD
KUFPEC AUSTRALIA PTY LTD
EP 359 R3 BOUNTY OIL & GAS NL
LANSVALE OIL & GAS PTY LTD
PACE PETROLEUM PTY LTD
PHOENIX RESOURCES PLC
ROUGH RANGE OIL PTY LTD
TABLE 5. LIST OF PETROLEUM AND GEOTHERMAL TITLES AND HOLDERS IN WESTERN AUSTRALIA – ONSHORE AND STATE WATERS AS AT 4 AUGUST 2014
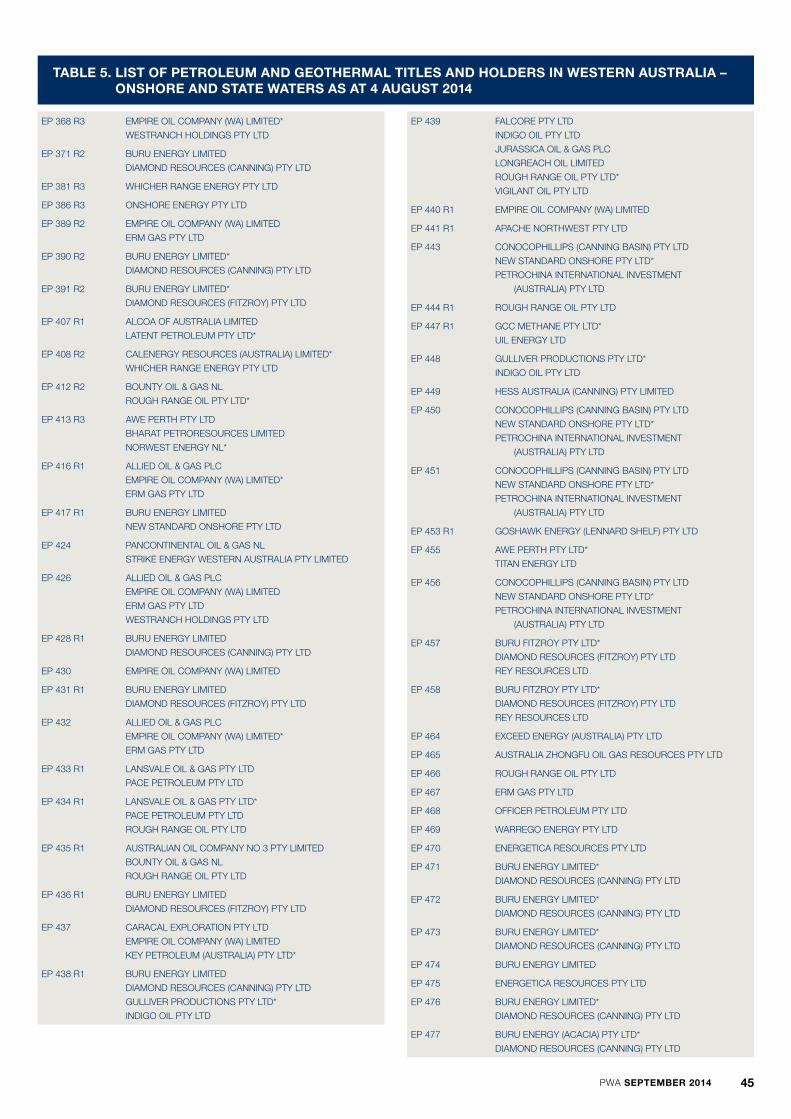
PWA SEPTEMBER 2014 45
EP 368 R3 EMPIRE OIL COMPANY (WA) LIMITED*
WESTRANCH HOLDINGS PTY LTD
EP 371 R2 BURU ENERGY LIMITED
DIAMOND RESOURCES (CANNING) PTY LTD
EP 381 R3 WHICHER RANGE ENERGY PTY LTD
EP 386 R3 ONSHORE ENERGY PTY LTD
EP 389 R2 EMPIRE OIL COMPANY (WA) LIMITED
ERM GAS PTY LTD
EP 390 R2 BURU ENERGY LIMITED*
DIAMOND RESOURCES (CANNING) PTY LTD
EP 391 R2 BURU ENERGY LIMITED*
DIAMOND RESOURCES (FITZROY) PTY LTD
EP 407 R1 ALCOA OF AUSTRALIA LIMITED
LATENT PETROLEUM PTY LTD*
EP 408 R2 CALENERGY RESOURCES (AUSTRALIA) LIMITED*
WHICHER RANGE ENERGY PTY LTD
EP 412 R2 BOUNTY OIL & GAS NL
ROUGH RANGE OIL PTY LTD*
EP 413 R3 AWE PERTH PTY LTD
BHARAT PETRORESOURCES LIMITED
NORWEST ENERGY NL*
EP 416 R1 ALLIED OIL & GAS PLC
EMPIRE OIL COMPANY (WA) LIMITED*
ERM GAS PTY LTD
EP 417 R1 BURU ENERGY LIMITED
NEW STANDARD ONSHORE PTY LTD
EP 424 PANCONTINENTAL OIL & GAS NL
STRIKE ENERGY WESTERN AUSTRALIA PTY LIMITED
EP 426 ALLIED OIL & GAS PLC
EMPIRE OIL COMPANY (WA) LIMITED
ERM GAS PTY LTD
WESTRANCH HOLDINGS PTY LTD
EP 428 R1 BURU ENERGY LIMITED
DIAMOND RESOURCES (CANNING) PTY LTD
EP 430 EMPIRE OIL COMPANY (WA) LIMITED
EP 431 R1 BURU ENERGY LIMITED
DIAMOND RESOURCES (FITZROY) PTY LTD
EP 432 ALLIED OIL & GAS PLC
EMPIRE OIL COMPANY (WA) LIMITED*
ERM GAS PTY LTD
EP 433 R1 LANSVALE OIL & GAS PTY LTD
PACE PETROLEUM PTY LTD
EP 434 R1 LANSVALE OIL & GAS PTY LTD*
PACE PETROLEUM PTY LTD
ROUGH RANGE OIL PTY LTD
EP 435 R1 AUSTRALIAN OIL COMPANY NO 3 PTY LIMITED
BOUNTY OIL & GAS NL
ROUGH RANGE OIL PTY LTD
EP 436 R1 BURU ENERGY LIMITED
DIAMOND RESOURCES (FITZROY) PTY LTD
EP 437 CARACAL EXPLORATION PTY LTD
EMPIRE OIL COMPANY (WA) LIMITED
KEY PETROLEUM (AUSTRALIA) PTY LTD*
EP 438 R1 BURU ENERGY LIMITED
DIAMOND RESOURCES (CANNING) PTY LTD
GULLIVER PRODUCTIONS PTY LTD*
INDIGO OIL PTY LTD
EP 439 FALCORE PTY LTD
INDIGO OIL PTY LTD
JURASSICA OIL & GAS PLC
LONGREACH OIL LIMITED
ROUGH RANGE OIL PTY LTD*
VIGILANT OIL PTY LTD
EP 440 R1 EMPIRE OIL COMPANY (WA) LIMITED
EP 441 R1 APACHE NORTHWEST PTY LTD
EP 443 CONOCOPHILLIPS (CANNING BASIN) PTY LTD
NEW STANDARD ONSHORE PTY LTD*
PETROCHINA INTERNATIONAL INVESTMENT
(AUSTRALIA) PTY LTD
EP 444 R1 ROUGH RANGE OIL PTY LTD
EP 447 R1 GCC METHANE PTY LTD*
UIL ENERGY LTD
EP 448 GULLIVER PRODUCTIONS PTY LTD*
INDIGO OIL PTY LTD
EP 449 HESS AUSTRALIA (CANNING) PTY LIMITED
EP 450 CONOCOPHILLIPS (CANNING BASIN) PTY LTD
NEW STANDARD ONSHORE PTY LTD*
PETROCHINA INTERNATIONAL INVESTMENT
(AUSTRALIA) PTY LTD
EP 451 CONOCOPHILLIPS (CANNING BASIN) PTY LTD
NEW STANDARD ONSHORE PTY LTD*
PETROCHINA INTERNATIONAL INVESTMENT
(AUSTRALIA) PTY LTD
EP 453 R1 GOSHAWK ENERGY (LENNARD SHELF) PTY LTD
EP 455 AWE PERTH PTY LTD*
TITAN ENERGY LTD
EP 456 CONOCOPHILLIPS (CANNING BASIN) PTY LTD
NEW STANDARD ONSHORE PTY LTD*
PETROCHINA INTERNATIONAL INVESTMENT
(AUSTRALIA) PTY LTD
EP 457 BURU FITZROY PTY LTD*
DIAMOND RESOURCES (FITZROY) PTY LTD
REY RESOURCES LTD
EP 458 BURU FITZROY PTY LTD*
DIAMOND RESOURCES (FITZROY) PTY LTD
REY RESOURCES LTD
EP 464 EXCEED ENERGY (AUSTRALIA) PTY LTD
EP 465 AUSTRALIA ZHONGFU OIL GAS RESOURCES PTY LTD
EP 466 ROUGH RANGE OIL PTY LTD
EP 467 ERM GAS PTY LTD
EP 468 OFFICER PETROLEUM PTY LTD
EP 469 WARREGO ENERGY PTY LTD
EP 470 ENERGETICA RESOURCES PTY LTD
EP 471 BURU ENERGY LIMITED*
DIAMOND RESOURCES (CANNING) PTY LTD
EP 472 BURU ENERGY LIMITED*
DIAMOND RESOURCES (CANNING) PTY LTD
EP 473 BURU ENERGY LIMITED*
DIAMOND RESOURCES (CANNING) PTY LTD
EP 474 BURU ENERGY LIMITED
EP 475 ENERGETICA RESOURCES PTY LTD
EP 476 BURU ENERGY LIMITED*
DIAMOND RESOURCES (CANNING) PTY LTD
EP 477 BURU ENERGY (ACACIA) PTY LTD*
DIAMOND RESOURCES (CANNING) PTY LTD
TABLE 5. LIST OF PETROLEUM AND GEOTHERMAL TITLES AND HOLDERS IN WESTERN AUSTRALIA – ONSHORE AND STATE WATERS AS AT 4 AUGUST 2014
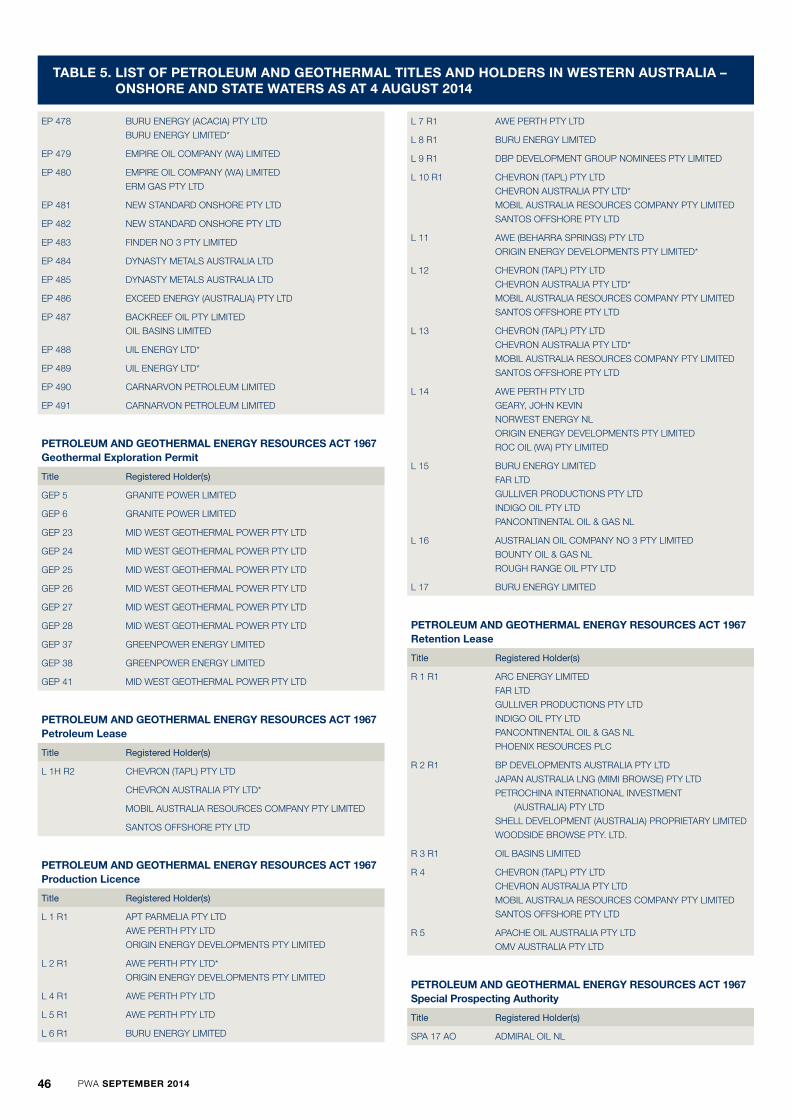
46 PWA SEPTEMBER 2014
EP 478 BURU ENERGY (ACACIA) PTY LTD
BURU ENERGY LIMITED*
EP 479 EMPIRE OIL COMPANY (WA) LIMITED
EP 480 EMPIRE OIL COMPANY (WA) LIMITED
ERM GAS PTY LTD
EP 481 NEW STANDARD ONSHORE PTY LTD
EP 482 NEW STANDARD ONSHORE PTY LTD
EP 483 FINDER NO 3 PTY LIMITED
EP 484 DYNASTY METALS AUSTRALIA LTD
EP 485 DYNASTY METALS AUSTRALIA LTD
EP 486 EXCEED ENERGY (AUSTRALIA) PTY LTD
EP 487 BACKREEF OIL PTY LIMITED
OIL BASINS LIMITED
EP 488 UIL ENERGY LTD*
EP 489 UIL ENERGY LTD*
EP 490 CARNARVON PETROLEUM LIMITED
EP 491 CARNARVON PETROLEUM LIMITED
PETROLEUM AND GEOTHERMAL ENERGY RESOURCES ACT 1967Geothermal Exploration Permit
Title Registered Holder(s)
GEP 5 GRANITE POWER LIMITED
GEP 6 GRANITE POWER LIMITED
GEP 23 MID WEST GEOTHERMAL POWER PTY LTD
GEP 24 MID WEST GEOTHERMAL POWER PTY LTD
GEP 25 MID WEST GEOTHERMAL POWER PTY LTD
GEP 26 MID WEST GEOTHERMAL POWER PTY LTD
GEP 27 MID WEST GEOTHERMAL POWER PTY LTD
GEP 28 MID WEST GEOTHERMAL POWER PTY LTD
GEP 37 GREENPOWER ENERGY LIMITED
GEP 38 GREENPOWER ENERGY LIMITED
GEP 41 MID WEST GEOTHERMAL POWER PTY LTD
PETROLEUM AND GEOTHERMAL ENERGY RESOURCES ACT 1967Petroleum Lease
Title Registered Holder(s)
L 1H R2 CHEVRON (TAPL) PTY LTD
CHEVRON AUSTRALIA PTY LTD*
MOBIL AUSTRALIA RESOURCES COMPANY PTY LIMITED
SANTOS OFFSHORE PTY LTD
PETROLEUM AND GEOTHERMAL ENERGY RESOURCES ACT 1967Production Licence
Title Registered Holder(s)
L 1 R1 APT PARMELIA PTY LTD
AWE PERTH PTY LTD
ORIGIN ENERGY DEVELOPMENTS PTY LIMITED
L 2 R1 AWE PERTH PTY LTD*
ORIGIN ENERGY DEVELOPMENTS PTY LIMITED
L 4 R1 AWE PERTH PTY LTD
L 5 R1 AWE PERTH PTY LTD
L 6 R1 BURU ENERGY LIMITED
L 7 R1 AWE PERTH PTY LTD
L 8 R1 BURU ENERGY LIMITED
L 9 R1 DBP DEVELOPMENT GROUP NOMINEES PTY LIMITED
L 10 R1 CHEVRON (TAPL) PTY LTD
CHEVRON AUSTRALIA PTY LTD*
MOBIL AUSTRALIA RESOURCES COMPANY PTY LIMITED
SANTOS OFFSHORE PTY LTD
L 11 AWE (BEHARRA SPRINGS) PTY LTD
ORIGIN ENERGY DEVELOPMENTS PTY LIMITED*
L 12 CHEVRON (TAPL) PTY LTD
CHEVRON AUSTRALIA PTY LTD*
MOBIL AUSTRALIA RESOURCES COMPANY PTY LIMITED
SANTOS OFFSHORE PTY LTD
L 13 CHEVRON (TAPL) PTY LTD
CHEVRON AUSTRALIA PTY LTD*
MOBIL AUSTRALIA RESOURCES COMPANY PTY LIMITED
SANTOS OFFSHORE PTY LTD
L 14 AWE PERTH PTY LTD
GEARY, JOHN KEVIN
NORWEST ENERGY NL
ORIGIN ENERGY DEVELOPMENTS PTY LIMITED
ROC OIL (WA) PTY LIMITED
L 15 BURU ENERGY LIMITED
FAR LTD
GULLIVER PRODUCTIONS PTY LTD
INDIGO OIL PTY LTD
PANCONTINENTAL OIL & GAS NL
L 16 AUSTRALIAN OIL COMPANY NO 3 PTY LIMITED
BOUNTY OIL & GAS NL
ROUGH RANGE OIL PTY LTD
L 17 BURU ENERGY LIMITED
PETROLEUM AND GEOTHERMAL ENERGY RESOURCES ACT 1967Retention Lease
Title Registered Holder(s)
R 1 R1 ARC ENERGY LIMITED
FAR LTD
GULLIVER PRODUCTIONS PTY LTD
INDIGO OIL PTY LTD
PANCONTINENTAL OIL & GAS NL
PHOENIX RESOURCES PLC
R 2 R1 BP DEVELOPMENTS AUSTRALIA PTY LTD
JAPAN AUSTRALIA LNG (MIMI BROWSE) PTY LTD
PETROCHINA INTERNATIONAL INVESTMENT
(AUSTRALIA) PTY LTD
SHELL DEVELOPMENT (AUSTRALIA) PROPRIETARY LIMITED
WOODSIDE BROWSE PTY. LTD.
R 3 R1 OIL BASINS LIMITED
R 4 CHEVRON (TAPL) PTY LTD
CHEVRON AUSTRALIA PTY LTD
MOBIL AUSTRALIA RESOURCES COMPANY PTY LIMITED
SANTOS OFFSHORE PTY LTD
R 5 APACHE OIL AUSTRALIA PTY LTD
OMV AUSTRALIA PTY LTD
PETROLEUM AND GEOTHERMAL ENERGY RESOURCES ACT 1967Special Prospecting Authority
Title Registered Holder(s)
SPA 17 AO ADMIRAL OIL NL
TABLE 5. LIST OF PETROLEUM AND GEOTHERMAL TITLES AND HOLDERS IN WESTERN AUSTRALIA – ONSHORE AND STATE WATERS AS AT 4 AUGUST 2014

PWA SEPTEMBER 2014 47
PETROLEUM PIPELINE ACT 1969Pipeline Licence
Title Registered Holder(s)
PL 1 R1 APT PARMELIA PTY LTD
PL 2 R1 APT PARMELIA PTY LTD
PL 3 R1 APT PARMELIA PTY LTD
PL 5 R1 APT PARMELIA PTY LTD
PL 6 R3 AWE PERTH PTY LTD
PL 7 R1 BURU ENERGY LIMITED
PL 8 R1 MITSUI IRON ORE DEVELOPMENT PTY LTD
NIPPON STEEL & SUMIKIN RESOURCES AUSTRALIA PTY. LTD.
NIPPON STEEL & SUMITOMO METAL AUSTRALIA PTY LTD
NORTH MINING LIMITED
ROBE RIVER MINING CO PTY LTD*
PL 12 R1 APACHE NORTHWEST PTY LTD*
HARRIET (ONYX) PTY LTD
KUFPEC AUSTRALIA PTY LTD
PL 14 R1 APACHE OIL AUSTRALIA PTY LTD*
HYDRA ENERGY (WA) PTY LTD
SANTOS (BOL) PTY LTD
TAP (SHELFAL) PTY LTD
PL 15 R1 CHEVRON (TAPL) PTY LTD
CHEVRON AUSTRALIA PTY LTD*
MOBIL AUSTRALIA RESOURCES COMPANY PTY LIMITED
SANTOS OFFSHORE PTY LTD
PL 16 DBP DEVELOPMENT GROUP NOMINEES PTY LIMITED
PL 17 APACHE NORTHWEST PTY LTD*
HARRIET (ONYX) PTY LTD
KUFPEC AUSTRALIA PTY LTD
PL 18 AWE (BEHARRA SPRINGS) PTY LTD
ORIGIN ENERGY DEVELOPMENTS PTY LIMITED*
PL 19 DBP DEVELOPMENT GROUP NOMINEES PTY LIMITED
PL 20 DBP DEVELOPMENT GROUP NOMINEES PTY LIMITED
PL 21 CHEVRON (TAPL) PTY LTD
CHEVRON AUSTRALIA PTY LTD*
MOBIL AUSTRALIA RESOURCES COMPANY PTY LIMITED
SANTOS OFFSHORE PTY LTD
PL 22 APA (PILBARA PIPELINE) PTY LTD
PL 23 APT PARMELIA PTY LTD
PL 24 ALINTA DEWAP PTY LTD
SOUTHERN CROSS PIPELINES (NPL) AUSTRALIA PTY LTD
SOUTHERN CROSS PIPELINES AUSTRALIA PTY LIMITED*
PL 25 SOUTHERN CROSS PIPELINES AUSTRALIA PTY LIMITED
PL 26 SOUTHERN CROSS PIPELINES AUSTRALIA PTY LIMITED
PL 27 SOUTHERN CROSS PIPELINES AUSTRALIA PTY LIMITED
PL 28 SOUTHERN CROSS PIPELINES (NPL) AUSTRALIA PTY LTD
PL 29 APACHE EAST SPAR PTY LTD
APACHE KERSAIL PTY LTD
APACHE OIL AUSTRALIA PTY LTD*
SANTOS (BOL) PTY LTD
PL 30 APACHE EAST SPAR PTY LTD
APACHE KERSAIL PTY LTD
APACHE OIL AUSTRALIA PTY LTD*
SANTOS (BOL) PTY LTD
PL 31 APA (PILBARA PIPELINE) PTY LTD
PL 32 APT PIPELINES (WA) PTY LIMITED
PL 33 APT PIPELINES (WA) PTY LIMITED
PL 34 NEWMONT YANDAL OPERATIONS PTY LTD
PL 35 NORTHERN STAR RESOURCES LTD
PL 36 AUSTRALIAN PIPELINE LIMITED
PL 37 NORILSK NICKEL CAWSE PTY LTD
PL 38 APA (PILBARA PIPELINE) PTY LTD
PL 39 ORIGIN ENERGY PIPELINES PTY LIMITED
PL 40 DBNGP (WA) NOMINEES PTY LIMITED
PL 41 DBNGP (WA) TRANSMISSION PTY LIMITED
PL 42 APACHE EAST SPAR PTY LTD
APACHE KERSAIL PTY LTD
APACHE NORTHWEST PTY LTD
APACHE OIL AUSTRALIA PTY LTD
HARRIET (ONYX) PTY LTD
KUFPEC AUSTRALIA PTY LTD
SANTOS (BOL) PTY LTD
PL 43 APT PIPELINES (WA) PTY LIMITED*
REGIONAL POWER CORPORATION
PL 44 APT PARMELIA PTY LTD
PL 45 APT PARMELIA PTY LTD
PL 46 APT PARMELIA PTY LTD
PL 47 DBNGP (WA) TRANSMISSION PTY LIMITED
PL 48 ENERGY GENERATION PTY LTD
PL 52 APT PARMELIA PTY LTD
PL 53 APT PARMELIA PTY LTD
PL 54 APT PIPELINES (WA) PTY LIMITED*
REGIONAL POWER CORPORATION
PL 55 GLOBAL ADVANCED METALS WODGINA PTY LTD
PL 56 APA (WA) ONE PTY LIMITED
PL 57 AUSTRALIAN GOLD REAGENTS PTY LTD
PL 58 BHP BILLITON PETROLEUM (NORTH WEST SHELF) PTY LTD
BP DEVELOPMENTS AUSTRALIA PTY LTD
CHEVRON AUSTRALIA PTY LTD
JAPAN AUSTRALIA LNG (MIMI) PTY LTD
SHELL DEVELOPMENT (AUSTRALIA) PROPRIETARY LIMITED
WOODSIDE ENERGY LTD*
PL 59 ESPERANCE PIPELINE CO. PTY LIMITED
PL 60 EII GAS TRANSMISSION SERVICES WA (OPERATIONS)
PTY LIMITED
PL 61 APT PARMELIA PTY LTD
PL 62 APACHE NORTHWEST PTY LTD*
HARRIET (ONYX) PTY LTD
KUFPEC AUSTRALIA PTY LTD
PL 63 EII GAS TRANSMISSION SERVICES WA (OPERATIONS)
PTY LIMITED
PL 64 AWE PERTH PTY LTD
ORIGIN ENERGY DEVELOPMENTS PTY LIMITED
PL 65 DALRYMPLE RESOURCES PTY LTD
NORILSK NICKEL WILDARA PTY LTD
PL 67 HAMERSLEY IRON PTY LIMITED
PL 68 EII GAS TRANSMISSION SERVICES WA (OPERATIONS)
PTY LIMITED
PL 69 DBNGP (WA) NOMINEES PTY LIMITED
PL 70 AWE (OFFSHORE PB) PTY LTD
AWE OIL (WESTERN AUSTRALIA) PTY LTD
ROC OIL (WA) PTY LIMITED
PL 72 EDL NGD (WA) PTY LTD
TABLE 5. LIST OF PETROLEUM AND GEOTHERMAL TITLES AND HOLDERS IN WESTERN AUSTRALIA – ONSHORE AND STATE WATERS AS AT 4 AUGUST 2014

48 PWA SEPTEMBER 2014
PL 73 REDBACK PIPELINES PTY LTD
PL 74 EDL LNG (WA) PTY LTD
PL 75 EIT NEERABUP POWER PTY LTD
ERM NEERABUP PTY LTD*
PL 76 SOUTHERN CROSS PIPELINES AUSTRALIA PTY LIMITED
PL 77 SINO IRON PTY LTD
PL 78 HAMERSLEY IRON PTY LIMITED
PL 80 ALCOA OF AUSTRALIA LIMITED
LATENT PETROLEUM PTY LTD
PL 81 APACHE NORTHWEST PTY LTD
PL 82 APA (PILBARA PIPELINE) PTY LTD
PL 83 ATCO GAS AUSTRALIA PTY LTD
PL 84 CHEVRON (TAPL) PTY LTD*
CHUBU ELECTRIC POWER GORGON PTY LTD
MOBIL AUSTRALIA RESOURCES COMPANY PTY LIMITED
OSAKA GAS GORGON PTY LTD
SHELL DEVELOPMENT (AUSTRALIA) PROPRIETARY LIMITED
TOKYO GAS GORGON PTY LTD
PL 85 CHEVRON (TAPL) PTY LTD*
CHUBU ELECTRIC POWER GORGON PTY LTD
MOBIL AUSTRALIA RESOURCES COMPANY PTY LIMITED
OSAKA GAS GORGON PTY LTD
SHELL DEVELOPMENT (AUSTRALIA) PROPRIETARY LIMITED
TOKYO GAS GORGON PTY LTD
PL 86 APACHE NORTHWEST PTY LTD
SANTOS OFFSHORE PTY LTD
PL 87 APACHE PVG PTY LTD
BHP BILLITON PETROLEUM (AUSTRALIA) PTY LTD
PL 88 APACHE PVG PTY LTD
BHP BILLITON PETROLEUM (AUSTRALIA) PTY LTD
PL 89 CROSSLANDS RESOURCES LTD
PL 90 APACHE PVG PTY LTD
BHP BILLITON PETROLEUM (AUSTRALIA) PTY LTD
PL 91 DBNGP (WA) NOMINEES PTY LIMITED
PL 92 CHEVRON (TAPL) PTY LTD*
CHUBU ELECTRIC POWER GORGON PTY LTD
MOBIL AUSTRALIA RESOURCES COMPANY PTY LIMITED
OSAKA GAS AUSTRALIA PTY LTD
SHELL DEVELOPMENT (AUSTRALIA) PROPRIETARY LIMITED
TOKYO GAS GORGON PTY LTD
PL 93 CHEVRON (TAPL) PTY LTD*
CHUBU ELECTRIC POWER GORGON PTY LTD
MOBIL AUSTRALIA RESOURCES COMPANY PTY LIMITED
OSAKA GAS GORGON PTY LTD
SHELL DEVELOPMENT (AUSTRALIA) PROPRIETARY LIMITED
TOKYO GAS GORGON PTY LTD
PL 94 DBNGP (WA) NOMINEES PTY LIMITED
PL 95 DBNGP (WA) NOMINEES PTY LIMITED
PL 96 EMPIRE OIL COMPANY (WA) LIMITED
ERM GAS PTY LTD
PL 97 MITSUI IRON ORE DEVELOPMENT PTY LTD
NIPPON STEEL & SUMIKIN RESOURCES AUSTRALIA PTY. LTD.
NIPPON STEEL & SUMITOMO METAL AUSTRALIA PTY LTD
RIO TINTO LIMITED
PL 98 ESPERANCE PIPELINE CO. PTY LIMITED
PL 99 APACHE JULIMAR PTY LTD
CHEVRON (TAPL) PTY LTD*
KUFPEC AUSTRALIA (JULIMAR) PTY LTD
KYUSHU ELECTRIC WHEATSTONE PTY LTD
SHELL DEVELOPMENT (AUSTRALIA) PROPRIETARY LIMITED
PL 100 DBNGP (WA) NOMINEES PTY LIMITED
PL 101 DBNGP (WA) NOMINEES PTY LIMITED
PL 102 SUB161 PTY. LTD.
PL 103 DBP DEVELOPMENT GROUP NOMINEES PTY LIMITED
PL 104 APA (PILBARA PIPELINE) PTY LTD
PL 105 DDG FORTESCUE RIVER PTY LTD
TEC PILBARA PTY LTD
PL 106 MITSUI IRON ORE DEVELOPMENT PTY LTD
NIPPON STEEL & SUMIKIN RESOURCES AUSTRALIA PTY. LTD.
NIPPON STEEL & SUMITOMO METAL AUSTRALIA PTY LTD
NORTH MINING LIMITED
ROBE RIVER MINING CO PTY LTD*
Please consult DMP’s online Petroleum and Geothermal Register for the most current information on Titles and Holdings.
TABLE 5. LIST OF PETROLEUM AND GEOTHERMAL TITLES AND HOLDERS IN WESTERN AUSTRALIA – ONSHORE AND STATE WATERS AS AT 4 AUGUST 2014
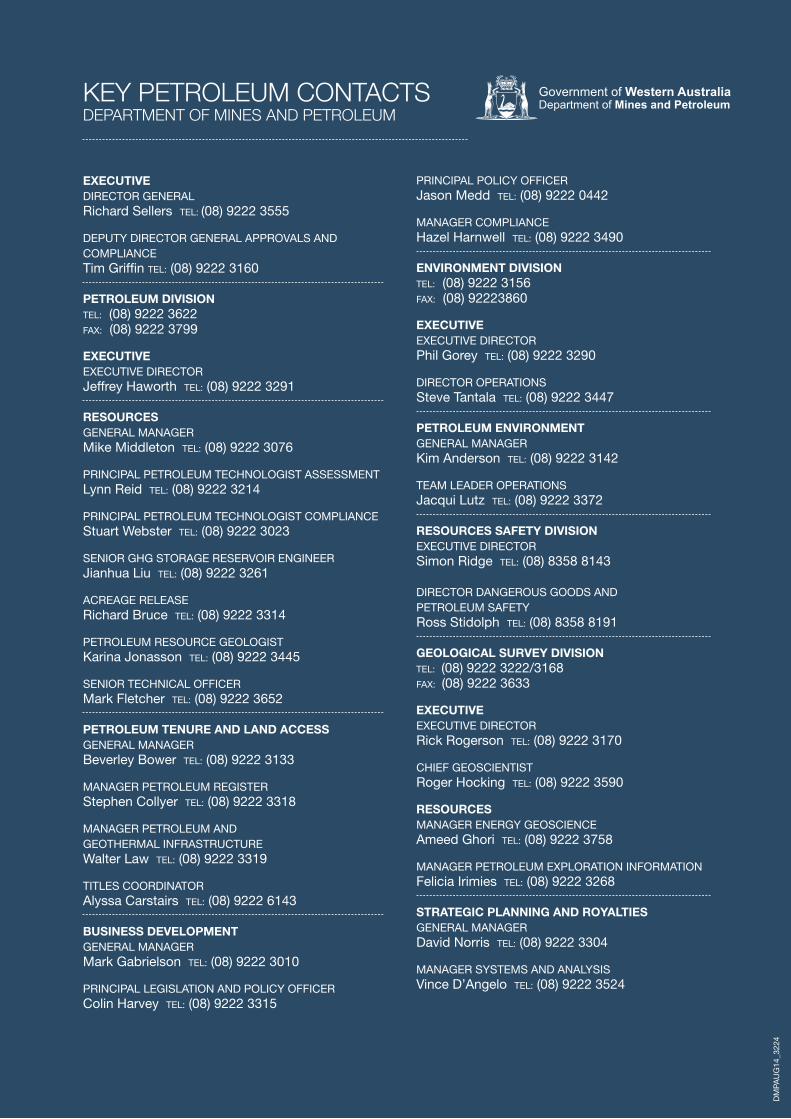
KEY PETROLEUM CONTACTS DEPARTMENT OF MINES AND PETROLEUM
DM
PAU
G14
_322
4
EXECUTIVEDIRECTOR GENERAL Richard Sellers TEL: (08) 9222 3555
DEPUTY DIRECTOR GENERAL APPROVALS AND COMPLIANCETim Griffin TEL: (08) 9222 3160
PETROLEUM DIVISIONTEL: (08) 9222 3622FAX: (08) 9222 3799
EXECUTIVE EXECUTIVE DIRECTORJeffrey Haworth TEL: (08) 9222 3291
RESOURCESGENERAL MANAGERMike Middleton TEL: (08) 9222 3076
PRINCIPAL PETROLEUM TECHNOLOGIST ASSESSMENTLynn Reid TEL: (08) 9222 3214
PRINCIPAL PETROLEUM TECHNOLOGIST COMPLIANCEStuart Webster TEL: (08) 9222 3023
SENIOR GHG STORAGE RESERVOIR ENGINEER Jianhua Liu TEL: (08) 9222 3261
ACREAGE RELEASE Richard Bruce TEL: (08) 9222 3314
PETROLEUM RESOURCE GEOLOGIST Karina Jonasson TEL: (08) 9222 3445
SENIOR TECHNICAL OFFICER Mark Fletcher TEL: (08) 9222 3652
PETROLEUM TENURE AND LAND ACCESSGENERAL MANAGER Beverley Bower TEL: (08) 9222 3133
MANAGER PETROLEUM REGISTERStephen Collyer TEL: (08) 9222 3318
MANAGER PETROLEUM AND GEOTHERMAL INFRASTRUCTURE Walter Law TEL: (08) 9222 3319
TITLES COORDINATORAlyssa Carstairs TEL: (08) 9222 6143
BUSINESS DEVELOPMENTGENERAL MANAGERMark Gabrielson TEL: (08) 9222 3010
PRINCIPAL LEGISLATION AND POLICY OFFICER Colin Harvey TEL: (08) 9222 3315
PRINCIPAL POLICY OFFICER Jason Medd TEL: (08) 9222 0442
MANAGER COMPLIANCEHazel Harnwell TEL: (08) 9222 3490
ENVIRONMENT DIVISIONTEL: (08) 9222 3156FAX: (08) 92223860
EXECUTIVEEXECUTIVE DIRECTORPhil Gorey TEL: (08) 9222 3290
DIRECTOR OPERATIONSSteve Tantala TEL: (08) 9222 3447
PETROLEUM ENVIRONMENT GENERAL MANAGER Kim Anderson TEL: (08) 9222 3142
TEAM LEADER OPERATIONSJacqui Lutz TEL: (08) 9222 3372
RESOURCES SAFETY DIVISION EXECUTIVE DIRECTORSimon Ridge TEL: (08) 8358 8143
DIRECTOR DANGEROUS GOODS AND PETROLEUM SAFETYRoss Stidolph TEL: (08) 8358 8191
GEOLOGICAL SURVEY DIVISIONTEL: (08) 9222 3222/3168FAX: (08) 9222 3633
EXECUTIVEEXECUTIVE DIRECTOR Rick Rogerson TEL: (08) 9222 3170
CHIEF GEOSCIENTIST Roger Hocking TEL: (08) 9222 3590
RESOURCESMANAGER ENERGY GEOSCIENCEAmeed Ghori TEL: (08) 9222 3758
MANAGER PETROLEUM EXPLORATION INFORMATION Felicia Irimies TEL: (08) 9222 3268
STRATEGIC PLANNING AND ROYALTIESGENERAL MANAGER David Norris TEL: (08) 9222 3304
MANAGER SYSTEMS AND ANALYSISVince D’Angelo TEL: (08) 9222 3524