Embed Size (px)
Citation preview

2018-2022
ECONOMICOUTLOOK
WEST VIRGINIA

SPECIAL THANKS TO THE 2017 ECONOMIC OUTLOOK CONFERENCE SPONSORS:
CHAMBERS ENDOWED PROGRAM FOR
ELECTRONIC BUSINESS
WEST VIRGINIADEPARTMENT OF
REVENUE

West Virginia Economic Outlook 2018-2022 is published by: Bureau of Business & Economic Research
West Virginia University College of Business and Economics Javier Reyes, Ph.D., Milan Puskar Dean
P.O. Box 6527, Morgantown, WV 26506-6527
(304) 293-7831 | [email protected]
WRITTEN BY THE BUREAU OF BUSINESS AND ECONOMIC RESEARCH
John Deskins, Ph.D. | Director and Associate Professor of Economics
Eric Bowen, Ph.D. | Research Assistant Professor
Christiadi, Ph.D. | Research Associate, Demographer
Brian Lego | Research Assistant Professor
Melissa McKenzie | Research Assistant
Justin Parker | Graduate Research Assistant
Ananya Sarker | Graduate Research Assistant
Fani Agelaraki | Research Assistant
EXPERT OPINION PROVIDED BY
Mark Muchow | Deputy Cabinet Secretary, West Virginia Department of Revenue
Publication Design by Erica Lindsay | Cover Photo by Alex Wilson | Copyright ©2017 by WVU Research Corporation
2018-2022
WEST VIRGINIAECONOMICOUTLOOK

ii | WEST ViRGiNiA ECONOMiC OUTLOOK 2018-2022
Greetings!
i am happy to present the 2018-2022 West Virginia Economic Outlook to you. My intent is for this document to serve as a thorough and rigorous reference for where our state’s economy is today and where it is likely heading in coming years. And my sincere hope is that you will find this document useful as you lead your business, government agency, or community organization through the economic opportunities and challenges we face in West Virginia.
Since the 1940s, our mission here at the Bureau of Business & Economic Research, a unit within WVU’s College of Business & Economics, has been to serve the people of West Virginia by providing you, the state’s business, policymaking, and advocacy communities, with reliable and timely data as well as rigorous applied economic analysis. We hope that the data and analysis we provide ultimately enables you to design and implement better business practices and public policies.
Our research is sponsored by public- and private-sector clients throughout West Virginia and nationally. For instance, our recent public-sector clients include the West Virginia Legislature, the West Virginia Department of Revenue, the West Virginia Higher Education Policy Commission, the American Cancer Society, and the Appalachian Regional Commission. We have also been engaged by several private-sector companies in the state.
Please feel free to call on me personally anytime concerning your economic research needs. We are always interested in pursuing new opportunities to provide research and data in areas such as public policy analysis, health economics, energy economics, economic development, economic impact analysis, economic forecasting, tourism and leisure economics, and education policy, among others.
To learn more about our research, to find contact information for myself or any of our staff, or to find an electronic version of this document, please visit our website at business.wvu.edu/bber.
Sincerely,
John DeskinsAssistant Dean for Outreach and Engagement Director, Bureau of Business & Economic ResearchAssociate Professor of EconomicsWVU College of Business and Economics

| iii
Table of Contents
EXECUTIVE SUMMARY 1
CHAPTER 1: THE UNITED STATES ECONOMY 3
Overview 3
Recent Trends and Short-Term Economic Outlook 3
Challenges Facing the US Economy 7
CHAPTER 2: THE WEST VIRGINIA ECONOMY 12
Recent Economic Performance 12
Recent Demographic Trends 17
West Virginia Outlook 18
West Virginia’s Exports 22
CHAPTER 3: WEST VIRGINIA’S ECONOMY, INDUSTRY FOCUS 25
Energy 25
Manufacturing 30
Construction 32
Health and Health Care in West Virginia 35
CHAPTER 4: GOVERNMENT IN WEST VIRGINIA 38
West Virginia Government 38
Public Assistance in West Virginia 39
Guest insight: West Virginia Fiscal Forecast 42
CHAPTER 5: WEST VIRGINIA’S COUNTIES 44
CHAPTER 6: SMALL BUSINESS ACTIVITY IN WEST VIRGINIA 46
Small Business Births and Deaths 46
Small Business Employment 47
Small Business income 48
APPENDIX – WORKS CITED 50
Table of Contents and List of Figures

iV | WEST ViRGiNiA ECONOMiC OUTLOOK 2018-2022
List of Figures EXECUTIVE SUMMARY
Figure ES.1: WV and US Forecast Summary 1
CHAPTER 1: THE UNITED STATES ECONOMY
Figure 1.1: US Real GDP Growth 3
Figure 1.2: Growth in Output per Hour in Nonfarm Business 4
Figure 1.3: Growth in US Government Spending 4
Figure 1.4: US Total Employment 5
Figure 1.5: US Unemployment Statistics (1) 5
Figure 1.6: US Unemployment Statistics (2) 6
Figure 1.7: US Labor Force Participation Rate 6
Figure 1.8: US Housing Starts 7
Figure 1.9: Consumer Confidence 7
Figure 1.10: Real GDP Growth - Select Economies 7
Figure 1.11: World GDP by Country 8
Figure 1.12: US Federal Debt Held by the Public as a Share of GDP 8
Figure 1.13: Federal Deficit Share of GDP 8
Figure 1.14: US Transfer Payments as a Share of Personal income 9
Figure 1.15: Components of US Federal Government Spending 9
Figure 1.16: US Personal Savings as Share of Disposable income 9
Figure 1.17: US Inflation Rates 10
Figure 1.18: Select US interest Rates 10
Figure 1.19: Share of Aggregate income by Quintile 10
Figure 1.20: income Gap 11
CHAPTER 2: THE WEST VIRGINIA ECONOMY
Figure 2.1: Total Employment 12
Figure 2.2: Economic Growth in WV and Adjacent States, 2012Q1-2017Q2 12
Figure 2.3: WV Employment Distribution by Sector (2016) 13
Figure 2.4: Unemployment Rate 15
Figure 2.5: Labor Force Participation Rate (2015) 15
Figure 2.6: Per Capita Personal income Growth 15
Figure 2.7: Per Capita Personal income (2016) 16
Figure 2.8: Average Annual Salary by Sector (2016) 16
Figure 2.9: Real GDP Growth (1) 16
Figure 2.10: Real GDP Growth (2) 17
Figure 2.11: Total Population 17
Figure 2.12: Summary Population Profiles 17
Figure 2.13: All-Cause Mortality Rates 18
Figure 2.14: Employment Growth Forecast 18
Figure 2.15: WV Employment Growth Forecast by Sector 18
Figure 2.16: Unemployment Rate Forecast 20
Figure 2.17: Forecast Growth by Major Source of Real Personal income, 2017-2022 21
Figure 2.18: Share of Personal income by Component 21
Figure 2.19: WV Per Capita Personal income Relative to US Average 21
Figure 2.20: GDP Forecast by Sector 22
Figure 2.21: WV Population Growth by Age Group 22
Figure 2.22: WV Exports 22
Figure 2.23: WV Top Five Exporting industries 23
Figure 2.24: Top Ten Export Commodities, 2016 23
Figure 2.25: Top Destination Countries for West Virginia Exports 24
CHAPTER 3: WEST VIRGINIA’S ECONOMY, INDUSTRY FOCUS
Figure 3.1: WV Energy Sector Employment 25
Figure 3.2: WV Coal and Natural Gas Output 25
Figure 3.3: WV Regional Coal Production 26
Figure 3.4: Average Coal Mining Productivity 26
Figure 3.5: Energy Commodity Exports from WV 27
Figure 3.6: Natural Gas Production in Marcellus/Utica States 27
Figure 3.7: Natural Gas Production by County 27
Figure 3.8: Marcellus and Henry Hub Natural Gas Spot Price Spread 28
Figure 3.9: Share of US Electric Power Generation by Fuel Type 28
Figure 3.10: Coal and Natural Gas Fuel Price Ratio Paid by Utilities 28
Figure 3.11: Share of Total Manufacturing Employment (2016) 30
Figure 3.12: WV Manufacturing Employment by industry 30

| V
Figure 3.13: WV Manufacturing industry Employment Growth Forecast 31
Figure 3.14: WV Manufacturing Sector Productivity 32
Figure 3.15: WV Construction Employment by Type 33
Figure 3.16: WV Single-Family Housing Starts 33
Figure 3.17: Single-Family House Price Growth by Metro Area 34
Figure 3.18: WV Single-Family House Prices 34
Figure 3.19: Healthcare Sector Employment 35
Figure 3.20: WV Healthcare Sector Employment and Wages (2016) 36
Figure 3.21: Health Behavior Statistics, 2016 36
Figure 3.22: Health Statistics Measures, 2016 36
CHAPTER 4: GOVERNMENT IN WEST VIRGINIA
Figure 4.1: State and Local Government Expenditure per Capita, 2014 38
Figure 4.2: State and Local Government Expenditure as Share of Personal income, 2014 38
Figure 4.3: WV State and Local Government Expenditure Composition, 2014 38
Figure 4.4: Real State and Local Government Expenditures per Capita 39
Figure 4.5: State and Local Government Own Source Revenue per Capita, 2014 39
Figure 4.6: WV State and Local Government Revenue Composition, 2014 39
Figure 4.7: State Government Spending as a Share of Total State and Local Expenditures, 2015 40
Figure 4.8: Transfer Payments as a Share of Personal income 40
Figure 4.9: Distribution of Transfer of Payments by Program, WV 40
Figure 4.10: Distribution of Transfer of Payments by Program, US 40
Figure 4.11: Participation in Transfer Programs in WV, 2015 41
Figure 4.12: Participation in Transfer Programs, 2015 41
Figure 4.13: Average Weekly Duration Collecting Unemployment insurance 41
Figure 4.14: Average Weekly Unemployment Insurance Benefits 41
CHAPTER 5: WEST VIRGINIA’S COUNTIES
Figure 5.1: Annual Population Growth, 2006-2016 44
Figure 5.2: Forecast Annual Population Growth, 2017-2022 44
Figure 5.3: Annual Employment Growth, 2006-2016 44
Figure 5.4: Forecast Annual Employment Growth, 2017-2022 44
Figure 5.5: Annual Real Personal income Growth, 2006-2016 45
Figure 5.6: Forecast Real Personal income Growth, 2017-2022 45
Figure 5.7: WV County Real per Capita income 45
CHAPTER 6: SMALL BUSINESS ACTIVITY IN WEST VIRGINIA
Figure 6.1: WV Small Business Births and Deaths 46
Figure 6.2: Small Business Net Growth 46
Figure 6.3: Small Businesses per 100,000 Residents, 2014 46
Figure 6.4: Growth in Small Business Counts, 2003-2014 47
Figure 6.5: Employment in WV by Employer Type, 2014 47
Figure 6.6: Small Business Employment Share, 2014 47
Figure 6.7: WV Employment by Small Business Size, 2014 48
Figure 6.8: Employment Change Between 2003 and 2014 by Business Size 48
Figure 6.9: Wage and Salaries in WV by Employer Type, 2014 48
Figure 6.10: Share of Total Wages and Salaries by Small Businesses, 2014 49
Figure 6.11: Patents issued per 100,000 Residents, 2012-2015 49
Figure 6.12: Loans Under $100,000 issued for Small Business 49

Vi | WEST ViRGiNiA ECONOMiC OUTLOOK 2018-2022

| 1
Executive SummaryAfter several years of economic hardship, West Vir-ginia’s economy hit bottom in 2016 and has grown over the past few quarters. The state’s employment declines were primarily driven by losses in both major segments of the energy sector, but the turnaround has also been driven by expanding coal production and renewed growth in natural gas production. However, the pace of employment growth that is expected in coming years will mean that West Virginia will not likely return to its 2012 level of employment for four more years.
in this report we present a detailed discussion of the current state of the West Virginia economy along with our forecast for the likely path of economic activity over the next five years. Overall, this report provides a broad and detailed foundation to aid in understanding the long-run economic challenges and opportunities facing West Virginia.
Highlights related to West Virginia’s recent economic performance are as follows:
� The state experienced a large loss in jobs between early-2012 and late-2016, with a cumu-lative decline of roughly 26,000 jobs over that period. On a positive note, total employment has increased during the first two quarters of 2017, hint-ing at broader signs of stability and improvement for most of the state’s economic regions.
� A significant portion of economic turmoil experi-enced in West Virginia over the past few years can be traced to both major segments of the state’s energy sector. Job gains have been recorded in a few service-providing sectors, such as education and health services, but many other industries in the state struggled in 2015 and 2016.
� After falling within a range of 6.5 and 7.0 percent between late-2013 and late-2015, the state’s unemployment rate has fallen sharply in recent quarters. West Virginia’s jobless rate fell to its low-est level in nearly a decade during the second quar-ter of 2017, reaching just over 4.6 percent.
� Only 53 percent of West Virginia’s adult popula-tion is either working or looking for work. This is the lowest rate of labor force participation among all 50 states. This problem represents a significant hurdle for long-run economic prosperity.
� Per capita personal income in West Virginia grew at rate of 1.5 percent in 2016, climbing to approxi-mately $37,400. The state’s per capita income
growth has lagged the national average in recent years, leaving the per capita income level in West Virginia at roughly 75 percent of the national figure.
� West Virginia’s real gross domestic product declined in 2015 and 2016, but has increased at a rapid pace over the past few quarters. Changes in the state’s total economic output have been vola-tile since 2012, reflecting the turbulence within the state’s coal and natural gas industries.
� Export activity from West Virginia has also experi-enced significant volatility during the past decade. Promoting the state’s export potential is of vital importance to economic development in West Virginia in the long run.
The energy sector is an important driver of economic activity in the state:
� Coal output fell by nearly one-half between 2008 and 2016, with most of those losses occurring in the state’s southern coalfields.
� After increasing rapidly in the first half of the decade, natural gas output increased by just 4 percent during 2016.
� Total GDP from the state’s natural gas industry is expected to equal that of coal within the next few years. GDP from natural gas was equivalent to roughly one-tenth of coal’s real output less than a decade ago.
Executive Summary
FIGURE ES.1: West Virginia and US Forecast Summary
West Virginia United States
2006-2016 2017-2022 2006-2016 2017-2022
Population (average annual growth, %) 0.0 0.0 0.8 0.8
Employment (average annual growth, %) -0.2 0.7 0.6 0.9
Real GDP (average annual growth, %) 1.3 1.0 1.3 2.3
Unemployment Rate(annual average at end of time period, %)
6.0 4.5 4.9 4.3
Real Per Capita Personal income (average annual growth, %)
1.1 1.8 1.0 2.1
Sources: US Census Bureau; US Bureau of Labor Statistics; US Bureau of Economic Analysis; WVU BBER Econometric Model; iHS Markit

2 | WEST ViRGiNiA ECONOMiC OUTLOOK 2018-2022
Highlights related to West Virginia’s economic outlook are as follows:
� Employment in West Virginia is estimated to increase nearly 0.7 percent per year on aver-age through 2022, trailing the 0.9 percent average annual growth expected for the nation as a whole. Total employment is not expected to return to its 2012 peak until 2021.
� Our baseline forecast calls for the recent upturn in coal production and jobs to come to an end as the industry enters a period of relative stability; however, the industry’s outlook still remains sub-ject to considerable downside risk due to linger-ing uncertainty related to coal use by domestic power plants and future global demand for ther-mal and met coal.
� Rising domestic demand, increased LNG exports and enhancements in regional pipeline networks bode well for West Virginia’s natural gas industry during the outlook period. Overall, production and employment are expected to gain momentum over the next few years. Longer term, the emergence of downstream processing facilities in Pennsylvania, and perhaps Ohio, raise prospects for continued growth.
� Construction is expected to rebound from its malaise of the past few years, thanks in large part to residential and commercial building activity in the state’s economic growth centers. A range of energy- and transportation-related infrastructure projects is also expected to lift the sector’s prospects.
� Manufacturing payrolls are expected to register gains of 0.9 percent annually over the next five years, though most of this growth will likely come from the opening of two major facilities in the East-ern Panhandle.
� Service-providing sectors will grow more slowly as a whole going forward, although professional and business services should see stronger gains related to the increased hiring of contract labor by the coal and natural gas industries.
� The state’s unemployment rate is expected to hover in the mid-4 percent range for the next sev-eral quarters, but slowly begin to decline through the early 2020s.
� However, West Virginia’s unemployment rate pro-vides an incomplete and potentially misleading indication of labor market condition due to the state’s underlying demographic characteristics as well as the measure’s susceptibility to large
revisions. Changes in the labor force participation rate will provide a better picture of labor market con-ditions going forward.
� Per capita personal income is expected to grow at an annual average rate of 1.8 percent over the next five years, below the national rate of 2.3 percent. Growth will be driven largely by non-wage income, such as Social Security benefits.
A key concern for The Mountain State moving forward relates to its underlying demographics. Consider the following:
� West Virginia’s population has declined by more than 25,000 people since 2012, and although we expect the state’s population to stabilize, more losses are likely over the longer term due to large share of elderly residents and the effects of poor health outcomes and behaviors for many seg-ments of the overall population.
� A positive shock to encourage in-migration is essential to lessen the severity of natural popula-tion decline.
� Economic development strategies should focus on ways to improve health and education out-comes in the state to make West Virginia’s work-force more attractive to potential businesses.
Economic performance is expected to remain extremely variable across West Virginia’s counties. Consider the following:
� While the state overall is expected to lose popula-tion in coming years, a limited number of counties will add residents during the outlook period. Population gains will tend to be most heavily con-centrated in North-Central West Virginia and the Eastern Panhandle.
� Many of the counties in southern West Virginia that were plagued with deep losses over the past several years will enjoy some measurable job growth during the outlook period. At the same time, most of these areas will likely struggle to see the level of economic activity return to what was observed in years as recent as 2014 or 2015.
� Just as with population, most of West Virginia’s job and output growth will tend to come from coun-ties located in the northern half of the state.
� Policymakers should be keenly aware of signifi-cant economic differences across West Virginia and ensure that economic development strate-gies consider each region’s specific strengths and weaknesses.

| 3The United States Economy
OVERVIEWThe United States economy remains in a relatively steady period of economic growth seven years after the end of the Great Recession; however, it appears that the economy’s long-run rate of growth has fallen by around one-third in recent years.1 As such, the recent economic recovery ultimately proved to be the most lethargic, by most measures, of any US eco-nomic recovery in the post-World War ii era. Overall, we expect this modest and steady growth to continue for the coming years. in this chapter we: a) explore recent trends in the United States economy; b) provide a forecast of how the US economy is likely to evolve over the near-term; and c) explore several major chal-lenges that have the potential to threaten US economic stability and could alter the outlook.
RECENT TRENDS AND SHORT-TERM ECONOMIC OUTLOOKGDP As illustrated in Figure 1.1, economic output, as measured by real Gross Domestic Product (GDP), has grown at an average annual rate of around 2.2 percent since the Great Recession ended in mid-2009, notice-ably weaker than the 2.5 percent per year averaged since 1987. Generally speaking, the US economy has undergone a long-run structural change such that eco-nomic growth since the Great Recession is now only slightly more than two thirds of what was observed if one focuses on the 30 years prior to the Great Reces-sion’s onset, and even less if one broadens the time horizon to the entire post-WWii era.
US economic growth has been slow enough such that real GDP did not return to its long-run potential level until 2016, around seven years after the Great Reces-sion ended and much longer than any recovery has taken in the post-World War ii era. Many questions remain around the causes of this long-run slowdown in economic growth, some of which we address below. After a first half of 2017 that has been consistent with recent averages, real GDP growth is expected to accelerate moderately through 2018. Overall, our forecast calls for growth to remain mostly below the 30-year average during the five-year forecast period.
CONSUMPTION Spending on consumer goods and services, which is by far the largest component of GDP, has shown a great deal of relative stability over recent years, as is typically the case. While the rate of growth in consumer spending did fall short of the rate that prevailed before the recession for several years dur-ing the recovery, gains are now more consistent with pre-recession norms. Several factors that have sup-pressed consumer spending in recent years—such as
FIGURE 1.1: United States Real GDP Growth
-5%
-4%
-3%
-2%
-1%
0%
1%
2%
3%
4%
5%% Change, Year Over Year
30-Year Average
Sources: : US Bureau of Economic Analysis; iHS Markit. Note: Quarterly GDP data used. Figure is adjusted for inflation, presented here in 2009 $.
CHAPTER 1:
The United States Economy
reduction in household debt levels (which leaves less room for consumer goods), tight bank lending stan-dards, weak house price appreciation, and low con-sumer confidence—have largely or completely abated. This moderate improvement in consumer spending has buoyed the economy to some degree, it will not likely enhance the overall pace of economic expan-sion in the foreseeable future. in short, given the high degree of relative stability in consumption, efforts to promote economic growth should generally focus on other components of spending, such as investment. INVESTMENT Spending on investment goods—capi-tal goods that will enhance future productivity, such as industrial facilities and equipment—has been far more volatile over the recent business cycle. Total investment spending collapsed at an annualized rate of more than 20 percent at the nadir of the recent recession before staging a strong recovery over much of 2010 through 2012. Since that point, however, growth in investment spending has been more modest and was especially weak in 2016, due in large part to sharp capital spend-ing reductions by energy companies in the face of low crude oil and natural gas prices. investment activity is expected to return to a healthier growth rate of nearly 4 percent annually through 2022 and is looked to as a modest potential source of future economic growth. However, consistent with its volatile nature, capital investment activity is uncertain, and there are potential obstacles that could jeopardize businesses’ willing-ness to pursue their investment plans as expected. We discuss several of these major concerns below.
1. This section represents the authors’ review, analysis, interpretation, and summary of information presented in the international Monetary Fund’s World Economic Outlook (2017) and iHS Markit’ US Economic Outlook (2017).

4 | WEST ViRGiNiA ECONOMiC OUTLOOK 2018-2022
NET EXPORTS US net exports (exports minus imports), while a relatively small share of total output, have been nonetheless an important contributor to the volatility in GDP over recent years and are another potentially important source of future economic growth. Net exports have shown extreme volatility over the past several years. The value of total US net exports collapsed at an annualized rate of nearly 30 percent during the pit of the recent recession, improved to around 15 percent growth in 2010, fell again from 2011 through 2013, and have grown since 2014, reaching a rate of more than 20 percent in 2015 before return-ing to around 4 percent in 2016. Net export growth is expected to come in at around 8 percent in 2017, improve over the following two years, and then slow again during the latter part of the forecast period.
FIGURE 1.2: Growth in Output per Hour in Nonfarm Business
0.0
0.5
1.0
1.5
2.0
2.5
3.0
3.5
4.0
4.5% Change, 3 year average annualized growth
Sources: US Bureau of Labor Statistics; iHS Markit.
FIGURE 1.3: Growth in United States Government Spending
-6
-4
-2
0
2
4
6
8
Federal Spending
State & Local Spending
% Change, Year Over Year
Source: US Bureau of Economic Analysis; iHS Markit. Note: Figure is adjusted for inflation, presented here in 2009 $.
Much of the recent volatility in exports has been driven by weak economic growth in important US export markets, especially in the European Union, where economic output has not improved by any significant measure over its 2007 level and in China, where growth has slowed considerably. Movements in global energy markets has also been an important contributor in sev-eral ways. Unfortunately, in the same vein as invest-ment activity, the health of US net exports is uncertain given the myriad sources of potential economic pres-sure across the world, such as the ongoing economic struggles in Europe, a continuing economic slowdown in China, sluggish economic growth in Japan, and political unrest in many other parts of the world.
PRODUCTIVITY Worker productivity, as measured by output per hour worked, is the fundamental key driver of economic prosperity over the long run. For instance, very high levels of productivity fundamentally explain why nations such as the US and UK enjoy high standards of living while very low levels of productivity explain why nations such as Haiti and Zimbabwe suf-fer extremely low standards of living. in Figure 1.2 we illustrate the intermediate-run growth in productivity in the US over the last two decades or so. As illustrated, productivity growth has been has been extremely low since 2013 and this weak rate of productivity growth is expected to continue through around 2018. The ques-tion of what drives this low productivity figure is hotly debated among economists and policymakers today.
GOVERNMENT SPENDING The recent evolution of government spending in the US is reported in Figure 1.3. Total federal, state, and local government spend-ing, which amounts to approximately one-third of US GDP, increased substantially during the recession. This rise was driven by a concerted economic stimulus effort that actively increased government spending and as safety net expenditures rose naturally as the economy went into recession. After the economic recovery began, inflation-adjusted federal government spending decelerated rapidly and started to decline outright, reaching an annual drop of nearly 6 percent by 2013. Real federal government spending did rise in 2016, but the forecast calls for slight year-to-year declines throughout the outlook period.
This removal of government spending held down broader economic growth to some degree, since much of government spending is itself part of GDP (GDP includes government spending on goods and services such as infrastructure spending, education, police protection, etc.; GDP excludes government spending on transfer programs, such as Social Security). Much of the decline in federal spending has come as federal government transfer payments waned as an improving economy reduced unemployment rolls, but also due to

| 5
the effects of federal budget sequestration policies. By comparison, real state and local government spending began rising by 2014 and will likely continue to grow over the forecast period. However, state and local gov-ernment expenditures should more slowly than overall GDP, indicating spending by state and local govern-ments will account for a proportionately smaller part of the nation’s economy during the outlook period.
EMPLOYMENT Job growth was sluggish through much of the economic recovery. it is not uncommon for employment to recover more slowly than output, as businesses typically increase output through eliminat-ing excess capacity, through capital investment, and through increasing worker hours, before adding new workers. However, employment has become increas-ingly slow to recover in each of the last several busi-ness cycles: employment growth in each recession of the past two decades—in the early-1990s, the early-2000s, and through the recent cycle—has progressively slowed compared to earlier post-WWii recessions.
As depicted in Figure 1.4, total US employment from the household survey fell substantially during the recent recession, with losses in excess of 7 million jobs. Employment growth since early-2010 has been slow such that, the US did not achieve its pre-reces-sion peak until late-2014.2 Furthermore, the degree to which the US economy deviated from what is considered a full and sustainable level of employment (termed “full employment” in Figure 1.4) was the most severe of any recession since the Great Depression. in fact, the US economy only reached full employment in 2016, around seven years after job growth began. On a positive note, employment growth for the nation as a whole has been consistently solid since the begin-ning of 2014, with the addition of around 215 thousand jobs in a typical month. We expect employment growth to continue for the coming years, though the average pace will be slower reflecting the economy’s current position in the business cycle.
UNEMPLOYMENT Turning to the unemploy-ment situation, as noted in Figure 1.5, the national unemployment rate peaked at around 10 percent in late-2009. This was the second-highest jobless rate experienced during the post-WWii era, exceeded only by the 1982/1983 recession (a peak of 10.8 percent in late-1982). The unemployment rate has improved substantially over the past five years and now stands even slightly below its long-run level of around four-and-one-half to five percent. The figure is forecast to remain at this long-run level over the next five years.
it is worth noting that the share of all unemployed persons who have endured long unemployment spells (typically defined as 27 weeks or more) rose substan-tially during the recent recession, and remains at a level that is still above the historic average. As illustrated, the share of all unemployed persons who have experi-enced long unemployment spells rose from 17 percent of unemployed persons in 2007 to nearly 45 percent by 2010, and remains at around 23 percent. However, as illustrated, the figure has improved dramatically in recent years.
There are two common criticisms associated with the conventional unemployment rate reported in Figure 1.5. The first is that the figure does not account for workers who can only find part-time work but who would prefer a full-time opportunity, often referred to
2. The statement that employment in the US economy is approximately equal to its 2007 high does not account for population growth over the period; doing so would darken the employment growth figure.
The United States Economy
FIGURE 1.4: United States Total Employment
125
130
135
140
145
150
155
160
165
Total Employment
Employment (Millions)
Full Employment
Sources: US Bureau of Labor Statistics; iHS Markit
FIGURE 1.5: United States Unemployment Statistics
10
15
20
25
30
35
40
45
50
0
2
4
6
8
10
12 Unemployment Rate, % Unemployed 27 Weeks or More, % of Total Unemployment
Unemployment Rate
Unemployed 27 Weeks or More
Source: US Bureau of Labor Statistics; iHS Markit Note: Quarterly data used.

6 | WEST ViRGiNiA ECONOMiC OUTLOOK 2018-2022
FIGURE 1.6: United States Unemployment Statistics
0
2
4
6
8
10
12
14
16
18Unemployment Rate, %
Conventional Unemployment Rate – U-3
Including Discouraged Workers – U-5
Including Discouraged Workers and Part Time Workers for Economic Reasons – U-6
Sources: US Bureau of Labor Statistics; iHS Markit Note: Quarterly data used.
FIGURE 1.7: United States Labor Force Participation Rate
58
60
62
64
66
68Civilian Labor Force Participation Rate, %
Sources: US Bureau of Labor Statistics
as “under-employed.” The second relates to discour-aged workers. Here, the idea is that if one is looking for work for an extended period of time and is ulti-mately unsuccessful at landing a job, the individual may become discouraged and quit looking for work altogether. When this happens, the person is no longer counted as “unemployed” or part of the labor force at all by the conventional measure, since the conventional measure only considers people we are actively looking for work. For both of these reasons, the conventional unemployment rate provides an underestimate of the severity of the unemployment situation.
in Figure 1.6 we report the conventional unemploy-ment rate, as reported in the previous figure (referred to as U-3), along with a measure that also includes discouraged workers (U-5), as well as a measure that
includes workers who are only able to find part-time work for economic reasons (U-6). it is important to note that these criticisms are legitimate and that what many would consider to be “true” unemployment is higher than the conventional statistic indicates. How-ever, it is also important to note that the movement of the three figures over time is quite consistent and despite their level differences, the unemployment situ-ation has clearly improved since 2010 regardless of the chosen metric.
LABOR FORCE PARTICIPATION The labor force participation rate is a complementary measure to the unemployment rate. The labor force participation rate captures the share of the adult population that would like to work—termed “in the labor force”—while the unemployment rate captures the share of the labor force that is unable to find employment at any given moment in time. Ultimately, the labor force participation rate is a more fundamental descriptor of an economy’s long-run employment situation.
in Figure 1.7 we report labor force participation for the US since 1950. As illustrated, the figure peaked in 2002 at 67 percent and has fallen substantially since 2008, now standing at just under 63 percent. The broad evolution of this figure is largely driven by demographic processes, namely the emergence and aging of “Baby Boomer” population. Notice that the figure began to rise substantially around 1965, when the first of the “Baby Boomers” turned 20 years old. This measure continued to rise through around 1998, when the first of this group turned 55 years old, but then began to decline substantially around 2008—the point when the first “Baby Boomers” approached the conventional retirement age.
In addition to the baby boomer effect, the post-WWII structural change in labor force participation rates was driven in large part by large increases in the female labor force that occurred through the mid-1990s. Overall, the recent declines in labor force participation could present a significant impediment to the nation’s long-run economic growth potential as fewer workers will be called upon to support more retirees vis-à-vis private pension plans as well as Social Security and other federal programs. Furthermore, many economic challenges below might interact with a lower rate of labor force participation in the long run, leading to a significantly different performance for the US economy over the long term.
HOUSING As is well known, the catalyst for the recent financial crisis and economic recession was the dra-matic decline that was suffered in the housing market from 2007 to 2009. Single-family housing starts have shown notable improvement over the past five years,

| 7
rising from 475 thousand in early-2012 to over 800 thousand by mid-2017. As illustrated in Figure 1.8, the forecast does show continued optimism in calling for continued growth over the next year or so before con-struction activity begins to stabilize by late-2018. Multi-family housing starts rebounded at a much stronger pace than the single-family side of the market, return-ing to pre-recession levels of new construction activity by early-2013. Aggressive multifamily construction in several large cities in the post-recession years has now left these markets with moderate levels of excess supply. As a result, the forecast calls for the overall pace of multifamily starts to increase only marginally during the outlook period.
CONSUMER CONFIDENCE Recessions typically have a catalyst in some exogenous shock (such as the bursting of a housing bubble or high oil prices), falling consumer sentiment is often the key driver of demand during recessions. Typically, the initial reces-sion catalyst reduces demand directly, and thereby output. This drop in output reduces confidence, which reduces demand further, and a vicious cycle ensues. On the upswing of the business cycle, an economic system is unlikely to ever achieve its full potential until confidence is restored.
As reported in Figure 1.9, US consumer confidence was in free fall in 2007 and 2008, and hit its all-time low in 2009.3 However, despite a brief setback during the summer of 2011 when fears of a double-dip US recession emerged, consumer confidence has gener-ally moved higher, although in a jagged manner, since 2009. Since 2015, confidence now stands roughly on par with pre-recession levels.
CHALLENGES FACING THE US ECONOMYGLOBAL ECONOMIC SLOWDOWN While the US economic outlook remains relatively healthy, numerous potential threats to sustained growth exist. Prominent on this list is the possibility of an economic slowdown among the nation’s primary trading partners, which could threaten US exports and could create instabil-ity along other dimensions. in Figure 1.10 we illustrate variation in economic growth rates for three major economies in the world, which collectively account for over 60 percent of global economic output. The figure shows the rate of economic growth for five years lead-ing up to the beginning of the global recession (grey bar), growth during the past five years (yellow bars), and expected growth over the coming five years. As illustrated, economic growth is weakening substan-tially in all three economic regions. The Euro Area and the US are expected to growth at rates of 1.2 percent
FIGURE 1.8: United States Housing Starts
0
200
400
600
800
1,000
1,200
1,400
1,600
1,800
Multi-Family
Single-Family
Housing Starts (Thousands)
Sources: US Census Bureau; iHS Markit Note: Housing starts statistics use quarterly data.
FIGURE 1.9: Consumer Confidence
50
60
70
80
90
100
110
120Index: 1966=100
Source: Thomson Reuters and University of Michigan Surveys of Consumers. Note: Monthly data used.
FIGURE 1.10: Real GDP Growth – Select Economies
-4% -2% 0% 2% 4% 6% 8% 10% 12% 14% 16%
China
United States
Euro Area + UK2003-20082011-20162017-2022
% change, 5-Year Average Annualized Growth Rate
Source: international Monetary Fund World Economic Outlook3. Economists have tracked consumer confidence since 1968.
The United States Economy

8 | WEST ViRGiNiA ECONOMiC OUTLOOK 2018-2022
and 2.3 percent on average over the coming five years, respectively, compared to 7.1 percent and 2.2 percent annually in the years leading up to the recession. Even greater uncertainly exists in Europe now that the United Kingdom is in the process of leaving the Euro-pean Union. The turbulence in Europe is especially disconcerting since the region receives nearly one-fifth of total US exports.
CHINA While GDP in China grew by an average annual rate of over 15 percent from 2003 through 2008, Chi-nese growth has decelerated sharply in recent years and is expected to hover around 6 percent annually in coming years. While this expected rate of growth still well exceeds the global average, it is much weaker when compared to what the country has experienced over most of the past two decades and is dangerously low given growth in the country’s labor force. Should Chinese growth slow further, it could impact the US economy, especially given that China accounts for over 7 percent of US exports. in addition, concerns over the stability of the Chinese economy remain a pressing issue. Figure 1.11 illustrates the dramatic degree to which China has risen as a share of the global economy since 2000.
FEDERAL GOVERNMENT DEBT Although the situ-ation has improved markedly in recent years, issues related to the long-run sustainability of the US federal government budget remain a potential concern for long-run economic growth. As such, we explore US federal government budgetary issues through figures 1.12 through 1.15.
As depicted in Figure 1.12, federal debt held by the public, which hovered between 31 percent and 36 percent of GDP between 2000 and 2007, began ris-ing dramatically in 2008 as tax revenues plunged and the federal government ramped up spending in part to stimulate the weakening economy. As of early-2016, the figure was around 76 percent of GDP, a rate that is well above the 40 percent averaged over the past 30 years. The figure is forecast to remain relatively stable over the next five years. However, in the long-run (not shown) the figure is forecast to explode given the aging of the US population and the additional public benefits that an older population receives (i.e. Medicare and Social Security), barring any change in public policy.
A public debt level that surpasses a critical level can be detrimental to long-run economic prosperity if the public debt becomes large enough to drive inter-est rates high enough that they ultimately crowd out private-sector savings and investment activity—a key driver of productivity growth in the long-run. in a simi-lar vein, while the historical average deficit/GDP ratio is around 2 percent, the ratio surged to nearly 10 percent
FIGURE 1.11: World GDP by Country
26%
21%17%
36%31%
24%4%
41%
Euro Area + UK
United States
Rest of World
China
2000 2016
United StatesRest of World
Euro Area + UK
China
Source: international Monetary Fund World Economic Outlook
FIGURE 1.12: US Federal Debt Held by the Public as a Share of GDP
30
35
40
45
50
55
60
65
70
75
80Debt Share of GDP (%)
Debt Held by Public as a Share of GDP
30-Year Average
Sources: US Bureau of Economic Analysis; iHS Markit
FIGURE 1.13: Federal Deficit Share of GDP
-4
-2
0
2
4
6
8
10
12Deficit Share of GDP (%)
Post WWII Average
Deficit Share of GDP
Sources: US Bureau of Economic Analysis; iHS Markit.

| 9
FIGURE 1.14: US Transfer Payments as a Share of Personal Income
11
12
13
14
15
16
17
18
19Share of Personal Income, %
Transfer Payments as a Share of Personal Income
30-Year Average
Sources: US Bureau of Economic Analysis; iHS Markit
FIGURE 1.15: Components of US Federal Government Spending
16%
17%67%
26%
19%
55%Nondefense Discretionary
Spending
Defense Spending
Mandatory Spending
1992 2016
Defense Spending
Mandatory Spending
Nondefense Discretionary
Spending
Source: US Congressional Budget Office
FIGURE 1.16: US Personal Savings as Share of Disposable Income
2
3
4
5
6
7
8
9
10Savings Rate (%)
20-Year Average
Savings rate
Sources: US Bureau of Economic Analysis; iHS Markit
in 2009—its highest level since the World War ii-era. After remaining at a very high level through 2012, the ratio has fallen substantially as the US economy has improved and federal spending has fallen in response to the winding down of military operations and seques-tration. The deficit for 2017 is expected to be around 3.5 percent of GDP, and is forecast to begin to increase at the end of the forecast period. However, the deficit’s size relative to the economy is expected to rise sub-stantially over the longer-term (not shown in the figure) due to the reasons described above.
TRANSFER PAYMENTS The recent dynamic involv-ing US federal government debt is closely related to the increase in transfer payments from the US federal government. Examples of transfer payments include Social Security, unemployment benefits, welfare ben-efits, Medicare, and Medicaid. As illustrated in Figure 1.14, transfer payments increased substantially in 2008, reaching a high of around 18.6 percent of per-sonal income, compared to a 30-year average of just over 14 percent. This increase is attributable to two major factors: a) falling income and rising unemploy-ment during the recession, and b) more generous public policy, such as the extension of unemployment benefits. Since recovery began, the share has fallen to around 17.5 percent of personal income and is expected rise slightly over the near term. in the long-run, the figure is expected to rise again substantially with the aging of the US population, barring any policy changes, such as a reduction in benefits and/or an increase in the Social Security retirement age.
in Figure 1.15 we report the composition of US fed-eral government spending for 1992 and 2016. As illustrated, mandatory spending, which is primarily composed of transfer payment spending such as Social Security, Medicare, Medicaid, unemployment insurance, and the like, rose to 67 percent of all federal spending in 2016, up from 55 percent in 1992, largely the result of an aging population. At the same time, defense spending fell to 16 percent of total spending, down from 26 percent in 1992. Nondefense discretion-ary spending has fallen to 17 percent of total spending. if the long-term debt burden is to be reduced, it will have to be accomplished through either higher taxes, or a reduction in one of these areas of spending, each of which carries along with it a set of concerns and difficult political realities.
SAVINGS Savings is another potential factor that can affect the US economy in coming years. The rate of national savings, as reported in Figure 1.16, has fluctu-ated fairly widely over the past decade or so. it fell to a low of just over 2 percent in the mid-2000s, and then rose to a high of around 9 percent during the recent recession. Savings has since fallen back to around 5.5
The United States Economy

10 | WEST ViRGiNiA ECONOMiC OUTLOOK 2018-2022
percent, which is noticeably above the 20-year average for the figure. However, savings is expected to increase substantially over the coming five years, mainly driven by changing demographics in the economy. While this projected, short-term rise in savings has the potential to weaken consumption spending slightly, it will likely be an overall positive in the economy over the long-run, as a higher savings rate enables a higher level of capital investment.
INFLATION As reported in Figure 1.17, inflation has been stable by historic standards in the US since the mid-1980s, rarely moving outside of the 1 to 3 percent range. While overall inflation did reach a slight spike of close to 4 percent for a brief period in 2008 due to surging oil prices in the first half of that year, inflation has been below trend for the most part since the Great Recession ended. Core inflation, which excludes food and energy prices from the equation (yellow line in figure), has been below the 2 percent figure that mon-etary policymakers explicitly state as a target since the beginning of 2012. Moreover, core inflation is expected to remain below this level through the first half of the outlook period, based on market-based expectations (such as Treasury Inflation-Protected Securities) and the consensus of economic forecasts.
However, there is a chance that faster growth in price levels could re-emerge. The US Federal Reserve (Fed) has taken unprecedented steps to stabilize the econ-omy since 2008, and in so doing has increased the monetary base—primarily the volume of reserves held by banks—dramatically through its purchase of US Treasury Securities and other assets, such as private-sector mortgage-backed-securities. This monetary stimulus has not translated into higher inflation due to continued modest demand and banks’ reluctance to lend. Inflationary pressures do have the potential to build as lending and the broader economy improve. As that happens, the Fed will need to withdraw liquidity from the monetary system so as not to create an envi-ronment for inflation to build. The uncertainty stems from the fact that monetary policy across the globe is in uncharted territory given the volume of the recent monetary stimulus, the nature of the asset purchases, and negative interest rates in the case of the European Union, Japan and other areas.
INTEREST RATES A related concern is the inevitable rise in interest rates in the US economy in coming years. This rise will, in part, stem from the Fed’s ongoing “normalization” process wherein the Federal Open Market Committee (FOMC) unwinds some of its previous asset purchase programs and other forms of monetary stimulus discussed above. Short-term interest rates have been on the climb in concert with recent hikes in the discount rate by the Fed, but the
FIGURE 1.17: United States Inflation Rates
-1
0
1
2
3
4
5Percent Change Year over Year (%)
Total Personal Consumption Expenditures
Excluding Food and Energy
Targeted Inflation Rate
Sources: US Bureau of Economic Analysis; iHS Markit
FIGURE 1.18: Select United States Interest Rates
0
1
2
3
4
5
6
7
8
9
10
Federal Funds Rate
10-Year Treasury Rate
30-Year Mortgage Rate
Percent (%)
Sources: Federal Reserve Board of Governors; Freddie Mac; iHS Markit
FIGURE 1.19: : Share of Aggregate Income by Quintile
0
5
10
15
20
25
30
35
40
45
50
55 Income Share by Quintile, %
Lowest Quintile
Highest Quintile
Fourth Quintile
Third Quintile
Second Quintile
Source: US Census Bureau

| 11
long of the rate curve has budged little from its range of the past few years. if conditions change and rates rise too rapidly, it could precipitate much weaker levels of investment and consumer spending growth. On the other hand, if the Fed waits until too late to allow rates to rise, inflation would be a concern. Figure 1.18 reports the forecast for three key US interest rates, but some appreciable disagreement exists among FOMC members over how high and quickly short-term inter-est rates should be raised in the coming years.
INCOME INEQUALITY The final concern that we con-sider relates to rising income inequality in the US. in Figure 1.19 we illustrate the share of aggregate income in the US that is earned by households divided into quintiles. As illustrated, the lowest-income quintile, while representing 20 percent of households, earned around 3 percent of the total income in the nation in 2015. The second lowest-income fifth of households earned around 8.2 of the total income in the nation in 2015, and so on. The highest-income quintile earned 51 percent of the nation’s total income in 2015. Fur-ther, as illustrated, the income share for the highest quintile has risen by around 7 percentage points over the period illustrated, corresponding to a decline in the share earned by the other quintiles. Overall, many individuals are concerned about the growing income concentration among higher income households and
FIGURE 1.20: Income Gap
3.5
4.0
4.5
5.0
5.5
6.0
6.5Mean Income by Quintile Ratios: Highest Quintile to Second Quintile
Sources: US Census Bureau
The United States Economy
McKinley Carter is an SEC-registered investment adviser. Forinformation pertaining to McKinley Carter’s fees and services, pleasecontact McKinley Carter for a copy of our disclosure statement as setforth on our Form ADV. For information pertaining to our registrationstatus, refer to the Investment Adviser Public Disclosure website(www.adviserinfo.sec.gov).
866.306.2400
www.mckinleycarter.com
C H A R L E S T O N | W H E E L I N G | PA R K E R S B U R G | P I T T S B U R G H | D C M E T R O
Proud to Support WVU’sEconomic Outlook Conference
and to Invest in a Good Life for all West Virginians
these individuals have often requested or proposed public policies that could reverse this trend. Finding an appropriate balance within public policy between promoting economic growth overall and achieving a socially-acceptable income distribution can prove to be challenging in many cases.

12 | WEST ViRGiNiA ECONOMiC OUTLOOK 2018-2022
RECENT ECONOMIC PERFORMANCEWest Virginia’s economy emerged from a sharp reces-sion in mid-2016 and appears to be in the early stages of a solid economic rebound. The state’s beleaguered coal industry has rebounded since the second half of 2016 following several years of precipitous declines in both payrolls and output—especially in the southern West Virginia coalfields. Moreover, although activity within the state’s natural gas industry did not fall off at anywhere near the same magnitude as that of coal, production was erratic for several quarters across 2015 and 2016, but began to register solid growth over the second half of 2016 that continued into the first half of 2017.
CHAPTER 2:
The West Virginia Economy
FIGURE 2.1: Total Employment
120
125
130
135
140
145
150
675
680
685
690
695
700
705
710
715
US
West Virginia, Thousands United States, Millions
West Virginia
Source: US Bureau of Labor Statistics *Shaded regions indicate recessions
FIGURE 2.2: Economic Growth in West Virginia and Adjacent States, 2012Q1-2017Q1
-1.0% -0.5% 0.0% 0.5% 1.0% 1.5% 2.0%
West Virginia
Pennsylvania
Virginia
Ohio
Maryland
Kentucky
Real GDP
Employment
Average annual growth, %
Sources: US Bureau of Labor Statistics; Bureau of Economic Analysis
4. Data sources are noted in each figure. All historic and forecast employment data for West Virginia come from the US Bureau of Labor Statistics Quarterly Census of Employment & Wages program. For an explanation of these data, including comparisons to the monthly CES payroll employment data, see http://www.bls.gov/cew/cewfaq.htm.
The state’s economic performance since 2012 is a significant outlier from the overall national economic backdrop. While US economic growth has lagged what has prevailed on average during post-WWii economic expansions by many measures, the current expansion recently entered its 9th year and stands as the third-longest in duration as tracked by the National Bureau of Economic Research. Nationally, employers have expanded payrolls by 10 percent (or 13.3 million jobs) since the beginning of 2012. By comparison, total employment within West Virginia4 has been on a downward trajectory for several years and, as of the second quarter of 2017, remains nearly 3 percent (or just over 20,000 jobs) below the cyclical peak the state achieved in early-2012.
STATE COMPARISONS While West Virginia’s per-formance relative to the nation over the past several years has been below average based upon most economic indicators, the state has also managed to lag the performance of its neighboring states. indeed, West Virginia has recorded average annualized growth of less than 0.3 percent in real GDP since the first quarter of 2012, trailing the next slowest-growing state in the region (Virginia at 0.8 percent). Pennsyl-vania, Ohio and Kentucky, states which also pos-sess above-average exposures to energy markets, saw real GDP grow at much faster rates overall. The state’s relative growth deficit compared to its neigh-bors since 2012 has been even more significant as West Virginia is the only state in the region to see an outright contraction in payrolls over this time period while neighboring states saw average annual growth range from no worse than 0.8 percent to as much as 1.8 percent.
ENERGY SECTOR The primary driving forces behind West Virginia’s economic struggles of the past several years and the nascent recovery in economic activity since the second half of 2016 are the state’s coal and natural gas industries. Overall, the coal and natural gas industries combined to account for nearly 17,000 of the nearly 26,000 jobs lost on net statewide between the first quarter of 2012 and fourth quarter of 2016. The coal industry accounted for the wide majority of energy-related job losses over this time period as the reinforcing effects of market forces and previous regulatory changes at the state and federal levels have dramatically reduced the use of West Virginia coal to generate electricity in the US. Also, flagging demand for thermal and metallurgical coal abroad, linked to

| 13The West Virginia Economy
a severe excess capacity in global steel markets, a strong dollar and rapid declines in coal use across por-tions of Western Europe, further contributed to the coal industry’s struggles in recent years.5 After averaging roughly 158 million short tons in 2008, coal production fell to an annual total of 80 million short tons in 2016. With the sharp downward trend in production over this time period, employment has followed suit as coal industry payrolls (excluding contract laborers) plunged from their cyclical peak of 26,000 in early-2012 to a trough of 11,300 in mid-2016.
However, the industry’s fortunes have improved appreciably over the past several quarters, leading to gains in both output and miner payrolls across the state’s northern and southern coal-producing regions. A sizable portion of this rebound is due to a surge in Asia-Pacific metallurgical coal demand since last fall, combined with a temporary boost in demand for Cen-tral Appalachian met coal supplies after Cyclone Deb-bie damaged Australia’s rail infrastructure, but higher utilization rates of domestic coal-fired power plants through the first half of 2017 have also helped to pro-pel growth in statewide coal production. indeed, the seasonally adjusted annualized rate of coal production has increased from less than 75 million short tons in early 2016 to more than 93 million short tons in the first six months of 2017. Statewide coal industry employ-ment has increased by approximately 26 percent since last fall, reaching a total of 14,300 during the second quarter of 2017.
Unlike coal, West Virginia’s natural gas industry did not actually reach its peak in terms of employment or pro-duction growth until the end of 2014. From that point until the third quarter of 2016, however, the industry registered only an 11 percent cumulative increase in marketed production volumes after having seen with-drawal volumes effectively double over the space of the previous seven quarters. Drilling and exploration companies and field service support firms ended up shedding roughly 3,000 workers over this time frame, leaving employment roughly at the same overall level observed in mid-2009 (excluding contract laborers). While final demand for natural gas has generally been on the rise over the past several years, particularly in the electric power sector, a protracted bear market pricing environment in the Appalachian Basin had a significant negative impact on the industry during 2015 and much of 2016. Prices fell too far to justify new exploration and capital investment, but at the same time accumulated debt obligations forced many
companies to maintain or expand production volumes such as re-fracking existing wells or find ways of rais-ing average well productivity rates.
indeed, well productivity rates have increased rapidly in recent years. Active well counts fell more than 14 percent between 2014 and 2016, reaching their lowest total in more than a decade, but marketed production increased 26 percent over this two-year period. Prices also faced pressure from insufficient pipeline infra-structure, which created bottlenecks that left natural gas supplies stranded rather than delivered to high-demand areas, such as New England, and allowing prices between the areas to remain closer to parity for extended periods of time.
Just as conditions within the coal industry have improved over the past three or four quarters, market conditions for natural gas have improved enough to boost production and, to a lesser extent, payrolls. Overall gas production volumes in West Virginia through the first seven months of 2017 are estimated to be roughly 11 percent above year-ago levels as recently-completed pipeline capacity has helped to improve uptake. industry payrolls likely stabilized in the second half of 2016, and while the productivity gains of recent years will dampen job growth to some extent in the near term, a doubling in the number of active rigs deployed in West Virginia since August 2016, plus announced plans for increased exploration activity and additional pipeline capacity coming on line in the very near future, point to accelerating job growth, especially once contract labor is taken into account.
CONSTRUCTION AND MANUFACTURING in addi-tion to the direct impacts on output and employment in their respective industries, the coal industry’s steep
FIGURE 2.3: West Virginia Employment Distribution by Sector (2016)
Government20%
Trade, Transportation &
Utilities20%
Education & Health Services
18%
Leisure & Hospitality
11%
Professional & Business Services
10%
Manufacturing7%
Construction4%
Natural Resources & Mining
3%
Financial Activities3%
Other Services3% Information
1%
Source: US Bureau of Labor Statistics
5. For a more thorough discussion of West Virginia’s coal industry, along with an analysis of future trends and possible scenarios for coal production over the long term, see Chapter 3 of this report as well as BBER report Coal Production in West Virginia: 2017-2040.

14 | WEST ViRGiNiA ECONOMiC OUTLOOK 2018-2022
downturn and natural gas industry’s struggles weighed heavily on the construction sector. The $500 million Procter & Gamble manufacturing facility in Berkeley County, commercial development in the i-79/i-68 cor-ridor and the construction/expansion of several cryo-processing, storage and wastewater recycling facili-ties in shale gas-producing counties are examples of projects that have prevented payrolls from falling even further. A modest improvement in housing construc-tion activity within West Virginia’s few regional growth centers have also helped to buoy the sector to some extent. Unfortunately, these projects represent the bulk of what limited growth has occurred for the sec-tor as a whole. Total employment in this sector has shrunk by nearly 6,500 jobs on net since 2012, with roughly one third of those losses occurring during calendar year 2016.
West Virginia’s manufacturing sector saw a mixed per-formance during 2016 as inflation-adjusted output for the sector as a whole rose moderately from the previ-ous year but total payrolls contracted again as a few subsectors with relatively strong connections to energy production, such as fabricated metals and machinery, accounted for a substantial proportion of the jobs lost. These two subsectors helped to offset the continued solid contributions to growth provided by wood prod-ucts and furniture manufacturers as well as the expand-ing automotive parts supply chain. The other core areas of weakness for the manufacturing sector during 2016 are those that have experienced sustained declines in activity for many years: namely electrical equipment, apparel/textiles and paper manufacturers.
SERVICE SECTORS Education and health services recorded a 0.6 percent increase in payrolls during 2016 and, reflecting broader national trends, has been a consistent source of net job growth for more than two decades. Both private education and the healthcare services segments of the sector managed to grow over the course of 2016, with the latter benefiting in particu-lar from new or expanding facilities operated by WVU Medicine. At the same time, many of West Virginia’s private service-providing industries have struggled in recent years due to the declining demand for direct support functions to energy firms, the downstream impacts of broader losses in wages and/or population as well as broader structural changes. West Virginia’s professional and business services sector registered a 2.2 percent decline in employment as demand for contract labor, engineering and other support service roles has fallen, particularly within the energy industry. Weakness in coal and natural gas have hurt the transportation and warehousing sector in a fairly direct manner as well, cutting payroll levels by 4 percent from 2015 levels. Falling coal shipments
have resulted in fairly deep layoffs at rail, trucking, and river barge companies in recent years, while pullbacks in drilling and exploration for natural gas prompted job cuts at firms transporting materials to well pads over the course of 2015 and 2016. The wholesale trade sector has also experienced relatively steep job cuts in the state over the past several years, partly as a result of the energy industry’s struggles, but also due to broader structural changes in business supply chains, the declining brick-and-mortar side of retail, and auto-mation at warehousing facilities.
Consumer-oriented sectors, such as leisure and hos-pitality and retail trade, saw mixed results for the year as a whole. Healthy income and job gains observed in expanding areas such as the Eastern Panhandle and North-Central West Virginia helped to boost retail and food service opportunities and generally served to off-set the shuttering of stores and other establishments in areas deeply affected by the coal industry’s downturn. One consumer-related segment in the state that has consistently struggled for several years, regardless of region, is the gaming industry, which has struggled with a broader decline in interest in racing and stiff competition for visitors from newer venues in neigh-boring states.
GOVERNMENT Steep declines in severance tax col-lections from the coal and natural gas industries have created significant problems for West Virginia’s state government. State government employment increased by roughly 500 jobs during 2016, but the state’s workforce remains roughly the same size as it was in 2011 after three years of attrition and hiring freezes for many agencies. The public sector for many cities and counties in West Virginia has faced similar budgetary issues as the state, but have also faced the additional pressure caused by falling property and B&O tax rev-enue due to population declines and broader losses in business activity. Local government payrolls did rise slightly in 2016, but this was a result of growth in the Eastern Panhandle and several counties in Northern West Virginia. Finally, federal government payrolls in West Virginia jumped 1.3 percent in 2016 thanks to hir-ing by the iRS operations in a couple of counties and at the FBi facility in Harrison County.
LABOR MARKET DYNAMICS West Virginia’s unem-ployment rate has shown a great deal of volatility in recent years, reflecting a combination of the state’s economic difficulties as well as some of its underlying demographic trends. After peaking at 8.7 percent in late 2010, the state’s jobless rate fell more than two percentage points and generally tracked broader national trends through the latter half of 2013. How-ever, the unemployment rate then managed to hover in the mid- to upper-6 percent range for the next two

| 15
FIGURE 2.4: Unemployment Rate
3
4
5
6
7
8
9
10
US
% of Labor Force
West Virginia
Source: US Bureau of Labor Statistics *Shaded regions indicate recessions
FIGURE 2.5: Labor Force Participation Rate, 2015
53
63
40
45
50
55
60
65
70
75
Wes
t Virg
inia
Mis
siss
ippi
Alab
ama
Kent
ucky
New
Mex
ico
Arka
nsas
Loui
sian
aSo
uth
Car
olin
aFl
orid
aTe
nnes
see
Ariz
ona
New
Yor
kO
klah
oma
Mic
higa
nN
orth
Car
olin
aN
evad
aC
alifo
rnia
Geo
rgia
Del
awar
eO
hio
Ore
gon
Haw
aii
US
Mai
nePe
nnsy
lvan
iaTe
xas
Was
hing
ton
New
Jer
sey
Mon
tana
Idah
oR
hode
Isla
ndIn
dian
aVi
rgin
iaM
assa
chus
etts
Illin
ois
Mis
sour
iC
onne
ctic
utAl
aska
Col
orad
oVe
rmon
tW
yom
ing
Kans
asM
aryl
and
Wis
cons
inN
ew H
amps
hire
Uta
hSo
uth
Dak
ota
Min
neso
taN
ebra
ska
Iow
aD
CN
orth
Dak
ota
Percent of Civilian Non-institutionalized Population
Source: US Bureau of Labor Statistics
FIGURE 2.6: Per Capita Personal Income Growth
90
100
110
120
130
140
150
160
170Index, 2000=100
US
West Virginia
Source: US Bureau of Economic Analysis
years as healthier labor markets in some portions of the state saw their gains offset by those dealing with significant energy industry job losses.
The recent improvements in the coal and natural gas industries, along with the continued momentum in West Virginia’s stronger-performing regions, have led to dramatic declines in the unemployment rate over the last several quarters. indeed, preliminary data indicate the unemployment rate currently sits at 4.6 percent as of the second quarter of 2017, only slightly higher than the national jobless rate of 4.4 percent. Continuing and initial unemployment insurance claims for the state as a whole have fallen a combined 38 percent versus the second quarter of 2016 and point to additional modest declines in the jobless rate over the next several months.
Fundamental economic improvements within certain regions in the state help to explain the downward trend in the unemployment rate over the past several years, but other factors have played a significantly larger role. For example, the total number of residents counted as unemployed in the state has declined by just over 32,000 since the first quarter of 2010. At the same time, West Virginia’s overall labor force has shrunk by virtually the same magnitude over this seven-year period. Thus, outright population losses and exit from the labor force have driven most of the decline, rather than actual job gains. These workforce-related factors include the discouraged worker effect, health-related limitations, education or retirement. As of 2016, West Virginia’s labor force participation rate was the lowest among all states at approximately 53 percent. Further, West Virginia has been last among the states in terms of labor force participation for decades. The state’s age composition does help to explain some of this deficit in workforce participation, but not all of it since West Virginia also ranks the lowest among states when focusing exclusively on the prime working age popula-tion (25-54 years of age).
INCOME Per capita personal income, without account-ing for inflation, in West Virginia reached approximately $37,400 in 2016, representing a 1.5 increase over the previous calendar year. After generally outperforming the US average between 2007 and 2011, the state has failed to keep pace with national-level income growth during each of the past five years. This lagging income growth has caused West Virginia to see the ratio of its per capita income relative to the nation (and surround-ing states) to shrink in recent years. After peaking at 80 percent in 2011, the ratio of the state’s per capita income relative to the US fell to 75 percent by the end of 2016. Preliminary data suggest the deficit will shrink slightly in 2017.
The West Virginia Economy

16 | WEST ViRGiNiA ECONOMiC OUTLOOK 2018-2022
WAGES Slumping demand for labor in high-paying sectors had a noticeable impact on wage growth in West Virginia during 2016. The statewide average annual wage actually fell 1.7 percent (without adjust-ing for inflation) for the full calendar year, dropping to a level of $41,600. Job losses in several high-paying industries precipitated this drop in overall wage rates, particularly during the first half of the year. Workers in the utilities sector continued to receive the highest average annual wage at $89,000—well over double the statewide average. Wage growth within the natural resources and mining sector failed to keep pace with inflation during each of the last five years and has actu-ally contracted more than 9 percent in nominal terms since 2015. Nonetheless, the sector still remains the second-highest paying within the state with an aver-age annual wage of approximately $71,500.
The fact that changes in wage income differ from growth in per capita personal income can be explained by faster growth in other sources of per-sonal income. For example, transfer payments to individuals, such as Social Security benefits, are a component of total income but are clearly not counted as wages. Other forms of non-wage income, such as investment returns, pensions and earnings from the self-employed can affect year-to-year changes in per-sonal income as can adjustments to tax withholdings by state or federal governments and income earned in other states by commuters.
GDP Volatility within West Virginia’s energy sector has yielded significant swings in real GDP growth in the past decade. After easily outpacing the national average in terms of real GDP growth between 2008 and 2011, the overall value of goods and services pro-duced within the state has actually declined in three of the last five years. On a positive note, real GDP growth has rebounded along with the recoveries in natural gas and coal markets as our preliminary estimates indicate statewide output has increased roughly 5 percent on an average annualized basis since the third quarter of 2016.
The coal and natural gas industries’ struggles have contributed the most to the state’s near-total lack of economic growth since 2012, due in large part to the capital intensiveness and high wages within these industries. However, real statewide output excluding these two industries for has actually contracted since 2012, indicating not only the downstream impacts (both positive and negative) coal and natural gas cre-ate for certain regions, but also the limited number of alternative growth drivers for many parts of the state.
FIGURE 2.7: Per Capita Personal Income (2016)
HI
AK
< 42.142.1 - 46.947.0 - 52.1> 52.1
US = $49.6
Per Capita Personal Income (ths $)
TX
CA
MT
AZ
ID
NV
NM
COIL
OR
UT
KS
WY
IANE
SD
MNND
OK
FL
WI
MO
WA
AL GA
AR
LA
MI
IN
PA
NY
NC
MS
TN
VAKY
OH
SC
ME
WV
VTNH
MDNJ
MACT
DE
RI
Source: US Bureau of Economic Analysis
FIGURE 2.8: Average Annual Salary by Sector (2016)
0 10 20 30 40 50 60 70 80 90
Leisure & HospitalityRetail Trade
Other ServicesState Average
Education & Health ServicesProf. & Business Services
GovernmentTransportation & Warehousing
Financial ActivitiesInformation
ConstructionManufacturing
Wholesale TradeNatural Resources & Mining
Utilities
Thousands $ per yearSource: US Bureau of Labor Statistics
FIGURE 2.9: Real Gross Domestic Product Growth
-4
-3
-2
-1
0
1
2
3
4
5
West VirginiaUS
% Change Year Ago
Source: Bureau of Economic Analysis; WVU Bureau of Business & Economic Research Note: Figures for WV in 2012-2016 are estimated by WVU BBER

| 17
FIGURE 2.10: Real GDP Growth
96
98
100
102
104
106
108
110
112Index, 2007=100
US
West Virginia
West Virginia w/o mining
Sources: Bureau of Economic Analysis; WVU Bureau of Business & Economic Research
FIGURE 2.11: Total Population
1.70
1.75
1.80
1.85
1.90
1.95
2.00
2.05
2.10
150
170
190
210
230
250
270
290
310
330
350
Milli
ons
Milli
ons
United States, Millions of Residents
US
West Virginia
West Virginia, Millions of Residents
Source: US Census Bureau
FIGURE 2.12: Summary Population Profiles
West Virginia United States
Total Population (2016) 1,831,102 323,127,513
% Population Under 18 (2016) 20.4% 22.8%
% Population 65 Years + (2016) 18.7% 15.2%
Population with Less than High School Diploma (2015, % of pop. 25 yrs. +) 14% 12.8%
Population with High School Diploma, No College (2015, % of pop. 25 yrs. +) 40.7% 27.6%
Population with Some College, No Degree (2015, % of pop. 25 yrs. +) 25.7% 28.9%
Population with Bachelor’s Degree or Higher (2015, % of pop. 25 yrs.+) 19.6% 30.6%
Median Age (2016) 42.2 37.9
Average Household income (2015) $56,568 $78,378
Average Household Size (2015) 2.49 2.73
Labor Force Participation Rate (2016) 53.2% 62.8%
Sources: US Census Bureau; Bureau of Labor Statistics
RECENT DEMOGRAPHIC TRENDSPOPULATION West Virginia’s population declined in 2016 and has seen a cumulative loss of more than 25,000 residents since 2012. This marks the first four-year stretch of population declines since the late 1990s, but marks the largest percentage loss in popu-lation over such a time frame since the late-1980s/early-1990s. Overall, this places the state’s total resi-dent population at its lowest point since 2006.
With below-replacement birth rates, a disproportion-ate share of residents over the age of 65, and higher-than-normal death rates among many age groups, West Virginia experiences a natural decline in residents each year as deaths outnumber births. Consequently, changes in the state’s population are driven in large part by domestic migration flows. According to the US Census Bureau, the state experienced a net outflow of more than 16,000 residents since the mid-2013. According to the US Census Bureau, 47 of the state’s 55 counties lost residents between 2015 and 2016. Kanawha County saw the largest absolute decline in population (-1,966). The state’s most populous county did not register the largest percentage loss, but was among the 18 counties in the state that posted a drop of at least 1 percent on a year-over-year basis in 2016. in fact, three counties (Logan, McDowell and Mingo) each saw their population totals decline by more than 2.3 percent from 2015. Berkeley, Monongalia and Jef-ferson accounted for the largest absolute and percent-age gains in population between 2015 and 2016, and have helped to buoy the state’s population numbers since the early 2000s.
AGE DISTRIBUTION One of the defining demographic characteristics of the state’s population is its age struc-ture. West Virginia’s median age increased slightly in 2016 to 42.2 years, placing it more than 4 years higher than the nation as a whole and ranking second highest among all 50 states. Another sign of the state’s skewed age distribution is the fact that nearly 25 percent of the state’s residents are aged 60 or older, compared to 20 percent for the nation as a whole.
HEALTH in addition to containing a higher-than-average share of elderly residents, West Virginia’s population also tends to be less healthy than other states in the US. According to the Centers for Disease Control, the overall mortality rate, even after adjusting for age, in West Virginia is the second highest in the nation. High incidences of heart disease, cancer and diabetes have been key contributors to the state’s comparatively high mortality rate, as well as behav-ioral or lifestyle factors such as relatively little physi-cal activity during leisure time. Mortality rates among men aged 18-45 have risen at a particularly fast pace
The West Virginia Economy

18 | WEST ViRGiNiA ECONOMiC OUTLOOK 2018-2022
in recent years, with the overall number of deaths among this cohort increasing by 157 since 2012 even as the total size of this cohort has declined in number by 9,700 over the same time period.
WEST VIRGINIA OUTLOOKEMPLOYMENT GROWTH Expectations for the US and broader global economies during the forecast horizon will directly influence West Virginia’s economic performance over the coming years.6 Should the US economy perform differently (i.e. enter into a recession or see growth accelerate) or global demand for the state’s energy commodities and manufactured goods deviate from their expected paths, growth could ulti-mately exceed or under-perform expectations.
Overall, the forecast calls for the state’s economy to remain on path to economic recovery and grow at an average rate of 0.7 percent annually during the five-year outlook period slated to end in 2022. This rate of growth does represent an improvement over the significant number of job losses recorded between 2012 and 2016, but this will still constitute a below-average rate of growth compared to the nation as a whole (0.9 percent annually) over the next five years. Also, the state is not expected to reach the level of employment observed at the recent peak in 2012 until 2021.
NATURAL RESOURCE AND MINING EMPLOYMENT The natural resources and mining sector as a whole is expected to see jobs increase at an average annual rate of 2.8 percent over the next five years. However, the source and timing of these employment (and output) gains will vary quite a bit for each of the major industry segments found within this super-sector. For example, the forecast calls for payroll levels within the state’s coal industry to hover just below 15,000 workers for the next couple of years as healthy global demand for metallur-gical and thermal coal buoys mining activity, particularly in southern West Virginia, and helps to offset expected closures of several US power plants that burn coal sourced from both of the state’s producing regions. By the latter half of the outlook period, coal employ-ment will begin to decline gradually as some of the state’s more labor-intensive mines become increasingly uncompetitive on global markets and production shifts further to highly-productive continuous operations.
The forecast for the state’s coal industry is one of relative stability during the next five years, particularly when compared to the precipitous declines in pro-duction and employment that occurred over the past
FIGURE 2.13: All-Cause Mortality Rates, 2013-2015
AK
HI
TX
CA
MT
AZ
ID
NV
NM
COIL
OR
UT
KS
WY
IANE
SD
MNND
OK
FL
WI
MO
WA
AL GA
AR
LA
MI
IN
PA
NY
NC
MS
TN
VAKY
OH
SC
ME
WV
VTNH
MD
NJ
MACT
DE
RI
589 - 671678 - 716
748 - 817721 - 747
Age-Adjusted Deathsper 100,000 Population
830 - 954
Source: Centers for Disease Control Note Data represent average rates for 2013 to 2015.
FIGURE 2.14: Employment Growth Forecast
-5
-4
-3
-2
-1
0
1
2
3
US
% Change, Annual
West Virginia
Source: Bureau of Labor Statistics; WVU BBER Econometric Model; iHS Markit Note: Shaded region represents the forecast period
FIGURE 2.15: West Virginia Employment Growth Forecast by Sector
-3.0% -2.0% -1.0% 0.0% 1.0% 2.0% 3.0%
Information
Government
Financial Activities
Trade, Transportation & Utilities
Other Services
Education & Health Services
Leisure & Hospitality
Total
Manufacturing
Professional & Business Services
Construction
Natural Resources & Mining
2006-20162017-2022
Average annual growth, %
Sources: Bureau of Labor Statistics; WVU BBER Econometric Model
6. All forecast estimates for this document are derived from the West Virginia University Bureau of Business & Economic Research Econometric Model, unless otherwise noted. The model is based on an analysis of more than 100 variables that characterize the West Virginia economy.

| 19
several years. Ongoing end-market shifts (natural gas and renewables) and previous regulatory changes—such as MATS in the US or the industrial Emissions Directive in the European Union—will cause domestic and global coal demand to be structurally lower than what it was as recently as 2014. However, many of the industry’s major operators were forced into bankruptcy or some other form of financial re-organization during the 2013 to 2016 time period, and as a result these companies now possess healthier balance sheets and fewer legacy costs that will enable them to navigate a smaller global coal market. For a more detailed dis-cussion of the short- and long-term outlook for West Virginia’s coal industry, along with an examination of upside and downside risks and their potential impacts, see Coal Production in West Virginia: 2017-2040.
West Virginia’s oil and natural gas industry is expected to add jobs at a robust rate of 9.6 percent per year dur-ing the outlook period, marking a sizable upward revi-sion compared to the previous forecast. A portion of this stronger growth rate stems from the industry rebound-ing from a lower starting point at the beginning of the forecast horizon. More fundamentally, however, payroll growth is actually expected to outstrip gains in gas production volume over the next two years or so, not because the productivity and efficiency gains achieved in recent years will disappear over the long term. Instead, drilling support services and other related firms will have to hire large numbers of workers as exploration and development activity is ramped up going forward.
Growing prospects for LNG exports, new natural gas-fired power plants, the addition of new midstream stor-age and distribution assets, such as cryo-processing facilities and pipeline infrastructure, plus the upcoming construction of downstream facilities such as the Shell ethane cracker in Pennsylvania (and possibly PTT Global in Ohio) will all combine to generate strong job growth throughout the industry in West Virginia as drill-ers expand production to fill rising end-market demand. The main caveat with this projected job growth is that since some of these jobs could ultimately be classi-fied under the umbrella of contract labor rather than official natural gas industry jobs, the measured rate of job growth could be lower during the outlook period. Regardless, the anticipated gains in activity at the up-, mid- and downstream levels will result in healthy job growth for West Virginia’s natural gas industry.
CONSTRUCTION EMPLOYMENT West Virginia’s construction sector’s performance is expected to slowly recover from its lackluster performance of the past several years, expanding at an average annual rate of 1.7 percent through 2022. Construction activity is expected to grow at its fastest pace between 2017 and 2020. The energy industry will drive a large portion
The West Virginia Economy
of this growth, as several natural gas pipeline projects and at least one natural gas-fired power plant are slated to begin or wrap up within the next couple of years. in addition, continued commercial construction develop-ment along the i-79/i-68 corridor in North-Central West Virginia will buoy the sector, as will homebuilding activ-ity in the state’s growing population centers.
Nonresidential development in the Eastern Panhandle will also underpin the sector’s performance. The Procter & Gamble manufacturing facility will continue to be built out after its late-2017 opening and will likely lead to the addition of co-located supply chain opera-tions over the next few years. A planned $150 million ROXUL plant in Jefferson County is also expected to boost construction sector payrolls, as the facility is projected to begin production by early-2020.
Finally, infrastructure construction activity has been depressed in West Virginia for an extended period of time, owing to budget difficulties for state and local governments due to the downturn in severance tax col-lections, weak growth in gasoline taxes and erstwhile uncertainty over federal infrastructure spending plans. While the forecast does call for modest improvements in infrastructure spending, upside potential for addi-tional infrastructure spending exists from both state and federal sources. At the state level, the Justice Administration has scheduled a bond vote for this fall that would allocate revenue from increased gas and motor vehicle taxes as well as DMV fees (up to a limit of $1.6 billion) in road infrastructure enhancements. From the federal government, the Trump Administra-tion has proposed $1 trillion in federal spending over the next ten years and recently signed reforms that streamlined the permitting process so as to minimize delays in getting projects approved and started.
MANUFACTURING in contrast to the last couple of decades, the manufacturing sector is expected to record net job growth over the forecast horizon at a rate of 0.9 percent per year. Manufacturers linked to the US housing market, including furniture and finished wood products producers, and certain plas-tics manufacturers, will enjoy solid growth during the outlook period. Also, machinery and fabricated metals manufacturers, which have seen large percentage declines in orders and payrolls in recent years, will benefit from a more solid footing for the state’s energy sector for the next few years.
While machinery manufacturing is expected to register the fastest rate of growth over the next five years, the state’s chemicals industry will account for the majority of the sector’s overall growth during the outlook period. Part of this optimistic outlook for the chemicals indus-try stems from the ongoing development of natural gas

20 | WEST ViRGiNiA ECONOMiC OUTLOOK 2018-2022
resources in the Marcellus and Utica Shale plays, par-ticularly the construction of at least one ethane cracker plant in the region. in addition to providing chemicals manufacturers a low-cost feedstock, projects such as the ethane cracker further develop the critical mass of industries because they enable conversion of the raw material (ethane) into compounds (ethylene and poly-ethylene) that can be used to manufacture plastics and an array of other materials within the region rather than exported to other areas, such as the Gulf Coast.
However, the largest sources of job creation within the chemicals industry, and the manufacturing sector in general, will come from the Procter & Gamble facil-ity in Martinsburg and the ROXUL plant in Jefferson County. The P&G facility is expected to begin limited production later in 2017 with 300 workers, before eventually increasing the number of product lines in 2019. in addition, P&G has already decided to consoli-date production from other North American operations and will re-locate Swiffer production from Canada to the Martinsburg facility by 2021. Overall, the plant is expected to have at least 700 workers once produc-tion is fully ramped up. The ROXUL plant, which will produce insulation materials, is expected to hire 150 employees once it begins operations in early-2020.
SERVICE SECTOR GROWTH Goods-producing industries are expected to record the fastest rates of growth over the next five years, but several private service-providing sectors will account for measurable gains during the outlook period. The professional and business services sector is expected to add jobs on net at a pace of more than 1.6 percent per year. Most of this growth will likely come from increased contract labor utilization by coal companies, natural gas produc-ers and field support services firms; however, the gas
industry’s improved prospects will bolster demand for engineering, legal and other consulting industries that cut jobs over the course of the past couple of years. Thanks to steadily growing demand for health care from the state’s large, and growing, contingent of elderly resi-dents, education and health services will see employ-ment grow at an average annual pace of 0.5 percent.
Leisure and hospitality is expected to enjoy job gains of nearly 0.5 percent per year through 2022. Competi-tion from gaming venues in neighboring states will continue to hamper growth prospects in several areas, but the state’s status as a regional tourism destina-tion will remain a key driver going forward. Moreover, the international Boy Scout Jamboree in 2019 and the National Boy Scout Jamboree in 2021 will bolster the sector, though the effects will largely be localized to the New River National Gorge area. Retail will likely see moderate improvements of 0.3 percent per year through 2022. Gains in real per capita income and expanding retail opportunities in the state’s growing regions will help to offset population losses or stagnant growth in other parts of the state. Broader structural change in the retail sector will continue to weigh on potential job gains over the long term as brick-and-mortar establishments face intense competition from web-based retailers such as Amazon.
Wholesale trade will likely grow moderately during the outlook period, but transportation and warehousing sectors is expected to see payrolls expand more than 1 percent annually over the next five years. Continued development along major transportation corridors, such as i-81 in the Eastern Panhandle and i-79/i-68 in North-Central West Virginia. Furthermore, transporta-tion companies that provide services to natural gas rigs and well sites will benefit from the anticipated growth in drilling activity that should help to offset a structurally lower level of river barge and rail shipments of coal.
Public sector employment is projected to post a mini-mal increase during the forecast horizon as the budget issues that have been facing the state government will improve slightly, but not to a significant enough degree to foster significantly stronger hiring activity. Also, many local governments will continue to cope with shrinking tax bases and structurally-lower coal sever-ance tax collections.
UNEMPLOYMENT After averaging 6.0 percent in 2016, West Virginia’s unemployment rate is forecast to average around 4.7 percent for all of calendar year 2017. Assuming no dramatic revisions in the underly-ing labor force data, the state’s jobless rate will likely continue to linger around its current mid- to upper-4 percent range through late-2018 as job growth in cer-tain regions of the state incentivize some people to re-
FIGURE 2.16: Unemployment Rate Forecast
3.54.04.55.05.56.06.57.07.58.08.59.09.5
10.0
US
% of Labor Force
West Virginia
Sources: Bureau of Labor Statistics; WVU BBER Econometric Model; iHS Markit Note: Shaded region represents the forecast period

| 21
enter the labor force. Longer term, the forecast calls for the unemployment rate to remain in the low- to mid-4 percent range through 2022.
INCOME Following a 0.4 percent decline in 2016, inflation-adjusted personal income is expected to bounce back by 0.8 percent in 2017. For the remain-der of the outlook period, real personal income terms should will rise at an average annual pace of 1.7 per-cent. in terms of the major underlying components of personal income, investment income (dividends, inter-est and rent) is expected to pace all categories thanks to higher natural gas prices and production boosting royalty payments to households holding mineral rights in shale gas counties, as well as higher interest rates lifting the amount of interest individuals accrue in sav-ings, money market and CD accounts.
Transfer payments will increase going forward as the state’s age structure continues to shift toward older age groups and below-average income levels in a few regions keep upward pressure on Medicaid and other social welfare spending. Residence adjustment is also expected to record growth of 4.7 percent annu-ally as several of the state’s border counties benefit from the comparatively stronger economies in neigh-boring Maryland, Virginia, Pennsylvania and Ohio. By comparison, real wages and salaries saw its largest year-to-year decline in decades at roughly 2.0 percent during 2016, due primarily to large losses of high-wage jobs in the state’s energy sector. The forecast does call for total real wages and salaries to recover, but gains will average just below 1.6 percent per year through 2022, trailing growth in total real personal income.
Our forecast calls for real per capita income in West Virginia to rise at an annual average rate of nearly 1.8 percent, lagging the national average rate of roughly 2.1 percent per year. Consequently, the state’s slightly slower pace of income growth will cause the state’s per capita income level relative to the national average to fall to 74 percent by the end of the outlook period—roughly equal to where it was prior to the Great Recession.
GDP Total real GDP for West Virginia is expected to rise at an average annual rate of 1.0 percent through 2022. The oil and gas industry will likely pace broader output growth by a large margin, with an expected gain of 6.8 percent per year during the forecast horizon. Real GDP for the state’s coal industry will be moderately higher in 2022 relative to 2017, this above-average performance is driven in large part by improved profit-ability due to recent financial re-organization efforts by many of industry’s major operators and relatively stable production levels. Construction, manufacturing, private services and the public sector are projected to realize more moderate rates of growth going forward.
FIGURE 2.17: Forecast Growth by Major Source of Real Personal Income, 2017-2022
0.0% 0.2% 0.4% 0.6% 0.8% 1.0% 1.2% 1.4% 1.6% 1.8% 2.0% 2.2%
Proprietor's Income
Pensions
Wages & Salaries
Personal Income
Transfer Payments
Investment Income
Average Annual Growth, %
Source: WVU BBER Econometric Model
FIGURE 2.18: Share of Personal Income by Component
Wages & Salaries
42%
Transfer Payments
23%
Investment Income
14%
Other Labor Income
12%
Proprietor's Income
7%
Residence Adjustment, 2%
Wages & Salaries
40%
Transfer Payments
26%
Investment Income
14%
Other Labor Income
10%
Proprietor's Income
6%
Residence Adjustment, 4%
2002 2022
Sources: Bureau of Economic Analysis; WVU BBER Econometric Model
FIGURE 2.19: West Virginia Per Capita Personal Income Relative to US Average
73%
74%
75%
76%
77%
78%
79%
80%
81% Percent
Source: Bureau of Economic Analysis; WVU BBER Econometric Model; iHS Markit Note: Shaded region represents the forecast period
The West Virginia Economy

22 | WEST ViRGiNiA ECONOMiC OUTLOOK 2018-2022
POPULATION Due to what is expected to be an improvement in its relative economic performance, the fast rates of population declines seen in recent years will likely come to end during the outlook period. Deaths will continue to exceed births in the majority of counties in West Virginia, with the margin growing wider for many, over the next five years. At the same time, counties that struggled with steep losses in employment and income should see these conditions stabilize and post positive economic gains during the outlook period, which should at least slow the tide in net-outflows from migration. At the same time, the state’s primary economic growth centers in the Eastern Panhandle and North Central regions will continue to receive a net gain of migrants from within the state, the nation, and from overseas. Overall, total population for the state as a whole will contract only slightly, with most of the losses occurring in the next two years or so.
AGE DISTRIBUTION The state’s population will continue to become increasingly concentrated in the 65-and-older age group as current residents in the latter years of the 45 to 64 cohort transition reach 65 years of age and older individuals living in other states return to live closer to their remaining family ties in West Virginia. Over the longer term, this process will eventually lead to nearly one in four residents to be at least 65 years of age. Better economic conditions over the next few years should help West Virginia register a very modest gain in the size of its population aged 18 to 44, which should slightly offset the large declines in the size of the state’s workforce over much of the past decade. WEST VIRGINIA’S EXPORTSGiven the state’s large share of output concentrated in globally-traded goods and commodities, export markets have long played a role in influencing West Vir-ginia’s economy. However, they have accounted for a growing share of the state’s economic output over the past decade or so and also served to buoy the state’s economy during the Great Recession. Export activity has deteriorated markedly in the past few years, fall-ing 58 percent between the peak in 2012 and 2016. Even with this decline, the dollar value of exports still equates to roughly 7 percent of state economic output in 2016 and is still 32 percent above 2006 levels after adjusting for inflation.
Global demand for coal and a few other items pro-duced in West Virginia have increased rapidly, boosting the value of exports shipped from the state over the past few quarters. indeed, West Virginia businesses exported roughly $3.7 billion in items to trading part-ners during the first half of 2017, a 54 percent jump compared to the first six months in 2016 and the high-est level since 2014.
FIGURE 2.20: GDP Forecast by Sector
25
35
45
55
65
75
85Oil & Gas CoalConstruction & Manufacturing GovernmentPrivate Service-Providing
Billions of 2016$
Source: Bureau of Economic Analysis; WVU BBER Econometric Model
FIGURE 2.21: West Virginia Population Growth by Age Group
-2.0%
-1.5%
-1.0%
-0.5%
0.0%
0.5%
1.0%
1.5%
2.0%
2.5%
0 to 17 yrs 18 to 44 yrs 45 to 64 yrs 65 and older Total
2006-20162017-2022
Average annual growth, %
Sources: US Census Bureau; WVU BBER Econometric Model
FIGURE 2.22: West Virginia Exports
3.0 3.0 2.9 3.14.1 3.8 3.8
4.6
6.35.4
7.1
9.8
12.1
9.1
7.8
5.95.0
6.9
0
2
4
6
8
10
12
14 Billions of 2016 $
Source: international Trade Administration Note: Data for 2017 is an annualized estimate based on Q1 and Q2.
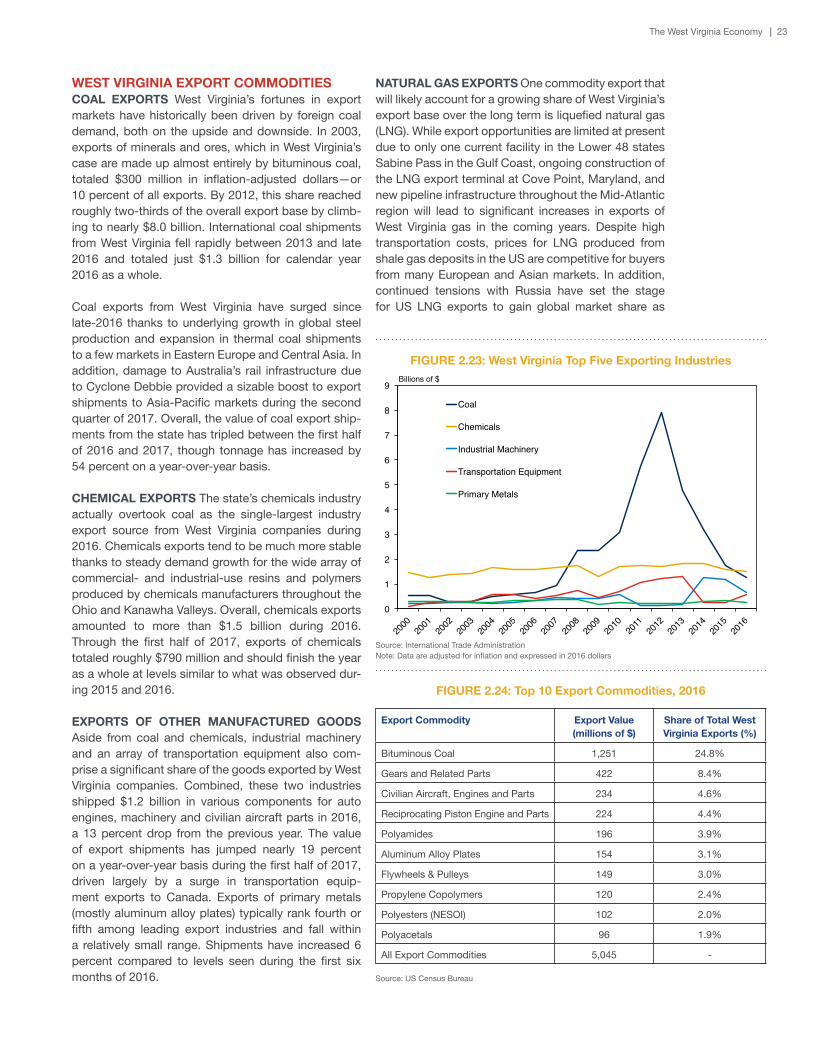
| 23
FIGURE 2.23: West Virginia Top Five Exporting Industries
0
1
2
3
4
5
6
7
8
9
Coal
Chemicals
Industrial Machinery
Transportation Equipment
Primary Metals
Billions of $
Source: international Trade Administration Note: Data are adjusted for inflation and expressed in 2016 dollars
FIGURE 2.24: Top 10 Export Commodities, 2016
Export Commodity Export Value (millions of $)
Share of Total West Virginia Exports (%)
Bituminous Coal 1,251 24.8%
Gears and Related Parts 422 8.4%
Civilian Aircraft, Engines and Parts 234 4.6%
Reciprocating Piston Engine and Parts 224 4.4%
Polyamides 196 3.9%
Aluminum Alloy Plates 154 3.1%
Flywheels & Pulleys 149 3.0%
Propylene Copolymers 120 2.4%
Polyesters (NESOi) 102 2.0%
Polyacetals 96 1.9%
All Export Commodities 5,045 -
Source: US Census Bureau
WEST VIRGINIA EXPORT COMMODITIESCOAL EXPORTS West Virginia’s fortunes in export markets have historically been driven by foreign coal demand, both on the upside and downside. in 2003, exports of minerals and ores, which in West Virginia’s case are made up almost entirely by bituminous coal, totaled $300 million in inflation-adjusted dollars—or 10 percent of all exports. By 2012, this share reached roughly two-thirds of the overall export base by climb-ing to nearly $8.0 billion. international coal shipments from West Virginia fell rapidly between 2013 and late 2016 and totaled just $1.3 billion for calendar year 2016 as a whole.
Coal exports from West Virginia have surged since late-2016 thanks to underlying growth in global steel production and expansion in thermal coal shipments to a few markets in Eastern Europe and Central Asia. in addition, damage to Australia’s rail infrastructure due to Cyclone Debbie provided a sizable boost to export shipments to Asia-Pacific markets during the second quarter of 2017. Overall, the value of coal export ship-ments from the state has tripled between the first half of 2016 and 2017, though tonnage has increased by 54 percent on a year-over-year basis.
CHEMICAL EXPORTS The state’s chemicals industry actually overtook coal as the single-largest industry export source from West Virginia companies during 2016. Chemicals exports tend to be much more stable thanks to steady demand growth for the wide array of commercial- and industrial-use resins and polymers produced by chemicals manufacturers throughout the Ohio and Kanawha Valleys. Overall, chemicals exports amounted to more than $1.5 billion during 2016. Through the first half of 2017, exports of chemicals totaled roughly $790 million and should finish the year as a whole at levels similar to what was observed dur-ing 2015 and 2016.
EXPORTS OF OTHER MANUFACTURED GOODS Aside from coal and chemicals, industrial machinery and an array of transportation equipment also com-prise a significant share of the goods exported by West Virginia companies. Combined, these two industries shipped $1.2 billion in various components for auto engines, machinery and civilian aircraft parts in 2016, a 13 percent drop from the previous year. The value of export shipments has jumped nearly 19 percent on a year-over-year basis during the first half of 2017, driven largely by a surge in transportation equip-ment exports to Canada. Exports of primary metals (mostly aluminum alloy plates) typically rank fourth or fifth among leading export industries and fall within a relatively small range. Shipments have increased 6 percent compared to levels seen during the first six months of 2016.
NATURAL GAS EXPORTS One commodity export that will likely account for a growing share of West Virginia’s export base over the long term is liquefied natural gas (LNG). While export opportunities are limited at present due to only one current facility in the Lower 48 states Sabine Pass in the Gulf Coast, ongoing construction of the LNG export terminal at Cove Point, Maryland, and new pipeline infrastructure throughout the Mid-Atlantic region will lead to significant increases in exports of West Virginia gas in the coming years. Despite high transportation costs, prices for LNG produced from shale gas deposits in the US are competitive for buyers from many European and Asian markets. in addition, continued tensions with Russia have set the stage for US LNG exports to gain global market share as
The West Virginia Economy

24 | WEST ViRGiNiA ECONOMiC OUTLOOK 2018-2022
Europe looks to diversify its natural gas supplier base. Expanded midstream and downstream natural gas infrastructure in the Mid-Atlantic region, vis-à-vis pro-posed ethane crackers in Ohio and Pennsylvania, will also provide additional opportunities for export growth as these facilities will only enhance the development prospects of gas resources throughout the Appala-chian Basin.
WHERE DO WEST VIRGINIA EXPORTS GO?Exports connect West Virginia’s economy to countries around the world. West Virginia businesses exported to 148 countries during 2016, with most of the state’s exports going to familiar destination countries in North America, Europe, and Asia. Canada was easily the largest destination market for goods and commodi-
ties produced in the state, as our northern neighbor received more than $1.5 billion in exports, or 30 per-cent of all West Virginia exports. Through the first half of 2017, Canada has received $887 million in exports from the state, a 14 percent jump from the same period a year ago.
China rose up to the state’s second-largest destination market in 2014, though it has slipped to third during the first half of 2017 as the dollar value of export shipments to India has increased more than five-fold compared to a year ago. The Netherlands ranks as the third leading export destination country, though it serves as a transit point to other Northern European countries rather than an end market for goods exported from West Virginia. Despite the weakening of exports from the state over the past several years, international demand for com-modities and manufactured goods produced in West Virginia will play a major role in supporting the state’s economy going forward.
We anticipate export demand for coal will decelerate over the remainder of 2017, but will likely stabilize at levels more consistent with what was observed on average between 2014 and 2015. The longer-term export demand picture for coal is more mixed as many countries in Europe phase out coal use in the utility sector and developing countries such as China and india, though requiring massive amounts of coal to produce steel and generate electricity, are expected to shift their energy consumption portfolios into other fuel sources. Other commodities and manufactured goods produced in the state have generally positive outlooks due in large part to demand from countries such as China and india, but in the case of LNG from a growing number of markets over time.
FIGURE 2.25: Top Destination Countries for West Virginia Exports
Exports Destination Country
Export Value (millions of $)
Percent Change 2013-2016
Canada $1,536 - 17%
China $465 - 26%
Belgium $288 1%
Brazil $264 - 49%
Netherlands $252 - 65%
South Korea $250 15%
Japan $244 - 26%
india $220 - 30%
Mexico $179 - 45%
Germany $166 - 43%
Source: US international Trade Administration
Economic Impact Analysis / Economic Forecasting / Public Policy / Health EconomicsEnergy Economics / Regional Economic Development / Education Policy
The BBER works with private and public agencies to provide expert analysis. Contact John Deskins at 304-293-7876. Visit bber.wvu.edu for publications and other resources.
BUREAU OF BUSINESS AND ECONOMIC RESEARCH
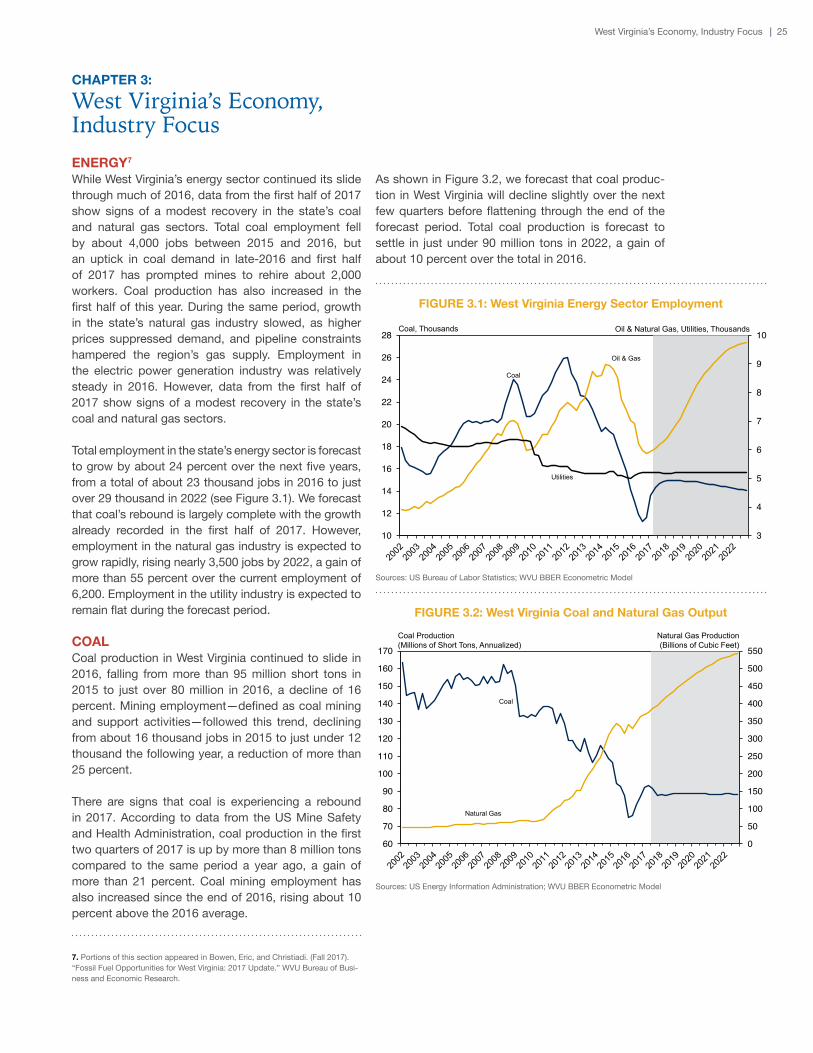
| 25
CHAPTER 3:
West Virginia’s Economy, Industry FocusENERGY7
While West Virginia’s energy sector continued its slide through much of 2016, data from the first half of 2017 show signs of a modest recovery in the state’s coal and natural gas sectors. Total coal employment fell by about 4,000 jobs between 2015 and 2016, but an uptick in coal demand in late-2016 and first half of 2017 has prompted mines to rehire about 2,000 workers. Coal production has also increased in the first half of this year. During the same period, growth in the state’s natural gas industry slowed, as higher prices suppressed demand, and pipeline constraints hampered the region’s gas supply. Employment in the electric power generation industry was relatively steady in 2016. However, data from the first half of 2017 show signs of a modest recovery in the state’s coal and natural gas sectors.
Total employment in the state’s energy sector is forecast to grow by about 24 percent over the next five years, from a total of about 23 thousand jobs in 2016 to just over 29 thousand in 2022 (see Figure 3.1). We forecast that coal’s rebound is largely complete with the growth already recorded in the first half of 2017. However, employment in the natural gas industry is expected to grow rapidly, rising nearly 3,500 jobs by 2022, a gain of more than 55 percent over the current employment of 6,200. Employment in the utility industry is expected to remain flat during the forecast period.
COALCoal production in West Virginia continued to slide in 2016, falling from more than 95 million short tons in 2015 to just over 80 million in 2016, a decline of 16 percent. Mining employment—defined as coal mining and support activities—followed this trend, declining from about 16 thousand jobs in 2015 to just under 12 thousand the following year, a reduction of more than 25 percent.
There are signs that coal is experiencing a rebound in 2017. According to data from the US Mine Safety and Health Administration, coal production in the first two quarters of 2017 is up by more than 8 million tons compared to the same period a year ago, a gain of more than 21 percent. Coal mining employment has also increased since the end of 2016, rising about 10 percent above the 2016 average.
As shown in Figure 3.2, we forecast that coal produc-tion in West Virginia will decline slightly over the next few quarters before flattening through the end of the forecast period. Total coal production is forecast to settle in just under 90 million tons in 2022, a gain of about 10 percent over the total in 2016.
FIGURE 3.1: West Virginia Energy Sector Employment
3
4
5
6
7
8
9
10
10
12
14
16
18
20
22
24
26
28
Utilities
Coal
Coal, Thousands
Oil & Gas
Oil & Natural Gas, Utilities, Thousands
Sources: US Bureau of Labor Statistics; WVU BBER Econometric Model
FIGURE 3.2: West Virginia Coal and Natural Gas Output
0
50
100
150
200
250
300
350
400
450
500
550
60
70
80
90
100
110
120
130
140
150
160
170
Coal
Natural Gas
Coal Production (Millions of Short Tons, Annualized)
Natural Gas Production (Billions of Cubic Feet)
Sources: US Energy information Administration; WVU BBER Econometric Model
West Virginia’s Economy, industry Focus
7. Portions of this section appeared in Bowen, Eric, and Christiadi. (Fall 2017). “Fossil Fuel Opportunities for West Virginia: 2017 Update.” WVU Bureau of Busi-ness and Economic Research.

26 | WEST ViRGiNiA ECONOMiC OUTLOOK 2018-2022
The impact of the coal decline continues to be felt more acutely in Central Appalachia, which covers the southern portion of West Virginia. As shown in Figure 3.3, coal production in the southern coalfields fell below that in northern West Virginia in mid-2015 and has recovered only slightly. in 2016 the state’s northern counties surpassed the southern counties by nearly 11 million tons. However, the 2017 production rebound has benefitted the southern region more than mines in the northern-producing region. For the first half of 2017, year-over-year production rose almost 27 per-cent in southern West Virginia, compared with a gain of less than 17 percent in the northern counties.
FIGURE 3.3: West Virginia Regional Coal Production
20
30
40
50
60
70
80
90
100
110
120
130
Northern WV
Millions of short tons, annualized
Southern WV
Source: US Energy information Administration
FIGURE 3.4: Average Coal Mining Productivity
0
1
2
3
4
5
6
7
8Short Tons per Worker Hour
Northern WV
Southern WV
US
Source: US Mine Safety and Health Administration Data through first quarter 2017
Much of the decline in the state’s southern coal region can be explained by falling productivity at the region’s mines in conjunction with a national drop in demand. The drop in productivity is explained, in part, due to depletion of the region’s easy-to-access coal seams after decades of mining. While southern coal is gen-erally a hotter burning, higher-quality coal, the most easily accessible seams have become depleted, leav-ing the more difficult-to-reach, thinner seams as the only coal available to be mined. Declining productivity has likely raised the cost of coal in the southern region relative to coal produced in other parts of the country, putting southern West Virginia coal at a price disad-vantage during a period of declining national demand.
As depicted in Figure 3.4, worker productivity, mea-sured as short tons per worker hour, was nearly identical in the northern and southern regions of West Virginia in 2001. However, by 2016, worker productivity in the southern mines had fallen roughly in half to 2.2 tons per worker hour. Over the same period, worker productivity in the state’s northern mines declined through 2012, but rose again to end at approximately the same level in 2016. While higher overall than in West Virginia alone, US productivity mirrored the pat-tern seen in northern West Virginia during this period, falling through 2012, then rising again into 2016.
One factor that supported West Virginia’s coal industry during and immediately after the Great Recession was export markets for the state’s coal. As shown in Figure 3.5, the value of West Virginia’s exports of minerals and ores rose by more than 255 percent between 2008 and its peak in 2012, rising from about $2.1 billion to nearly $7.5 billion. Exports rose due to a combination of favorable conditions in world markets—rapid eco-nomic growth in China and india and supply disrup-tions in Australia, the traditional supplier of Asian mar-kets—that led to greater demand for West Virginia coal internationally. However, once these factors subsided, international demand for coal fell sharply. Exports fell to a little under $1.3 billion in 2016, well below the level of exports in 2008.8
However, an increase in exports has been a major driver of recent coal production gains. Exports began to pick up in the fourth quarter of 2016 and continued to rise in the first quarter of 2017. Year-over-year US coal exports rose by more than 8 million tons from first quarter 2016 to the first quarter of 2017, a gain of nearly 58 percent. Exports rose the most to European and Asian countries, particularly to South Korea, which
8. For a more detailed explanation of the effect of international demand for West Virginia coal, see Lego, Brian and John Deskins. “Coal Production in West Virginia: 2016-2036.” WVU Bureau of Business and Economic Research. http://busecon.wvu.edu/bber/pdfs/BBER-2016-03.pdf

| 27
imported an additional 1 million tons, a rise of more than 90 percent from the previous year. Exports rose primarily for thermal coal, which was up by more than 6 million tons between first quarter 2016 and the first quarter of 2017, a rise of more than 150 percent.
NATURAL GASREGIONAL PRODUCTION TRENDS Natural gas production growth in West Virginia slowed consider-ably in 2016 from the blistering pace of the previous five years. The slowdown in the state’s natural gas industry contributed to the energy sector’s difficul-ties in 2016. As shown in Figure 3.2, gas production grew by about 56 million cubic feet in 2016, a growth rate of 4 percent, which is substantially smaller than the 24-percent growth rate of the previous year. The slower production growth was due in part to falling natural gas prices making additional drilling less profit-able. Financial reports by drilling companies indicated they have been awaiting the installation of additional pipeline capacity to ease constraints on selling gas to markets in the Northeast US that are aggressively add-ing natural gas-fired generation capacity.
West Virginia’s natural gas slowdown is a marked contrast to Pennsylvania and Ohio, neighboring states that also overlie the Marcellus and Utica shale forma-tions. As shown in Figure 3.6, Ohio production rose to 1.5 trillion cubic feet (Tcf) in 2016, a nearly 45 percent increase from 2015 levels, making it a larger producer of natural gas than West Virginia. Pennsylvania, already the second-largest natural gas producer in the country, also saw large production gains in 2016, as production rose to nearly 5.3 Tcf, a gain of more than 9 percent from 2015 levels.
COUNTY PRODUCTION West Virginia’s Northern Pan-handle and North-Central regions again led the state in gas production in 2016, as shown in Figure 3.7. The state’s top six producing counties—Doddridge, Wet-zel, Marshall, Ritchie, Harrison, and Tyler—accounted for nearly 80 percent of the state’s total gas production in 2016. This is a marked contrast to a decade ago, when the top four producers—Wyoming, McDowell, Kanawha, and Lewis counties—were primarily in the southern part of the state.
PRICES AND PIPELINE CAPACITY in addition to developing downstream capacity (such as ethane crackers) or the addition of a regional storage hub, growth in West Virginia’s natural gas industry will also be greatly affected by increases in the midstream—namely the ability to get gas to excess demand mar-kets outside the region via pipelines. West Virginia added more than 1,100 Bcf per day of outgoing pipeline capacity between 2011 and 2015, a gain of 12 percent. Additional major pipeline projects that
FIGURE 3.5: Energy Commodity Exports from West Virginia
0
10
20
30
40
50
60
0
1
2
3
4
5
6
7
8
Milli
ons
Coal, Billions of $ Natural Gas, Millions of $
Coal
Natural Gas
Source: US international Trade Administration
FIGURE 3.6: Natural Gas Production In Marcellus/Utica States
0.0
0.5
1.0
1.5
2.0
2.5Trillions of cubic feet
West Virginia
Pennsylvania
Ohio
Source: US Energy information Administration Note: 2017Q2 Estimated from partial data.
FIGURE 3.7: Natural Gas Production by County
2016 Natural Gas Production (Btf)0.1 – 5.0
5.1 – 15.0
15.1 – 334.5
No Natural Gas Production
Source: WV Department of Environmental Protection
West Virginia’s Economy, industry Focus

28 | WEST ViRGiNiA ECONOMiC OUTLOOK 2018-2022
originate or pass through West Virginia—such as the Atlantic Coast Pipeline and the Mountaineer XPress—are expected to add 18,650 Bcf per day capacity in the region over the next two years, more than doubling total capacity.
The additional pipeline capacity may help local pro-ducers narrow the spread between the national Henry Hub natural gas price and prices paid at regional trad-ing hubs. indeed, prices paid to producers at the Ten-nessee Zone 4 hub, which serves the Marcellus region, have already narrowed considerably. As depicted in Figure 3.8, local producers received about $2 less per thousand cubic foot (Mcf) of gas than was paid at the national hub in 2013 and 2014. But the difference between the local and Henry Hub price has closed to around $1 per Mcf in recent quarters.
As shown in Figure 3.2, we forecast natural gas pro-duction will continue its upward trajectory. Natural gas production is forecast to reach nearly 2.2 Tcf by 2022, a gain of more than 56 percent over 2016 level of around 1.4 Tcf.
UTILITIESAfter coming off significant capacity retirements in 2015, West Virginia’s electric power industry saw small employment gains in 2016. Employment in the electric power generation industry increased by about 150 jobs in 2016, a gain of 4 percent over 2015. However, the long-term outlook for many of the state’s coal-fired power plants remains challenging. Coal continued to lose market share to natural gas in 2016, falling to about 30 percent of total US generation (see Figure 3.9). At 34 percent, natural gas-fired generation consti-tuted the largest share of the US power market in 2016, the first time that has been the case over an entire year.
SHIFTS IN GENERATION CAPACITY To a large degree, the decline of the state’s coal-fired power gen-eration fleet is due to national trends that have affected coal-fired power throughout the United States. A key factor in coal’s decline has been the availability of cheap natural gas brought on by the boom in produc-tion of shale gas, a competing fuel to coal in power generation. The rise of natural gas as a fuel for power generation has been largely due to a significant decline in natural gas prices over the last decade. With the advent of horizontal drilling and hydraulic fracturing techniques, the supply of natural gas has risen, caus-ing prices to fall. As shown in Figure 3.10, natural gas prices have fallen significantly relative to coal prices for the same level of heat output, measured in British ther-mal units (Btu). As recently as 2005, natural gas was more than five times as expensive as coal on a per Btu basis. That ratio has fallen between an average annual range of just below 1.5 to 2.0 between 2012 and 2016.
FIGURE 3.8: Marcellus and Henry Hub Natural Gas Spot Price Spread
-0.5
0.0
0.5
1.0
1.5
2.0
2.5
3.0Dollars per Mcf
Source: Bloomberg
FIGURE 3.9: Share of US Electric Power Generation by Fuel Type
0%
10%
20%
30%
40%
50%
60%% of total generation
Natural Gas
Coal
Source: US Energy information Administration
FIGURE 3.10: Coal and Natural Gas Fuel Price Ratio Paid by Utilities
1.0
1.5
2.0
2.5
3.0
3.5
4.0
4.5
5.0
5.5
6.0Ratio, $ per Btu
Source: US Energy information Administration 2017 ratio based on first quarter data

| 29
The decline in demand for coal-fired generation has led to reduced utilization of the nation’s coal plants. The average capacity factor for US coal plants was 0.68 in 2008, meaning that coal plants operated at 68 percent of their potential capacity in that year. By 2016, the average capacity factor was 0.48, indicat-ing plants are operating at less than half capacity. The average capacity factor for West Virginia coal plants was 0.67 in 2008, but fell to 0.52 in 2015, a decline of 15 percentage points.
Declining generation and capacity factors, combined with regulatory changes described below, have led many utilities to conclude that operating coal plants is not profitable enough to maintain the plant. For exam-ple, in 2015 American Electric Power shut down three West Virginia power plants—Kammer in Moundsville, Kanawha River9 in Glasgow, and Philip Sporn in New Haven. These three plants totaled more than 1,800 megawatts of capacity, which constituted about 10 percent of the state’s capacity at the time.
The loss of West Virginia’s coal-fired electric capacity is expected to be partially offset by a handful of new natural gas-fired power plants have been announced in the state. Quantum Utility Generation, operating under the name Moundsville Power, plans to open a new natural gas combined cycle plant in Moundsville with a net summer capacity of 580 MW. The plant opening is currently planned for 2019. Another company, Energy Solutions Constortium, has also begun permitting for two other natural gas plants. A Harrison County plant slated to open in 2020 is expected to have a net sum-mer capacity of 525 MW, and another plant in Brooke County with a net summer capacity of 766 MW is expected to open in 2021. if these natural gas plants move forward as expected, they would replace more than three-quarters of the coal-fired capacity retired in the state since 2012.
FEDERAL REGULATORY POLICY IMPLICATIONS During the Obama administration, the US Environ-mental Protection Agency (EPA) issued a number of environmental rules that had significant implications for utilities in West Virginia. Many of the rules were challenged in the courts, and the Trump administration has said it plans to eliminate some of the existing rules that were issued during the previous administration. in this section, we discuss two of the rules that have had, or have the potential to have, the greatest impact on the sector: The Mercury and Air Toxics Standards (MATS) and the Clean Power Plan.
In 2011, The US EPA finalized its Mercury and Air Tox-ics Standards (MATS). This rule was designed to limit emissions of mercury from all of the nation’s power plants, but the rule primarily affected coal-fired power
plants, as coal is the primary fuel with mercury con-tent. The original compliance deadline for MATS was April 2015 with the potential for extension into 2016. However, the rule was challenged in the courts and the Supreme Court ruled that the EPA failed to properly consider the full employment cost of plant closures, as required by the Clean Air Act. The Court allowed implementation of the rule to move forward, and in March 2016, the Supreme Court again ruled that the EPA could continue implementation despite ongoing court challenges. in April 2017, the Trump administra-tion asked that the rule be suspended pending review, and the Washington DC Court of Appeals agreed.
Since the MATS rule has already been implemented, however, many power plants have shut down or built the necessary scrubbers to reduce mercury. The scrubbing technology required significant capital investment, particularly for older plants. it is unclear whether any of these plants would reopen should the Trump administration eliminate the rule. As of June 2017, no further plant retirements are planned by utili-ties in West Virginia.
The EPA finalized two rules in August of 2015 as part of the Obama Administration’s Clean Power Plan, with the goal of reducing carbon in order to limit the effects of climate change. The Clean Power Plan sets limits on carbon emissions from the nation’s existing power plants, requiring a 32 percent reduction in carbon emissions by 2030. Because coal produces about 68 percent of the carbon emissions in the power genera-tion sector,10 this rule will have a larger impact on coal-fired power plants than those using other fuel sources. Each state has its own emissions requirement, with West Virginia required to reduce carbon intensity of its power plants by between 29 and 36 percent, depend-ing on the compliance strategy the state chooses. In the same year, the EPA also released a final rule to regulate carbon emissions in new power plants. This rule was first proposed in 2012, but was substantially revised after the rule’s comment period and was released at the same time as the Clean Power Plan rules. The new source carbon rules apply only to newly constructed power plants, and limit carbon emissions at the nation’s coal plants to 1,400 pounds of CO2 per megawatt hour of generation. For coal-fired power plants, this emissions level would be difficult to achieve except with carbon capture and storage technologies, thus making it unlikely that new coal-fired generating plants will be built in the near term.
West Virginia’s Economy, industry Focus
9. Kanawha River is scheduled for official retirement in December 2017.
10. Natural gas contributes about 30 percent of carbon emissions, with small amounts from petroleum and fossil-based waste fuels.

30 | WEST ViRGiNiA ECONOMiC OUTLOOK 2018-2022
in February 2016, the US Supreme Court issued a stay on implementation of the EPA Clean Power Plan (CPP) regulations, which remains in effect as of September 2017. West Virginia, along with several other states, has also sued to stop implementation of the EPA New Source Performance Standards. The Trump admin-istration has announced plans to review the Clean Power Plan regulations with the intention of repealing some or all of the limits on carbon emissions.
MANUFACTURING IN WEST VIRGINIAThe manufacturing sector has seen its share of the total economic footprint shrink over the past few decades, both within West Virginia and the nation as a whole, but manufacturing activity continues to play an important role in shaping the state’s economic fortunes. Overall, the manufacturing sector accounts for 7 percent of all jobs and roughly 10 percent of total economic output in
the state, but several regions within West Virginia retain a sizable dependence on manufacturing activity as a handful of industries retain their historical relevance.
CHEMICALS The chemicals industry accounts for one-fifth of the manufacturing sector’s jobs and nearly 40 percent of its total output. Most of the state’s chemical manufacturers lie along the Kanawha and Ohio River valleys and produce a range of organic and inorganic compounds used in industrial applications, but also manufacture composite materials such as resins and synthetic fibers. In addition to these compa-nies, Monongalia County contains large manufacturing and research operations for generic drug producer Mylan Pharmaceuticals. Aside from jobs and output, the chemicals industry heavily factors into the state’s global economic reach, representing the state’s larg-est-exporting industry, based on market value, during calendar year 2016 at total of more than $1.5 billion.
OTHER MANUFACTURED PRODUCTS Other than the chemicals industry, other key segments of the state’s manufacturing sector include wood products, fabricated metals, transportation equipment (auto parts as well as defense and non-defense aero-space) and primary metals, i.e. steel and aluminum. Combined, these industries accounted for more than three-fourths of the sector’s output and two-thirds of all manufacturing jobs found in the state during 2016.
Most of the state’s manufacturers are highly sensitive to the broader US business cycle or tightly linked to domestic or global changes in underlying conditions for specific industries (such as coal, housing, etc). As a result, the state’s manufacturing base has experienced a significant amount of volatility over the past decade and many parts of the sector have moved in sizably different directions. West Virginia’s wood products and furniture industry was easily the hardest hit seg-ment during the Great Recession, with employment and output at the state’s sawmills, furniture, flooring, and other building materials manufacturers falling by roughly 50 percent after the US housing market bust. Conditions have improved measurably thanks to a national recovery in single- and multifamily housing starts, lifting overall output 60 percent from its cyclical low point in mid-2009. The industry is also far more productive than it was prior to the recession, generat-ing approximately 15 percent more inflation-adjusted output on a per-worker basis in 2016 compared to 2007. While this has helped to lift wage rates roughly 5 percent since 2012 after adjusting for inflation, it also reveals job gains for the industry have been less robust at cumulative increase of 8 percent since 2012.
The downturn was less severe for the state’s chemicals manufacturers as aggregate industry output declined
FIGURE 3.11: Share of Total Manufacturing Employment (2016)
Chemicals20%
Wood Products & Furniture
15%
Fabricated Metals10%Primary
Metals10%
Food & Beverage
8%
Plastics & Rubber7%
Automotive Parts7%
Nonmetallic Minerals
6%
Other Nondurables
6%
Other Durables6%
Aerospace Equipment
5%
Source: US Bureau of Labor Statistics
FIGURE 3.12: West Virginia Manufacturing Employment by Industry
5
10
15
20
25
30
35
40
45Primary metalsFabricated metalsWood products & furnitureChemicals
Thousands
Source: US Bureau of Labor Statistics

| 31West Virginia’s Economy, industry Focus
less than 15 percent and employment levels fell by 7 percent. With that said, chemicals industry payrolls in West Virginia, and for the US in general, have mostly been on a downward trend for decades due to a com-bination of increased technological innovation and greater competition from lower-cost producers over-seas. Rapid growth in shale gas production across the Marcellus and Utica Shale plays has served to arrest a degree of the chemicals industry’s secular declines of the past couple of decades by pushing production costs lower. Nonetheless, chemicals industry employ-ment in West Virginia declined 2.6 percent during 2016.
At the national level, the fabricated metals subsector tends to track overall manufacturing activity. Within West Virginia, however, a significant percentage of the subsector serves in a supporting role to the state’s coal operators as companies manufacture turned product and screws/nuts and bolts that are designed for under-ground mining operations or serve as machine shops for mining equipment. Not surprisingly, the subsector has declined in terms of its share of overall manufac-turing output as southern West Virginia coal production has diminished over the years, but conditions have been particularly weak for fabricated metals manufac-turers since 2012. indeed, output and employment for the subsector have contracted by 13 and 29 percent, respectively, on a cumulative basis since 2012.
TRANSPORTATION EQUIPMENT The state’s trans-portation equipment subsector, which is made up of auto parts equipment manufacturing as well as civilian and defense aerospace manufacturers, shed nearly 1,000 workers over an extended time frame that spanned from prior to the recession’s onset through the earliest stages of the US economic recovery. Con-ditions appear to have stabilized to some extent for the state’s aerospace industry, but federal budget issues continue to cloud the picture for the defense portion and new civilian aircraft orders have been sluggish for the past couple of years. By contrast, auto parts manufacturing has approximately doubled in size since its cyclical low point in mid-2010. Expansions at Toyota, NGK Spark Plugs and European auto parts manufacturing and supply chain companies (Sogefi and Gestamp) have accounted for most of the new activity in recent years. Manufacturing Sector OutlookWhen compared to the past 10 years, the forecast calls for West Virginia’s manufacturing sector as a whole to face appreciably better conditions for the next five years. Overall, manufacturing employment is expected to rise at a pace of nearly 0.9 percent per year. The machinery subsector will post the fastest rate of growth going forward, due in large part to a rebound in domestic orders from energy companies and stron-
ger export activity thanks to depreciating dollar and increased demand.
The chemicals subsector will make the largest positive contribution to manufacturing sector growth over the next five years. Continued growth in natural gas explo-ration and development will provide stimulus, particu-larly as downstream development efforts come closer to reality with the Shell ethane cracker facility Pennsyl-vania, and possibly the PTT Global plant in Ohio, both of which will be within a relatively short distance of the West Virginia border. in addition, Mylan’s presence will remain a source of stability for the sector, although some downside risk is possible due to continued con-cerns over drug pricing. The largest contributor to the subsector’s growth going forward will be the opening of two new facilities in the Eastern Panhandle, chiefly the $500 million P&G facility that is slated to com-mence operations later this year and expand produc-tion around 2019 and 2021 as more product lines are added. insulation manufacturer ROXUL is projected to begin production at a new facility in Jefferson County by early-2020. These two projects are expected to yield a gross increase of nearly 900 jobs by the lat-ter portion of the outlook period and could eventually result in larger gains as each facility’s regional supply chains develop over time.
Wood products and furniture is expected to enjoy a solid rate of growth, though most of the subsector’s anticipated gains will likely be concentrated in the early portion of the outlook period. The US housing market recovery remains firmly in place as underlying demand remains healthy and supplies remain tight relative to historical standards due to the protracted low levels of construction that were recorded during the housing market bust. At the same time, however, prospects for
FIGURE 3.13: West Virginia Manufacturing Industry Employment Growth Forecast
-7% -6% -5% -4% -3% -2% -1% 0% 1% 2% 3% 4% 5%
Other DurablesOther Nondurables
Primary MetalsNonmetallic Minerals
Food & BeverageManufacturing
Fabricated MetalsAerospace Equipment
Wood Products & FurnitureAutomotive Parts
Plastics & RubberChemicalsMachinery
2006-20162017-2022
Average annual growth, %
Sources: US Bureau of Labor Statistics; WVU BBER Econometric Model

32 | WEST ViRGiNiA ECONOMiC OUTLOOK 2017-2021
most of the losses reflecting long-term trends in the industry’s productivity and continued displacement of the US steel industry to overseas competition.
PRODUCTIVITY Real output for the manufacturing sector as a whole is expected to rise at an average annual rate of 2.2 percent during the outlook period. This more than doubles the rate of job growth expected for the sector over the next five years, which points to additional gains in productivity during the forecast horizon. A couple of industry segments should enjoy measurably stronger increases in average worker productivity going forward, especially primary metals. For example, industry employment will likely drift lower over the next five years, but the remaining productive steel capacity in the state will benefit from growth in natural gas exploration, production and distribution and higher infrastructure spending. Furthermore, Constellium’s capacity additions in Ravenswood for producing aluminum plating for Airbus will offset the output the state has lost in previous plant closings. Overall, the real value of steel and aluminum output per worker from West Virginia is expected to rise 2.3 percent between 2017 and 2022. CONSTRUCTION IN WEST VIRGINIAEmployment and output in West Virginia’s construction sector has declined significantly since 2012, with the overall sector losing nearly 6,000 workers. Conditions for the sector as a whole were stable during the first quarter of 2017, but the overall level of employment at construction companies in the state is at its lowest point since the early 1990s.
Among the sector’s three major segments in the state, residential construction (including contractors) is the only one that has seen an increase in activity and pay-rolls during the 2012 to 2016 time period. Even then, however, the overall gain can be characterized as modest. By comparison, the state’s nonresidential and heavy/civil engineering segments have accounted for the entirety of the sector’s employment declines, with nonresidential experiencing the largest net absolute decline in payrolls (~3,000) and heavy and civil engi-neering projects realizing a 28 percent loss in workers since 2012.
Residential ConstructionAccording to data from McGraw-Hill, approximately 2,100 single-family homes were started during 2016, representing a 5 percent increase over 2015. The seasonally adjusted pace of homebuilding has been volatile for the past several years, but residential con-struction activity is now on an upward trend since bot-toming out a couple years after the Great Recession concluded. The average rate observed through the first two quarters of 2017 is 11 percent ahead of a year ago
FIGURE 3.14: West Virginia Manufacturing Sector Productivity
80
90
100
110
120
130
140
150
160
170
180Output per worker, Thousands 2016$
Sources: US Bureau of Labor Statistics; Bureau of Economic Analysis; WVU BBER Econometric Model
higher long-term interest rates, reported labor short-ages by builders and long-term regulatory uncertainty for banks and finance companies will likely dampen construction activity to some extent. The state’s plas-tics industry should also see solid growth due in part to the US housing market’s continued improvements, while the spillover effects created by downstream natu-ral gas industries in the Mid-Atlantic Region bode well for plastics manufacturing activity over the longer term.
The auto parts supply segment of the state’s manufac-turing sector will see appreciably slower growth over the next five years as automakers deal with a lower level of consumer auto purchases linked to “spent-up” demand and higher interest rates on auto loans. The state’s aerospace industry will see moderate gains in employment and output, though most of this is expected to accrue to the civilian aircraft portion located in Harrison County as the federal defense and nondefense segments face uncertainty from gridlock arising from budget debates in Washington, DC.
The fabricated metals industry is expected to see an average annual gain of 1 percent in employment over the next five years. Given its interconnectedness with the coal industry in some parts of the state, however, these increases will occur early in the forecast horizon and the level of payrolls will slowly decline over the latter half of the outlook period. Overall payrolls in the nonmetallic minerals manufacturing subsector will likely be stable going forward, though the underlying segments will see different outcomes over most of the next five years. Cement production is expected to benefit from greater levels of infrastructure spending in the state, but this will be offset by the continuing long-term secular decline in West Virginia’s traditional glass manufacturing. Primary metals manufacturing employ-ment will decline slightly over the next five years, with

| 33
and marks the best reading for new single-family hous-ing starts since 2008. Building permits for single-family units indicate this pace should improve further over the remainder of the year.
Multifamily construction activity is generally a smaller share of the overall residential market, primarily due to the state’s low population density and high homeown-ership rate. Apartment construction peaked in 2007 and has been relatively limited in recent years. Monon-galia County has seen the most notable multifamily construction activity in recent years due to several large-scale WVU housing projects and a handful of new private apartment complexes in the area.
Nonbuilding and Nonresidential ConstructionAlthough the residential construction segment has experienced a relatively mild recovery, starts for new nonbuilding projects in West Virginia were weak for much of the 2012 to 2016 time period. Nonbuilding typically consists of infrastructure projects such as highways, bridges, and water/sewer systems, as well as utility distribution systems. Generally, these projects are backed by federal, state and/or local capital fund-ing sources and often have long lead times between approval and the physical construction occurring.
The coal industry’s downturn and low market prices for natural gas have led to large declines in severance tax collections and have hindered the state’s ability to finance any appreciable improvements in public infra-structure. At the same time, prior to the FAST Act’s passage,11 congressional disagreements over the size and nature of funding for a multi-year transportation bill, along with the overall backdrop of deep partisan divides present in federal budget debates, created significant uncertainty for many projects.
Recently, however, spending on new nonbuilding projects has been on rise, totaling nearly $1.4 billion over the past 12 months. Most of this growth is related to energy sector projects, such as the Rover pipeline, wastewater recycling, and cryo-processing plants, but also thanks to a modest increase in highway infra-structure spending in a few areas.
Unfortunately, the level of nonbuilding project spending in the state is just over one-half of what was allocated in 2010 and, reflecting how geographically concen-trated economic growth has been for the past several years, most of the projects have been in North-Central West Virginia (particularly Monongalia County), as well as the Northern and Eastern Panhandle regions. in similar fashion, nonresidential construction activity has been isolated to a few major commercial and industrial developments in the state’s economic growth centers. Overall, an estimated $500 million has been spent
West Virginia’s Economy, industry Focus
FIGURE 3.15: West Virginia Construction Employment by Type
0
5
10
15
20
25
30
35
40
45Heavy and civil engineeringNonresidentialResidential
Thousands
Source: US Bureau of Labor Statistics
FIGURE 3.16: West Virginia Single-Family Housing Starts
1
2
3
4
5
6
7
8Units, Seasonally Adjusted Annual Rate (Thousands)
Source: McGraw-Hill Construction
on new nonresidential projects in the last 12 months statewide, after surpassing more than twice that annu-alized pace in late-2015/early-2016.
House PricesAlthough West Virginia experienced a downturn in house prices after the housing bubble burst, the rate of house price deflation was much smaller compared to the majority of other US states. indeed, the overall peak-to-trough decline in home prices in the state was 7 percent compared to an 18 percent decline for the US.12 By contrast, since bottoming out in the second quarter of 2011, prices for existing single-family homes in West Virginia have rebounded by 13 percent com-pared to a 30 percent gain for the nation as a whole over that same time period.
Of course, changes in house prices have varied quite dramatically in recent years throughout the state’s dif-
11. For more informa-tion on the FAST Act and its details on spending for West Vir-ginia, see https://www.fhwa.dot.gov/fastact
12. The measure for house prices used in this section is the Federal Housing Finance Agency’s All-Transactions index, which is available at the state level and for all metropolitan statistical areas. Alternative mea-sures of house prices are available and to see differences that might exist between them, readers can visit https://www.fhfa.gov/Media/PublicAffairs/Pages/Housing-Price-index-Frequently-Asked-Questions.aspx

34 | WEST ViRGiNiA ECONOMiC OUTLOOK 2018-2022
ferent regions, reflecting local supply conditions and underlying demand for homes. After experiencing a dramatic run-up in prices during the bubble years, West Virginia counties that were part of the Hagerstown (Berkeley and Morgan counties), Winchester (Hamp-shire County) and Washington, DC (which includes Jefferson County) metro areas saw prices plunge by as much as 36 percent. The rate of price declines registered in the state’s other counties located within metro areas was significantly smaller, ranging from a 2 percent drop in Morgantown (Monongalia and Preston) to a 10 percent loss in Weirton-Steubenville (Brooke and Hancock counties).
As house price appreciation has accelerated nation-ally, price growth has followed an appreciably different path for many of the state’s largest markets. Accord-ing to data from the Federal Housing Finance Agency
(FHFA), the Beckley and Charleston metro areas have seen price declines in the past two years, while the Morgantown, Hagerstown, MD, and Huntington MSAs have recorded cumulative house price gains of just 2 to 3 percent since mid-2015. in the case of Morgantown and Hagerstown, these low rates of growth reflect a slowdown in appreciation as both of these areas have had relatively rapid increases in house prices since 2011. West Virginia counties found within the DC and Winchester, VA, metro areas have experienced consis-tently fast growth in house prices, while Parkersburg and Weirton have seen home price growth accelerate a great deal over the past two years.
Sector OutlookAfter four difficult years, the forecast calls for the con-struction sector to see average annual growth of 1.7 percent through the end of 2022. However, growth will not be spread evenly across the sector and much of the growth will occur in the 2018 to 2021 time frame as the energy industry will see several key projects ramp up. Several pipeline projects are slated to begin or be completed over the next 12 to 24 months, though legal and regulatory challenges could affect the time-line of several and potentially thwart a couple of oth-ers. Among the largest of these projects that will fall within the state of West Virginia are Rover (Phases i and ii), Mountain Valley, Atlantic Coast, Leach XPress and Mountaineer XPress. in addition, the Moundsville Power natural gas-fired power plant, along with two other combined-cycle natural gas that could enter service by 2021 further illustrate the industry’s future impact on construction since each project will require several hundred workers to complete.
Commercial projects outside the energy sector will also bolster the sector’s performance going forward. First, Procter & Gamble’s new $500 million manufac-turing facility in Martinsburg will continue to undergo development as additional lines of production are added and suppliers migrate to the area. Monongalia County will be a key center of construction activity for the North Central Region, thanks to additional expan-sion efforts by WVU Medicine, as well as the planned construction of new academic buildings and athletic facilities upgrades. Also, the WestRidge Business Park development and continued build out of University Town Centre are expected to be a major driver of commercial and industrial construction activity in the region over the next several years.
in terms of residential construction activity, the fore-cast calls for single family housing starts in West Virginia to rise at an average annual rate of 4 percent over the next five years. For the state as a whole, the baseline forecast assumes existing single-family house prices will rise approximately 1 percent per
FIGURE 3.17: Single-Family House Price Growth by Metro Area
-9%
-6%
-3%
0%
3%
6%
9%
12%
15%2013Q2-2015Q2
2015Q2-2017Q2
% Change
Source: Federal Housing Finance Agency – All Transactions House Price index
FIGURE 3.18: West Virginia Single-Family House Prices
90
100
110
120
130
140
150
160
170House Price Index, 2003=100
US West Virginia
Sources: Federal Housing Finance Agency; WVU BBER Econometric Model; iHS Markit

| 35
year. Healthy rates of in-migration and rising per capita incomes will support housing demand and put upward pressure on prices in the state’s higher growth areas, but other parts of the state where prospects for economic growth are more limited or their population numbers contract outright, house prices will be stable for the most part.
Publicly-funded infrastructure spending in West Vir-ginia is expected to be stronger over the next five years as overall spending is expected to increase moder-ately. However, infrastructure spending faces some degree of risk that could thwart an even stronger rate of growth during the forecast horizon. For example, the Justice Administration intends to utilize revenue streams from recently-approved tax and fee hikes to pay for up to $1.6 billion in bonds to back road fund-ing. However, the bond outcome could be rejected by voters in an upcoming election this fall, which would set the stage for developing alternative mechanisms to pay for infrastructure projects.
Federal infrastructure spending has been set to some extent for the next several years thanks to the FAST Act, but the Trump Administration recently amended rules that affect federal infrastructure projects by streamlin-ing the permitting process so as to shorten the time needed to move a project from approval to completion. in addition, the administration has also proposed more than $1 trillion in additional for spending for infrastruc-ture, though details of the proposal remain limited at present and some concerns have arisen regarding the effectiveness of using public-private partnerships to fund large-scale federal highway projects as compared to their predominant uses in commercial and multifam-ily developments in urban areas. HEALTH AND HEALTH CARE IN WEST VIRGINIABased upon the state’s population density, West Vir-ginia ranks as one of the most rural states in the nation. indeed, more than 60 percent of the state’s residents live in rural areas, according to the US Census Bureau. isolated populations due to the rugged nature of the state’s topography, and long travel times for these resi-dents due to relatively limited transportation options, have been a limiting factor in allowing many West Virginians access to quality healthcare services. Given the state’s large share of elderly residents and the ten-dency toward poor health outcomes and behaviors, the private healthcare sector plays a significant role in determining the well-being of individuals living in West Virginia going beyond the jobs, wages and other direct economic impacts the hospitals and other medical facilities account for across the state.
Healthcare Sector Trends and OutlookFigure 3.19 shows healthcare sector employment growth in West Virginia and the United States over the past decade and forecast growth over the coming 5 years. Employment growth in West Virginia’s health-care sector has been volatile since the late 2000s. The employment growth rate in the sector fell from a high of more than 2.0 percent between 2008 and 2012 to an average of less than 0.5 percent per year between 2013 and 2016.
Overall, the observed rate of job growth in the state’s healthcare sector over the past few years is decidedly weaker than the nation as a whole, where payrolls have increased well over 2.0 percent per year since 2012. We anticipate this relatively slower rate of growth will persist throughout the outlook period. Over the near term, expansion efforts throughout the WVU Medicine network of providers will more than offset announced layoffs by a few of the state’s other major hospitals. Despite the large and growing base of demand that exists in West Virginia from the elderly and poorer health outcomes, uncertainty over federal health insurance policies will weigh on the sector’s performance both within West Virginia and across the nation as a whole.
West Virginia’s private sector healthcare providers accounted for more than 117,000 of the state’s jobs during 2016 (or 17 percent of total employment) and paid out nearly $5.1 billion in wages to these work-ers. Figure 3.20 provides a breakdown of the various subsectors found within the broader healthcare and social assistance sector. Approximately 81 thousand individuals worked in the state’s hospitals and ambu-latory health providers services sub-sectors in 2016, accounting for just over 69 percent of all healthcare jobs. The average annual wages of workers in these
West Virginia’s Economy, industry Focus
FIGURE 3.19: Healthcare Sector Employment
0.0%
0.5%
1.0%
1.5%
2.0%
2.5%
3.0%
3.5%
US
West Virginia
% Change, Year Over Year
Sources: US Bureau of Labor Statistics; WVU BBER Econometric Model; iHS Markit

36 | WEST ViRGiNiA ECONOMiC OUTLOOK 2018-2022
segments were $54,100 and $50,400, respectively. The remaining 31 percent of jobs were dedicated to long-term nursing and elder care as well as private social welfare service providers. Inflation-adjusted wages in healthcare services are expected to increase at an average rate of 0.7 percent from 2017 to 2022.
Health Determinants and Outcomes for West VirginiaAmerica’s Health Rankings® Annual Report provides a detailed assessment of the nation’s health on a state-by-state basis.13 The overall health score reflects each state’s performance on 27 health indicators relative to the national average. The indicators fall into two categories: determinants of health, accounting for 75 percent of the overall score, and health outcomes, accounting for 25 percent of the overall score. The determinants of health are further categorized into behaviors (e.g. smoking, physical inactivity, high school graduation); community and environment (e.g. violent crime, infectious disease); policy (e.g. lack of health insurance, public health funding); and clinical care (e.g. preventable hospitalizations, low birthweight).
Health outcomes include measures of chronic dis-ease, such as diabetes and cardiovascular deaths plus measures of health status, e.g. percent with frequent physical and mental health distress. Scores for each state are calculated by adding up the scores for each individual component and factoring in its impact on the overall ranking and how the metric influences health. in 2016, West Virginia’s overall health score was -0.614 for a rank of 43rd among the 50 states. West Virginia’s ranking has improved from its rank of 47th in 2012.
A major contributor to West Virginia’s poor overall health is obesity.15 Obesity is a major risk factor for many diseases and chronic conditions including heart disease, cancer, Type 2 diabetes, and stroke. in 2016, nearly 36 percent of the Mountain State’s adult population could be classified as obese, roughly six percentage points greater than the national average, and high enough to rank the state 47th nationally.
Engaging in regular exercise or another form of physi-cal activity is a key factor in reducing the incidence of obesity and preventing the onset of a host of related chronic conditions. Unfortunately, West Virginia ranks among the bottom ten states in this lifestyle behavior,
13. https://www.americashealthrankings.org/learn/reports/2016-annual-report, accessed August 20, 2017.
14. For an explanation behind the methodology and interpretations of the overall score for West Virginia and other states, see the Appendix on pg 150 of https://assets.americashealthranings.org/app/uploads/ahr16-complete-v2.pdf
15. Obesity is defined by the Center for Disease Control (CDC) as having a body mass index (BMI) of 30.0 or higher. BMI, as defined by the CDC, is equal to weight in pounds divided by height in inches squared multiplied by 703.
FIGURE 3.20: West Virginia Healthcare Sector Employment and Wages (2016)
Sector Total Employment
Total Wages (ths $)
Average Annual Wage
Ambulatory Healthcare Services 40,605 $2,045,200 $50,368
Hospitals 40,254 $2,179,529 $54,144
Nursing & Residential Care Facilities 18,314 $536,883 $29,315
Social Assistance 17,878 $335,692 $18,776
Total 117,051 $5,097,304 $43,547
Source: US Bureau of Labor Statistics
FIGURE 3.21: Health Behavior Statistics, 2016
18% 18%
30%
26%26%
11%
36%
31%
0%
5%
10%
15%
20%
25%
30%
35%
40%
Smoking Binge Drinking Obesity Physical Inactivity
United StatesWest Virginia
Share of Adult Population, %
Source: America’s Health Rankings®
FIGURE 3.22: Health Statistics Measures, 2016
West Virginia United States WV Rank
Diabetes (% of adult population) 14.5% 9.9% 49
Frequent Mental Distress (% of adults) 15.6% 11.2% 50
Frequent Physical Distress (% of adults) 18.6% 11.4% 50
Disparity in Health Status (by educational attainment) 24.6 29.5 11
infant Mortality per 1,000 Live Births 7.3 5.9 45
Cardiovascular Deaths per 100,000 297.9 251.7 44
Cancer Deaths per 100,000 223.9 189.9 48
Drug Overdose Deaths per 100,000 32.2 14.0 50
Premature Deaths per 100,000 10,245 7,054 49
Source: America’s Health Rankings®

| 37 37West Virginia’s Economy, industry Focus
with nearly 31 percent of adults indicating they had not participated in any form of physical activity in the past month. Smoking is another factor linked to the state’s poor health outcomes, since cigarettes and other form of tobacco smoking are linked to the development of numerous cancers and cardiovascular conditions. As of 2016, West Virginia had the second-highest smok-ing rate at roughly 26 percent of the adult population smoking daily.
West Virginia has the second highest prevalence of diabetes in the country at 14.5 percent of the adult population, also ranking among the bottom 10 states in terms of mortality rates caused by cancer and cardiovascular disease as well as infant mortal-ity rates. Perhaps the most troubling statistic among those listed in Figure 3.22 is the drug overdose death rate, which ranks as the highest in the nation at 32.2 overdose deaths per 100,000 residents in 2016 and has increased 46 percent in just the past three years alone. Drug overdose deaths have been a major factor in driving the mortality rates of particular age groups significantly in recent years, particularly among males. While the state lost more than 9,700 male residents between 18 to 45 years of age between 2012 and 2016, the overall level of deaths actually increased for this age group over the same time period and the inci-dence of overdose deaths accounted for the majority of this increase.
The opioid drug epidemic has impacts beyond the tragic loss of life that stems from overdoses, traffic accidents, or violent crime. indeed, combating the epidemic has raised budgetary costs for police and fire departments, social services, and a host of other state and local government agencies, thereby siphon-ing scarce public funds away from other more produc-tive uses for what is already a strapped state budget. in addition, given the state’s already low workforce participation rate, high drug use (and deaths from overdoses) reduces or altogether eliminates the abil-ity of these individuals to hold a job and thus lowers the effective size of the state’s pool of workers even further, creating potential labor shortages for existing businesses and limiting the opportunities to attract new ones.
WVU’S BUSINESS SCHOOL CAN HELP YOUR BUSINESSBUREAU OF BUSINESS AND ECONOMIC RESEARCH � Economic impact Analysis � Economic Forecasting � Public Policy � Health Economics � Energy Economics � Regional Economic Development � Education Policy
business.wvu.edu/bber
BRICKSTREET CENTER FOR INNOVATION AND ENTREPRENEURSHIP � Feasibility Studies � Business Plans � Commercialization Plans � Market Studies � Process Re-Engineering � Operational Efficiency Analysis
business.wvu.edu/brickstreet-center
CENTER FOR EXECUTIVE EDUCATION � Customized Corporate Training Programs � Annual Management and Professional Development Conferences
� One-on-One Executive Coachingbusiness.wvu.edu/execed

38 | WEST ViRGiNiA ECONOMiC OUTLOOK 2018-2022
AK
HI
20.3% - 22.4%
Government Expenditure as % of Personal Income
16.1% - 20.2%
US Average = 22.0%
22.5% - 24.1%24.2% - 41.7%
TX
CA
MT
AZ
ID
NV
NM
COIL
OR
UT
KS
WY
IANE
SD
MN
ND
OK
FL
WI
MO
WA
AL GA
AR
LA
MI
IN
PA
NY
NC
MS
TN
VAKY
OH
SC
ME
WV
VTNH
MD
NJ
MACT
DE
RI
DC
AK
HI
TX
CA
MT
AZ
ID
NV
NM
COIL
OR
UT
KS
WY
IANE
SD
MN
ND
OK
FL
WI
MO
WA
AL GA
AR
LA
MI
IN
PA
NY
NC
MS
TN
VAKY
OH
SC
ME
WV
MI VTNH
MD
NJ
MACT
DE
RI
DC
US Average = $ 10,391
9,974 - 11,05711,058 - 23,292
8,587 - 9,973
Government Expenditureper Capita ($)
7,162 - 8,586
CHAPTER 4:
Government in West VirginiaAs reported in previous sections, government is the largest employer in West Virginia, accounting for one-fifth of all jobs in the state.16 Further, total state and local government spending in the state is equivalent to over 25 percent of West Virginia’s total personal income, and the US federal government transfers
FIGURE 4.1: State and Local Government Expenditure per Capita, 2014
Source: US Census Bureau
FIGURE 4.2: State and Local Government Expenditure as Share of Personal Income, 2014
Source: US Census Bureau
FIGURE 4.3: West Virginia State and Local Government Expenditure Composition, 2014
Education Services
33%
Social Welfare Programs
27%
Insurance Trust9%
Transportation8%
Public Safety6%
Environment and Housing
5%
Governmental Administration
5%
General Expenditures, NEC
3%
Utilities2%
Interest on General Debt
2%
Source: US Census Bureau
16. This figure includes federal government employment in West Virginia, in addition to state and local government employment.
17. Data are for the 2013 fiscal year. Data for the 2014 fiscal year are not scheduled for release by the US Census Bureau until December of 2016.
a significant amount of income into the state. Taken together, it is clear that government has a significant economic influence in the state, and as such, in this section we explore the role of government in West Virginia in two ways. First, we detail the size and com-position of state and local government activity in the state. Second, we consider public assistance in West Virginia that is provided by the US Federal Government in conjunction with the State of West Virginia. WEST VIRGINIA GOVERNMENTGOVERNMENT SIZE As illustrated in Figure 4.1, West Virginia ranks in the lower half of US states in terms of the size of overall state and local government when measured as total spending on a per capita basis. Nineteen states have smaller state and local govern-ments when measured by this metric.17 However, it is also important to consider government spending measured relative to state personal income, especially since personal income per person in West Virginia falls below the national average. As reported in Figure 4.2, West Virginia’s state and local governments are larger than average when total spending is measured relative to personal income. Total state and local government spending in West Virginia equals more than 25 percent of state personal income, compared to the US aver-age of 22 percent; indeed, only eight states have larger governments by this metric. Overall, the answer to the question “How large is state and local government in West Virginia?” is mixed depending on the metric used: The absolute size of the government is relatively small, but a relatively large portion of the state’s limited resources are devoted to government expenditures.
EXPENDITURE COMPOSITION in Figure 4.3 we report the composition of state and local government spending in West Virginia. As illustrated, West Virginia devotes 33 percent of its overall government resources to education services, far above the national average of around 28 percent. West Virginia also devotes a rela-tively large share of its government resources to social welfare programs, such as Medicare and the State Children’s Health insurance Program (SCHiP). West Virginia governments devote 27 percent of their overall spending to this category, compared with a national average of 25 percent. West Virginia governments direct 9 percent of their expenditures to insurance trust expenditures for public employees, which is slightly below the national average of 10 percent. Further, governments in the state focus relatively heavily on transportation spending: in West Virginia 8 percent of total spending goes to transportation-related projects, compared to a national average of just under 6 percent.

| 39
TX
CA
MT
AZ
ID
NV
NM
COIL
OR
UT
KS
WY
IANE
SD
MN
ND
OK
FL
WI
MO
WA
AL GA
AR
LA
MI
IN
PA
NY
NC
MS
TN
VAKY
OH
SC
ME
WV
MI VTNH
MD
NJ
MACT
DE
RH
DC
AK
HIUS = $ 6,768
Own Source RevenuePer Capita ($)
≤ 5,6665,667 - 6,4936,494 – 7,406> 7,406
Government in West Virginia
FIGURE 4.4: Real State and Local Government Expenditures per Capita
4
5
6
7
8
9
10
11
12
West Virginia
Average of Other States
Thousands of 2016$
Sources: US Census Bureau; US Bureau of Economic Analysis.
FIGURE 4.5: State and Local Government Own Source Revenue per Capita, 2014
Source: US Census Bureau
FIGURE 4.6: West Virginia State and Local Government Revenue Composition, 2014
Federal Government
24%
Charges and Misc. General
Revenue20%
Insurance Trust 16%
Sales Tax14%
Individual Income Tax
9%
Property Tax8%
Other Taxes6%
Utility Revenue1%
Corporate Income Tax1% Liquor Store
Revenue1%
Source: US Census Bureau
EXPENDITURE GROWTH in Figure 4.4 we report the growth in state and local government expenditures per person in West Virginia over the past three decades. As illustrated, West Virginia governments have increased their aggregate size from around $4,500 in total spend-ing per capita in 1980 to nearly $9,200 by 2014, in infla-tion adjusted terms. However, over the entire period West Virginia governments have remained below the national average in terms of spending per capita. Further, the degree to which West Virginia state and local government spending falls short of the national average has widened over the period.
OWN SOURCE REVENUE in Figure 4.5 we report state and local government own-source revenue per capita across the US states. Here West Virginia falls in the lower half of states based on this metric (20 other states have lower own-source revenue on a per capita basis). The fact that West Virginia is relatively low in terms of own-source revenue, compared to total expenditures per capita, is driven by the fact that West Virginia receives an above-average share of its revenues from the US Federal Government.
REVENUE SOURCES Figure 4.6 illustrates the sources of West Virginia state and local government revenue. West Virginia receives the largest share of its total revenue from the US Federal Government. Overall, 24 percent of total revenue received by West Virginia governments is a federal transfer, which is significantly higher than the national average of 17 percent. West Virginia governments are in alignment with most states in terms of their reliance on sales taxation: West Virginia governments derive 14 percent of their total revenues from sales taxation, which is almost exactly equal to the national average. Similarly, West Virginia governments derive 9 percent of their total revenues from individual income taxation, again, almost identical to the national average. in slight contrast, the reliance on the property tax in West Virginia—8 percent of total revenues—falls short of the national average of over 13 percent.
STATE SHARE OF TOTAL SPENDING in Figure 4.7 we report the share of total state and local government spending in a state that is directed from the state govern-ment. As illustrated, West Virginia is sixth-highest among the states in terms of this metric. This indicates that West Virginia is a relatively centrally structured state with the state government taking on relatively more responsibil-ity, and leaving relatively less responsibility to the local governments, compared to the national average.
PUBLIC ASSISTANCE IN WEST VIRGINIATotal transfer payments made in West Virginia in 2015 amounted to more than 27 percent of personal income in the state, as depicted in Figure 4.8. That figure is higher than what has been observed over the past
two decades or so, given recent economic suffering in the state. Further, transfer payments in West Virginia are substantially higher as measured against personal income when compared to the national average; for the nation as a whole, transfer payments were equiva-lent to around 17 percent of personal income in 2015. Indeed, the 27 percent figure placed West Virginia

40 | WEST ViRGiNiA ECONOMiC OUTLOOK 2018-2022
highest among the 50 states in 2015 in terms of reli-ance on transfer payments.
in Figure 4.9 we disaggregate transfer payments into various broader categories. As illustrated, social secu-rity is by far the largest individual program, accounting for nearly 37 percent of total transfer payments made in West Virginia in 2015. Medicare and Medicaid came in second and third, accounting for around 23 and 20 percent of total transfer payments, respectively. All other transfer programs pale in comparison to these three when represented as a share of total expenditures in the category. The Supplemental Nutrition Assistance Program (SNAP) in the state comes in a distant fourth in terms of its spending share, accounting for less than three percent of total transfers.
it is interesting to note how the composition of trans-fer payments has evolved over the past two decades. Spending on Medicare and Medicaid has increased substantially since 1990 as a share of total transfer payments. Social Security spending has fallen in rela-
FIGURE 4.7: State Government Spending as a Share of Total State and Local Expenditures, 2015
40%
45%
50%
55%
60%
65%
70%
75%
80%
85%
90%
Verm
ont
Nor
th D
akot
aN
ew M
exic
oAr
kans
asD
elaw
are
Wes
t Virg
inia
Haw
aii
Alas
kaKe
ntuc
kyM
onta
naM
aine
Idah
oR
hode
Isla
ndM
issi
ssip
piM
ichi
gan
Mas
sach
uset
tsO
klah
oma
Min
neso
taC
onne
ctic
utO
rego
nU
tah
Loui
sian
aO
hio
Wis
cons
inIn
dian
aU
S M
edia
nW
yom
ing
New
Jer
sey
Penn
sylv
ania
Alab
ama
Sout
h C
arol
ina
Iow
aM
aryl
and
New
Ham
pshi
reVi
rgin
iaAr
izon
aSo
uth
Dak
ota
Kans
asN
orth
Car
olin
aW
ashi
ngto
nM
isso
uri
Cal
iforn
iaN
evad
aN
ew Y
ork
Geo
rgia
Col
orad
oTe
xas
Illin
ois
Tenn
esse
eFl
orid
aN
ebra
ska
Source: US Census Bureau
FIGURE 4.9: Distribution of Transfer Payments by Program, West Virginia
0% 5% 10% 15% 20% 25% 30% 35% 40% 45% 50%
Family Assistance
Other Govt. Retirement & Disability
Worker's Compensation
State Unemployment Insurance
Supplemental Security Income
SNAP
Medicaid
Medicare
Social Security
19902015
Share of Transfer Payments, %
Source: US Bureau of Economic Analysis Note: Select programs are reported in chart.
tive terms, along with various government retirement and disability programs, worker’s compensation, family assistance programs, state unemployment insurance, and to a lesser degree, SNAP spending. Supplemental Security income (SSi) spending has remained relatively constant over the period as a share of total transfer payments.
in Figure 4.10 we illustrate the composition of transfer payments nationally. The figure illustrates a significant degree of similarity to the pattern observed in West Virginia in terms of the size of relative programs and in terms of the evolution of spending patterns over time.
Figures 4.11 and 4.12 illustrate the size of specific public assistance programs in West Virginia. in Figure 4.11, we report the number of individuals who receive benefits from specific public assistance programs in West Virginia. in Figure 4.12 we report the share of the population receiving benefits from each program, and we offer a comparison to the national share. With 470 thousand recipients, Social Security benefits are
FIGURE 4.8: Transfer Payments as a Share of Personal Income
10%
12%
14%
16%
18%
20%
22%
24%
26%
28%
30%
West Virginia
US
US 30-yr average
Share of Total Personal Income, %
Source: US Bureau of Economic Analysis
FIGURE 4.10: Distribution of Transfer Payments by Program, United States
0% 10% 20% 30% 40% 50%
Worker's Compensation
Family Assistance
Other Govt. Retirement & Disability
Supplemental Security Income
SNAP
State Unemployment Insurance
Medicaid
Medicare
Social Security
19902015
Share of Transfer Payments, %
Source: US Bureau of Economic Analysis Note: Select programs are reported in chart.

| 41Government in West Virginia
FIGURE 4.11: Participation in Transfer Programs in West Virginia, 2015
470
358
78
40 26 18 150
50
100
150
200
250
300
350
400
450
500
Social Security SNAP Supplemental Security Income
WIC Both Social Security & SSI
Unemployment Insurance
TANF
Average Monthly Number of Participants (Thousands)
Sources: US Department of Labor; US Social Security Administration; US Department of Agriculture; US Department of Health and Human Services.
FIGURE 4.13: Average Weekly Duration Collecting Unemployment Insurance
12
13
14
15
16
17
18
19
20# of Weeks
West Virginia
US
Source: US Department of Labor
FIGURE 4.12: Participation in Transfer Programs, 2015
0%
5%
10%
15%
20%
25%
30%
Social Security SNAP Supplemental Security Income
WIC Both Social Security & SSI
Unemployment Insurance
TANF
West Virginia
US
Share of Total Population, %
Source: US Department of Labor
FIGURE 4.14: Average Weekly Unemployment Insurance Benefits
$200
$220
$240
$260
$280
$300
$320
$340
$360Average Weekly Benefit
West VirginiaUS
Source: US Department of Labor
enjoyed by the largest number of West Virginians, representing over one-fourth of the state’s population. This figure is substantially higher than the correspond-ing figure at the national level of just under 19 percent, largely due to the state’s older population.
The SNAP program has the second highest number of recipients at nearly 358 thousand, or about 20 percent of the state’s population. This figure is also higher than the national figure of around 14 percent. Unemploy-ment insurance benefits were received by 18 thousand individuals in the typical month in West Virginia in 2015, representing about one percent of the state’s population, which is slightly higher than the national figure of about 0.7 percent. Income from the Special Supplemental Nutrition Program for Women, infants, and Children (WiC) was received by 40 thousand West Virginians during the typical month in 2015. WiC is received by a smaller population share in West Virginia than the national average. Temporary Assistance to Needy Families (TANF), was received by 15 thousand West Virginians during the typical month in 2015, which
represents 0.8 percent of the state’s population and is roughly equal to the proportion nationally.
Figures 4.13 and 4.14 examine the receipt of unem-ployment insurance benefits in West Virginia. As illus-trated, the duration of unemployment insurance ben-efits fell significantly between 2009 and 2011, both nationally and in West Virginia. However, the figure rose again in West Virginia in 2013 and remains at an elevated level, due to worsening employment condi-tions in the state. For 2016, the average unemploy-ment insurance recipient received benefits for just over 16 weeks, slightly longer than the comparable figure for the US of 15.5 weeks.
in Figure 4.14 we illustrate the average weekly unem-ployment insurance benefit amount. As illustrated, benefits have risen in nominal terms since 2001, except for a sharp drop during 2010-2011. Overall, the typical West Virginian who received unemployment insurance benefits during 2016 received around $312 per week, compared to around $342 per week nationally.

42 | WEST ViRGiNiA ECONOMiC OUTLOOK 2018-2022
GUEST INSIGHT:
West Virginia Fiscal Forecast
Following a two-year period of decline in state govern-ment revenues associated with a significant decline in
coal industry activity, a significant decline in energy prices, along with continued contraction in foreign goods exports and employment, West Virginia economic activity and associated tax revenues slowly improved during the last half of fiscal year 2017. Gradual improvement in the volume of foreign goods exports, along with some rebound in energy prices beginning around October 2016, helped stimulate economic activity and tax revenue growth in the state. As a result, an initial projected fiscal year 2017 revenue shortfall of $192.0 million shrunk to a final shortfall of $120.7 million. The original shortfall projection occurred around the end of the first quarter of fiscal year 2017 when the year-to-date revenue collection deficit reached $81.2 million. Despite a year-to-date net gain of $30.2 million through September associated with increases in Tobacco Product Tax rates, net collections still fell 1.5 per-cent during the first quarter of fiscal year 2017. However, net collection growth improved significantly during the final nine months of the year to a full-year growth rate of 2.3 percent.
The recent trend of economic and fiscal improvement is anticipated to continue in fiscal year 2018. How-ever, the state continues to struggle to balance its ongoing budget with resource limitations reflective of a lack of any net nominal revenue growth over the past five years.
General revenue actual collec-tions totaled $4.191 billion in fiscal year 2017. Absent one-time gap fill revenues, net collections totaled nearly $4.067 billion. Adjusted receipts were $120.7 million below the official estimates and 2.3 percent above prior year adjusted receipts. The revenue shortfall was fully closed by a combination of nearly $60 million in mid-year budget reductions and $124.3 million in gap fill revenues, including $40.4 million from the revenue shortfall reserve fund. Revenue collections and revenue growth improved during the course of the year from a 1.5 percent decline during the first quarter to growth of 0.1 percent, 6.4 percent, and 6.9 percent during the second, third, and fourth quarters of the year, respectively. Natural gas prices troughed at less than $1.00 per thousand cubic feet in the first half of the fiscal year and then subsequently more than doubled between October and January to current levels generally in excess of $2.00 per thousand cubic feet. in addition, coal sales also troughed early in the year at an annualized rate of roughly 80 million tons and then subsequently rebounded to an annualized rate of more than 90 million tons. The value of foreign exports improved by nearly 29 percent from a 12-month trailing trend trough of $4.75 billion in October 2016 to a twelve-month trailing amount in excess of $6.12 billion as of May 2017. improvement in economic activity during the latter half of the year contributed to a net surplus of revenues over expendi-tures of more than $76.0 million. Half of this surplus was appropriated by the Legislature in the fiscal year 2018 budget and the remaining half ($38.0 million) was deposited in the Revenue Shortfall Reserve Fund. After subtracting this deposit, the net amount of revenue shortfall reserve
funds used for the fiscal year 2017 base budget was $93.7 million.
The Official fiscal year 2018 general revenue estimate, developed in November 2016 and updated in June 2017, of $4.225 billion is more than $34 million above actual fiscal year 2017 general revenue funds of nearly $4.191 billion. Given that final fiscal year 2017 general revenue funds relied on more than $124 million in temporary revenues, the adjusted required revenue growth in the official fiscal year 2018 general revenue estimate is more than $158 million or 3.1 percent. in addition to general revenues, the state budget relies on roughly $429 million in the estimated state share of lottery funds deposited in either the lottery fund, the excess lottery fund or the general revenue fund, in fiscal year 2018. The lottery fund component is largely unchanged from the prior year fol-lowing a long-term trend of decline since a peak established in 2007.
The economic momentum associ-ated with improving energy markets during the second half of fiscal year 2017 is projected to carryover to fiscal year 2018. In particular, natural gas prices are projected to generally remain above $2.00 per thousand cubic feet. The improvements in the energy sector should also contribute to modest employment and income growth this fiscal year. In addition, higher road fund fees and taxes enacted in June 2017 should result in additional highway spending during the year with associated economic benefits. Gains associated with pos-sible voter approval of a state road bond amendment in October 2017 are not reflected in fiscal year 2018 revenue estimates, but could be reflected in future year outlooks. Due mainly to energy price improvement and some stabilization in the coal industry, General revenue fund sever-ance tax collections are expected to rise by 12.5 percent. Following a year of no growth in either personal income tax or consumer sales tax revenues due to lack of employment and wage growth, general revenue fund personal income tax collections are expected to increase by at least 2.5 percent and sales tax collections
MARK MUCHOW, Deputy Cabinet Secretary, WV
Department of Revenue

| 43Guest insight: West Virginia Fiscal Forecast
are expected to rise by roughly 3.0 percent. The personal income tax revenue estimate is a bit conserva-tive due to the various uncertainties related to possible impacts associ-ated with pending federal tax reform. As of the end of July 2017, year-to-date general revenue fund collections are $27.7 million or 12.3 percent above prior year collections and less than $2.9 million below estimate.
The base budget expenditures for fiscal year 2018 from general revenues and lottery revenues are $4.687 billion, which is $20.5 million lower than the base budget expen-ditures included in the fiscal year 2017 budget of $4.707 billion. The largest funding increases in the fiscal year 2018 base budget are attribut-able to additional state funding of $29.8 million for the annual required amortization contribution for all of the state’s retirement systems, and increased funding of $11.1 million in the state share of the Medicaid program. Other base funding for all other programs in the fiscal year 2018 budget decrease by a net $61.4 million. One-time appropria-tions of $8.15 million and one-time adjustments of $26.3 million, which are funded using various other one-time funding sources, are also included as part of the state’s fiscal year 2018 budget.
The fiscal year 2018 budget relies on roughly $140 million in various one-time funding sources, an improvement over $200 million in one-time funding sources in the original fiscal year 2017 budget. Given such a large reliance on one-time funding sources, the fiscal year 2019 budget will require minimum general fund revenue growth of 3.3 percent just to match the funding level of the fiscal year 2018 budget. Current revenue projections suggest revenue growth of closer to 3.0 percent in fiscal year 2019. However, there are a number of variables that could possibly drive higher revenue growth in fiscal year 2019. A more rapid development of necessary natural gas pipeline and storage facility infrastructure could result in pricing levels closer to the national average, along with a potential for
increased gas production and tax revenues for the state. A prolonged weaker dollar relative to foreign currencies along with improvements in worldwide economic growth could result in additional gains in West Virginia goods exports. if approved by voters in October, the issuance of road bonds beginning in 2018 would result in greater highway infrastruc-ture spending and higher associated tax revenues for the state. Finally, the state could benefit from possible economic gains associated with pending federal tax reform efforts designed to lower corporate tax rates to levels more competitive in the global economy.
The basis of the current budget outlook for fiscal years 2018 and 2019 is a forecast of continuing rebound in the state economy with steady future improvements in employment and wages. After suffering decline since 2012, payroll employment is expected to rise at an average annual rate ranging between 0.3 percent and 0.6 percent over the next two years. Wage and salary growth are expected to gradually accelerate to an annual growth rate of roughly 4 percent by fiscal year 2019. Natural gas prices are anticipated to rebound from less than $1.00 per thousand cubic feet in calendar year 2016 to $2.20 in fis-cal year 2018 and $2.30 in fiscal year 2019. Both coal sales and natural gas sales generally stabilize in the neighborhood of current levels.
Based on the above-mentioned growth in economic activity, general revenues are currently projected to grow in the neighborhood of 2.8 percent to 3.5 percent between fiscal year 2018 and fiscal year 2019 to a level that is still likely short of planned expenditure needs. Projected growth in health care expenditures (Medicaid and PEiA) associated with an aging population continue to crowd out other state expenditures. A combina-tion of budget restructuring efforts and increased revenues may still be necessary to bring the state’s budget back to long-term balance. Even if government health care spending and pension funding were to remain relatively flat, there is still a need to
find a combination of budget reduc-tions and new revenues sufficient to replace the $140 million in one-time revenues and one-time cuts incorpo-rated in the current budget. The size of the fiscal year 2019 budget gap will also be heavily dependent on the level of economic growth in the state over the next year, with higher than anticipated growth leading to a lower gap and vice versa.
West Virginia is not unique with regard to its struggle to balance its long-term expenditures with long-term revenues. Most other states are also struggling with lower economic growth and higher costs for health care and pensions. Nearly all rural counties across the country are struggling with long-term stagnant economic activity. in recent history, most economic growth has been heavily concentrated in the larger metropolitan areas. in the past, many communities benefited from the influx of significant federal government funding for community development and infrastructure. However, the federal budget is now heavily con-strained with funding needs for past promises, particularly in the areas of Social Security, Medicare, and Medicaid. in West Virginia, nominal federal funding for highways has largely remained unchanged for over a decade. Future federal funds for state and local governments will likely be much more constrained relative to the past. State governments will likewise become more constrained over time in their ability to provide services. in this environment, states with strong local government partners will likely be better off fiscally than others. in addition to providing vital local government services with local taxes, local governments also play an important role in assisting state gov-ernment with an efficient allocation of scarce state and local resources to geographic areas with the greatest demands for government services relative to price. in addition to any revenue increases or restructuring of state government expenditures, greater local government participation may be a necessary component of any long-term budget balance solution for West Virginia.

44 | WEST ViRGiNiA ECONOMiC OUTLOOK 2018-2022
CHAPTER 5:
West Virginia’s CountiesWhile statewide figures reflecting West Virginia’s economy are important, it is important to recognize that they mask tremendous variation in economic performance across the state’s various regions and counties. As such, in this chapter we illustrate several
FIGURE 5.1: Annual Population Growth, 2006-2016
Randolph
Hardy
Kanawha
GreenbrierFayette
Preston
Grant
Raleigh
Pocahontas
Boone
Clay
Wayne
Nicholas
Roane
LoganMingo
Pendleton
Webster
Lewis
BraxtonMason
Wood RitchieTucker
Monroe
Lincoln
Mercer
Hampshire
Jackson
Wirt
Wyoming
McDowell
Tyler
Wetzel
Gilmer
Harrison
Upshur
Marion
Putnam
Mineral
Cabell
Barbour
Marshall BerkeleyMonongaliaMorgan
Taylor
Ohio
Summers
Calhoun
Doddridge
Jefferson
Pleasants
Brooke
Hancock
0% - < 0.5%≥ 0.5%
2005-15 Average Annual Population Growth
< -0.5%-0.5% - < 0%
Source: US Census Bureau
FIGURE 5.3: Annual Employment Growth, 2006-2016
Randolph
Hardy
Kanawha
GreenbrierFayette
Preston
Grant
Raleigh
Pocahontas
Boone
Clay
Wayne
Nicholas
Roane
LoganMingo
Pendleton
Webster
Lewis
BraxtonMason
Wood RitchieTucker
Monroe
Lincoln
Mercer
Hampshire
Jackson
Wirt
Wyoming
McDowell
Tyler
Wetzel
Gilmer
Harrison
Upshur
Marion
Putnam
Mineral
Cabell
Barbour
Marshall BerkeleyMonongaliaMorgan
Taylor
Ohio
Summers
Calhoun
Doddridge
Jefferson
Pleasants
Brooke
Hancock
0% - < 1%≥ 1%
2006-16 Average Annual Employment Growth
< -1%> -1% - < 0%
Source: US Bureau of Labor Statistics
key economic measures progressed during the past decade across each of the state’s 55 counties and how these measures are expected to change over the next five years from a geographic perspective.
FIGURE 5.2: Forecast Annual Population Growth, 2017-2022
Randolph
Hardy
Kanawha
GreenbrierFayette
Preston
Grant
Raleigh
Pocahontas
Boone
Clay
Wayne
Nicholas
Roane
LoganMingo
Pendleton
Webster
Lewis
BraxtonMason
Wood RitchieTucker
Monroe
Lincoln
Mercer
Hampshire
Jackson
Wirt
Wyoming
McDowell
Tyler
Wetzel
Gilmer
Harrison
Upshur
Marion
Putnam
Mineral
Cabell
Barbour
Marshall BerkeleyMonongaliaMorgan
Taylor
Ohio
Summers
Calhoun
Doddridge
Jefferson
Pleasants
Brooke
Hancock
0% - < 0.5%≥ 0.5%
2017-22 Average Annual Population Growth
< -0.5%-0.5% - < 0%
Source: WVU BBER County Econometric Model
FIGURE 5.4: Forecast Annual
Employment Growth, 2017-2022
Randolph
Hardy
Kanawha
GreenbrierFayette
Preston
Grant
Raleigh
Pocahontas
Boone
Clay
Wayne
Nicholas
Roane
LoganMingo
Pendleton
Webster
Lewis
BraxtonMason
Wood RitchieTucker
Monroe
Lincoln
Mercer
Hampshire
Jackson
Wirt
Wyoming
McDowell
Tyler
Wetzel
Gilmer
Harrison
Upshur
Marion
Putnam
Mineral
Cabell
Barbour
Marshall BerkeleyMonongalia
Morgan
Taylor
Ohio
Summers
Calhoun
Doddridge
Jefferson
Pleasants
Brooke
Hancock
0.6% - < 0.9%≥ 0.9%
2017-22 Average Annual Employment Growth
< 0.4%0.4% - < 0.6%
Sources: US Bureau of Labor Statistics; WVU BBER County Econometric Model

| 45West Virginia’s Counties
FIGURE 5.5: Annual Real Personal Income Growth, 2006-2016
Randolph
Hardy
Kanawha
GreenbrierFayette
Preston
Grant
Raleigh
Pocahontas
Boone
Clay
Wayne
Nicholas
Roane
LoganMingo
Pendleton
Webster
Lewis
BraxtonMason
Wood RitchieTucker
Monroe
Lincoln
Mercer
Hampshire
Jackson
Wirt
Wyoming
McDowell
Tyler
Wetzel
Gilmer
Harrison
Upshur
Marion
Putnam
Mineral
Cabell
Barbour
Marshall BerkeleyMonongalia
Morgan
Taylor
Ohio
Summers
Calhoun
Doddridge
Jefferson
Pleasants
Brooke
Hancock
1.8% - < 2.3%
2006-16 Average Annual Personal Income Growth
0.0% - < 1.0%1.0% - < 1.8%
≥ 2.3%
< 0.0%
Source: Bureau of Economic Analysis
FIGURE 5.6: Forecast Real Personal Income Growth, 2017-2022
Randolph
Hardy
Kanawha
GreenbrierFayette
Preston
Grant
Raleigh
Pocahontas
Boone
Clay
Wayne
Nicholas
Roane
LoganMingo
Pendleton
Webster
Lewis
BraxtonMason
Wood RitchieTucker
Monroe
Lincoln
Mercer
Hampshire
Jackson
Wirt
Wyoming
McDowell
Tyler
Wetzel
Gilmer
Harrison
Upshur
Marion
Putnam
Mineral
Cabell
Barbour
Marshall BerkeleyMonongalia
Morgan
Taylor
Ohio
Summers
Calhoun
Doddridge
Jefferson
Pleasants
Brooke
Hancock
1.0% - < 1.8%
≥ 2.3%
2017-22 Average Annual Personal Income Growth
1.8% - < 2.3%
< 1.0%
Source: WVU BBER County Econometric Model
FIGURE 5.7: West Virginia County Real Per Capita Income
JeffersonBerkeley KanawhaMorgan
CabellWoodMineral
FayetteHampshire
DoddridgeRaleighMason Marion
MonroeMonongaliaJackson
TaylorUpshur
WVMercer
Greenbrier
Wayne RandolphBarbour
BrookeNicholasWetzel OhioMcDowell LoganBraxton
Ritchie PocahontasCalhoun
Webster HarrisonHancockGilmer Hardy
PutnamPreston
PendletonWirt Pleasants
MarshallLincolnTuckerSummers RoaneMingo
TylerClayWyoming
Boone
LewisGrant
0.5%
1.0%
1.5%
2.0%
2.5%
3.0%
3.5%Average Annual Growth, % (2017-2022)
2016 Per Capita Income (ths $)Source: WVU BBER County Econometric Model

46 | WEST ViRGiNiA ECONOMiC OUTLOOK 2018-2022
FIGURE 6.1: West Virginia Small Business Births and Deaths
2.0
2.5
3.0
3.5
4.0
4.5
5.0Thousands
Deaths
Births
Source: US Small Business Administration Office of Advocacy
FIGURE 6.2: Small Business Net Growth
US
WV
-80
-60
-40
-20
0
20
40
60Net Change per 100,000 Residents
Source: US Small Business Administration Office of Advocacy
FIGURE 6.3: Small Businesses per 100,000 Residents, 2014
AK
HI
TX
CA
MT
AZ
ID
NV
NM
COIL
OR
UT
KS
WY
IANE
SD
MNND
OK
FL
WI
MO
WA
AL GA
AR
LA
MI
IN
PA
NY
NC
MS
TN
VAKY
OH
SC
ME
WV
MI VTNH
MD
NJ
MACT
DE
RI
DC
AK
US average =1,822> 2,500
1,600 - 2,000
Small Businesses per 100,000 residents
< 1,600
2,000 - 2,500
AK
Sources: Small Business Administration Office of Advocacy, Bureau of Economic Analysis
18. in this section we follow the standard US Small Business Administration approach of defining any business with less than 500 employees as a small business.
19. See www.sba.gov/advocacy for more information.
Small businesses play an important role in the US economy. According to the US Small Business Admin-istration (SBA), small businesses employ close to half of all private-sector workers in the US.18 SBA statis-tics also indicate that small businesses account for the vast majority of all businesses in the nation, and that small businesses are vital in terms of overall job creation.19 Furthermore, evidence shows that small businesses are important for fostering innovation and overall long-run economic growth. Overall, ensuring that an economic system’s foundation is fertile for small business prosperity and entrepreneurship is a crucial component of promoting economic develop-ment in the long run.
Given the potential importance of entrepreneurship and small business activity for an economy in the long run, we explore small business activity in West Virginia in this chapter. We examine a variety of met-rics, including small business counts, small business employment, and small business income.
SMALL BUSINESS BIRTHS AND DEATHSin Figure 6.1 we illustrate the overall number of business births and deaths in West Virginia over the past two decades or so. The periods in which births outnumber deaths, resulting in a net increase in the number of businesses, are illustrated by blue shad-ing, while red shading illustrates a net decline in the number of businesses. Unsurprisingly, the late-1990s showed a net gain in the number of businesses in the state, whereas the 2001 recession and the 2008-2009 recession resulted in significant net declines in the business counts. After the national recession ended, births picked up the pace in 2011 and 2012, but were still outnumbered by deaths. After the state economy slowed starting after 2012, business deaths out-num-bered births by a wider margin through 2015.
Overall business births and deaths largely reflect the business cycle. Through the late-1990s, around 4,500 new businesses were being created in the state annu-ally. That figure fell to around 3,000 during the mid-2000s, and further to the lower-2,000-range in the aftermath of the recent national recession. Starting in 2012 births averaged nearly 3,500 per year.
CHAPTER 6:
Small Business Activity in West Virginia

| 47Small Business Activity in West Virginia
in Figure 6.2 we illustrate the net change in small busi-nesses annually—scaled by population—over the past 15 years in West Virginia and nationally. This figure is simply the difference between small business births and business deaths presented in the previous figure. As illustrated, the US has typically enjoyed positive rate of net business creation since 2005 whereas West Virginia has lost businesses in most years since 2005.
in Figure 6.3 we illustrate the variation in the number of small businesses across states for 2014. As illustrated, West Virginia ranks in the lowest grouping, the third lowest to be exact, indicating a relatively small number of small businesses. States with the largest number of small businesses tend to cluster in the northwestern and northeastern parts of the US. A concentration of states with low numbers of small businesses can be found beginning in West Virginia and running through the south to Texas and the Southwest. Similarly, we illustrate how growth in the total number of small businesses has varied across states over the past decade or so in Figure 6.4. Here we see that West Virginia falls into the group of states that have seen an overall decline in the number of small businesses over the period. in fact, a further look at the data shows that West Virginia experienced the fastest decline of 1.3 percent per year. On the other hand, the highest growth rates tend to be found in the western states and in several of the southern and southeastern states.
SMALL BUSINESS EMPLOYMENTNext we turn to small business employment. Overall in 2014, small businesses in West Virginia employed about 290 thousand men and women, slightly below the level employed in the 2000s at around 300 thou-sand. Overall the stability in small business employ-ment, combined with the higher degree of volatility in small business births and deaths, discussed above, implies that most of the births and deaths likely involve relatively few workers. As illustrated in Figure 6.5, overall small businesses employed nearly 40 percent of the total West Virginia workforce in 2014. This figure is on par with the large business employment share, and nearly double the government employment share.
in Figure 6.6 we illustrate variation among the US states in terms of the overall share of private-sector employees who are employed by small businesses. in contrast to our earlier finding that West Virginia enjoys a relatively small number of small businesses relative to its population, here we see that West Virginia slightly exceeds the national average in terms of the overall number of private-sector workers in the state who are employed by small businesses. As illustrated, West Virginia falls into the second highest grouping of states with a rate of private-sector employment by small businesses of between 50 and 54 percent.
FIGURE 6.4: Growth in Small Business Counts, 2003-2014
AK
HI
TX
CA
MT
AZ
ID
NV
NM
COIL
OR
UT
KS
WY
IANE
SD
MNND
OK
FL
WI
MO
WA
AL GA
AR
LA
MI
IN
PA
NY
NC
MS
TN
VAKY
OH
SC
ME
WV
MI VTNH
MD
NJ
MACT
DE
RI
DC
US average = 0.1%≥ 0.7%
−0.4% - 0.0%0.1% - 0.6%
Small BusinessGrowth Rate2003-2014
≤ −0.5%
Source: US Bureau of Labor Statistics. Note: Growth rate calculations use average annualized growth.
FIGURE 6.5: Employment in West Virginia by Employer Type, 2014
Small Business39%
Large Business39%
Government22%
Source: US Small Business Administration Office of Advocacy; Bureau of Economic Analysis
FIGURE 6.6: Small Business Employment Share, 2014
US average = 48%> 54%
45% - 49%50% - 54%
Share of Employment by Small Business 2014
< 45%
HI
TX
CA
MT
AZ
ID
NV
NM
COIL
OR
UT
KS
WY
IANE
SD
MNND
OK
FL
WI
MO
WA
AL GA
AR
LA
MI
IN
PA
NY
NC
MS
TN
VAKY
OH
SC
ME
WV
MI VTNH
MD
NJ
MACT
DE
RI
DC
AKAK
HI
Source: US Small Business Administration Office of Advocacy

48 | WEST ViRGiNiA ECONOMiC OUTLOOK 2018-2022
in Figure 6.7 we illustrate small business employment in West Virginia by firm size. Of about 280 thousand workers in West Virginia who are employed by small businesses in 2014, around 27 thousand are employed in businesses with fewer than 5 employees. More than 77 thousand are employed in businesses with between 5 and 19 employees, making this the most common small business size by far. Further, as illus-trated, employment gradually declines as business size increases. More than 55 thousand are employed in businesses with between 20 and 49 employees, followed by nearly 43 thousand in businesses with between 50 and 99 employees, and so on. Small busi-nesses with between 300-399 and 400-499 workers employ fewer than 15 thousand employees in the state.
in Figure 6.8 we illustrate in more detail how the 2003 to 2014 changes in the small business employment in the state spread among businesses of different size. This figure ties closely to Figure 6.4 where it is shown West Virginia small business declined at the average rate of 1.3 percent per year. During this period, small business jobs in the state declined by more than 16 thousand. How-ever, as shown in Figure 6.8, the decline was observed in small businesses with less than 100 employees. The largest decline, of more than 5,500 job losses, occurred to businesses with fewer than five employees. The other categories shown lost around 4,500 to 5,000 each. On the other hand, small businesses with employees of 100 or more, in net gained nearly 3000 jobs.
SMALL BUSINESS INCOMENext we turn to small business income. As illustrated in Figure 6.9, small businesses in West Virginia gener-ate 31 percent of all of the wage and salary income in the state. The fact that this figure is smaller than the 39 percent of total employment by small businesses, reported above, implies that wage and salary income tends to be lower for workers at small businesses com-pared to those of large businesses and government.
Figure 6.10 depicts variation in the share of wages and salaries received by employees of small businesses as a share of total private-sector employees across the US states. in 2014, wages and salary from small businesses in West Virginia account for 43 percent of total wages and salary in the private sector. Similar to Figure 6.5, this is slightly above the national average of 41 percent.
Figures 6.11 and 6.12 offer alternative measures of entrepreneurship: patents and loans under $100,000 that are issued to small business. All measures control for the number of residents. As shown, in terms of pat-ents issued, West Virginia ranks in the lowest grouping among the US states. Similarly, in terms of the number of loans under $100,000 issued, West Virginia’s small business loan issuance rate is around 60 percent of the national average.
FIGURE 6.7: West Virginia Employment by Small Business Size, 2014
0
10
20
30
40
50
60
70
80
90
0-4 5-19 20-49 50-99 100-199 200-299 300-399 400-499Firm Size by Number of Employees
Employment (Thousands)
Source: US Small Business Administration Office of Advocacy
FIGURE 6.8: Employment Change between 2003 and 2014 by Business Size
-6
-5
-4
-3
-2
-1
0
1
2
3
4
0-4 5-9 10-19 20-99 100-499
Thousands
Source: US Small Business Administration Office of Advocacy
FIGURE 6.9: Wage and Salaries in West Virginia by Employer Type, 2014
Small Business31%
Large Business42%
Government27%
Source: US Small Business Administration Office of Advocacy; Bureau of Economic Analysis

| 49Small Business Activity in West Virginia
FIGURE 6.10: Share of Total Wages and Salaries by Small Businesses, 2014
HI
TX
CA
MT
AZ
ID
NV
NM
COIL
OR
UT
KS
WY
IANE
SD
MNND
OK
FL
WI
MO
WA
AL GA
AR
LA
MI
IN
PA
NY
NC
MS
TN
VAKY
OH
SC
ME
WV
MIVTNH
MD
NJ
MACT
DE
RI
DC
AK
US average = 41%> 45%
40% - 42%43% - 45%
Share of Wages and Salaries by Small Business, 2014
< 40%
Source: US Small Business Administration Office of Advocacy; Bureau of Economic Analysis
FIGURE 6.11: Patents Issued per 100,000 Residents, 2012-2015
US average = 48> 60
10 - 3030 - 60
Patents per 100,000 residents
< 10
AK
HI
TX
CA
MT
AZ
ID
NV
NM
COIL
OR
UT
KS
WY
IANE
SD
MNND
OK
FL
WI
MO
WA
AL GA
MI
IN
PA
NY
NCTN
VAKY
OH
SC
ME
MI VTNH
MD
NJ
MACT
DE
RI
DC
AK
AR
LA
MS
WV
Source: US Patent Office; Bureau of Economic Analysis
FIGURE 6.12: Loans Under $100,000 Issued for Small Business
0
200
400
600
800
1000
1200
1400
1600
1800
2000
2000 2010 2011 2012 2014
WVUS
Number of Loans per 100,000 Residents
Source: US Small Business Administration Office of Advocacy
go.wvu.edu/analytics
MASTER OF SCIENCE IN
BUSINESS DATA
ANALYTICSAt the intersection of prescriptive analytics and data science for
business, we enhance a student’s ability to use
analytics and data science techniques to support
informed business decisions.
Private Hadoop cluster for analyzing real client data sets
One and two-year options
Online hybrid program with on-campus residencies
Competitive tuition
WVU ALSO OFFERS THESEONLINE DEGREES:
Master of Business Administration Ranked among the best in the country by
U.S. News and World Report
Master of Science in Forensic and Fraud Examination
WVU is a leader in developingcurriculum used nationwide

50 | WEST ViRGiNiA ECONOMiC OUTLOOK 2018-2022
APPENDIX:
Works CitedAmerica’s Health Rankings. “Annual Report 2016.” August 2017. https://www.americashealthrankings.org/learn/reports/2016-annual-report.
Beasley, Blair, Matt Woerman, Anthony Paul, Dallas Burtraw, and Karen Palmer. “Mercury and Air Toxics Standards Analysis Deconstructed.” Washington DC: Resources for the Future, 2013. August 2014.
———. “Selected interest Rates”. United States Federal Reserve. August 2017. http://www.federalreserve.gov/releases/h15/current/.
Federal Housing Finance Agency. “House Price index Data Sets.” August 2017. http://www.fhfa.gov/DataTools/Down-loads/Pages/House-Price-index-Datasets.aspx.
iHS Markit. US Economic Outlook: July 2017. August 2017.
“index of Consumer Sentiment.” University of Michigan and Thompson Reuters. August 2017. http://www.sca.isr.umich.edu/tables.html
international Monetary Fund. “iMF World Economic Outlook (WEO) - Hopes, Realities, and Risks, April 2017.” August 2017. http://www.imf.org/external/pubs/ft/weo/2017/01/weodata/index.aspx.
McGraw Hill. “McGraw-Hill Construction Analytics.” July 2017. http://dodge.construction.com/analytics/default1.asp.
United States Bureau of Economic Analysis. “Quarterly State Personal income.” August 2017. https://www.bea.gov/iTable/index_regional.cfm.
———. “Real GDP by State.” July 20175. https://www.bea.gov/iTable/index_regional.cfm
United States Bureau of Labor Statistics. “Current Employment Statistics - CES (National).” United States Bureau of Labor Statistics. August 2017. http://www.bls.gov/ces/home.htm.
———. “Labor Force Statistics from the Current Population Survey.” August 2017. http://www.bls.gov/cps/.
———. “Local Area Unemployment Statistics.” August 2017. http://www.bls.gov/lau/.
———. “Quarterly Census of Employment and Wages.” August 2017. http://www.bls.gov/cew/.
United States Census Bureau. “Federal, State and Local Governments.” August 2017. https://www.census.gov/govs/.
———. “Foreign Trade: State Exports - West Virginia.” August 2017. http://www.census.gov/foreign-trade/statistics/state/data/wv.html.
———. “New Residential Construction.” August 2017. https://www.census.gov/construction/nrc/.
———. “Population Estimates.” July 1, 2016. August 2017. http://www.census.gov/popest/.
United States Centers for Disease Control. “National Vital Statistics System – Mortality Data.” August 2017. http://www.cdc.gov/nchs/deaths.htm.
United States Department of Commerce: international Trade Administration. “Trade Stats Express.” international Trade Administration. August 2017. http://tse.export.gov/TSE/TSEhome.aspx.
United States Department of Labor Employment and Training Administration. “Unemployment insurance Data.” August 2017. http://workforcesecurity.doleta.gov/unemploy/data.asp.
United States Energy information Administration. Annual Energy Outlook 2017. Washington, D.C.
———.”Electric Power Monthly.” US Energy information Administration. August 2017. http://www.eia.gov/electricity/monthly/.
———. “Form EiA-860 Detailed Data.” July 2017. http://www.eia.gov/electricity/data/eia860/index.html.
———. “Monthly Energy Review.” US Energy information Administration, July 2017. http://www.eia.gov/totalenergy/data/monthly/.
United States Environmental Protection Agency. “Clean Power Plan Final Rule – State-Specific Fact Sheets.” August 2015. http://www2.epa.gov/cleanpowerplantoolbox/clean-power-plan-state-specific-fact-sheets.
———. “Final Mercury and Air Toxics Standards (MATS) for Power Plants.” July 2013. http://www.epa.gov/mats/actions.html.
United States Mine Safety and Health Administration. “Employment Production Dataset.” August 2017. http://www.msha.gov/OpenGovernmentData/OGiMSHA.asp.
West Virginia Department of Environmental Protection. “Oil and Gas Production Data.” August 2017. http://www.dep.wv.gov/oil-and-gas/databaseinfo/Pages/default.aspx.
West Virginia University Bureau of Business and Economic Research. “Coal Production in West Virginia: 2017-2040.” West Virginia University. June 2017. http://business.wvu.edu/files/d/cbeb6e87-6e4a-4f7a-a781-3cc1b31326c5/coal-production-forecast-2017-2040.pdf.
Workforce West Virginia. “Employment and Wages.” August 2017. http://lmi.workforcewv.org/Employment_N_Wages/EnW.html


Bureau of Business and Economic ResearchPO Box 6527
Morgantown, WV 26506
(304) 293-7831 | bber.wvu.edu