Embed Size (px)
Citation preview

Investment Update AUMCPBO Annual Meeting September 2015
David Zellner Chief Investment Officer
© Wespath, a division of the General Board of Pension and Health Benefits of The United Methodist Church

2
Agenda
• Investment World View
• U.S. Economic Update
• Investment Market Performance Update
• 2015 Top 10 List Update

3
Investment World View
The world will continue to experience modest and
sustainable long-term growth driven by the emerging economies
of Asia, Latin America, Africa and Eastern Europe.

4
U.S. Economic Update

5
Employment Picture
6
2
4
6
8
10
12
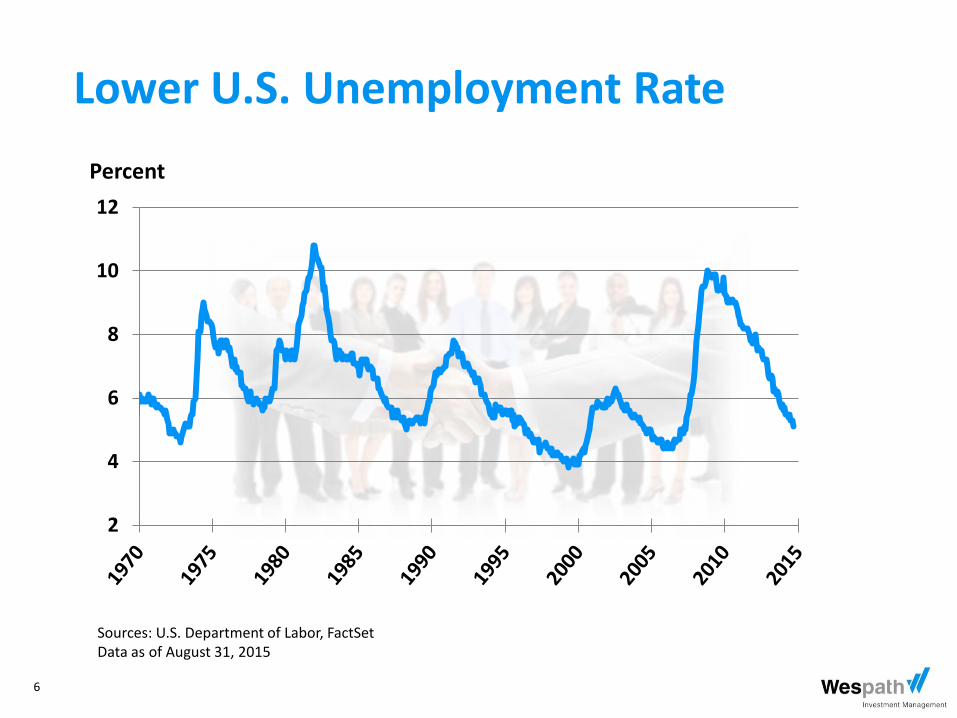
Lower U.S. Unemployment Rate
Sources: U.S. Department of Labor, FactSet Data as of August 31, 2015
Percent

7
100
200
300
400
500
600
700
Sources: U.S. Department of Labor, FactSet Data as of September 4, 2015
Fewer Unemployment Claims
Thousands

8
1,500
2,500
3,500
4,500
5,500
6,500
Job Openings Continue to Increase
Sources: Bureau of Labor Statistics, FactSet Data as of July 31, 2015
Thousands

9
55
60
65
70
62.6%
U.S. Civilian Labor Force Participation Rate
Sources: U.S. Department of Labor, FactSet Data as of August 31, 2015
Percent

10
Consumer Health

11
Consumer Credit Ratings Have Improved
680
685
690
695
700
Source: Fair Isaac Corporation Data as of April 2015
Average FICO Scores
12
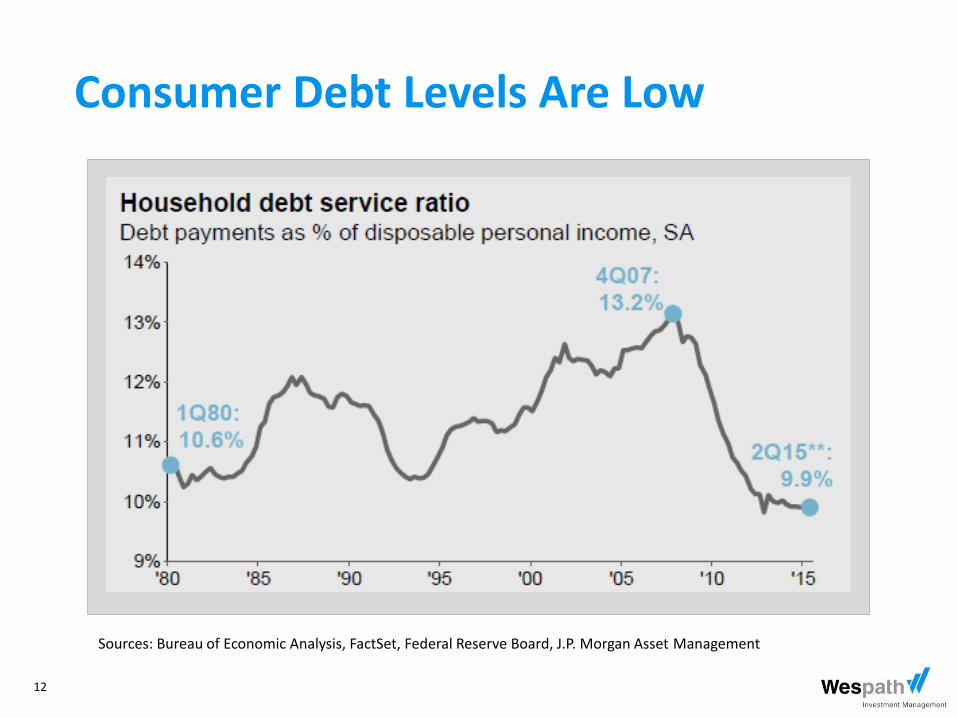
Sources: Bureau of Economic Analysis, FactSet, Federal Reserve Board, J.P. Morgan Asset Management
Consumer Debt Levels Are Low

13
Sources: Bureau of Economic Analysis, FactSet, Federal Reserve Board, J.P. Morgan Asset Management
Consumers Feel More Wealthy

14
S&P/Case-Shiller National Home Price Index
50
100
150
200
-27.3%
+29.6%
6.2% rise returns to July ’06 Levels
Source: S&P Dow Jones Indices; FactSet Data as of June 30, 2015

15
Sources: Census Bureau, J.P. Morgan Asset Management Data as of May 31, 2015.
Housing Remains Affordable

16
Sources: Bureau of Economic Analysis, FactSet; Census Bureau, J.P. Morgan Asset Management. U.S. Data as of June 30, 2015.
Auto Sales Have Improved
17
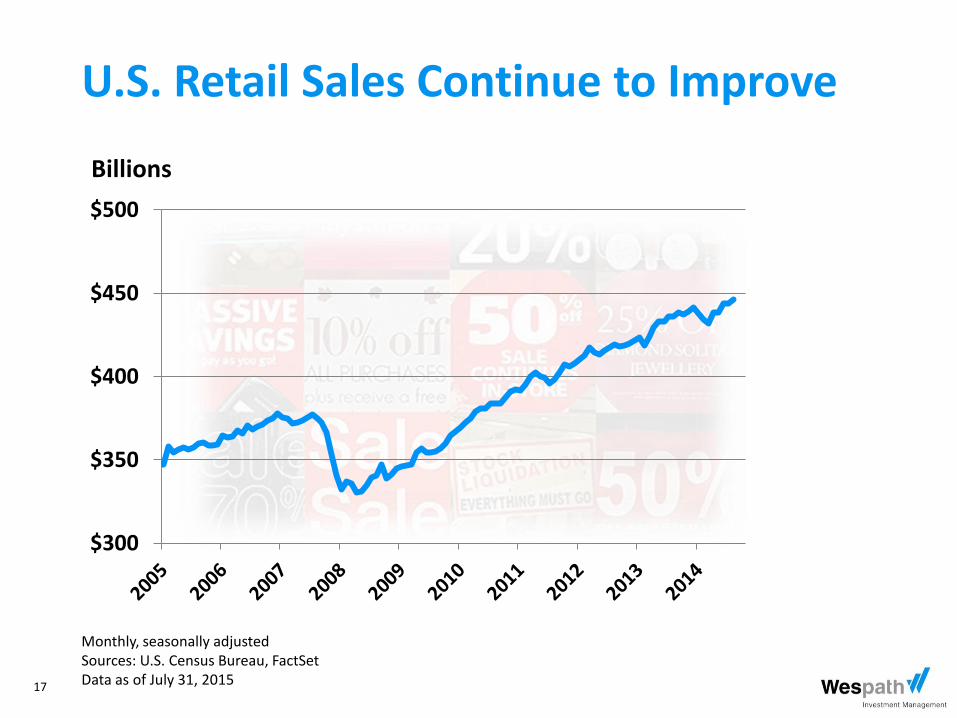
U.S. Retail Sales Continue to Improve
$300
$350
$400
$450
$500
Monthly, seasonally adjusted Sources: U.S. Census Bureau, FactSet Data as of July 31, 2015
Billions
18
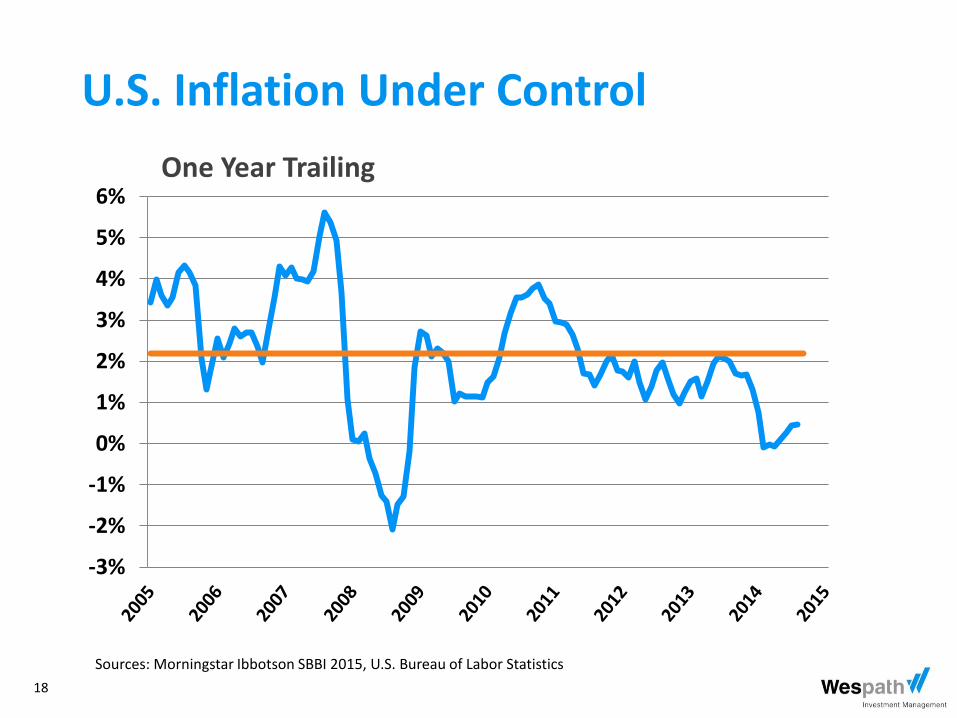
-3%
-2%
-1%
0%
1%
2%
3%
4%
5%
6%One Year Trailing
U.S. Inflation Under Control
Sources: Morningstar Ibbotson SBBI 2015, U.S. Bureau of Labor Statistics

19
U.S. Inflation
-6%
-4%
-2%
0%
2%
4%
6%
8%
20 Year Trailing
Citation: Lawrence H. Officer and Samuel H. Williamson, ‛The Annual Consumer Price Index for the United States, 1774-2014,’ MeasuringWorth, 2015
20
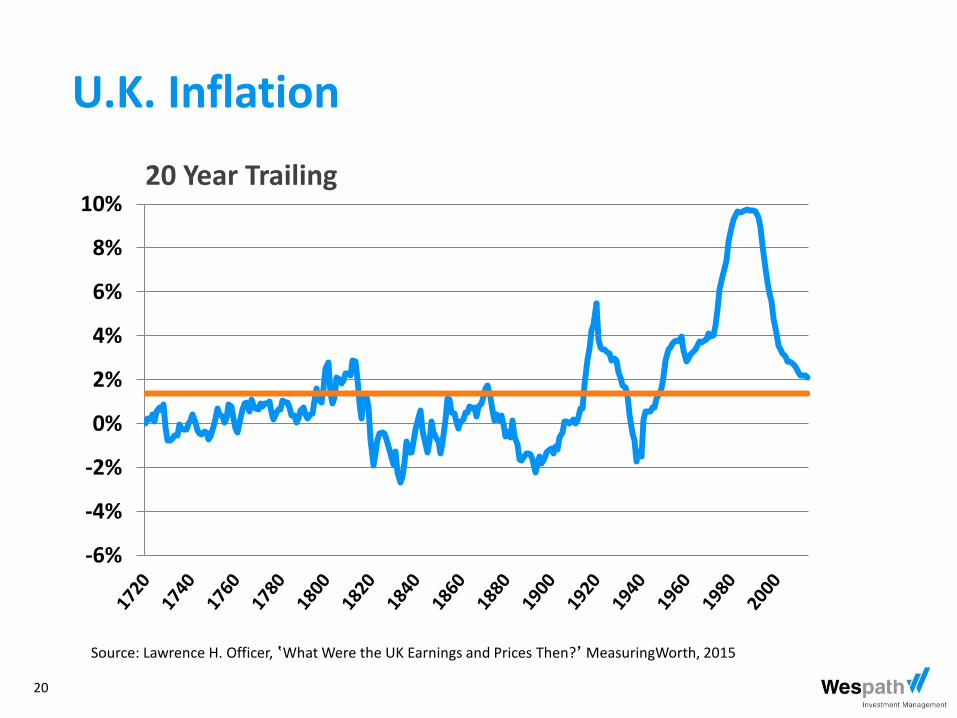
U.K. Inflation
-6%
-4%
-2%
0%
2%
4%
6%
8%
10%
Source: Lawrence H. Officer, ‛What Were the UK Earnings and Prices Then?’ MeasuringWorth, 2015
20 Year Trailing
21
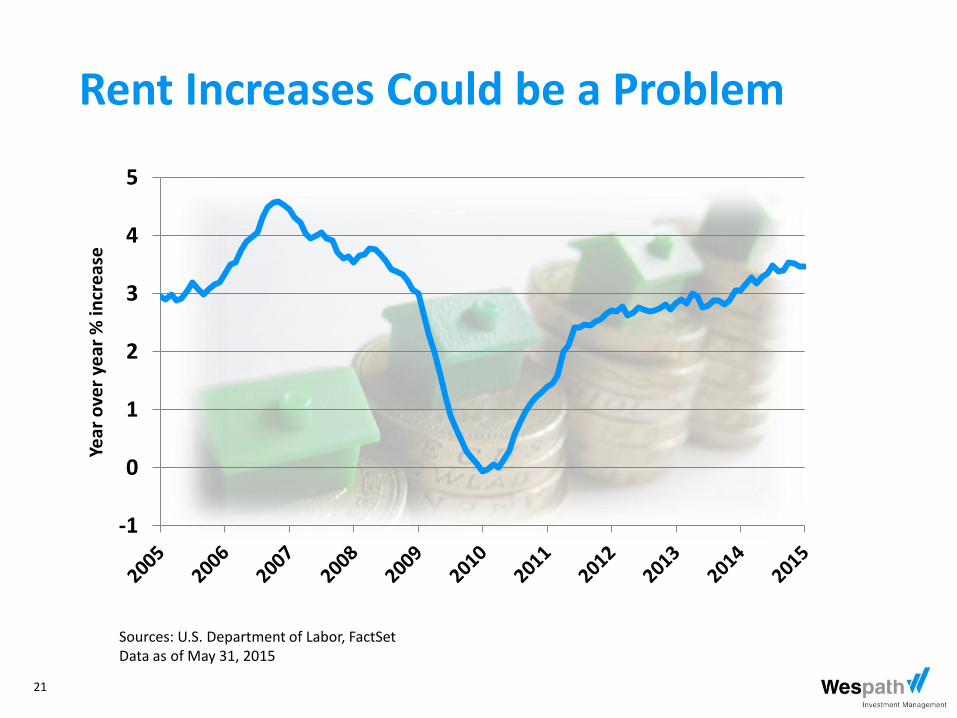
-1
0
1
2
3
4
5
Sources: U.S. Department of Labor, FactSet Data as of May 31, 2015
Rent Increases Could be a Problem Ye
ar o
ver
year
% in
cre
ase

22
Growth

23
U.S. Real Gross Domestic Product (GDP) Growth
-9%
-6%
-3%
0%
3%
6%
9%
Seasonally Adjusted Annual Rate Sources: Bureau of Economic Analysis, FactSet Data as of June 30, 2015

24
U.S. Dollar Index 2012 – 2015
70
80
90
100
110
Data as of September 14, 2015 Source: FactSet
25
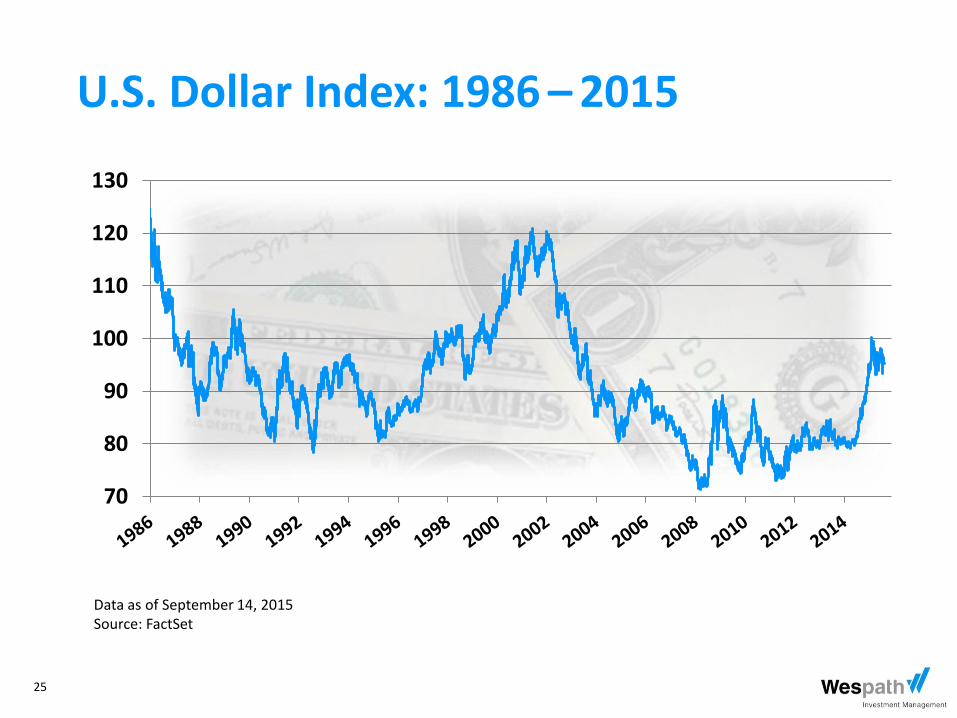
70
80
90
100
110
120
130
U.S. Dollar Index: 1986 – 2015
Data as of September 14, 2015 Source: FactSet
26
Investment Market Performance Update

27
S&P 500 Index
1,800
1,900
2,000
2,100
2,200
Sources: Standard & Poor’s, FactSet Data as of September 14, 2015
-12%

28
MSCI EAFE Index— Developed Countries (ex USA)
900
1,000
1,100
1,200
Sources: MSCI, FactSet Data as of September 14, 2015
-21%
29
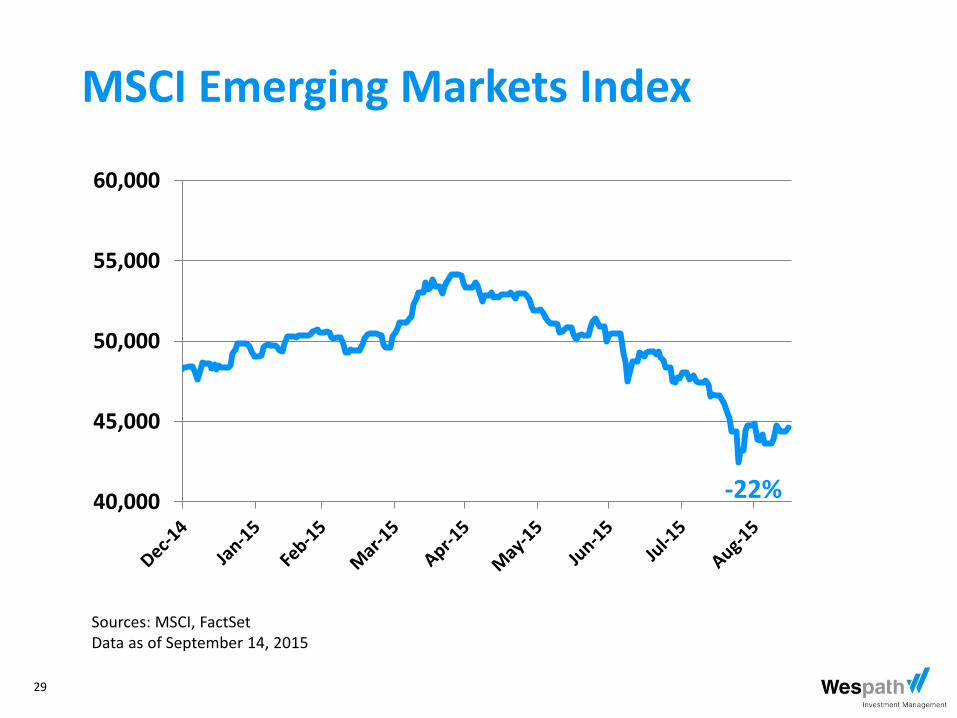
MSCI Emerging Markets Index
40,000
45,000
50,000
55,000
60,000
-22%
Sources: MSCI, FactSet Data as of September 14, 2015

30
Current U.S. Stock Valuations Are Reasonable
Sources: FactSet, FRB, Robert Shiller, Standard & Poor’s, J.P. Morgan Asset Management

31
U.S. Stock Market—Returns by Decade As of September 10, 2015
5.5%
3.1%
5.3%
4.1%
7.6%
-0.2%
15.4%
8.6%
2.3%
8.3% 7.2%
3.0%
13.7%
1.8%
13.4%
16.2%
8.2% 8.5%
13.9%
17.5%
1.4%
11.4%
-2%
0%
2%
4%
6%
8%
10%
12%
14%
16%
18%
20%
Compounded annual return for 10-year period ending specified year
Mean nominal compounded return = 7.8% (1801-2013)
Sources: Ibbotson Associates, Global Financial Data

32
1,000
2,000
3,000
4,000
5,000
6,000
Source: FactSet Data as of September 14, 2015
Shanghai Stock Exchange Composite Index

33
Shanghai Stock Exchange Composite Index
1,000
2,000
3,000
4,000
5,000
6,000
Source: FactSet Data as of September 14, 2015
June 2010 to Present
34
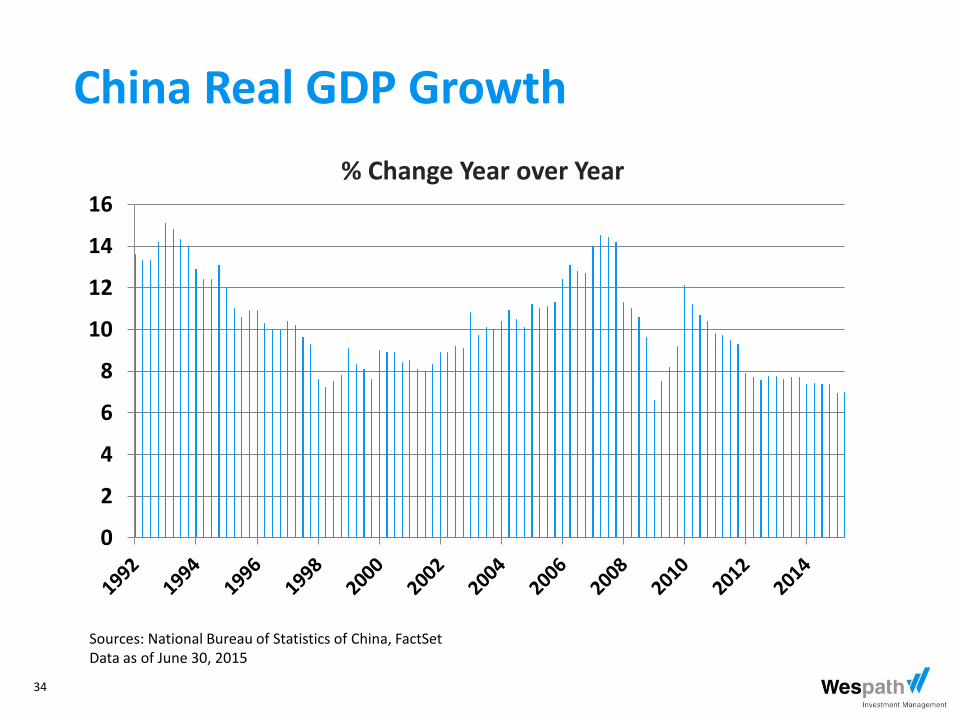
China Real GDP Growth
0
2
4
6
8
10
12
14
16
Sources: National Bureau of Statistics of China, FactSet Data as of June 30, 2015
% Change Year over Year

35
Update on World Economic Issues and Concerns for 2015
35

36
U.S. Public Pension Funding Crisis

37
88%
97%
70%
69%
72%
85%
77%
67%
73%
60%
61%
80% 100%
80%
79%
60%
66% 75%
58%
77%
81%
75% 100%
39%
58%
48%
65%
60%
66% 79%
85%
73%
63%
96%
66%
52%
60%
88%
Source: National Conference of State Legislatures, S&P, Pension and Investments, July 2015
VT 67%
NH 57%
MA 61%
RI 59%
CT 49%
NJ 64%
DE 88%
MD 65%
WV 67%
State Pension Funded Status

38
U.S. Debt Burden

39
Sources: U.S. Treasury, BEA, CBO, St. Louis Fed, J.P. Morgan Asset Management
January 2012 Forecast

40
Sources: U.S. Treasury, BEA, CBO, St. Louis Fed, J.P. Morgan Asset Management
June 2015 Forecast

41
Economic Growth in the Developing World

42
Source: www.twicsy.com

43
Sources: The Brookings Institution, World Bank, United Nations, J.P. Morgan Asset Management
Strong Long-Term Case for Developing Markets

44
U.S. Energy Renaissance

45
Oil Prices Remain Low
$35
$45
$55
$65
$75
$85
$95
$105
$115
Dec-13 Mar-14 Jun-14 Sep-14 Dec-14 Mar-15 Jun-15
Source: FactSet Data as of September 14, 2015

46
World’s Response to Climate Change

47
Paris U.N. Climate Change Conference November 30 – December 11, 2015

48
Eurozone Recovery and Threat of Deflation
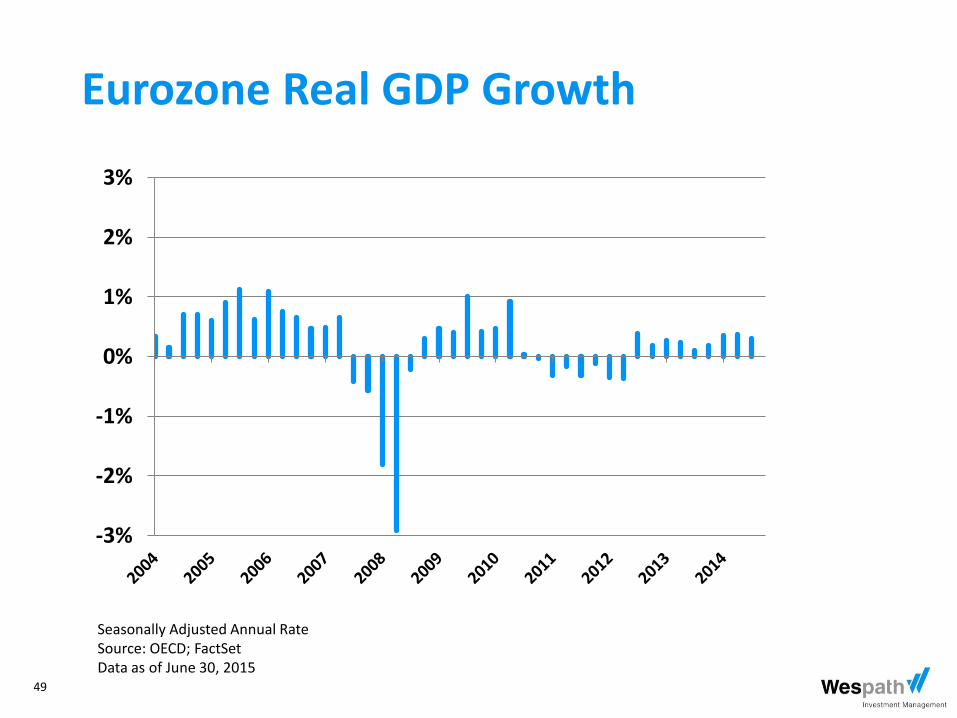
49
Eurozone Real GDP Growth
-3%
-2%
-1%
0%
1%
2%
3%
Seasonally Adjusted Annual Rate Source: OECD; FactSet Data as of June 30, 2015

50
Eurozone Inflation
-1%
0%
1%
2%
3%
4%
5%
Sources: Eurostat, FactSet Data as of August 31, 2015

51
Geopolitical Crises

52

wespath.com