Embed Size (px)
Citation preview

Wendy Talbot MPH, CHCA
Project Manager, Audits
Validation and Analysis of Performance Measures and
Results for all MCOs

Balanced Budget Act (BBA) 1997
The BBA requires that:
• States contract with an EQRO
• EQRO conducts annual independent review of each managed care organization (MCO) and pre-paid inpatient health plan (PIHP)
• Evaluates quality, access, and timeliness of health care services provided to Medicaid enrollees

BBA (cont)
Validation of Performance Measures
is one of the required activities
that an EQRO performs.

Validation of Performance Measures (PMs)
What is a Performance Measure?
A quantitative measurement by which goals are established and performance is assessed.

Validation of PMs (cont)
Performance Measure Characteristics:
• Standardized
• Clearly defined
• Meaningful and timely
• Results in comparable data

Validation of PMs (cont)
Why measure performance?
To obtain solid data to evaluate performance and make decisions on what improvements are necessary.

Validation of PMs (cont)
Final AHCA Required Performance Measures for Measurement Year 1:
– Non-Reform HMOs/PSNs – 10 HEDIS – Reform HMOs/PSNs – 10 HEDIS & 2
Agency-developed– PMHPs – 3 Agency-developed– CWPMHP – 2 Agency-developed– NHDPs – 4 Agency-developed

Validation of Performance Measures
HMOs/PSNs

HMOs/PSNs HEDIS Audits• Plans underwent HEDIS compliance
audits in Spring 2008• 13 HMOs and 6 PSNs
– 12 Non-Reform HMOs– 10 Reform HMOs– 1 Non-Reform PSN– 6 Reform PSNs
• Measures:– 10 HEDIS (Non-Reform & Reform)– 2 Agency-Defined (Reform)

Measures• HEDIS
– Well-Child Visits in the First Fifteen Months of Life (W15)
– Well-Child Visits in the Third, Fourth, Fifth, and Sixth Years of Life (W34)
– Adolescent Well Care Visits (AWC)– Annual Dental Visits (ADV)– Cervical Cancer Screening (CCS)– Prenatal and Postpartum Care (PPC)

Measures• HEDIS (cont)– Controlling High Blood Pressure (CBP)– Comprehensive Diabetes Care (CDC)– Follow-Up After Hospitalization for Mental
Illness (FUH)– Ambulatory Care (AMB)
• Agency-Defined– Smoking Cessation (SMO)– Use of Beta Agonist (UBE)
Audit Findings
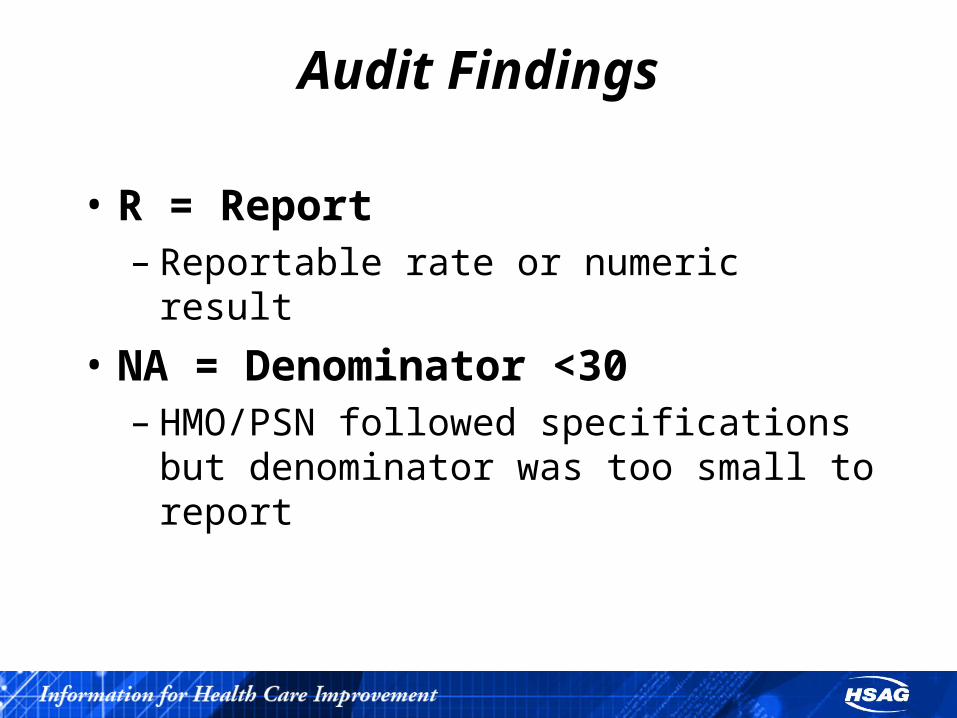
• R = Report– Reportable rate or numeric result
• NA = Denominator <30– HMO/PSN followed specifications but
denominator was too small to report
Audit Findings (cont)
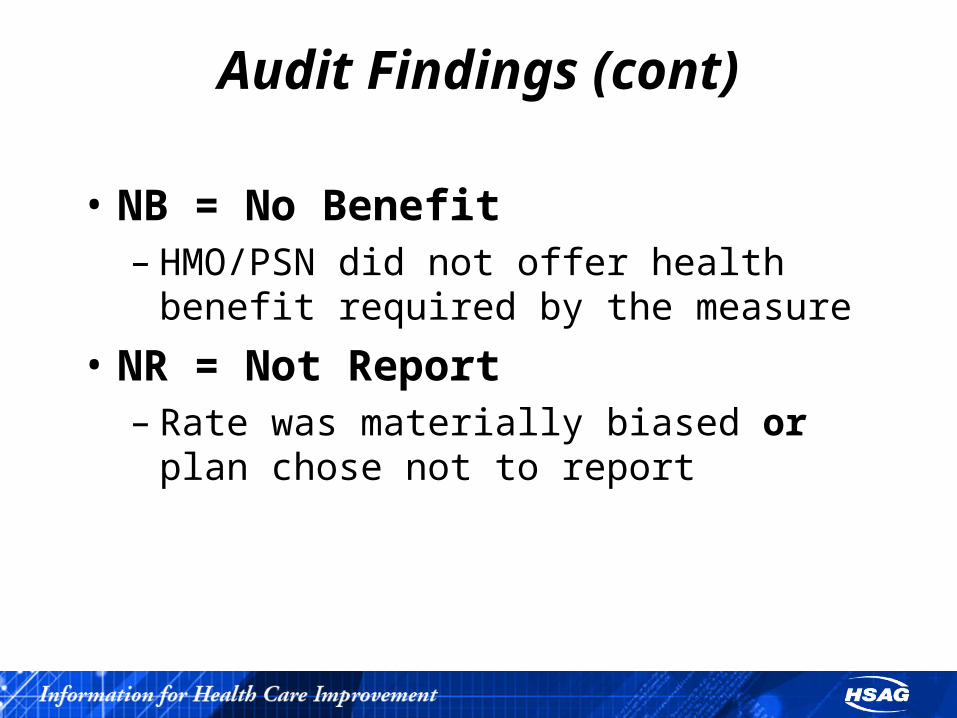
• NB = No Benefit– HMO/PSN did not offer health benefit
required by the measure
• NR = Not Report– Rate was materially biased or plan chose
not to report
Measure Specific Findings

Validation Findings Non-Reform HMOsR NA NB NR
W15 12 0 0 0
W34 12 0 0 0
AWC 12 0 0 0
ADV 2 0 7 3
CCS 12 0 0 0
PPC 11 1 0 0
CBP 11 1 0 0
CDC 11 1 0 0
FUH 10 2 0 0
AMB 12 0 0 0

Validation Findings Reform HMOs
R NA NB NRW15 6 4 0 0W34 9 1 0 0AWC 9 1 0 0ADV 8 0 0 2CCS 9 1 0 0PPC 7 3 0 0CBP 8 2 0 0CDC 8 2 0 0FUH 7 3 0 0AMB 9 1 0 0SMO 3 7 0 0UBE 2 6 0 2

Validation Findings PSNs
R NA NB NRW15 4 3 0 0W34 7 0 0 0AWC 7 0 0 0ADV 7 0 0 0CCS* 5 0 0 0PPC 5 2 0 0CBP* 5 1 0 0CDC 5 2 0 0FUH 4 2 1 0AMB 7 0 0 0SMO*† 3 2 0 0UBE*† 4 2 0 0
*Not required to be reported by PSNs who’s populations are specific to children† Reported by Reform PSNs only

Results

AnalyticsComparative
– Florida 2008 weighted average compared to the national 2007 Medicaid 50th percentile
– Florida 2008 weighted average compared to the 2007 weighted average
Distribution– Range of HMO/PSN reported rates

Comparison Graphs
-15% -10% -5% 0% 5% 10% 15% 20%
2008 FL Weighted Average Comparedto 2007 NCQA
Medicaid 50th Percentile
2008 FL Weighted Average Compared to
2007 FL Weighted Average

Distribution Graphs
0%
10%
20%
30%
40%
50%
60%
70%
80%
90%
100%
Measure 1 Measure 2
Highest Plan Rate Weighted Average Lowest Plan Rate
Highest Rate
Lowest Rate
FL Weighted Average
HighOutlier
LowOutlier

Pediatric Care

Pediatric CareThere were no significant specification changes in 2008 to any of the Pediatric Care measures
– Well-Child Visits in the First Fifteen Months of Life
– Well-Child Visits in the Third, Fourth, Fifth, and Sixth Years of Life
– Adolescent Well-Care Visits– Annual Dental Visits
Pediatric Care
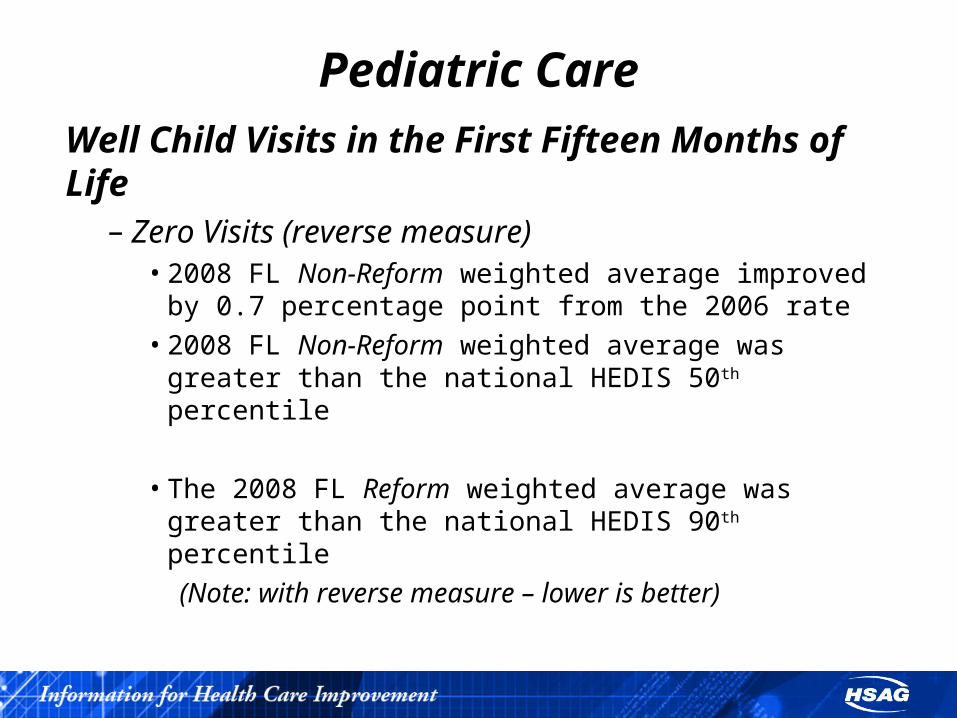
Well Child Visits in the First Fifteen Months of Life
– Zero Visits (reverse measure)• 2008 FL Non-Reform weighted average improved
by 0.7 percentage point from the 2006 rate • 2008 FL Non-Reform weighted average was
greater than the national HEDIS 50th percentile
• The 2008 FL Reform weighted average was greater than the national HEDIS 90th percentile
(Note: with reverse measure – lower is better)
Pediatric Care
Well Child Visits in the First Fifteen Months of Life
– Six or More Visits• 2008 FL Non-Reform weighted average improved
by 2.5 percentage points from the 2006 rate • 2008 FL Non-Reform weighted average was
lower than the national HEDIS 25th percentile
• 2008 FL Reform weighted average ranked below the national HEDIS 25th percentile
Pediatric CareWell Child Visits in the 3rd, 4th, 5th, & 6th Years of Life & Adolescent Well-Care Visits
• 2008 FL Non-Reform weighted average improved when compared to the 2006 rate
• 2008 FL Non-Reform weighted average ranked higher than the national HEDIS 50th percentile
• 2008 FL Reform weighted average also ranked higher than the national HEDIS 50th percentile

Pediatric CareAdolescent Well-Care Visits
• 2008 FL Non-Reform weighted average decreased from 2006
• 2008 FL Non-Reform weighted average ranked just below the national HEDIS 50th percentile
• 2008 FL Reform weighted average ranked above the national HEDIS 50th percentile

Pediatric CareAnnual Dental Visits
• 2008 FL Non-Reform weighted average ranked below national HEDIS 10th percentile
• 2008 FL Reform weighted average also ranked below the national HEDIS 10th percentile
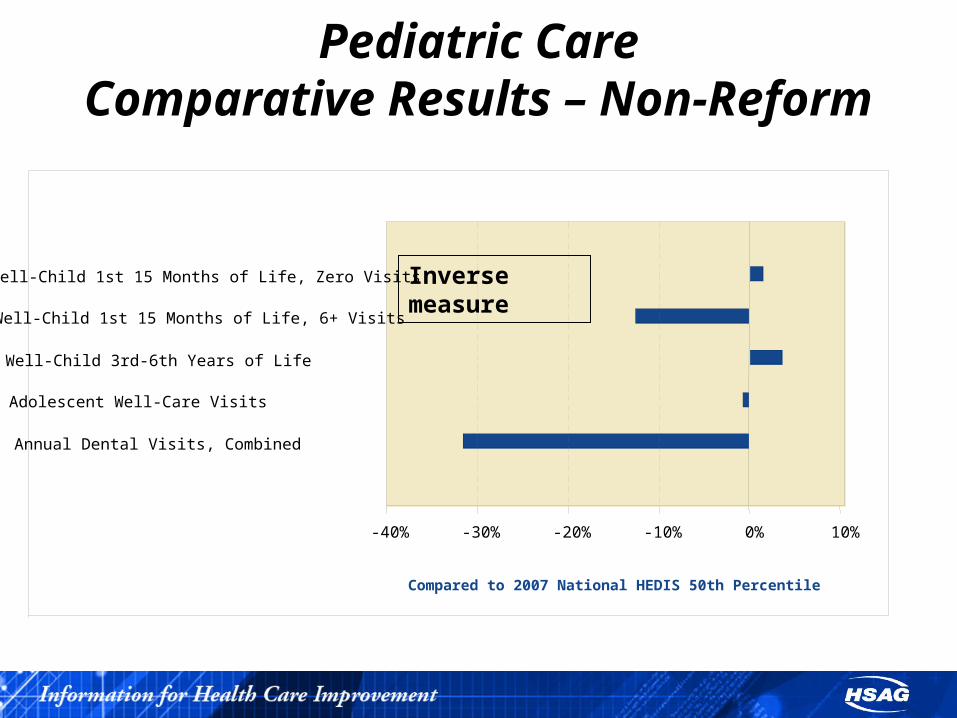
Pediatric CareComparative Results – Non-Reform
Compared to 2007 National HEDIS 50th Percentile
Annual Dental Visits, Combined
Adolescent Well-Care Visits
Well-Child 3rd-6th Years of Life
Well-Child 1st 15 Months of Life, 6+ Visits
Well-Child 1st 15 Months of Life, Zero Visits
-40% -30% -20% -10% 0% 10%
Inverse measure

Pediatric Care Range of 2008 Rates – Non-Reform

Pediatric CareComparative Results – Reform
Inverse measure
Compared to 2007 National HEDIS 50th Percentile
Annual Dental Visits, Combined
Adolescent Well-Care Visits
Well-Child 3rd-6th Years of Life
Well-Child 1st 15 Months of Life, 6+ Visits
Well-Child 1st 15 Months of Life, Zero Visits
-30% -20% -10% 0% 10%
Inverse measure
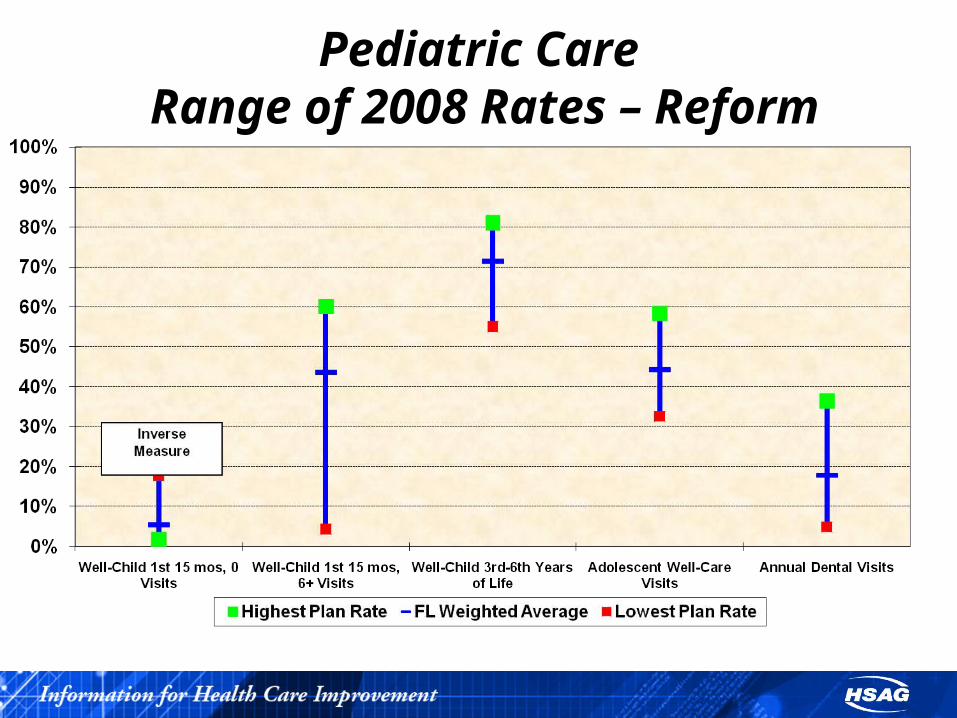
Pediatric Care Range of 2008 Rates – Reform
Pediatric Care
Improvement efforts to consider include:– Provider report cards– Missed opportunities– Research to determine if missing service
data are due to capitated providers– Have high performers present best
practices

Women’s Care

Women’s CareThere were no significant specification changes in 2008 to any of the Women’s Care measures
– Cervical Cancer Screening– Prenatal and Postpartum Care
Women’s Care
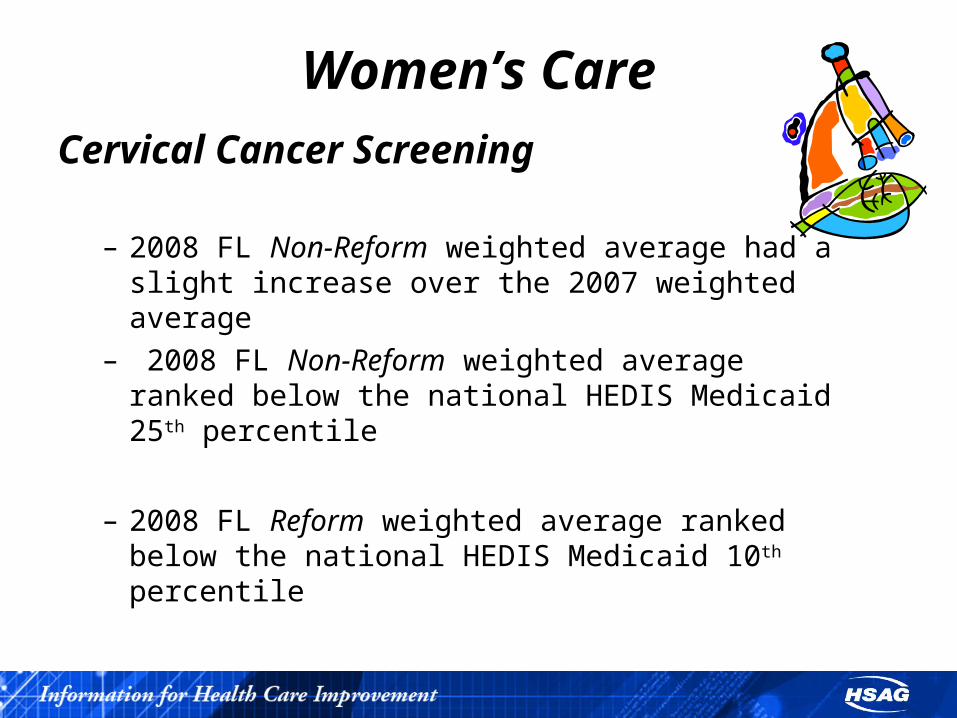
Cervical Cancer Screening
– 2008 FL Non-Reform weighted average had a slight increase over the 2007 weighted average
– 2008 FL Non-Reform weighted average ranked below the national HEDIS Medicaid 25th percentile
– 2008 FL Reform weighted average ranked below the national HEDIS Medicaid 10th percentile

Women’s CarePrenatal and Postpartum Care
– Timeliness of Prenatal Care• 2008 FL Non-Reform weighted average
increased by 8.2 percentage points compared to the 2007 rate
• 2008 FL Non-Reform weighted average ranked above the national HEDIS 10th percentile
• 2008 FL Reform weighted average ranked below the national HEDIS 10th percentile

Women’s CarePrenatal and Postpartum Care
– Postpartum Care
• 2008 FL Non-Reform weighted average ranked just below the national HEDIS 50th percentile
• 2008 FL Reform weighted average ranked below the national HEDIS 25th percentile

Women’s CareComparative Results – Non-Reform
Com pared to 2007 Florida Medicaid Weighted Average Com pared to 2007 National HEDIS 50th Percentile
Pos tpartum Care
Tim eliness of Prenatal Care
Cervical Cancer Screening
-15% -10% -5% 0% 5% 10%

Women’s CareRange of 2008 Rates – Non-Reform
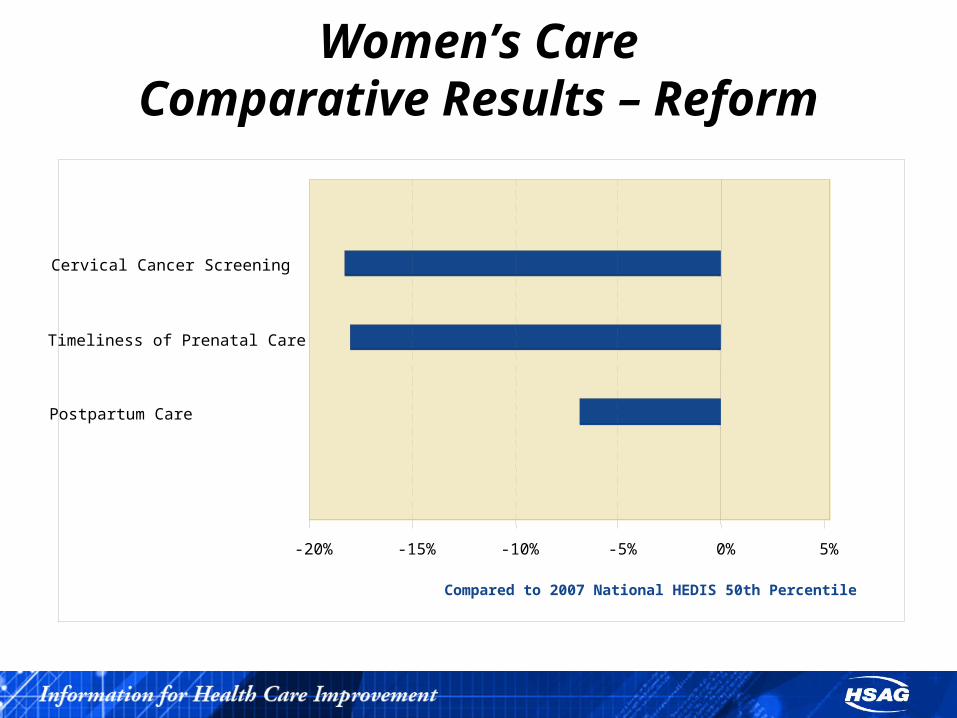
Women’s CareComparative Results – Reform
Compared to 2007 National HEDIS 50th Percentile
Postpartum Care
Timeliness of Prenatal Care
Cervical Cancer Screening
-20% -15% -10% -5% 0% 5%
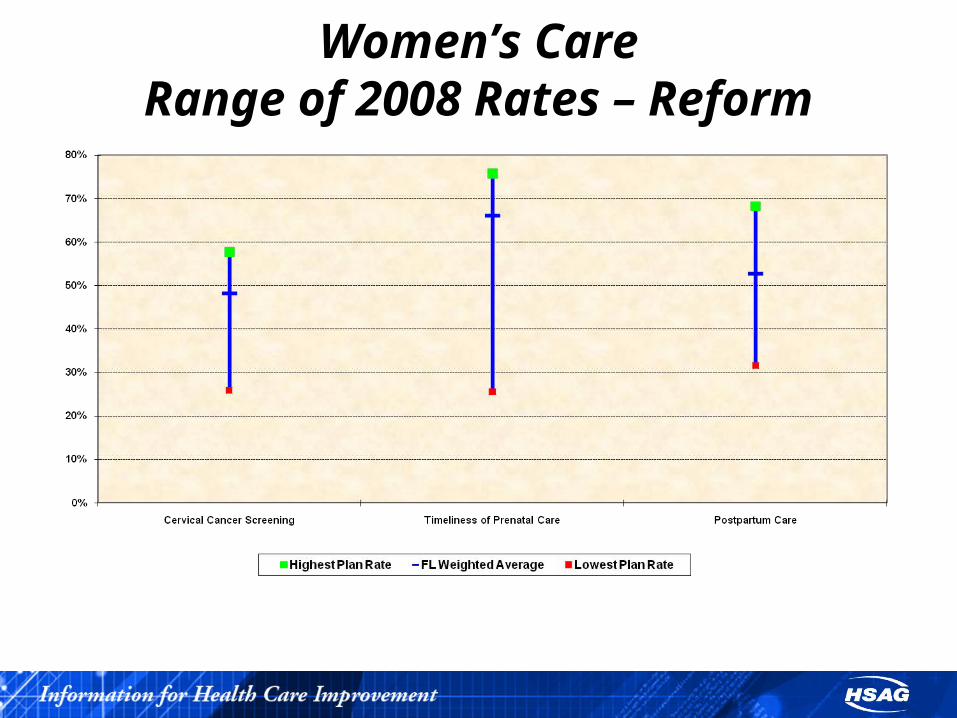
Women’s CareRange of 2008 Rates – Reform
Women’s Care
Improvement efforts to consider include:– Research challenges or barriers to obtaining
service evidence from:• Lab results• Missing detail on global bills• Mammography data
– Provider education if issues are identified (e.g. not performing postpartum visit in appropriate timeframe)

Living with Illness
Living with IllnessThere were no significant specification changes in 2008 to any of the Living with Illness measures
– Comprehensive Diabetes Care– Controlling High Blood Pressure (removed age
stratification)– Follow-Up After Hospitalization for a Mental Illness

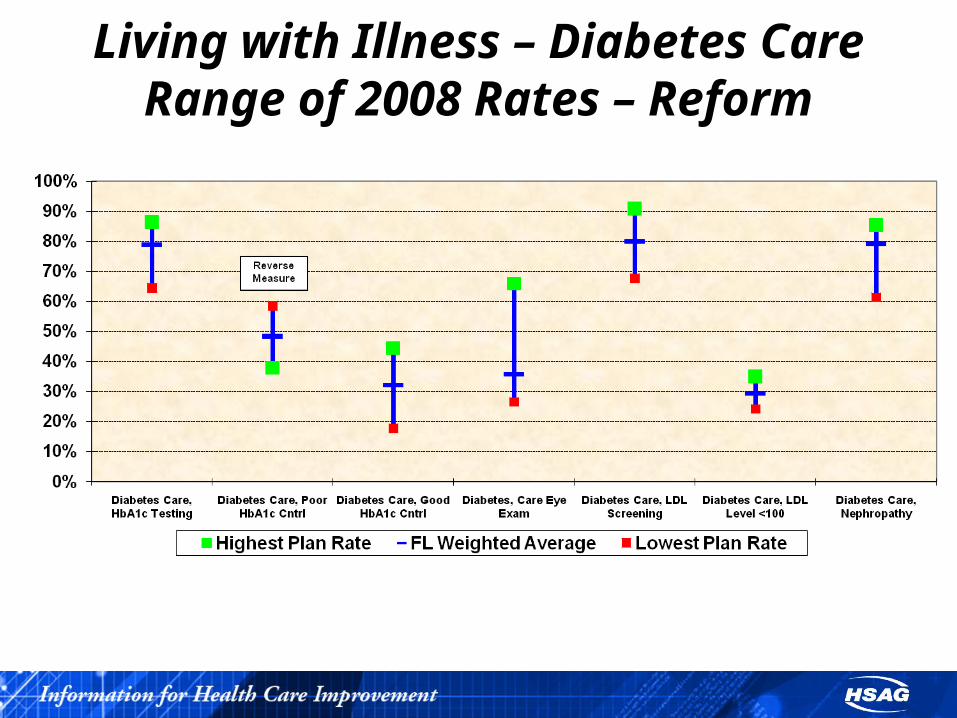
Living with IllnessComprehensive Diabetes Care
– HbA1c Testing• 2008 FL Non-Reform weighted average ranked
above the 25th percentile• 2008 FL Reform weighted average ranked
above the 50th percentile
– HbA1c Poor Control (reverse measure)• 2008 FL Non-Reform weighted average ranked
above the 50th percentile • 2008 FL Reform weighted average ranked
above the 50th percentile

Living with IllnessComprehensive Diabetes Care
– HbA1c Good Control• 2008 FL Non-Reform weighted average ranked
above the 50th percentile
• 2008 FL Reform weighted average ranked above the 50th percentile

Living with Illness
Comprehensive Diabetes Care– LDL-C Screening
• 2008 FL Non-Reform weighted average ranked above the 50th percentile
• 2008 FL Reform weighted average ranked above the 75th percentile
– LDL-C <100• 2008 FL Non-Reform weighted average ranked
above the 25th percentile• 2008 FL Reform weighted average ranked
above the 25th percentile

Living with Illness
Comprehensive Diabetes Care– Eye Exams
• 2008 FL Non-Reform weighted average ranked below the 25th percentile
• 2008 FL Reform weighted average ranked below the 25th percentile
– Nephropathy• 2008 FL Non-Reform weighted average ranked
above the 50th percentile• 2008 FL Reform weighted average ranked
above the 50th percentile

Living with Illness
Controlling High Blood Pressure
• 2008 FL Non-Reform weighted average increased by 6.5 percentage points from the 2007 weighted average
• 2008 FL Non-Reform weighted average ranked above the national HEDIS Medicaid 25th percentile
• 2008 FL Reform weighted average ranked below the national HEDIS Medicaid 25th percentile

Living with Illness
Follow-Up After Hospitalization for a Mental Illness
– 30-Day Rate• 2008 FL Non-Reform weighted average ranked
below the 25th percentile
• 2008 FL Reform weighted average ranked below the 25th percentile
Living with Illness
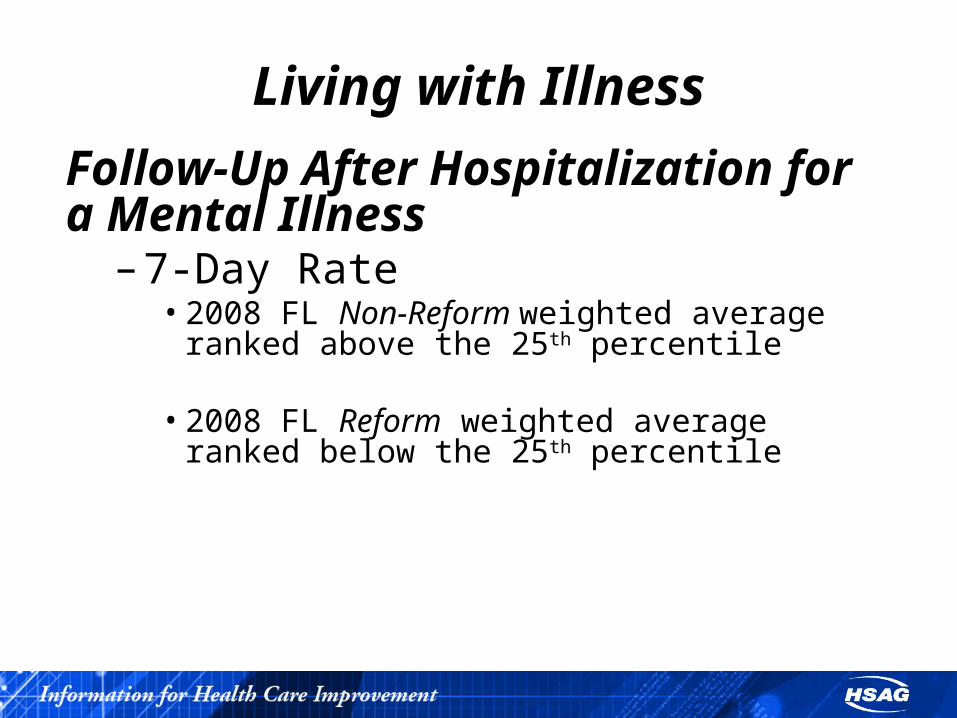
Follow-Up After Hospitalization for a Mental Illness
– 7-Day Rate• 2008 FL Non-Reform weighted average ranked
above the 25th percentile
• 2008 FL Reform weighted average ranked below the 25th percentile
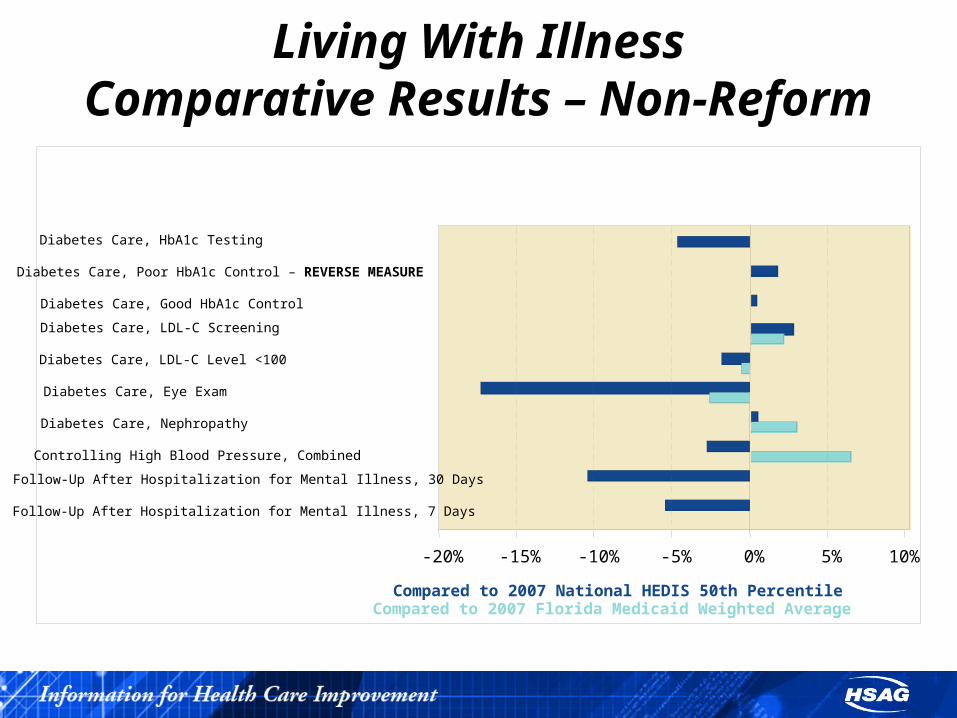
Living With IllnessComparative Results – Non-Reform
Compared to 2007 Florida Medicaid Weighted Average Compared to 2007 National HEDIS 50th Percentile
Follow-Up After Hospitalization for Mental Illness, 7 Days
Follow-Up After Hospitalization for Mental Illness, 30 Days
Controlling High Blood Pressure, Combined
Diabetes Care, Nephropathy
Diabetes Care, Eye Exam
Diabetes Care, LDL-C Level <100
Diabetes Care, LDL-C Screening
Diabetes Care, Good HbA1c Control
Diabetes Care, Poor HbA1c Control – REVERSE MEASURE
Diabetes Care, HbA1c Testing
-20% -15% -10% -5% 0% 5% 10%

Living with Illness – Diabetes CareRange of 2008 Rates – Non-Reform
0%
10%
20%
30%
40%
50%
60%
70%
80%
90%
100%
Diabetes Care, HbA1c Testing
Diabetes Care, Poor HbA1c Cntrl
Diabetes Care, Good HbA1c Cntrl
Diabetes, Care Eye Exam
Diabetes Care, LDL Screening
Diabetes Care, LDL Level <100
Diabetes Care, Nephropathy
Highest Plan Rate FL Weighted Average Lowest Plan Rate
ReverseMeasure

Living with IllnessRange of 2008 Rates – Non-Reform, cont’d
0%
10%
20%
30%
40%
50%
60%
70%
80%
90%
100%
Controlling High Blood Pressure, Combined
Follow-Up After Mental Illness, 30-day Follow-Up After Mental Illness, 7-day
Highest Plan Rate FL Weighted Average Lowest Plan Rate

Living With IllnessComparative Results – Reform
Compared to 2007 National HEDIS 50th Percentile
Follow-Up After Hospitalization for Mental Illness, 7 Days
Follow-Up After Hospitalization for Mental Illness, 30 Days
Controlling High Blood Pressure, Combined
Diabetes Care, Nephropathy
Diabetes Care, Eye Exam
Diabetes Care, LDL-C Level <100
Diabetes Care, LDL-C Screening
Diabetes Care, Good HbA1c Control
Diabetes Care, Poor HbA1c Control – REVERSE MEASURE
Diabetes Care, HbA1c Testing
-25% -20% -15% -10% -5% 0% 5% 10%
Living with Illness – Diabetes CareRange of 2008 Rates – Reform
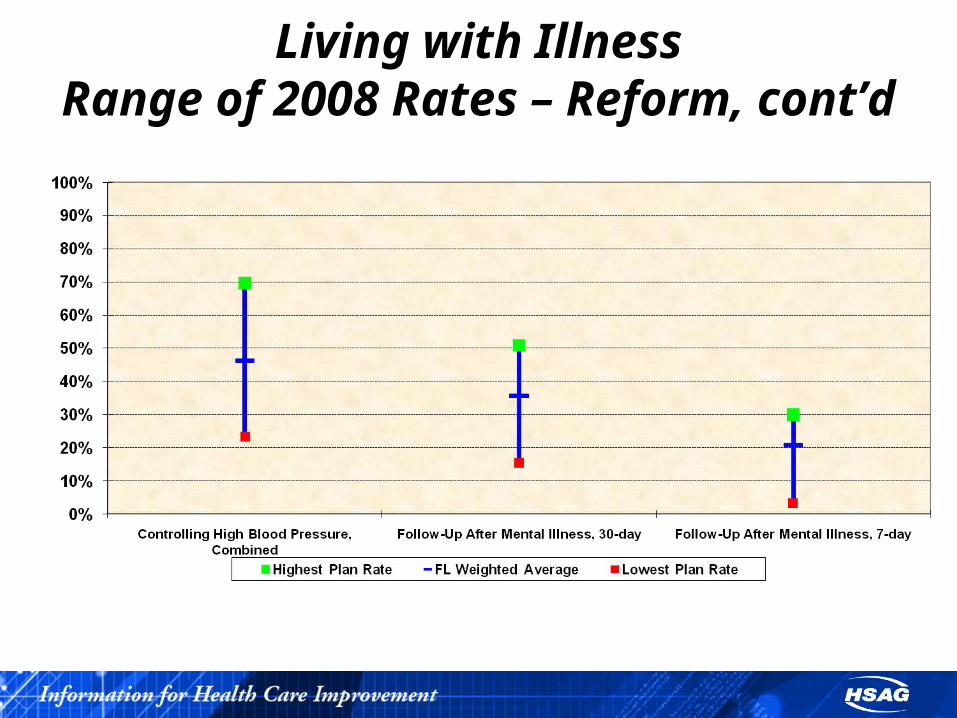
Living with IllnessRange of 2008 Rates – Reform, cont’d

Living With Illness
Improvement efforts to consider include:– Research barriers to obtaining complete
lab and pharmacy data– Provider education on clinical guidelines if
necessary– Provider report cards or incentives for high
performers

Performance Measure Validation (PMV)PMHPs/CWPMHP

PMHPs/CWPMHP PMV Audits
• Site visits occurred May-June 2008
• 5 PMHPs and 1 CWPMHP
• 3 Measures– Follow-up within seven days after acute
care discharge for a mental health diagnosis (PMHP1)
– Thirty-day readmission rate (PMHP2)– Number of enrollees admitted to State
mental health treatment facilities* (PMHP3)
*CWPMHP was not required to report this measure

Measure Specific Findings

Follow-Up Within Seven Days After Acute Care Discharge for a Mental Health Diagnosis
• 5 out of 5 PMHPs received Fully Compliant for this measure
• 1 out of 1 CWPMHP received Fully Compliant for this measure
• 3 numerators reported for measure – Follow-Up with Mental Health Practitioner– Follow-Up with Mental Health
Practitioner/Case Manager– Follow-Up with Case Manager

PMHP1 Rate Ranges
• Follow-up with a mental health practitioner:– 10.98% to 31.22%
• Follow-up with a mental health practitioner and/or case manager:– 11.82% to 55.18%
• Follow-up with case manager:– 3.98% to 42.81%
Thirty-day Readmission Rate
• 5 out of 5 PMHPs received Fully Compliant for this measure
• 1 out of 1 CWPMHP received Fully Compliant for this measure

PMHP2 Rate Range
• Thirty-day readmission rate:– 15.67% to 30.22%

Number of Enrollees Admitted to State Mental Health Treatment Facilities
• 4 out of 5 PMHPs received Substantially Compliant for this measure
• 1 PMHP received Not Valid for this measure
• CWPMHP was not required to report this measure

PMHP3 Rate Range
• Number of enrollees admitted to state mental health treatment facilities:– 0.00% to 0.12%*
* Data for this measure were obtained from a third party and HSAG was unable to validate the original source data to ensure the reported rates were accurate
Overall Findings
• All PMHPs and the CWPMHP were able to report valid rates for two out of three measures
• Overall performance was average, with room for improvement
• PMHPs did not have access to all of the data necessary to calculate certain measures - this should be considered when selecting future measures
Performance Measure Validation (PMV)
NHDPs

NHDP PMV Audit
• Onsite audits occurred October-November 2008
• 13 NHDPs
• 4 measures– Disenrollment Rate– Retention Rate– Voluntary Disenrollment Rate– Average Length of Enrollment before
Voluntary Disenrollment
Preliminary Findings
• Review of documentation and interviews with key staff revealed measures were being calculated correctly
• Source code review indicated specifications were being followed
• No final determination on rates until final rates are submitted in 2009

Next Steps
• Rates due to AHCA/DOEA and HSAG March 2, 2009
• Draft reports due to AHCA/DOEA on March 16, 2009
• Final reports due to AHCA/DOEA on April 21, 2009

Questions?