Embed Size (px)
Citation preview

57%$16,3
51
$5,8
84
2013
Employer Health Benefits2 0 1 3 A N N U A L S U R V E Y
sect ion
Wellness Programs and Health RiskAssessments
12

Employer Health Benefits 2 0 1 3 An n u a l S u r vey
T H E K A I S E R FA M I LY F O U N D AT I O N - A N D - H E A LT H R E S E A R C H & E D U C AT I O N A L T R U S T
201
12
section
twelve
Wellness Program
s and Health R
isk Assessm
ents
Section Twelve: Wellness Programs and Health Risk Assessments A majority of firms offering health benefits offers some type of wellness program, with
large firms (200 or more workers) being more likely than smaller firms (3-199 workers) to
do so. Thirty-six percent of large firms and 8% of small firms offering at least one
wellness benefit offer financial incentives to employees who participate in wellness
programs. Twenty-four percent of firms offer employees the opportunity to complete
health risk assessments, with some of these firms tying financial penalties or rewards to
employees who do so. Disease management programs remain common among firms
offering health benefits with over half of these firms and more than three-quarters of
large firms (200 or more workers) having at least one of the specified programs. Wellness Benefits For a variety of reasons, including efforts to improve health and lower costs, many
employers and health plans offer wellness programs. Wellness programs may range from classes in nutrition or healthy living to a wellness newsletter. o Seventy-seven percent of firms offering health benefits offer at least one of the
following wellness programs:
Weight loss programs Biometric screenings Gym membership discounts or on-site exercise facilities Smoking cessation program Lifestyle or behavioral coaching, classes in nutrition or healthy
living Web-based resources for healthy living Flu shot or vaccinations Employee assistance program (EAP) Wellness newsletter
o In the 2012 survey, offering firms were not asked if they offered an “EAP” or “flu
shots and vaccinations”. Excluding these two categories, 69% of all firms offering health benefits also offered one of the listed wellness programs in 2013, similar to the amount in 2012 (63%).
o Large firms (200 or more workers) offering health benefits are more likely to offer
each of the listed wellness programs than smaller firms. In addition, large firms (200 or more workers) offering health benefits are more likely to offer at least one of the listed wellness programs than smaller firms (99% vs. 76%) (Exhibit 12.2).
section
twelve
Wellness Program
s and Health R
isk Assessm
entsEmployer Health Benefits 2 0 1 3 An n u a l S u r vey
T H E K A I S E R FA M I LY F O U N D AT I O N - A N D - H E A LT H R E S E A R C H & E D U C AT I O N A L T R U S T
12
202
o About half of firms offering health benefits offer flu shots or vaccinations (54%), a wellness newsletter (48%) or web-based resources for healthy living (47%). The offer rate for each type of wellness benefit included in the survey is presented in Exhibit 12.1, Exhibit 12.2 and Exhibit 12.3.
o Forty-eight percent of firms offering health benefits and at least one wellness benefit offer wellness benefits to spouses or dependents. Large firms (200 or more workers) offering at least one wellness benefit are more likely than smaller firms to offer wellness benefits to spouses or dependents (65% vs. 47%) (Exhibit 12.4).
o Among firms offering health benefits and at least one wellness program, 80% report that most of the wellness benefits they offer are provided by the health plan (Exhibit 12.4).1 Small firms (3 to 199 workers) are more likely than larger firms to report that most wellness programs are provided by the health plan (81% vs. 56%) (Exhibit 12.4).
Incentives for Wellness benefits: In order to encourage participation in wellness programs, firms may offer financial
incentives to employees who participate.2
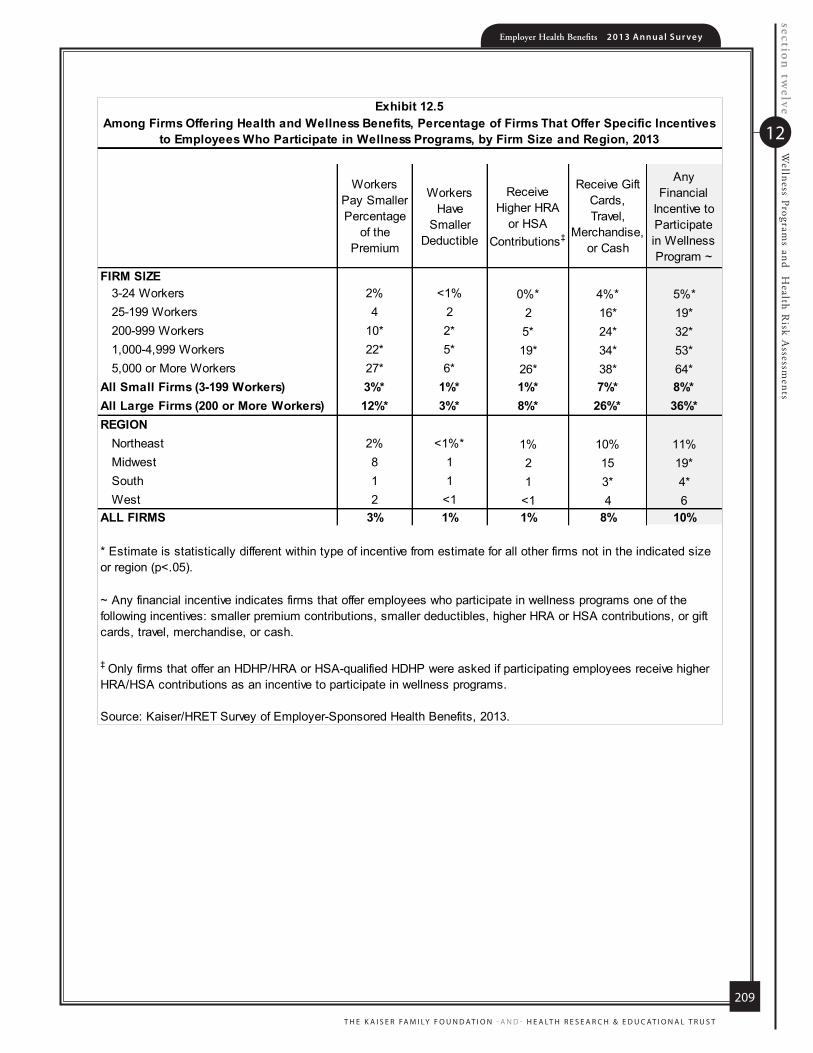
o Eight percent of firms offering health benefits and at least one of the listed wellness programs offer gift cards, travel, merchandise, or cash to workers who participate in wellness programs. Large firms (200 or more workers) are more likely to offer these incentives than smaller firms (26% vs. 7%) (Exhibit 12.5).
o A small percentage of firms offering health benefits and at least one of the listed
wellness programs offers lower worker premium contributions (3%) or cost sharing (such as lower deductibles) (1%) as an incentive to encourage employees to participate. Among firms that offer a high-deductible health plan paired with a HRA or HSA, one percent offers workers who participate in wellness programs higher HSA or HRA contributions (Exhibit 12.5).
Employers use a variety of strategies to promote wellness programs. Large
employers (200 or more employees) offering health benefits and at least one wellness program are more likely than smaller employers to use one of the following strategies to promote wellness (79% vs. 55%) (exhibit 12.11):
o Assigning an employee to promote wellness o Access to a benefits counselor o Incentives o Personalized communication o Team competitions o Social media tools
1 The survey asks firms offering at least one wellness program if most of the wellness benefits are provided by the health plan or by the firm. 2 Firms that offer only web-based resources or a wellness newsletter were not asked questions about any financial incentives provided.

Employer Health Benefits 2 0 1 3 An n u a l S u r vey
T H E K A I S E R FA M I LY F O U N D AT I O N - A N D - H E A LT H R E S E A R C H & E D U C AT I O N A L T R U S T
203
12
section
twelve
Wellness Program
s and Health R
isk Assessm
ents
Nearly half of large firms (200 or more workers) offering health benefits and at least one wellness program use personalized communication (49%) or assign an employee (45%) to promote wellness programs.
Employers use a range of strategies to evaluate wellness programs. Seventy-two
percent of large firms (200 or more workers) offering health benefits and at least one wellness program and 34% of smaller firms use at least one of the following evaluation methods (Exhibit 12.12):
o Return on investment o Health outcomes o Employee retention o Employee participation o Employee satisfaction
For large firms (200 or more workers) offering health benefits and at least one
wellness benefit, employee participation is the most common metric (65%) (Exhibit 12.12).
Health Risk Assessments Some firms give their employees the opportunity to complete a health risk
assessment to identify potential health issues. Health risk assessments generally include questions about medical history, health status, and lifestyle. o Overall, 24% of firms offering health benefits ask their employees to complete a
health risk assessment. Large firms (200 or more workers) are more likely than smaller firms to offer employees this option (55% vs. 23%) (Exhibit 12.6).
Some firms offer financial incentives to encourage employees to complete health risk
assessments.
o Fifty-four percent of large firms (200 or more workers) offering health benefits and health risk assessments give financial incentives to employees who complete a health risk assessment.
o Five percent of large firms (200 or more workers) who offer health benefits and
health risk assessments require employees to complete a health risk assessment in order to enroll in a health plan.
o Nine percent of large firms (200 or more workers) that offer health benefits and
provide employees the opportunity to complete a health risk assessment penalize employees with identified health risks factors who do not complete a wellness program (9%) (Exhibit 12.7).
Biometric Screening Biometric screening is a health examination that measures an employee's risk factors, such as cholesterol, blood pressure, stress, and nutrition. Biometric outcomes may include meeting a target body mass index (BMI) or cholesterol level. Twenty-six percent

section
twelve
Wellness Program
s and Health R
isk Assessm
entsEmployer Health Benefits 2 0 1 3 An n u a l S u r vey
T H E K A I S E R FA M I LY F O U N D AT I O N - A N D - H E A LT H R E S E A R C H & E D U C AT I O N A L T R U S T
12
204
of small firms (3 to 199 workers) and 55% of larger firms offering health benefits offer biometric screenings as a wellness benefit (Exhibit 12.1). Firms which offer their employees biometric screenings may include additional incentives for those employees who complete screenings. Among large firms (200 or more workers) offering health benefits and biometric screenings, eleven percent reward or penalize employees for meeting biometric outcomes and eleven percent require employees to complete biometric screenings in order to enroll in a health plan (Exhibit 12.14). Disease Management Disease management programs try to improve the health of and reduce the
associated costs of people with chronic illnesses by teaching patients about their disease, suggesting treatment options, and assessing the treatment process and outcomes. o Fifty-seven percent of firms offering health benefits offers one or more of the
following disease management programs in their largest plan3 (Exhibit 12.8):
Diabetes Asthma Hypertension High cholesterol Lower back pain Depression Obesity
o Large firms (200 or more workers) offering health benefits are more likely than smaller firms to have a disease management program (77% vs. 57%) (Exhibit 12.9). Seventy-three percent of large firms offering health benefits have a disease management program for diabetes.
o To encourage participation, two percent of firms offering health benefits and at least one of the specified disease management programs also offer financial incentives to employees who participate in these programs (Exhibit 12.10). Large, offering firms (200 or more workers) that offer disease management programs are more likely than smaller firms to have an incentive for participating in a disease management program (8% vs. 2%).
3 In 2013, firms were asked if they offer each of the specified disease management programs. In previous years, firms were asked if they offered a disease management program and then were accordingly asked about specified programs. For this reasons, the estimate of the number of firms offering a disease management program in 2013 is not comparable to the estimates from 2010 and 2008.
Gym
M
embe
rshi
p D
isco
unts
or
On-
Site
E
xerc
ise
Faci
litie
s
Sm
okin
g C
essa
tion
Pro
gram
Web
-bas
ed
Res
ourc
es fo
r H
ealth
y Li
ving
Wel
lnes
s N
ewsl
ette
r
Life
styl
e or
B
ehav
iora
l C
oach
ing
Bio
met
ric
Scr
eeni
ng^
Wei
ght L
oss
Pro
gram
s
FIRM
SIZ
E3-
24 W
orke
rs15
%*
36%
*41
%*
44%
*30
%*
24%
29%
*25
-199
Wor
kers
42*
49*
64*
59*
4033
3920
0-99
9 W
orke
rs67
*69
*76
*60
*54
*52
*56
*1,
000-
4,99
9 W
orke
rs75
*76
*87
*61
*69
*67
*67
*5,
000
or M
ore
Wor
kers
84*
91*
93*
66*
78*
77*
82*
All S
mal
l Firm
s (3
-199
Wor
kers
)21
%*
39%
*47
%*
47%
*33
%*
26%
*31
%*
All L
arge
Firm
s (2
00 o
r Mor
e W
orke
rs)
69%
*71
%*
78%
*60
%*
57%
*55
%*
58%
*RE
GIO
NN
orth
east
35%
*41
%44
%48
%37
%23
%42
%M
idw
est
2830
5158
3230
33S
outh
14*
3846
4033
2426
Wes
t17
5149
4832
3129
INDU
STRY
Agr
icul
ture
/Min
ing/
Con
stru
ctio
n17
%25
%31
%46
%25
%10
%*
23%
Man
ufac
turin
g20
3546
25*
2114
*21
Tran
spor
tatio
n/C
omm
unic
atio
ns/U
tiliti
es15
2541
75*
69*
2016
Who
lesa
le17
6862
3928
10*
56R
etai
l35
3059
5317
1650
Fina
nce
2261
86*
6353
77*
36S
ervic
e23
4048
4737
3233
Sta
te/L
ocal
Gov
ernm
ent
1835
2745
8*8*
14*
Hea
lth C
are
3044
3253
2521
32AL
L FI
RMS
22%
40%
47%
48%
33%
27%
32%
Bio
met
ric s
cree
ning
is a
hea
lth e
xam
inat
ion
that
mea
sure
s an
em
ploy
ee's
risk
fact
ors
such
as
chol
este
rol,
bloo
d pr
essu
re, s
tress
, and
nut
ritio
n.
Sou
rce:
Kai
ser/H
RE
T S
urve
y of
Em
ploy
er-S
pons
ored
Hea
lth B
enef
its, 2
013.
Not
e: T
he o
ffer r
ates
for a
dditi
onal
type
s of
wel
lnes
s pr
ogra
ms
are
pres
ente
d in
Exh
ibit
12.2
.
* E
stim
ate
is s
tatis
tical
ly d
iffer
ent w
ithin
type
of w
elln
ess
prog
ram
from
est
imat
e fo
r all
othe
r firm
s no
t in
the
indi
cate
d si
ze, r
egio
n, o
r ind
ustry
ca
tego
ry (p
<.05
).
Amon
g Fi
rms
Offe
ring
Heal
th B
enef
its, P
erce
ntag
e O
fferin
g a
Parti
cula
r Wel
lnes
s Pr
ogra
m to
The
ir Em
ploy
ees,
by
Firm
Siz
e, R
egio
n,
and
Indu
stry
, 201
3
Exhi
bit 1
2.1

Employer H
ealth Benefits 2
01
3 A
nn
ua
l Su
rvey
TH
E K
AIS
ER
FAM
ILY F
OU
ND
AT
ION
-AN
D- H
EA
LTH
RE
SE
AR
CH
& E
DU
CA
TIO
NA
L T
RU
ST
205
12 section twelveWellness Programs and Health Risk Assessments
Gym Membership Discounts or
On-Site Exercise Facilities
Smoking Cessation Program
Web-based Resources for Healthy Living
Wellness Newsletter
Lifestyle or Behavioral Coaching
Biometric Screening^
Weight Loss Programs
FIRM SIZE3-24 Workers 15%* 36%* 41%* 44%* 30%* 24% 29%*25-199 Workers 42* 49* 64* 59* 40 33 39200-999 Workers 67* 69* 76* 60* 54* 52* 56*1,000-4,999 Workers 75* 76* 87* 61* 69* 67* 67*5,000 or More Workers 84* 91* 93* 66* 78* 77* 82*
All Small Firms (3-199 Workers) 21%* 39%* 47%* 47%* 33%* 26%* 31%*All Large Firms (200 or More Workers) 69%* 71%* 78%* 60%* 57%* 55%* 58%*REGION
Northeast 35%* 41% 44% 48% 37% 23% 42%Midwest 28 30 51 58 32 30 33South 14* 38 46 40 33 24 26West 17 51 49 48 32 31 29
INDUSTRYAgriculture/Mining/Construction 17% 25% 31% 46% 25% 10%* 23%Manufacturing 20 35 46 25* 21 14* 21Transportation/Communications/Utilities 15 25 41 75* 69* 20 16Wholesale 17 68 62 39 28 10* 56Retail 35 30 59 53 17 16 50Finance 22 61 86* 63 53 77* 36Service 23 40 48 47 37 32 33State/Local Government 18 35 27 45 8* 8* 14*Health Care 30 44 32 53 25 21 32
ALL FIRMS 22% 40% 47% 48% 33% 27% 32%
Biometric screening is a health examination that measures an employee's risk factors such as cholesterol, blood pressure, stress, and nutrition.
Source: Kaiser/HRET Survey of Employer-Sponsored Health Benefits, 2013.
Note: The offer rates for additional types of wellness programs are presented in Exhibit 12.2.
* Estimate is statistically different within type of wellness program from estimate for all other firms not in the indicated size, region, or industry category (p<.05).
Among Firms Offering Health Benefits, Percentage Offering a Particular Wellness Program to Their Employees, by Firm Size, Region, and Industry, 2013
Exhibit 12.1

section
twelve
Wellness Program
s and Health R
isk Assessm
entsEmployer Health Benefits 2 0 1 3 An n u a l S u r vey
T H E K A I S E R FA M I LY F O U N D AT I O N - A N D - H E A LT H R E S E A R C H & E D U C AT I O N A L T R U S T
12
206
Employee Assistance
Program (EAP)
Flu Shots or Vaccinations
Class in Nutrition/Heal
thy Living
Offer at Least One Specified
Wellness Program ‡
Other Wellness Program
FIRM SIZE3-24 Workers 15%* 48%* 17%* 72%* 9%25-199 Workers 45* 68* 30* 89* 13200-999 Workers 77* 86* 48* 99* 26*1,000-4,999 Workers 87* 91* 56* 99* 26*5,000 or More Workers 95* 96* 72* 100* 33*
All Small Firms (3-199 Workers) 22%* 53%* 20%* 76%* 10%*All Large Firms (200 or More Workers) 79%* 87%* 50%* 99%* 26%*REGION
Northeast 34% 48% 28% 70% 15%Midwest 19 56 21 82 13South 22 46 13* 71 10West 20 67 26 84 5
INDUSTRYAgriculture/Mining/Construction 28% 39% 25% 62% 3%Manufacturing 19 51 11* 61 11Transportation/Communications/Utilities 21 72 14 97* 5Wholesale 14 59 15 80 4Retail 18 74 26 91* 5Finance 41 69 37 96* 8Service 23 46 21 72 12State/Local Government 12 36 8* 78 26Health Care 27 83* 21 95* 12
ALL FIRMS 23% 54% 21% 77% 10%
‡ Includes the following wellness programs: weight loss programs, biometric screenings, gym membership discounts or on-site exercise facilities, smoking cessation program, lifestyle or behavioral coaching, classes in nutrition or healthy living, web-based resources for healthy living, flu shot or vaccination, employee assistance program (EAP), or a wellness newsletter. Respondents were given the option to reply that they offer another type of wellness benefit through an open-ended question. In 2012 firms were not asked if they offered an EAP or flu shots and vaccinations. Exluding these two categories 69% of all firms offered one of the listed wellness programs in 2013.
* Estimate is statistically different within type of wellness program from estimate for all other firms not in the indicated size, region, or industry category (p<.05).
Source: Kaiser/HRET Survey of Employer-Sponsored Health Benefits, 2013.
Exhibit 12.2Among Firms Offering Health Benefits, Percentage Offering a Particular Wellness Program to Their
Employees, by Firm Size, Region, and Industry, 2013
Note: The offer rates for additional types of wellness programs are presented in Exhibit 12.1.
Exhibit 12.3Among Firms Offering Health Benefits, Percentage Offering a Particular Wellness Program to Their Employees, by Firm Size, 2013
* Estimate is statistically different between All Small Firms and All Large Firms within category (p<.05). ^ Biometric screening is a health examination that measures an employee's risk factors such as cholesterol, blood pressure, stress, and nutrition. SOURCE: Kaiser/HRET Survey of Employer-Sponsored Health Benefits, 2013.
10%
21%
39%
47%
47%
33%
26%
31%
22%
53%
20%
76%
26%
69%
71%
78%
60%
57%
55%
58%
79%
87%
50%
99%
0% 20% 40% 60% 80% 100%
Other Wellness Program*
Gym Membership Discounts orOn-Site Exercise Facilities*
Smoking Cessation Program*
Web-based Resources for HealthyLiving*
Wellness Newsletter*
Lifestyle or Behavioral Coaching*
Biometric Screening*^
Weight Loss Programs*
Employee Assistance Program (EAP)*
Flu Shot or Vaccinations*
Class in Nutrition/Healthy Living*
Offer at Least OneSpecified Wellness Program*
All Large Firms (200 orMore Workers)
All Small Firms (3-199Workers)

Employer Health Benefits 2 0 1 3 An n u a l S u r vey
T H E K A I S E R FA M I LY F O U N D AT I O N - A N D - H E A LT H R E S E A R C H & E D U C AT I O N A L T R U S T
207
12
section
twelve
Wellness Program
s and Health R
isk Assessm
ents
Exhibit 12.3Among Firms Offering Health Benefits, Percentage Offering a Particular Wellness Program to Their Employees, by Firm Size, 2013
* Estimate is statistically different between All Small Firms and All Large Firms within category (p<.05). ^ Biometric screening is a health examination that measures an employee's risk factors such as cholesterol, blood pressure, stress, and nutrition. SOURCE: Kaiser/HRET Survey of Employer-Sponsored Health Benefits, 2013.
10%
21%
39%
47%
47%
33%
26%
31%
22%
53%
20%
76%
26%
69%
71%
78%
60%
57%
55%
58%
79%
87%
50%
99%
0% 20% 40% 60% 80% 100%
Other Wellness Program*
Gym Membership Discounts orOn-Site Exercise Facilities*
Smoking Cessation Program*
Web-based Resources for HealthyLiving*
Wellness Newsletter*
Lifestyle or Behavioral Coaching*
Biometric Screening*^
Weight Loss Programs*
Employee Assistance Program (EAP)*
Flu Shot or Vaccinations*
Class in Nutrition/Healthy Living*
Offer at Least OneSpecified Wellness Program*
All Large Firms (200 orMore Workers)
All Small Firms (3-199Workers)

section
twelve
Wellness Program
s and Health R
isk Assessm
entsEmployer Health Benefits 2 0 1 3 An n u a l S u r vey
T H E K A I S E R FA M I LY F O U N D AT I O N - A N D - H E A LT H R E S E A R C H & E D U C AT I O N A L T R U S T
12
208
Wellness Benefits Offered to Spouses or Dependents
Most Wellness Benefits Are Provided By the
Health Plan instead of Firm
FIRM SIZE3-24 Workers 42%* 85%*25-199 Workers 61* 71*200-999 Workers 64* 59*1,000-4,999 Workers 65* 46*5,000 or More Workers 73* 44*
All Small Firms (3-199 Workers) 47%* 81%*All Large Firms (200 or More Workers) 65%* 56%*REGION
Northeast 59% 89%Midwest 67* 76South 35 74West 36 86
ALL FIRMS 48% 80%
Source: Kaiser/HRET Survey of Employer-Sponsored Health Benefits, 2013.
Exhibit 12.4Among Firms Offering Health Benefits and Wellness Programs, Percentage of Firms with
the Following Features of Wellness Benefits, by Firm Size and Region, 2013
* Estimate is statistically different from estimate for all other firms not in the indicated size or region (p<.05).
Note: The survey asked these questions to firms offering at least one of the following wellness programs: "weight loss programs", "gym membership discounts or on-site exercise facilities", "smoking cessation programs", "personal health coaching", "classes in nutrition or healthy living", "biometric screening", "flu shots or vaccinations", or "Employee Assistance Programs".
Workers Pay Smaller Percentage
of the Premium
Workers Have
Smaller Deductible
Receive Higher HRA
or HSA Contributions‡
Receive Gift Cards, Travel,
Merchandise, or Cash
Any Financial
Incentive to Participate in Wellness Program ~
FIRM SIZE3-24 Workers 2% <1% 0%* 4%* 5%*25-199 Workers 4 2 2 16* 19*200-999 Workers 10* 2* 5* 24* 32*1,000-4,999 Workers 22* 5* 19* 34* 53*5,000 or More Workers 27* 6* 26* 38* 64*
All Small Firms (3-199 Workers) 3%* 1%* 1%* 7%* 8%*All Large Firms (200 or More Workers) 12%* 3%* 8%* 26%* 36%*REGION
Northeast 2% <1%* 1% 10% 11%Midwest 8 1 2 15 19*South 1 1 1 3* 4*West 2 <1 <1 4 6
ALL FIRMS 3% 1% 1% 8% 10%
Source: Kaiser/HRET Survey of Employer-Sponsored Health Benefits, 2013.
Among Firms Offering Health and Wellness Benefits, Percentage of Firms That Offer Specific Incentives to Employees Who Participate in Wellness Programs, by Firm Size and Region, 2013
Exhibit 12.5
‡ Only firms that offer an HDHP/HRA or HSA-qualified HDHP were asked if participating employees receive higher HRA/HSA contributions as an incentive to participate in wellness programs.
* Estimate is statistically different within type of incentive from estimate for all other firms not in the indicated size or region (p<.05).
~ Any financial incentive indicates firms that offer employees who participate in wellness programs one of the following incentives: smaller premium contributions, smaller deductibles, higher HRA or HSA contributions, or gift cards, travel, merchandise, or cash.
Employer Health Benefits 2 0 1 3 An n u a l S u r vey
T H E K A I S E R FA M I LY F O U N D AT I O N - A N D - H E A LT H R E S E A R C H & E D U C AT I O N A L T R U S T
209
12
section
twelve
Wellness Program
s and Health R
isk Assessm
ents
Workers Pay Smaller Percentage
of the Premium
Workers Have
Smaller Deductible
Receive Higher HRA
or HSA Contributions‡
Receive Gift Cards, Travel,
Merchandise, or Cash
Any Financial
Incentive to Participate in Wellness Program ~
FIRM SIZE3-24 Workers 2% <1% 0%* 4%* 5%*25-199 Workers 4 2 2 16* 19*200-999 Workers 10* 2* 5* 24* 32*1,000-4,999 Workers 22* 5* 19* 34* 53*5,000 or More Workers 27* 6* 26* 38* 64*
All Small Firms (3-199 Workers) 3%* 1%* 1%* 7%* 8%*All Large Firms (200 or More Workers) 12%* 3%* 8%* 26%* 36%*REGION
Northeast 2% <1%* 1% 10% 11%Midwest 8 1 2 15 19*South 1 1 1 3* 4*West 2 <1 <1 4 6
ALL FIRMS 3% 1% 1% 8% 10%
Source: Kaiser/HRET Survey of Employer-Sponsored Health Benefits, 2013.
Among Firms Offering Health and Wellness Benefits, Percentage of Firms That Offer Specific Incentives to Employees Who Participate in Wellness Programs, by Firm Size and Region, 2013
Exhibit 12.5
‡ Only firms that offer an HDHP/HRA or HSA-qualified HDHP were asked if participating employees receive higher HRA/HSA contributions as an incentive to participate in wellness programs.
* Estimate is statistically different within type of incentive from estimate for all other firms not in the indicated size or region (p<.05).
~ Any financial incentive indicates firms that offer employees who participate in wellness programs one of the following incentives: smaller premium contributions, smaller deductibles, higher HRA or HSA contributions, or gift cards, travel, merchandise, or cash.

section
twelve
Wellness Program
s and Health R
isk Assessm
entsEmployer Health Benefits 2 0 1 3 An n u a l S u r vey
T H E K A I S E R FA M I LY F O U N D AT I O N - A N D - H E A LT H R E S E A R C H & E D U C AT I O N A L T R U S T
12
210
Offer Employees Opportunity to Complete Health Risk Assessment
FIRM SIZE3-24 Workers 21%*25-199 Workers 32*200-999 Workers 49*1,000-4,999 Workers 75*5,000 or More Workers 81*
All Small Firms (3-199 Workers) 23%*All Large Firms (200 or More Workers) 55%*REGION
Northeast 19%Midwest 28South 19West 33
INDUSTRYAgriculture/Mining/Construction 13%Manufacturing 30Transportation/Communications/Utilities 23Wholesale 37Retail 17Finance 48Service 21State/Local Government 8*Health Care 31
ALL FIRMS 24%
* Estimate is statistically different from all firms not in the indicated size, region or industry category (p<.05).
Note: A health risk assessment or appraisal includes questions on medical history, health status, and lifestyle and is designed to identify the health risks of the person being assessed.
Source: Kaiser/HRET Survey of Employer-Sponsored Health Benefits, 2013.
Among Firms Offering Health Benefits, Percentage of Firms That Offer Employees the Opportunity to Complete a Health Risk Assessment, by Firm Size, Region and
Industry, 2013
Exhibit 12.6

Employer Health Benefits 2 0 1 3 An n u a l S u r vey
T H E K A I S E R FA M I LY F O U N D AT I O N - A N D - H E A LT H R E S E A R C H & E D U C AT I O N A L T R U S T
211
12
section
twelve
Wellness Program
s and Health R
isk Assessm
ents
Exhibit 12.7Among Firms That Offer Health Benefits and Provide Employees the Opportunity to Complete a Health Risk Assessment, The Percentage of Firms who have Incentives and Penalties for Various Employee Actions, by Firm Size, 2013
18%
54%
5%9%
0%
20%
40%
60%
80%
100%
Financial Incentives for Employees thatComplete Health Risk Assessment*
Employees Required to Complete a HealthRisk Assessment to Enroll in Health Plan~
Employees with Identified Health RiskFactor Must Complete Wellness Program
or Face a Financial Penalty~
All Small Firms (3-199 Workers)
All Large Firms (200 or More Workers)
* Estimate is statistically different between All Small Firms and All Large Firms within category (p<.05). ~ All Small Firms are not shown due to large relative standard errors, indicating a high level of variability.NOTE: Twenty-four percent of firms which offer health benefits offer their employees the opportunity to complete a health risk assessment (See Exhibit 12.6).SOURCE: Kaiser/HRET Survey of Employer-Sponsored Health Benefits, 2013.

section twelveWellness Programs and Health Risk AssessmentsEm
ployer Health B
enefits 20
13
An
nu
al S
urve
y
TH
E K
AIS
ER
FAM
ILY F
OU
ND
AT
ION
-AN
D- H
EA
LTH
RE
SE
AR
CH
& E
DU
CA
TIO
NA
L T
RU
ST
12
212
Diabetes AsthmaHyper- tension
High Cholesterol
Lower Back Pain
Depression ObesityAny Disease Management
Program~
FIRM SIZE3-24 Workers 38%* 32%* 24%* 33% 24% 31% 28% 54%25-199 Workers 51 43 43* 41 26 37 37 65200-999 Workers 71* 58* 63* 59* 23 39 44* 75*1,000-4,999 Workers 81* 71* 73* 67* 31 45* 51* 84*5,000 or More Workers 88* 75* 77* 67* 46* 45* 54* 88*
All Small Firms (3-199 Workers) 41%* 35%* 29%* 35%* 25% 32% 30%* 57%*All Large Firms (200 or More Workers) 73%* 61%* 66%* 61%* 25% 40% 46%* 77%*REGION
Northeast 55% 32% 39% 40% 25% 33% 32% 70%Midwest 48 40 36 46 30 32 37 62South 33 33 16* 27 21 28 20* 49West 38 37 33 34 25 38 36 53
INDUSTRYAgriculture/Mining/Construction 40% 31% 17% 9%* 9%* 13%* 11%* 68%Manufacturing 22* 29 11* 21 32 18 22 40Transportation/Communications/Utilities 27 27 16 22 14 20 16 36Wholesale 49 63 62* 58 16 52 50 70Retail 54 49 58* 67* 34 59* 54 79*Finance 68 57 51 56 65* 55 74* 88*Service 41 33 26 37 22 31 27 54State/Local Government 49 48 44 50 35 47 22 60Health Care 48% 24% 34% 29% 22% 31% 34% 56%
ALL FIRMS 42% 36% 30% 36% 25% 32% 30% 57%
Source: Kaiser/HRET Survey of Employer-Sponsored Health Benefits, 2013.
Among Firms Offering Health Benefits, Percentage with a Particular Disease Management Program, by Firm Size, Region, and Industry, 2013
Exhibit 12.8
~ Includes firms which offer any of the listed disease management programs.
* Estimate is statistically different within type of disease management program from estimate for all other firms not in the indicated size, region, or industry category (p<.05).
Note: In 2013 firms were asked if they offered any of the listed disease management programs. In previous years, firms were asked if they offered a disease management program before being asked about particular programs.

Employer Health Benefits 2 0 1 3 An n u a l S u r vey
T H E K A I S E R FA M I LY F O U N D AT I O N - A N D - H E A LT H R E S E A R C H & E D U C AT I O N A L T R U S T
213
12
section
twelve
Wellness Program
s and Health R
isk Assessm
ents
Exhibit 12.9Among Firms Offering Health Benefits, Percentage of Firms with a Particular Disease Management Program, by Firm Size, 2013
* Estimate is statistically different between All Small Firms and All Large Firms within category (p<.05).~ Includes firms which offer any of the disease management programs indicated in this exhibit.SOURCE: Kaiser/HRET Survey of Employer-Sponsored Health Benefits, 2013.
57%
41%
35%
29%
35%
25%
32%
30%
77%
73%
61%
66%
61%
25%
40%
46%
0% 10% 20% 30% 40% 50% 60% 70% 80% 90%
Any DiseaseManagement Program*~
Diabetes*
Asthma*
Hypertension*
High Cholesterol*
Lower Back Pain
Depression
Obesity*
All Large Firms(200 or More Workers)
All Small Firms(3-199 Workers)

section
twelve
Wellness Program
s and Health R
isk Assessm
entsEmployer Health Benefits 2 0 1 3 An n u a l S u r vey
T H E K A I S E R FA M I LY F O U N D AT I O N - A N D - H E A LT H R E S E A R C H & E D U C AT I O N A L T R U S T
12
214
Firm Offers Financial Incentives to Participate in a Disease Management Program
FIRM SIZE200-999 Workers 5%1,000-4,999 Workers 17*5,000 or More Workers 27*
All Small Firms (3-199 Workers) 2%*All Large Firms (200 or More Workers) 8%*ALL FIRMS 2%
Exhibit 12.10Among Firms Offering Health Benefits and a Disease Management Program for Their Plan with the Largest Enrollment, The Percentage of these Firms Offering Financial
Incentives to Participate, by Firm Size, 2013
* Estimate is statistically different from all firms not in the indicated size category (p<.05).
Source: Kaiser/HRET Survey of Employer-Sponsored Health Benefits, 2013.
Note: The standard error for All Small Firms is 1.1% indicating considerable volatility around the estimate. See Exhibit 12.9 for information on the percent of firms offering a disease management program.

Employer Health Benefits 2 0 1 3 An n u a l S u r vey
T H E K A I S E R FA M I LY F O U N D AT I O N - A N D - H E A LT H R E S E A R C H & E D U C AT I O N A L T R U S T
215
12
section
twelve
Wellness Program
s and Health R
isk Assessm
ents
Exhibit 12.11Among Firms Offering Health Benefits and Wellness Programs, Percentage Using the Following Strategies to Promote Wellness Programs, by Firm Size, 2013
* Estimate is statistically different between All Small Firms and All Large Firms within category (p<.05).~ Includes firms that use any of the strategies indicated in this exhibit.SOURCE: Kaiser/HRET Survey of Employer-Sponsored Health Benefits, 2013.
55%
10%
35%
8%
37%
5%
15%
79%
45%
39%
40%
49%
40%
29%
0% 10% 20% 30% 40% 50% 60% 70% 80% 90%
Any of these strategies*~
Assigning an employeeto promote wellness*
Access to a Benefits Counselor*
Incentives*
Personalized communication*
Team competitions*
Social media tools*
All Large Firms(200 or More Workers)
All Small Firms(3-199 Workers)

section
twelve
Wellness Program
s and Health R
isk Assessm
entsEmployer Health Benefits 2 0 1 3 An n u a l S u r vey
T H E K A I S E R FA M I LY F O U N D AT I O N - A N D - H E A LT H R E S E A R C H & E D U C AT I O N A L T R U S T
12
216
Exhibit 12.12Among Firms Offering Health Benefits and Wellness Programs, Percentage of Firms Using the Following Methods to Evaluate Wellness Programs, By Firm Size, 2013
* Estimate is statistically different between All Small Firms and All Large Firms within category (p<.05).~ Includes firms that use any of the methods of evaluation indicated in this exhibit.SOURCE: Kaiser/HRET Survey of Employer-Sponsored Health Benefits, 2013.
34%
26%
19%
15%
9%
9%
72%
47%
65%
26%
34%
29%
0% 10% 20% 30% 40% 50% 60% 70% 80%
Any of These Methodsof Evaluation*~
Employee Satisfaction*
Employee Participation*
Employee Retention*
Health Outcomes*
Return on Investment*
All Large Firms(200 or More Workers)
All Small Firms(3-199 Workers)

Employer Health Benefits 2 0 1 3 An n u a l S u r vey
T H E K A I S E R FA M I LY F O U N D AT I O N - A N D - H E A LT H R E S E A R C H & E D U C AT I O N A L T R U S T
217
12
section
twelve
Wellness Program
s and Health R
isk Assessm
ents
Exhibit 12.13Among Firms Offering Health Benefits, Importance of Selecting a Plan that Includes a Wellness Program, by Firm Size and Whether Firm Offers Wellness Programs, 2013
21%
33%26%
19%
1%
43% 40%
9% 7%1%
0%
20%
40%
60%
80%
100%
VeryImportant
SomewhatImportant
Not TooImportant
Not at AllImportant
Don't Know
All Small Firms(3-199 Workers)
All Large Firms(200 or More Workers)
~ Firms offering at least one of the following wellness programs: "weight loss programs", "gym membership discounts or on-site exercise facilities", "smoking cessation programs", "personal health coaching", "classes in nutrition or healthy living", "biometric screening", "flu shots or vaccinations", or "Employee Assistance Programs".SOURCE: Kaiser/HRET Survey of Employer-Sponsored Health Benefits, 2013.
24%
37%
24%
15%
<1%
13%
23%
32% 30%
2%0%
20%
40%
60%
80%
100%
VeryImportant
SomewhatImportant
Not TooImportant
Not at AllImportant
Don't Know
Offers at least one Wellness Program~Does Not Offer at least one Wellness Program

section
twelve
Wellness Program
s and Health R
isk Assessm
entsEmployer Health Benefits 2 0 1 3 An n u a l S u r vey
T H E K A I S E R FA M I LY F O U N D AT I O N - A N D - H E A LT H R E S E A R C H & E D U C AT I O N A L T R U S T
12
218
Exhibit 12.14Among Large Firms (200 or More Workers) Offering Health Benefits and Biometric Screenings, the Use of Incentives or Penalties for Various Activities, by Firm Size, 2013
11% 11%
0%
10%
20%
30%
40%
Employees are Required to Complete BiometricScreening
Employees Rewarded or Penalized for MeetingBiometric Outcomes
All Large Firms (200 or More Workers)
NOTE: Biometric screening is a health examination that measures an employee's risk factors. Biometric outcomes could include meeting a target body mass index (or BMI) or cholesterol level but not goals related to smoking. Twenty-six percent of Small Firms and 55% of Large Firms offer biometric screening as a wellness benefit (Exhibit 12.1). The small firm estimates for the percent of firms which rewarded employees for meeting biometric outcomes has a standard error of 2.4% indicating a high level of variability. SOURCE: Kaiser/HRET Survey of Employer-Sponsored Health Benefits, 2013.