Embed Size (px)
Citation preview

Wellcome to the
60 seconds experience60 seconds experience
...I’m looking gooooood!...I’m looking gooooood!

daf

amcclain
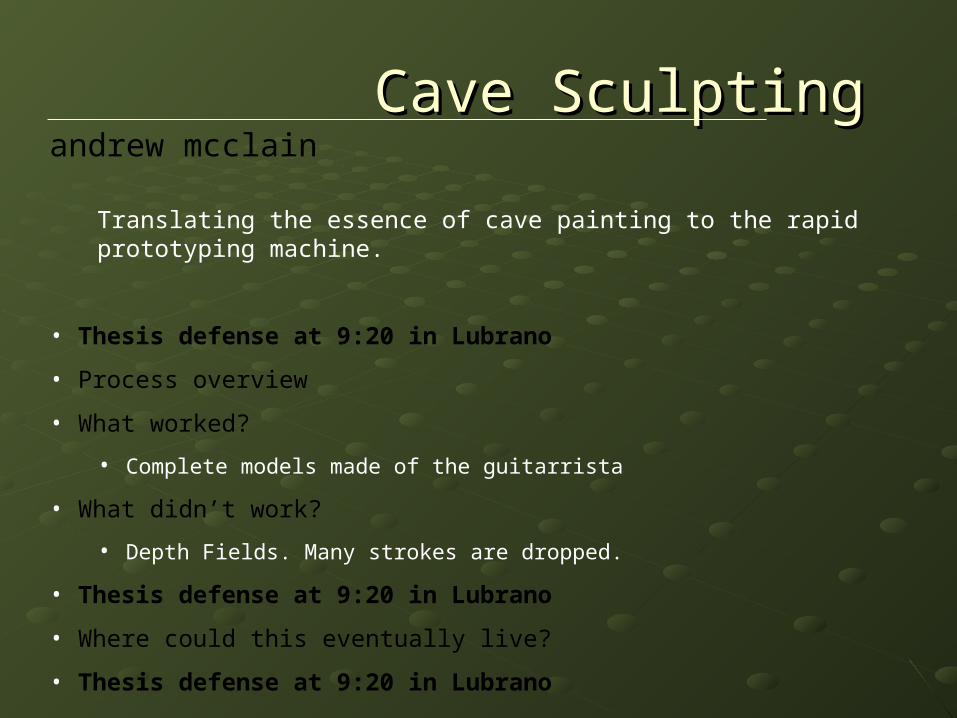
Cave Sculpting Cave Sculpting
Translating the essence of cave painting to the rapid prototyping machine.
• Thesis defense at 9:20 in Lubrano
• Process overview
• What worked?
• Complete models made of the guitarrista
• What didn’t work?
• Depth Fields. Many strokes are dropped.
• Thesis defense at 9:20 in Lubrano
• Where could this eventually live?
• Thesis defense at 9:20 in Lubrano
andrew mcclain

asf
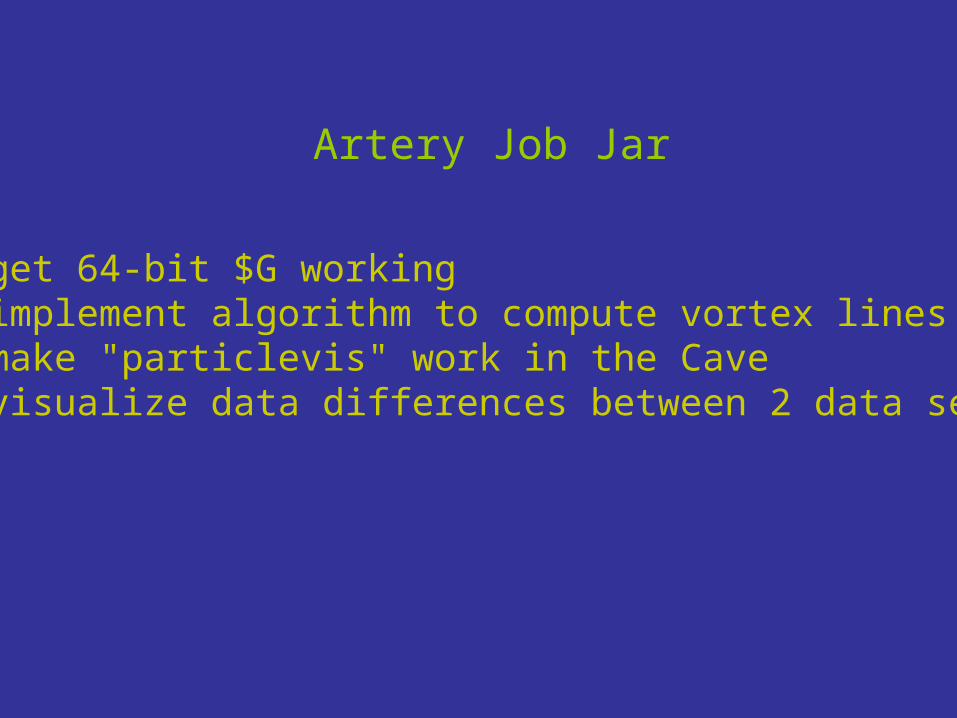
Artery Job Jar
• get 64-bit $G working• implement algorithm to compute vortex lines• make "particlevis" work in the Cave• visualize data differences between 2 data sets

cad
Robust Visualization Constraints
&
Useful Graph Drawings

cj
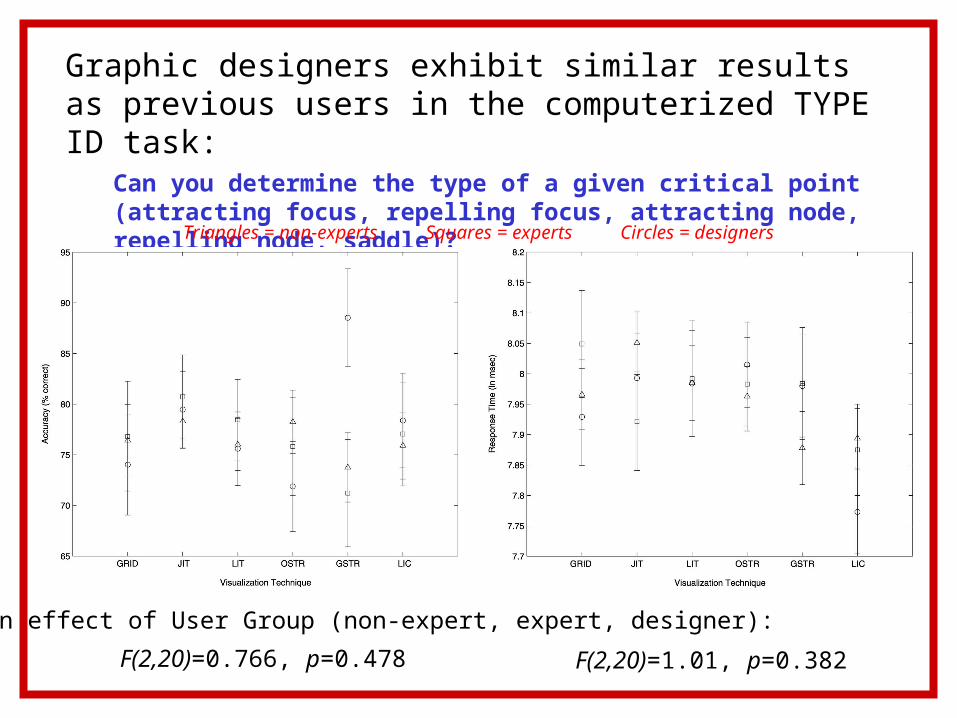
Graphic designers exhibit similar results as previous users in the computerized TYPE ID task:
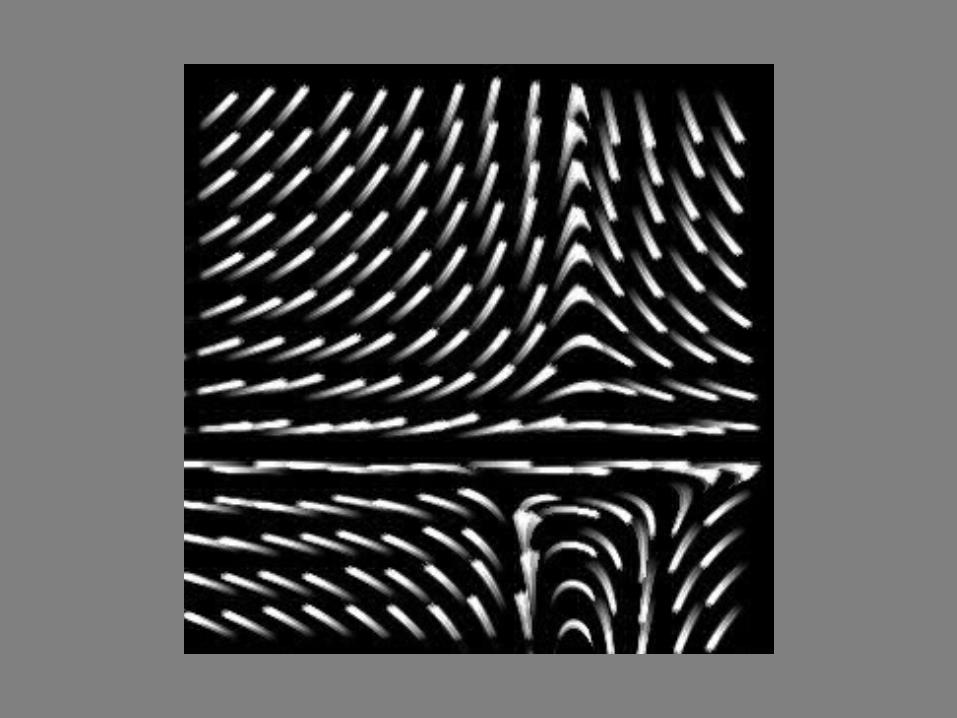
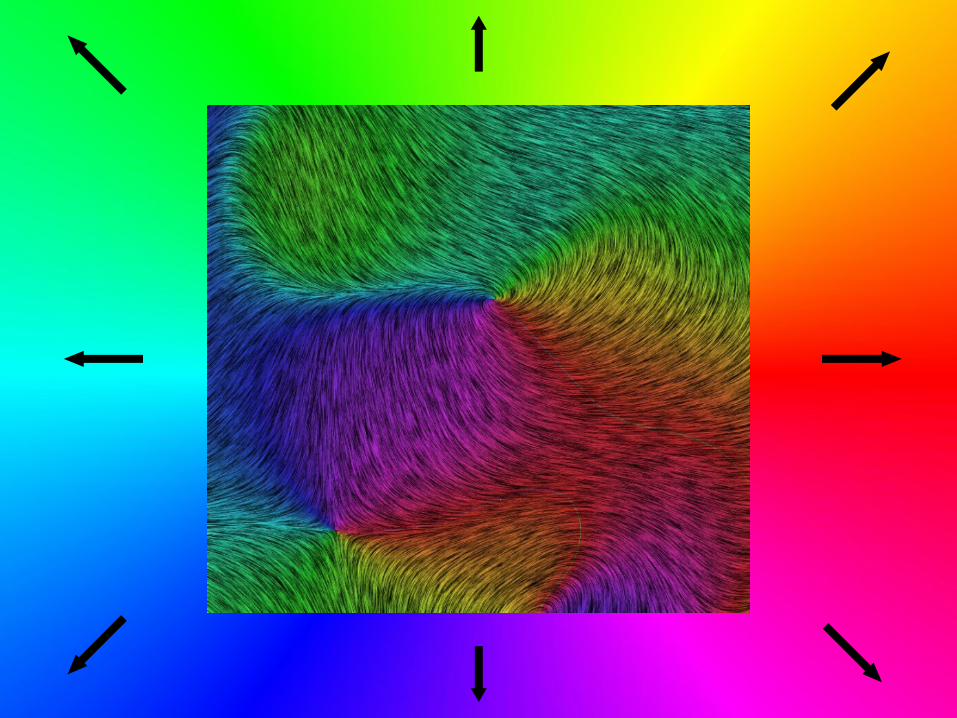
Can you determine the type of a given critical point (attracting focus, repelling focus, attracting node, repelling node, saddle)?
Triangles = non-experts Squares = experts Circles = designers
F(2,20)=1.01, p=0.382F(2,20)=0.766, p=0.478
Main effect of User Group (non-expert, expert, designer):
GRID JIT LIT OSTR GSTR LIC
Accuracy
Designers
User Study
(% correct)
6
75.88
“6”
5
79.13
“1”
3
76.44
“4”
2
76.06
“5”
1
77.06
“2”
4
76.8
“3”
Time
Designers
User Study
(ln msec)
6
7.97
“3”
5
8.01
“6”
3
7.99
“5”
2
7.98
“4”
1
7.93
“2”
4
7.86
“1”
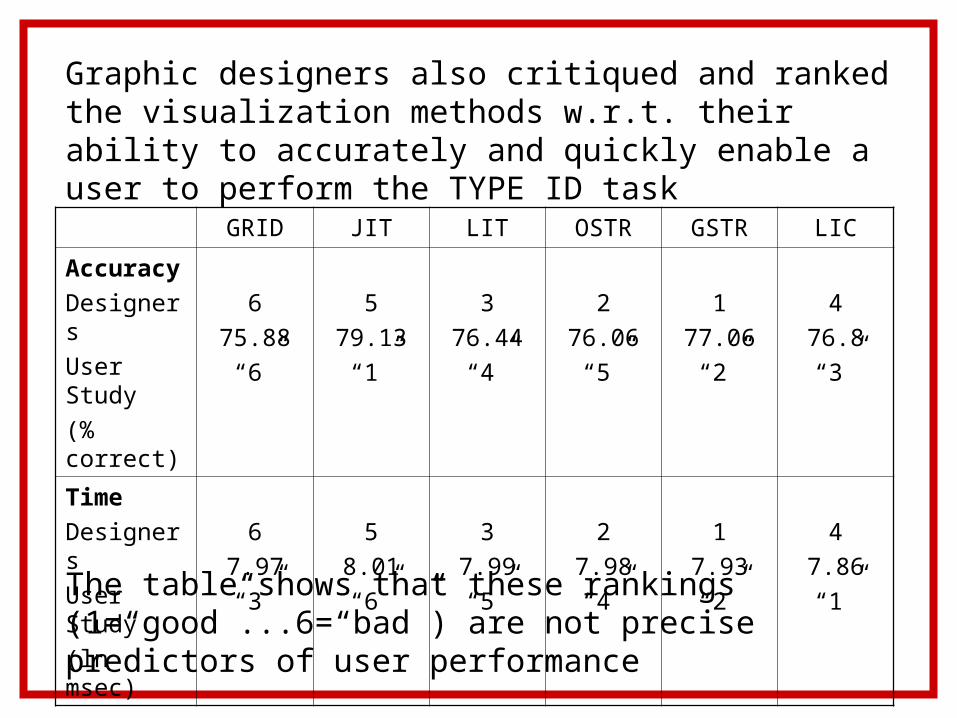
Graphic designers also critiqued and ranked the visualization methods w.r.t. their ability to accurately and quickly enable a user to perform the TYPE ID task
The table shows that these rankings (1=“good”...6=“bad”) are not precise predictors of user performance
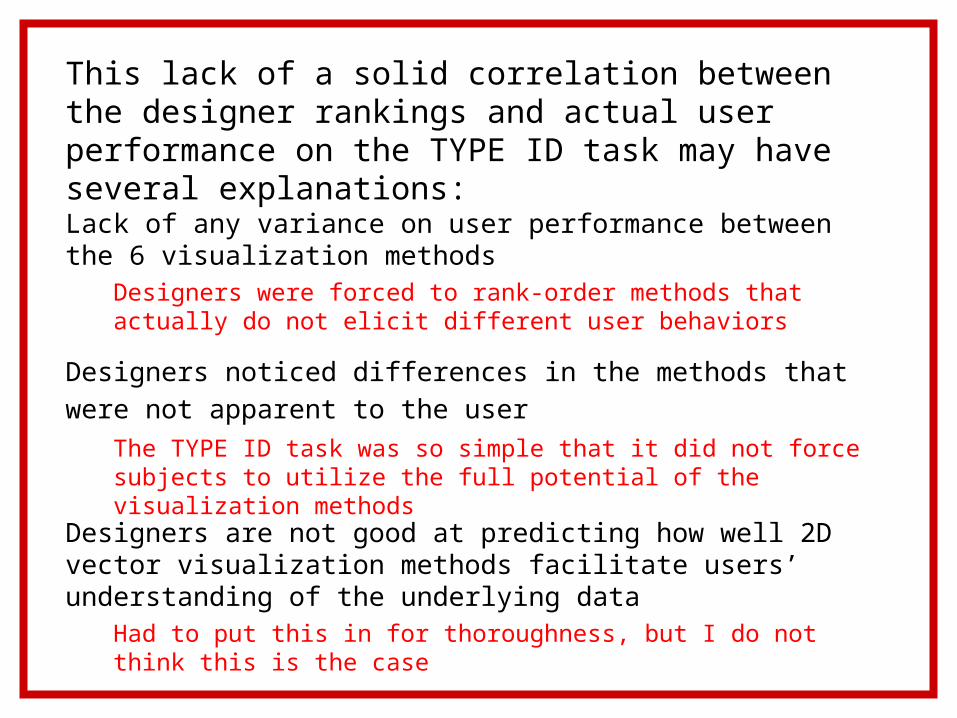
This lack of a solid correlation between the designer rankings and actual user performance on the TYPE ID task may have several explanations:
Lack of any variance on user performance between the 6 visualization methods
Designers were forced to rank-order methods that actually do not elicit different user behaviors
Designers noticed differences in the methods that were not apparent
to the user The TYPE ID task was so simple that it did not force subjects to utilize the full potential of the visualization methods
Designers are not good at predicting how well 2D vector visualization methods facilitate users’ understanding of the underlying data
Had to put this in for thoroughness, but I do not think this is the case

THANK YOU!

dfk


dbk
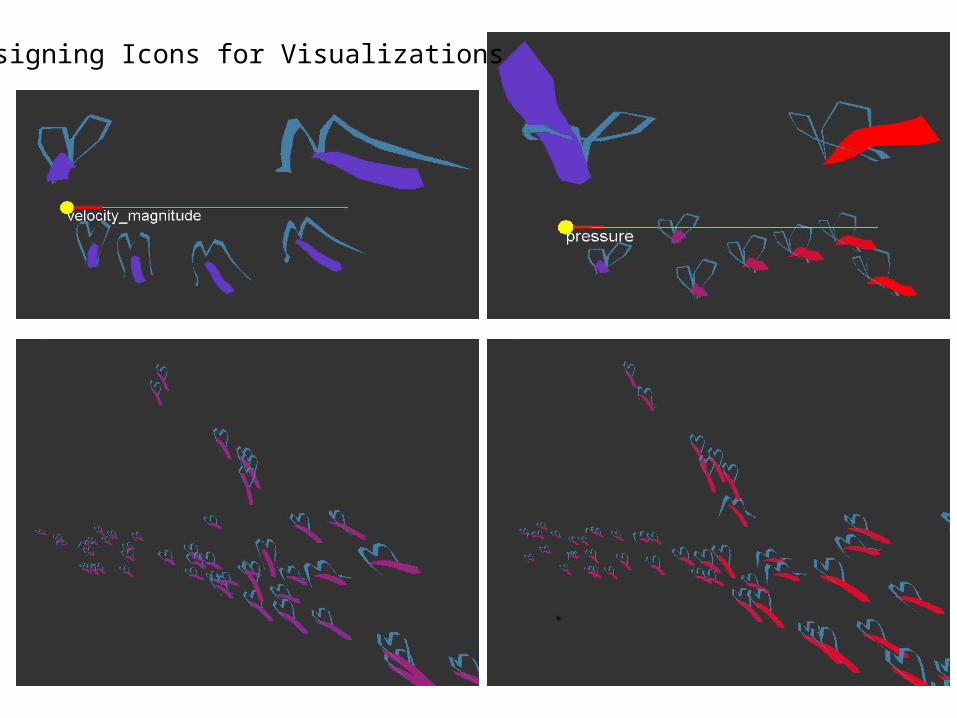
Designing Icons for Visualizations

dturner
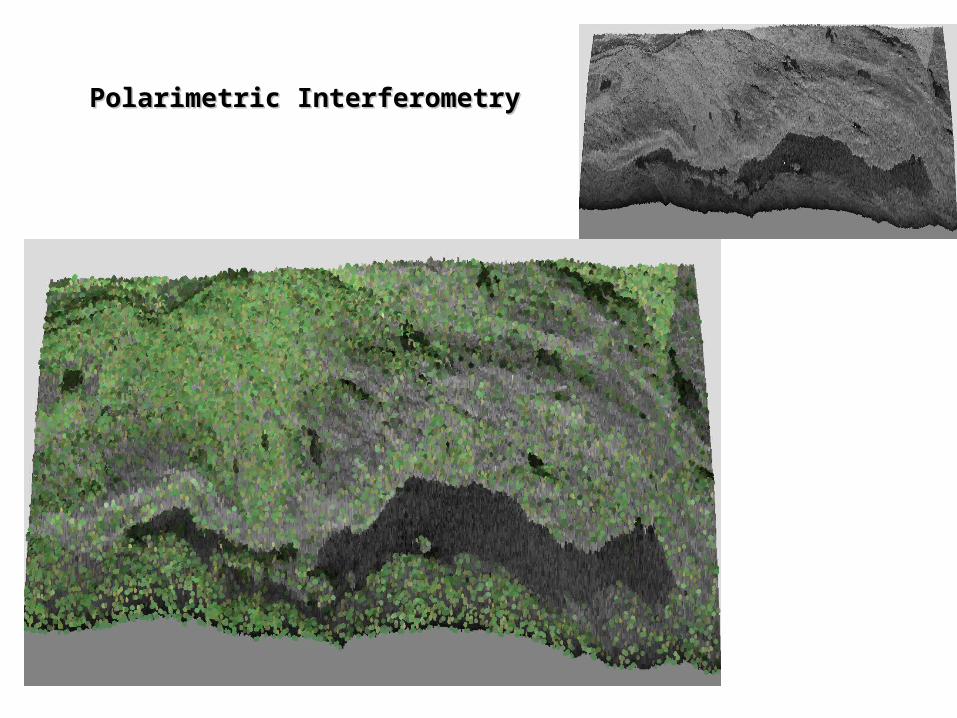
Polarimetric InterferometryPolarimetric Interferometry

dhl

hueso
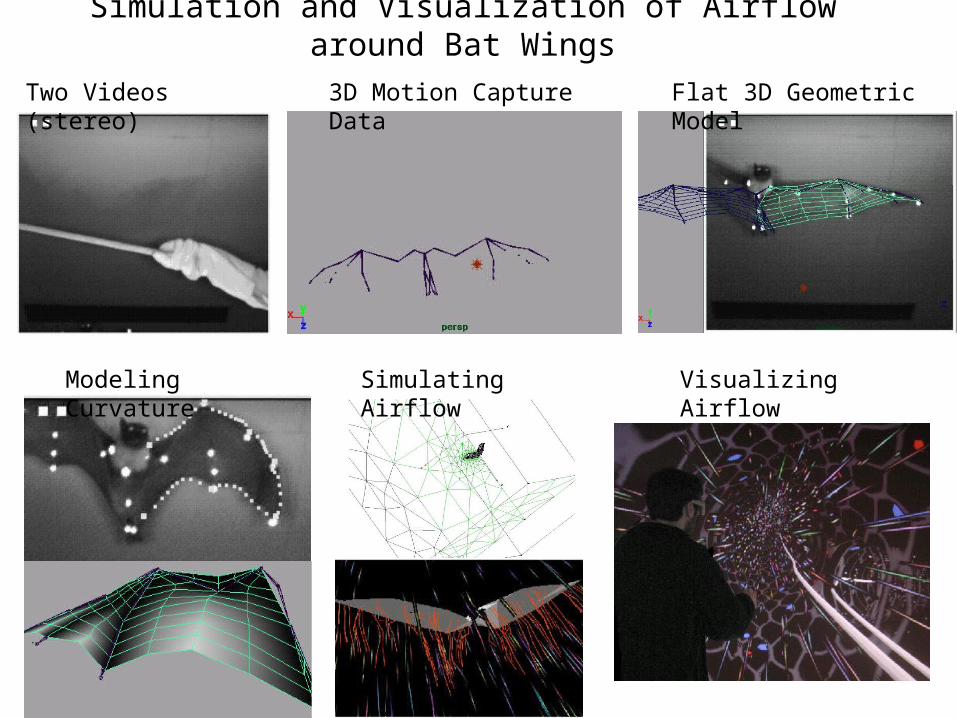
Simulation and Visualization of Airflow around Bat Wings
Two Videos (stereo) 3D Motion Capture Data Flat 3D Geometric Model
Modeling Curvature Visualizing AirflowSimulating Airflow

evote
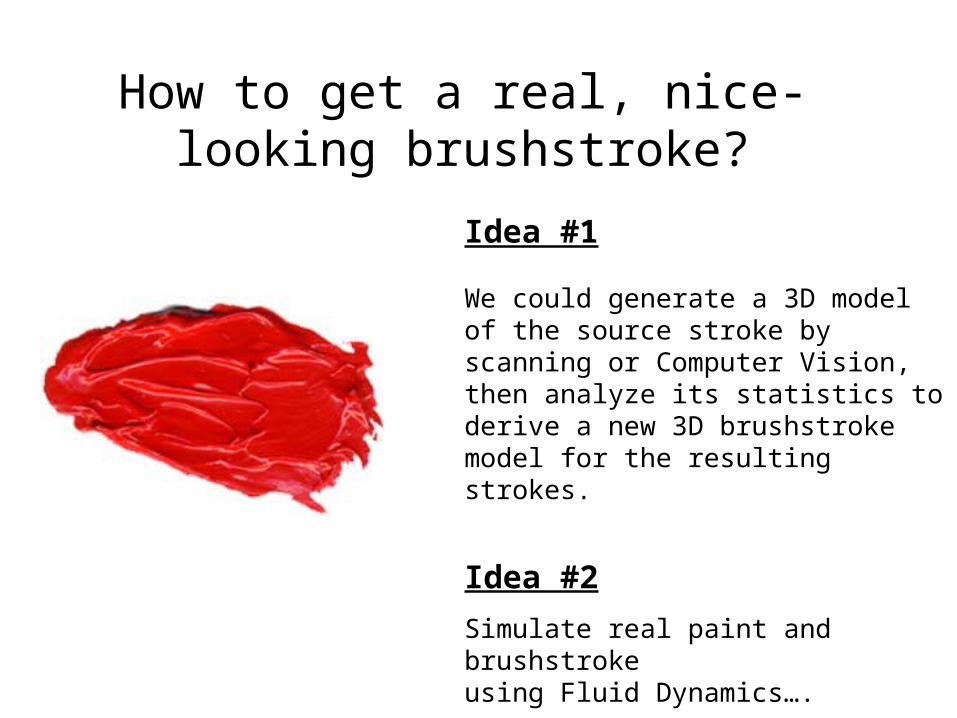
Idea #1
We could generate a 3D model of the source stroke by scanning or Computer Vision, then analyze its statistics to derive a new 3D brushstroke model for the resulting strokes.
Idea #2
Simulate real paint and brushstroke using Fluid Dynamics….
How to get a real, nice-looking brushstroke?

leor
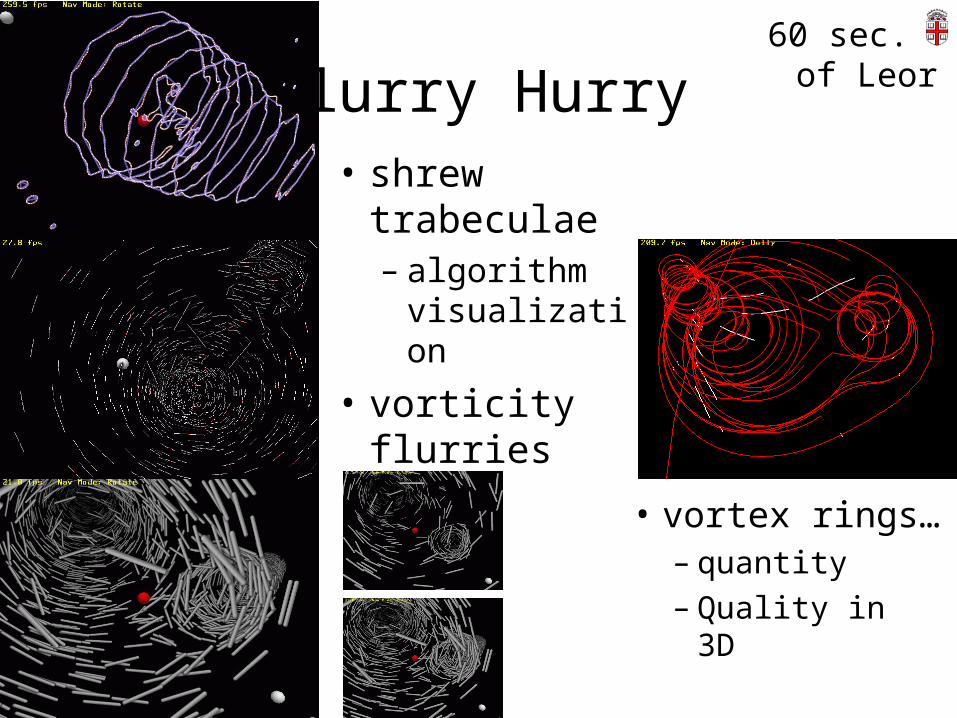
Flurry Hurry• shrew
trabeculae– algorithm
visualization
• vorticity flurries
• vortex rings…– quantity– Quality in 3D
60 sec. of Leor

gem
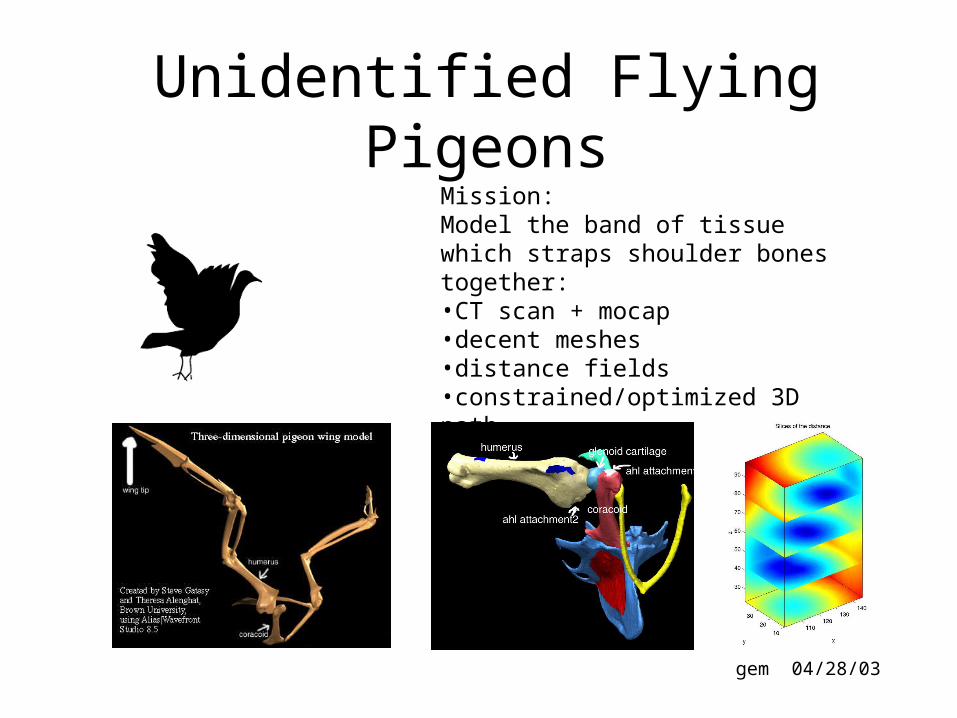
Unidentified Flying Pigeons
Mission:Model the band of tissue which straps shoulder bones together:•CT scan + mocap•decent meshes•distance fields•constrained/optimized 3D path
gem 04/28/03

jsobel
Everything I Needed to Know About Life I Learned from David Laidlaw
• Texture everything!
• Say it with me… POISSON!
• My beard makes me look Amish
• 750
• Computers can actually address meaningful problems

sz

Semester review
• Proposal refinement and implementation– Fiber bundle model, forward modeling,
segmentation, model modification
• Collaboration with CMU/Caltech/Edinburgh. MRM tumor paper

Thanks for the munchies Eileen!Thanks for the munchies Eileen!