Embed Size (px)
Citation preview

Well-to-Wheel Analysis of Greenhouse Gas Emissions of
Automotive Fuels in the Japanese Context
- Well-to-Tank Report -
November, 2004

This report is available as an ADOBE pdf file on the MHIR website at http://www.mizuho-ir.co.jp/english/
Questions and remarks may be sent to [email protected]
No part of this report may be reproduced or utilized in any form or by any means, electronic or mechanical,including photocopying, recording or by any information storage or retrieval system, without permissionfrom Toyota Motor Corporation (TMC) and Mizuho Information & Research Institute, Inc. (MHIR).
TMC and MHIR are also not responsible for any damages caused by any changes or utilization ofinformation within this report.

( 1 )
Preface
According to the diversification of automotive fuels and powertrain technologies, advanced technologyvehicles such as hybrid electric vehicles with gasoline and diesel, and various fuel cell based vehicles, havebeen under research and development extensively. Against this background, in order to evaluate thegreenhouse gas emission reduction potentials, we focuses on estimating Well-to-Tank (= consideration of thefuel from resource recovery to delivery to the vehicle tank) greenhouse gas emissions of automotive fuels tobe used in Japan for present and near future. Further, by adding these well-to-tank results, we show Well-to-Wheel (=integration of the well-to-tank and tank-to-wheel components) greenhouse gas emissions under thespecific condition of driving a sedan.We hope that these data of this study will be useful for those who are planning to conduct fuel-cycle analysisin the future.
Study Organization
This study was carried out the project team that was organized by environment-related organizations inMizuho Information & Research Institute, Inc. In addition, in order to ensure Well-to-Tank data impartiality,efforts were made to improve credibility by seeking varied advice, ranging from third party evaluations byspecialists (Advisory Committee) up to obtaining calculation methods from the data sources.The participants of this project were as follows:
<Advisory Committee>(Chairman) Hisashi ISHITANI Graduate School of Media and Governance, Keio University
Masaki IKEMATSU General Manager, Fuel Cell Testing Dept., Nippon Oil CorporationFumihiro NISHIMURA General Manager, Siting & Environment,
The Federation of Electric Power Companies (Takao KITAHARA Deputy General Manager, Siting & Environment,
The Federation of Electric Power Companies)Kiyokazu MATSUMOTO General Manager, Environment Dept., The Japan Gas AssociationKiyoshi NAKANISHI Senior Director of Research, Genesis Research Institute, Inc.
(Advisor, Toyota Motor Corporation)Shigeki KOBAYASHI IPCC Coordinating Lead Author
(Senior Researcher, Strategic Planning Office, Toyota Central R&D Labs., Inc.)
<Toyota Motor Corporation>(Representative) Hirohiko HOSHI Senior Staff Engineer, Fuel & Lubricant Department
<Mizuho Information & Research Institute, Inc.>(Representative) Yasushi KAJI Senior Research Associate, Environmental Strategy

( 2 )
Acknowledgments
We would like to thank members of Advisory Committee and specialists at the various institutions thatsupported our study during the process of hearing and editing this report.

( 3 )
Executive Summary
With the impending practical application of fuel cell vehicles (FCV), the choice of propulsion systems, alongwith gasoline and hybrid vehicles is increasing, while on the other hand, the diversification of fuels is alsoprogressing. From this background, Toyota Motor Corporation (TMC) commissioned Mizuho Information &Research Institute, Inc. (MHIR) to conduct this study with the objective of establishing a foundationalunderstanding needed to consider the potential of various technologies and automotive fuels in the reductionof environmental load.
The calculations of this study mainly concern Well-to-Tank (=consideration of the fuel from extraction ofprimary energy to vehicle fuel tank) energy consumption, greenhouse gas (GHG) emissions and energyefficiency of current and near future automotive fuels in Japan. The results of this study were subsequentlycombined with data related to Tank-to-Wheel (=assessing vehicle architecture, powertrain and fuel effects)studies previously conducted by TMC, and a case study showing Well-to-Wheel (=integration of the Well-to-Tank and Tank-to-Wheel components) GHG emissions under fixed conditions of driving sedan type vehicles,was calculated (See figure below).
Figure Well-to-Wheel GHG emissions under fixed conditions of driving sedan type vehicles
-1.0 -0.5 0.0 0.5 1.0 1.5
Well-to-TankTank-to-Wheel
Relative CO2 emission ( Gasoline - ICE = 1.0 )
Gasoline - ICE
Gasoline - ICE/HV
LPG - ICE
LNG → CNG - ICE
Diesel - ICE
Diesel - ICE/HV
Natural Gas → FTD - ICE
Natural Gas → DME - ICE
Coal → FTD - ICE
Coal → DME - ICE
Biomass → FTD - ICE
Rape seed → FAME - ICE
Waste food oil → FAME - ICE
Waste wood → Ethanol - ICE
Gasoline → (on) CGH2 - FC
Kerosene → (on) CGH2 - FC
Naphtha → (on) CGH2 - FC
LPG → (on) CGH2 - FC
Natural Gas → (on) CGH2 - FC
Natural Gas → (off) CGH2 - FC
Natural Gas → MeOH → (on) CGH2 - FC
COG → (off) LH2 - FC
Electrolysis → (on) CGH2 - FC
* Pow ertrain performances of LPG, CNG, and ethnol ICE are the same as gasoline ICE, and pow ertrain performances of FTD, DME, and FAME ICE are the same as diesel ICE. (See page 104 "3.2 Case study: Tank-to-Wheel and Well-to-Wheel GHG emissions" for more details on preconditions of the calculation.)

( 4 )
Regarding Well-to-Tank studies, the fuel production pathways considered were; 21 petroleum based fuels, 20natural gas based fuels, 8 coal based fuels, 19 biomass resource related fuels (3 bio-diesel fuels, 10 drybiomass based fuels, 6 wet biomass based fuels), power grid mix (Japan average) and hydrogen productionthrough electrolysis, 6 byproduct hydrogen pathways, totaling 76 pathways. No fixed timeframe was set forthe data collected, with efforts focusing on understanding and organizing existing data. Additionally, in orderto ensure data impartiality, efforts were made to improve credibility by seeking varied advice, ranging fromthird party evaluations by specialists (Advisory Committee) up to obtaining calculation methods from the datasources. Moreover, where data used in calculation has a broad range, the range is indicated through minimumto maximum values.
Furthermore, for Well-to-Wheel, in concurrence with previous research for the “10-15 mode run” (example ofcalculations made in this study), which is mainly a comparatively low-speed run, significantly superior resultswere obtained for hybrid electric vehicles (gasoline, diesel) in relation to GHG emissions. For synthetic fuelssuch as Fischer-Tropsch Diesel Oil and Dimethyl Ether (DME), and hydrogen, large variations in Well-to-Tank GHG emissions were apparent depending on the primary energy used as feedstock, and it is clear that animportant aspect of future considerations will be the production of fuels through low GHG emission pathways.Moreover, regarding hydrogen, during transition, hydrogen derived from fossil fuels such as natural gas hasalso shown results similar to that of hybrid electric vehicles, and depending on trends in CO2 capture andstorage, possibilities of further reductions in GHG emissions with these pathways are conceivable. In addition,fuels derived from biomass resources have comparatively low GHG emission values, and future utilization isanticipated.
The credibility and applicability of calculations in this study depends greatly on calculation preconditionssuch as implemented load distribution methods and quality of data. In reality, some fuels such as petroleumproducts, city gas, liquefied petroleum gas (LPG) and electricity are already in industrial use, while biomassresources, synthetic fuels, hydrogen, and so on, are still in the early stages of technological development. Inaddition, even where calculation results of this study are based on actual values, as there is a high degree ofuncertainty concerning future technological innovation, market size, new laws and regulations, and such,many problems exist concerning the simple comparison of these fuels. Furthermore, regarding loaddistribution between main products and co-products/byproducts, although this study has been conductedunder the premise that, in principle, byproducts will be disposed of, the usage of certain byproducts has beenconsidered in prior studies although the possibility of realizing this usage is unclear (load distributionconsiderations). Also, regarding the sphere of the system, the environmental load from the production processof byproduct hydrogen feedstock such as coke oven gas (COG) has not been taken into consideration in thisstudy. For these reasons, the calculation results of this study are not unlike preliminary approximations, and inorder to contribute further to the initial objectives, the consistency of preconditions and the accuracy of dataused in calculations must be improved, and the credibility of the results must be enhanced.
The emphasis of this study is on Well-to-Tank analysis. In future, these results will be combined with variousTank-to-Wheel analysis results and basic data, and various further analyses are scheduled in relation to overallefficiency from extraction of primary energy to actual vehicle fuel consumption “Well-to-Wheel”. At such atime, it may also become necessary to modify or adjust the calculation results of this study in order to complywith analysis preconditions.
Well-to-Wheel analysis results will be an important factor in the selection of future technologies and fuels.

( 5 )
However, technologies and fuels that will be implemented in the future will not be determined by this factoralone. This is because a variety of other factors such as cost, infrastructure, completeness of the technology,supply potential and usability will also be taken into consideration. In future, it will be necessary to seek outoptimum vehicle/fuel combinations according to the energy circumstances, available infrastructure andregulations that apply in each country or region. See page 104 “3.2 Case study: Tank-to-Wheel and Well-to-Wheel GHG emissions” for more details on preconditions of the calculation.


- i -
Table of Contents
Preface ........................................................................................................................................ (1)
Executive Summary.................................................................................................................... (3)
1. Goal and Scope in This Study.................................................................................................1
1.1 Goal ........................................................................................................................................................1
1.2 Scope ......................................................................................................................................................1
1.2.1 Fuels and fuel production pathways ................................................................................................2
1.2.2 Data categories ................................................................................................................................6
1.2.3 Calculation procedures ....................................................................................................................7
2. Well-to-Tank Data Compilation Procedures and Calculation Methods ............................... 11
2.1 Petroleum Based Fuel Production Pathways ........................................................................................11
2.1.1 Abstract..........................................................................................................................................11
2.1.2 Procedures for data collection of unit process ...............................................................................13
2.1.3 Calculation results .........................................................................................................................19
2.2 Natural Gas Based Fuel Production Pathways .....................................................................................20
2.2.1 Abstract..........................................................................................................................................20
2.2.2 Procedures for data collection of unit process ...............................................................................21
2.2.3 Calculation results .........................................................................................................................27
2.3 Fuel Production Pathways from Biomass Resources ...........................................................................29
2.3.1 Abstract..........................................................................................................................................29
2.3.2 Procedures for data collection of unit process ...............................................................................32
2.3.3 Calculation results .........................................................................................................................43
2.4 Synthetic Fuel Production Pathways ....................................................................................................46
2.4.1 Abstract..........................................................................................................................................46
2.4.2 Procedures for data collection of unit process ...............................................................................51
2.4.3 Calculation results .........................................................................................................................60
2.5 Liquefied Petroleum Gas Production Pathways ...................................................................................62
2.5.1 Abstract..........................................................................................................................................62
2.5.2 Procedures for data collection of unit process ...............................................................................62
2.5.3 Calculation results .........................................................................................................................64

- ii -
2.6 Electricity (Electric Power Generation Pathways) ...............................................................................65
2.6.1 Abstract..........................................................................................................................................65
2.6.2 Procedures for data collection of unit process ...............................................................................68
2.6.3 Calculation results .........................................................................................................................76
2.7 Hydrogen Production Pathways ...........................................................................................................77
2.7.1 Abstract..........................................................................................................................................77
2.7.2 Procedures for data collection of unit process ...............................................................................79
2.7.3 Calculation results .........................................................................................................................89
3. Results and Conclusions .......................................................................................................98
3.1 Well-to-Tank Analysis Results..............................................................................................................98
3.2 Case study: Tank-to-Wheel and Well-to-Wheel GHG emissions.......................................................104
3.2.1 Assumptions about Tank-to-Wheel analysis................................................................................104
3.2.2 Well-to-Wheel GHG emissions under fixed conditions of driving sedan type vehicles..............105
3.3 Considerations and Future Tasks ........................................................................................................106
3.3.1 Considerations about Well-to-Tank analysis................................................................................106
3.3.2 Future tasks.................................................................................................................................. 111
4. References........................................................................................................................... 112

- 1 -
1. Goal and Scope in This Study
1.1 Goal
With the impending practical application of fuel cell vehicles (FCV), the choice of propulsion systems, alongwith gasoline and hybrid vehicles is increasing, while on the other hand, the diversification of fuels is alsoprogressing. With this background, for the continued utilization of motor vehicles in society, it is the objectiveof this study to establish the foundational understanding needed to consider the potential of varioustechnologies and fuels, concerning the reduction environmental load, without sacrificing the convenience ofmobility.Specifically, the investigation and compilation of various fuel production pathways for potential automotivefuels with future technologies are taken into consideration, with incremental calculations for Well-to-Wheelenergy consumption, GHG emissions and energy efficiency for each pathway.
1.2 Scope
The lifecycle of an automobile consists of the fuel supply cycle (resource extraction to production to fueltank), the vehicle cycle (vehicle manufacture, running, disposal/recycling) and other related infrastructurecycles (See Figure 1.1). Of these cycles, this study focuses mainly on the fuel supply cycle within Japan, withWell-to-Tank calculations for energy consumption, GHG emissions and energy efficiency.In addition, as a separate case study, reference data was calculated for Well-to-Wheel GHG emissions relevantto the running stage of the vehicle cycle under predetermined conditions.
Figure 1.1 Scope of this study
AutomobileProduction
AutomobileTransport
Operation
Tank-to-Wheel
DispositionRecycling
FuelsProduction, Transport, Storage, Filling
Energy ResourcesMining, Cultivation, Production,
Distribution and Storage
Well-to-Tank
Vehicle Cycle
Fuel Supply Cycle
Fuel Supply Infrastructure constructing and operation
Fuel Supply Infrastructure scrapping and disposition
Scope of this study
Vehicle Cycle Infrastructure constructing and operation
Vehicle Cycle Infrastructure scrapping and disposition

- 2 -
1.2.1 Fuels and fuel production pathways
To begin with, following the compilation of fuel production pathways applicable for automotive fuels inJapan, the fuel production pathways to be considered were selected from the perspectives of (1) Alreadyrealized, (2) High probability of realization in the future, (3) Strong repercussion effect in the event ofrealization.The fuel production paths considered in this study are shown in Table 1.1 ((A) Petroleum Based, (B) NaturalGas Based, (C) Coal Based, (D) Biomass Resource Related, (E) Power grid mix (Japan average), (F)Byproduct Hydrogen).
Table 1.1 (A) Fuels and fuel production paths – Petroleum Based
Current gasoline
Crude Oil Current Diesel
Low Sulfur Diesel
Sulfur Free Diesel
Future Gasoline
Kerosene
(onsite) CGH2
Naphtha
(offsite) CGH2
(offsite) LH2
LPG (crude associated gas derivative)
(onsite) CGH2
Electricity (Oil fired)
(onsite) CGH2
Crude/Heavy
(onsite) CGH2
(offsite) CGH2LH2
Gasoline blended with 3% Ethanol
Gasoline blended with ETBE
Gasoline blended with 10% Ethanol
(onsite) CGH2
LPG (crude refinement)
(onsite) CGH2

- 3 -
Table 1.1 (B) Fuels and fuel production paths – Natural Gas Based
Table 1.1 (C) Fuels and fuel production paths – Coal Based
Natural Gas LPG (natural gas derivative or constituent gas derivative)
(onsite) CGH2
LNG
CNG
(onsite) CGH2
Electricity (LNG fired)
City Gas
CNG
(onsite) CGH2
Syngas FTD
(onsite) CGH2
DME
(onsite) CGH2
(onsite) CGH2
Methanol
Electricity (LNG combined)
(onsite) CGH2
(offsite) CGH2
(offsite) LH2
(offsite) CGH2LH2
City Gas(NG pipeline)
(NG pipeline)
(NG pipeline)
(onsite) CGH2
Electricity (Coal fired)Coal
Syngas
(onsite) CGH2
DME
(onsite) CGH2
(onsite) CGH2
Methanol
(onsite) CGH2
FTD

- 4 -
Table 1.1 (D) Fuels and fuel production paths – Biomass Resources Related
Biomass (dry) Syngas FTD
(onsite) CGH2
DME
(onsite) CGH2
Methanol
(onsite) CGH2
Rape seed FAME
Sugarcane Ethanol
CH4Biomass (wet)
Electricity (CH4 fired)
Palm FAME
Waste food oil FAME
Corn Ethanol
Cellulosicbiomass Ethanol
Waste wood Ethanol
CNG
(onsite) CGH2
(offsite) LH2
(offsite) CGH2LH2
Electricity
(onsite) CGH2
Electricity
(onsite) CGH2
(direct combustion)
(gasification)
(offsite) CGH2
ETBE
ETBE
ETBE
ETBE

- 5 -
Table 1.1 (E) Fuels and fuel production paths – Power Grid Mix (Japan average)
Table 1.1 (F) Fuels and fuel production paths – Byproduct Hydrogen
Furthermore, for this study, in order to conduct efficient data calculations, the processes forming the fuelproduction pathways shown in Table 1.1 were classified into the following groups.
(1) Petroleum Based Fuel Production Pathways → See 2.1
(2) Natural Gas Based Fuel Production Pathways → See 2.2
(3) Fuel Production Pathways from Biomass Resources → See 2.3
(4) Synthetic Fuel Production Pathways → See 2.4
(5) LPG Production Pathways → See 2.5
(6) Electricity (Electric generation pathways) → See 2.6
(7) Hydrogen Production Pathways → See 2.7
The compilation procedures and calculation methods used for each unit process data are described in “2. Well-to-Tank Data Compilation Procedures and Calculation Methods”. The results of Well-to-Tank energyconsumption, GHG emissions and energy efficiency calculations derived through the combination of thisprocess data and the conclusions drawn are discussed in “3. Results and conclusions”.
(offsite) CGH2
(offsite) LH2
(offsite) CGH2LH2
Salt electrolysis
(offsite) CGH2
(offsite) LH2
(offsite) CGH2LH2
COG
Power grid mix (Japan average)
(onsite) CGH2
Crude Oil
Natural Gas
Coal
Uranium ore
Oil fired
LNG fired / LNG combined
Coal fired
Nuclear power

- 6 -
1.2.2 Data categories
Within this study, issues related to the following were considered as environmental load issues.
[Energy consumption]
⁃ Energy consumption (lower heating value) [MJ]⁃ Energy efficiency (lower heating value) [%]
[Emission to air]
⁃ GHG emissions: Carbon Dioxide (CO2), Methane (CH4), Nitrous Oxide (N2O) [kg]
Furthermore, in light of the objectives of the study, only the above issues were considered, and emissions toair, water and land other than the above were excluded from evaluation.Additionally, regarding calculating category indicator results within climate change, referring toIntergovernmental Panel on Climate Change (IPCC) [2001], the Global Warming Potential (GWP) 100-yearfactor, frequently used as an index to show the magnitude of climate change, was used as the characterizationfactor. The following reasons can be given regarding the use of the 100-year factor:
⁃ The lifespan of CO2 in the atmosphere is 120 years,
⁃ IPCC recommends a time horizon of 100 years.
Regarding emissions other than CO2 (CH4, N2O), evaluation was conducted through conversion to equivalentCO2 in accordance with the GWP 100-year factor.
GWP indicator result [kg eq-CO2] = GHG emission [kg] * GWP 100-year factor [kg eq-CO2/kg]
The GWP 100-year factor used in this study is shown in Table 1.2 (IPCC [2001]).
Table 1.2 Characterization factor
GHG emission GWP
Carbon Dioxide (CO2) 1
Methane (CH4) 23
Nitrous Oxide (N2O) 296

- 7 -
1.2.3 Calculation procedures
This study employed the “Conventional Process-based LCA Method”, studying data per process within thelifecycle from the production of each fuel up to supply to the vehicle.Unless specifically stated otherwise, the data shown in Table 1.3 in relation to fossil fuel combustion and theuse of electricity, was used to calculate energy consumption and CO2 emissions for each process. Therefore,input/output in relation to fossil fuel combustion was converted to energy input/output by multiplying theheating values given in Table 1.3, or in relation to electricity usage, by multiplying the energy consumptionvalues per kWh shown in Table 1.4. Subsequently, energy consumption and CO2 emissions were calculated bymultiplying the heating values and CO2 emission factors during combustion given in Tables 1.3 and 1.4.In this study, energy efficiency of a pathway was calculated as the simple product of the numerator, taken asthe energy (heating value) of the product of each process, and the denominator, calculated as the sum of theenergy (heating value) of the resources injected into the process and the energy consumed in the process.
Figure 1.2 Energy efficiency of the unit process
Regarding heating value, for general LCA purposes, higher heating value (= value which includes thecondensation heat (latent heat of vaporization) of moisture in the fuel and steam generated throughcombustion in the heating value. HHV) is used. However, as the operating temperature of the combustionengine of this study is high and latent heat recovery for steam is difficult, it was decided that lower heatingvalue (= value that does not include the condensation heat of steam. LHV) would be used as the basis forcalculations in this study. Furthermore, as the reference materials from which the CO2 emission factors werequoted used HHV, LHV was calculated from this using the conversion factor shown below (Institute ofEnergy Economics, Japan (IEEJ) [1999]).
⁃ Coal : LHV HHV * 0.96⁃ Oil : LHV HHV * 0.93⁃ LNG : LHV HHV * 0.90⁃ LPG : LHV HHV * 0.92
Additionally, regarding conversion factors for petroleum based fuels, in principle, the values given in NewEnergy and Industrial Technology Development Organization (NEDO) [1995] were used and shortfalls werecovered using International Energy Agency (IEA) values given by K.K.Sekiyutsushinsha [2002]. Forreference, NEDO [1995] conversion factors were calculated to equalize Yuasa et al. [1991] CO2 emissionfactors and Science and Technology Agency [1992] CO2 emission factors.
Unit processEnergy Efficiency
(η)
Energy of the resourcesinjected into the process
(heating value)
Energy of the product of the process(heating value)
Energy consumed in the process(heating value)
Energy of the product of the process (heating value)
Energy of the resources injected into the process + Energy consumed in the process (heating value)η =

- 8 -
Table 1.3 Heating values and CO2 emission factors
Heating Value CO2emission factorFactor
Ref. HHV LHV Ref. [kg-CO2] Ref.
Coal for coking (import) 28.9 MJ/kg 27.7 MJ/kg 3) 2.61 kg/kg 4)
Coal for general use (import) 26.6 MJ/kg 25.5 MJ/kg 3) 2.39 kg/kg 4)
Coal for general use (domestic) 22.5 MJ/kg 21.6 MJ/kg 3) 1.97 kg/kg 4)
Anthracite (import) 27.2 MJ/kg 26.1 MJ/kg 3) 2.45 kg/kg 4)
Coke 30.1 MJ/kg 28.9 MJ/kg 3) 3.25 kg/kg 4)
Coke Oven Gas 21.1 MJ/Nm3 19.0 MJ/Nm3 3) 0.85 kg/Nm3 4)
Blast Furnace Gas 3.4 MJ/Nm3 3.1 MJ/Nm3 3) 0.37 kg/Nm3 4)
Oxygen Steel Furnace Gas 8.4 MJ/Nm3 7.6 MJ/Nm3 3) 0.91 kg/Nm3 4)
Crude oil 0.8596 kg/L 1) 38.2 MJ/L44.4 MJ/kg
35.5 MJ/L41.3 MJ/kg 3) 2.64 kg/L
3.07 kg/kg 4)
NGL / gas-condensate 0.7365 kg/L 1) 35.3 MJ/L47.9 MJ/kg
32.8 MJ/L44.6 MJ/kg 3) 2.40 kg/L
3.26 kg/kg 4)
LPG 0.5500 kg/L 2) 50.2 MJ/kg 46.2 MJ/kg 3) 2.94 kg/kg 4)
Naphtha 0.7274 kg/L 1) 34.1 MJ/L46.9 MJ/kg
31.7 MJ/L43.6 MJ/kg 3) 2.22 kg/L
3.06 kg/kg 4)
Gasoline 0.7532 kg/L 1) 34.6 MJ/L45.9 MJ/kg
32.2 MJ/L42.7 MJ/kg 3) 2.38 kg/L
3.16 kg/kg 4)
Jet Fuel 0.7834 kg/L 2) 36.7 MJ/L46.8 MJ/kg
34.1 MJ/L43.6 MJ/kg 3) 2.46 kg/L
3.14 kg/kg 4)
Kerosene 0.7990 kg/L 1) 36.7 MJ/L45.9 MJ/kg
34.1 MJ/L42.7 MJ/kg 3) 2.51 kg/L
3.15 kg/kg 4)
Diesel 0.8299 kg/L 1) 38.2 MJ/L46.0 MJ/kg
35.5 MJ/L42.8 MJ/kg 3) 2.64 kg/L
3.19 kg/kg 4)
A-Heavy fuel oil 0.8430 kg/L 2) 39.1 MJ/L46.4 MJ/kg
36.4 MJ/L43.1 MJ/kg 3) 2.80 kg/L
3.32 kg/kg 4)
B-Heavy fuel oil 0.9000 kg/L 2) 40.4 MJ/L44.9 MJ/kg
37.6 MJ/L41.7 MJ/kg 3) 2.91 kg/L
3.23 kg/kg 4)
C-Heavy fuel oil 0.9130 kg/L 1) 41.7 MJ/L45.7 MJ/kg
38.8 MJ/L42.5 MJ/kg 3) 2.99 kg/L
3.27 kg/kg 4)
Lubricant 0.8800 kg/L 1) 40.2 MJ/L45.7 MJ/kg
37.4 MJ/L42.5 MJ/kg 3) 2.89 kg/L
3.29 kg/kg 4)
Asphalt & other res. oil prds 42.3 MJ/kg 39.3 MJ/kg 3)
Hydrocarbon Oil 41.0 MJ/L 38.2 MJ/L 5) 3.12 kg/L 5)
Petroleum Coke 35.6 MJ/kg 33.1 MJ/kg 3) 3.31 kg/kg 4)
Refinery Gas 44.9 MJ/Nm3 41.8 MJ/Nm3 3) 2.41 kg/Nm3 4)
Hydrocarbon oil gas 39.4 MJ/Nm3 35.4 MJ/Nm3 5) 2.04 kg/Nm3 5)
Associated gas 48.3 MJ/Nm3 43.5 MJ/Nm3 7), 8) 2.67 kg/Nm3 7)
Off gas 39.3 MJ/L 36.6 MJ/L 6) 2.05 kg/L 6)
LNG 0.7173 kg/Nm3 1) 54.5 MJ/kg 49.1 MJ/kg 3) 2.77 kg/kg 4)
Natural gas (domestic) 40.9 MJ/Nm3 36.8 MJ/Nm3 3) 2.09 kg/Nm3 4)
City Gas 13A 46.1 MJ/Nm3 41.4 MJ/Nm3 9) 2.36 kg/Nm3 4)

- 9 -
[Source] 1) NEDO [1995]2) K.K.Sekiyutsushinsha [2002] *IEA basis3) ANRE [2002-1]4) MOE [2002-1]5) PEC [2000]6) PEC [2002-2]7) Shigeta, J. [1990]8) PEC [1998]9) IEEJ [1999]
Table 1.4 Energy consumptions*1 and CO2 emissions from fuel combustion at power generationsector in Japan
per 855,488*106 kWh*2 per kWh of power generated
Energy consumption Energy consumption
HHV LHV HHV LHV %CO2 emission factor
Coal (import) 1,525 1,464 * 1015 J 1.78 1.71 MJ (18.1%) 0.1604 kg-CO2
Crude Oil 296 275 * 1015 J 0.35 0.32 MJ ( 3.5%) 0.0239 kg-CO2
C-HFO 484 450 * 1015 J 0.57 0.53 MJ ( 5.8%) 0.0405 kg-CO2
Diesel 9 8 * 1015 J 0.01 0.01 MJ ( 0.1%) 0.0007 kg-CO2
Naphtha 4 4 * 1015 J 0.00 0.00 MJ ( 0.0%) 0.0003 kg-CO2
NGL 2 2 * 1015 J 0.00 0.00 MJ ( 0.0%) 0.0002 kg-CO2
LNG 2,107 1,896 * 1015 J 2.46 2.22 MJ (25.1%) 0.1251 kg-CO2
LPG 20 18 * 1015 J 0.02 0.02 MJ ( 0.2%) 0.0014 kg-CO2
Natural gas 22 20 * 1015 J 0.03 0.02 MJ ( 0.3%) 0.0013 kg-CO2
COG 61 55 * 1015 J 0.07 0.06 MJ ( 0.7%) 0.0029 kg-CO2
LDG / BFG 146 131 * 1015 J 0.17 0.15 MJ ( 1.7%) 0.0184 kg-CO2
Wastes 19 19 * 1015 J 0.02 0.02 MJ ( 0.2%) 0*3 kg-CO2
Geothermal 29 29 * 1015 J 0.03 0.03 MJ ( 0.3%) 0*3 kg-CO2
Hydro 787 787 * 1015 J 0.92 0.92 MJ ( 9.4%) 0*3 kg-CO2
Nuclear 2,892 2,892 * 1015 J 3.38 3.38 MJ ( 34.4%) 0*3 kg-CO2
Total 8,403 8,051 * 1015 J 9.82 9.41 MJ (100.0%) 0.375 kg-CO2
*1) Actual values of FY2000 in Japan*2) Amount supplied from power producers to final energy consumption*3) CO2 emissions at waste power generation, geothermal power generation, hydropower generation and
nuclear power generation are considered as 0. [Source] ANRE [2002-1]

- 10 -
Power generation process data based on the average electricity configuration of the relevant country wasreferenced regarding electricity input into overseas processes. Energy consumption values of each country(China, Indonesia, Malaysia, India, United Kingdom, France, Holland, European Union, Russia, United States,Canada, Brazil, South Africa, and Australia) during power generation and CO2 emission factors during fuelcombustion are shown in Table 1.5.
Table 1.5 Energy consumptions and CO2 emissions from fuel combustion at power generationsector by country (per kWh: receiving end basis, actual results of CY2001)
Energy consumptionCountry
HHV LHVCO2 emission
factor Loss Source
China 12.68 12.19 MJ 1.034 kg-CO2 0.083 IEA [2003-2]
Indonesia 12.49 11.75 MJ 0.767 kg-CO2 0.135 IEA [2003-2]
Malaysia 9.48 8.62 MJ 0.492 kg-CO2 0.060 IEA [2003-2]
India 18.42 17.68 MJ 1.490 kg-CO2 0.294 IEA [2003-2]
UK 11.10 10.57 MJ 0.564 kg-CO2 0.088 IEA [2003-1]
France 11.52 11.46 MJ 0.069 kg-CO2 0.062 IEA [2003-1]
Holland 10.88 10.06 MJ 0.637 kg-CO2 0.039 IEA [2003-1]
EU 10.72 10.37 MJ 0.420 kg-CO2 0.063 IEA [2003-2]
Russia 18.07 16.87 MJ 0.927 kg-CO2 0.141 IEA [2003-2]
USA 12.09 11.61 MJ 0.712 kg-CO2 0.061 IEA [2003-1]
Canada 7.43 7.24 MJ 0.264 kg-CO2 0.079 IEA [2003-1]
Brazil 6.05 5.94 MJ 0.111 kg-CO2 0.159 IEA [2003-2]
South Africa 14.15 13.62 MJ 1.206 kg-CO2 0.091 IEA [2003-2]
Australia 13.90 13.29 MJ 1.157 kg-CO2 0.082 IEA [2003-1]

- 11 -
2. Well-to-Tank Data Compilation Procedures and Calculation Methods
2.1 Petroleum Based Fuel Production Pathways
2.1.1 Abstract
Fuels derived from petroleum include current diesel, low sulfur diesel, ultra low sulfur diesel, current gasoline,future gasoline, kerosene, naphtha, LPG and heavy fuel oil. Of these, concerning diesel and gasoline(including future types), which are both currently used as fuels for motor vehicles, this study assumes that thesupply route would remain similar to that of existing routes (same applies to on-board reforming type FCVs).Post-petroleum refining LPG is handled comprehensively in “2.5 Liquefied Petroleum Gas (LPG) ProductionPathways”. Regarding other petroleum based products; this study assumes that such products will be suppliedto vehicles following some form of conversion.
(1) Diesel
Colorless or fluorescent russet colored petroleum products with gravity ranging from 0.805-0.850, boilingrange 180-350 degrees C, distilled after the kerosene fraction during crude distillation. Although the mainusage is in automotive, rail and shipping industries, diesel fuel is also used in ceramic and steel industries aswell as for supplementary fuel in electricity production. The characteristics of diesel include ignitability, lowtemperature fluidity (high Cetane Number), good viscosity and low sulfur content. In particular, in line withenvironmental measures, sulfur content was lowered to less than 0.2 wt% from the previous content of lessthan 0.5 wt% in 1992, and subsequently lowered to less than 0.05 wt% from October 1997.Furthermore, permissible limits of sulfur content in diesel fuel will be amended to 0.005 wt% in 2005(Ministry of the Environment (MOE) [2003-1]). Moreover, MOE [2003-2] reports that from 2007 it will beappropriate to set 0.001 wt% as the permissible limit target value. For these reasons, this study defines dieselwith 0.05 wt% sulfur content as “current diesel”, 0.005 wt% sulfur content as “low sulfur diesel” and 0.001wt% sulfur content as “ultra low sulfur diesel”, and seeks to quantify each type.
(2) Gasoline
Gasoline refers to petroleum products obtained from crude at the lowest boiling fraction (about 30-220degrees C), which are in liquid form at normal temperature. Variations in production technique separategasoline into natural gasoline, straight-run gasoline, reformed gasoline, cracked gasoline, synthetic gasoline,and so on. In chemical terms, all these are hydrocarbon compounds ranging from carbon number 4-12.Although gasoline is separated into industrial grade and fuel grade depending on usage, gasoline forautomotive usage falls into the latter category and is manufactured through the mixture of a variety ofgasoline components. The most important aspect of automotive gasoline is the anti-knock property, indicatedby the octane number. In Japan, the octane number for regular gasoline is approximately 90 and the octanenumber for premium gasoline is approximately 100. The removal of lead from gasoline has been in practicefor regular gasoline since February 1975, and since October 1983 for premium gasoline. In addition,concerning aromatic and olefin content, many oil companies implement self-regulation as part of theirenvironmental measures. Furthermore, concerning benzene, a figure of less than 5% was adopted as the

- 12 -
standard since the liberalization of manufactured imports in April 1996.As with diesel, from 2005 the permissible limit of sulfur content in gasoline will be amended from 0.01 wt%to 0.005 wt% (MOE [2003-1]). For these reasons, this study defines gasoline with 0.01 wt% sulfur content as“current gasoline” and 0.005 wt% sulfur content as “future gasoline”, and seeks to quantify each type.
(3) Kerosene
The name “kerosene” predates the invention of the automobile and can be said to be a legacy of a time whendiversification of petroleum products had not occurred and kerosene, as a source of light, was the onlypetroleum product in use. The kerosene fraction has a gravity ranging from 0.78-0.83, and a boiling range of145-300 degrees C. Specifically, during crude distillation, the distillation of the kerosene fraction takes placebetween the distillation of gasoline and diesel, with sulfur content and other impurity removal and refiningmainly conducted through hydro-treatment, producing a colorless or citrine transparent product with apetroleum odor. The carbon-hydrogen ratio (C/H Ratio) within kerosene constituents is 6-7, specifically 86-88wt% carbon to 12-14 wt% hydrogen. Kerosene is not used directly as a fuel for automobiles and in thisstudy, kerosene is considered as a resource for hydrogen production through steam reforming.
(4) Naphtha
In many cases, the term “naphtha”, as used in United States, refers to heavy gasoline, whereas in Japan theterm is largely used in reference to unrefined gasoline (semi-product gasoline). The boiling range is about 30-200 degrees C. The main use of naphtha, when shipped as naphtha, is petrochemical, specifically as aresource for thermal cracking in the production of ethylene, propylene, butadiene, and so on. As withkerosene, naphtha is considered in this study mainly as a resource for hydrogen production through steamreforming.
(5) LPG
LPG is a hydrocarbon with carbon number 3 or 4, specifically propane, propylene, butane, butylene, or otherpetroleum products with these as the main constituents. Although LPG is a gas under normal temperature andpressure conditions, it can easily be converted to liquid form at relatively low pressures and moderate cooling.Colorless and odorless, with a liquid gravity of 0.50-0.58, and gas gravity at 1.5-2.0 in relation to air at 1.0,LPG accumulates in low places in the event of leakage. In Japan, as a fuel for automobiles, LPG is mainlyused in taxis.
(6) Heavy Fuel Oil
Heavy fuel oils are used for internal combustion in diesel engines and gas turbines, and for externalcombustion in boilers and all types of industrial furnaces, as a mineral oil with suitable qualities, with typesand quality standards set forth in the Japanese Industrial Standards (JIS). Heavy fuel oil products are producedthrough the mixture of high viscosity oils such as topper residue, vacuum residue and solvent deasphaltingresidue with low viscosity oils such as straight-run diesel and cracked diesel, in accordance with the desiredproperties, such as viscosity, sulfur content, pour point, flash point and carbon residue content. In this study,heavy fuel oils are considered as fuels for power generation.

- 13 -
Above content is drawn from Japan National Oil Corporation (JNOC) [1986], Taki [1997], Japan PetroleumInstitute (JPI) [1998].
2.1.2 Procedures for data collection of unit process
The fuel production pathway flow for petroleum based fuels examined in this study are shown in Figure 2.1.1:
Figure 2.1.1 Pathway flow for petroleum based fuels
Regarding the refining process of petroleum products overseas and processes related to the import of suchproducts, in relation to diesel and gasoline currently used as automobile fuel, as the amount refined overseasis small in comparison to the amount refined domestically (less than 3%), the omission of these processes isconsidered appropriate. On the other hand, while it is also a petroleum product, in relation to naphtha, whichis mainly for petrochemical purposes, the amount refined and imported from overseas is greater than theamount refined domestically (see Table 2.1.1). Accordingly, when considering naphtha as an intermediaryproduct in the production pathway of automobile fuels, the consideration of overseas petroleum refiningprocesses and naphtha import processes (transportation via sea) may become necessary. However, as theinformation necessary for the creation of inventory data regarding overseas refining processes wasunobtainable, for this study, these processes have been treated as beyond the system boundary.
Table 2.1.1 Amount of domestic and imported production of petroleum products [Unit: 103 kL]
Diesel Gasoline Naphtha Kerosene A-heavy fuel C-heavy fuel
Domestic 41,530(97.0%)
58,216(98.0%)
18,501(39.7%)
27,366(93.1%)
28,166(96.7%)
32,332(97.6%)
Imported 1,306(3.0%)
1,215(2.0%)
28,129(60.3%)
2,030(6.9%)
973(3.3%)
780(2.4%)
[Source] METI [2002]
Conventional diesel
Low sulfur diesel
Ultra low sulfur diesel
Conventional gasoline
Future gasoline
Crude oil
Flarecombustion
Overseastransportation
(sea)Crudeextraction
associated CO2
CH4 vent
Petroleumrefining
(domestic)Domestic
transportation(sea/land)
Kerosene
Naphtha
Heavy fuel oil
Fueling tovehicles
Domestictransportation
(sea/land) to on-site hydrogen production pathway
to on-site hydrogen production pathway
to power generation pathway
(gasoline vehicle) (gasoline hybrid vehicle)
Domestictransportation
(sea/land)
Fueling tovehicles
(diesel vehicle) (diesel hybrid vehicle)
LPG to LPG production pathway
to LPG production pathway
to power generation pathway
Associatedgas

- 14 -
(1) Crude Extraction
<i> Existing Study
As gas production generally accompanies crude extraction, the majority of oil fields use this associated gas asthe energy source for the operation of the extraction facilities. The amount of associated gas required for theextraction of crude, based only on information from the Arabian Oil Co., Ltd., as shown in Institute ofApplied Energy (IAE) [1990] (p.118), stands at 23 SCF/B1, while Petroleum Energy Center (PEC) [1998](p.17) gives a figure of 50-60 SCF/B based on the results of a hearing survey conducted with oil fields in theUAE and Saudi Arabia, both major suppliers of crude to Japan (60 SCF/B is used for calculation purposes). Inaddition, following on from PEC [1998], PEC [2002-2] (p.18) also uses 60 SCF/B for calculation purposes.
<ii> This Study
60 SCF/B, used both in PEC [1998] and PEC [2002-2], is also used in this study. For the composition ofassociated gas, the composition given in IAE [1990], used by both PEC [1998] and Shigeta [1990], wasadopted. This is the weighted average derived from the composition of associated gases of Middle East oilfields. From this composition and the higher heating value set out for each gas in PEC [1998], it is possible tocalculate the heating values for associated gases and CO2 emission factors during combustion.
(2) Flare Combustion
<i> Existing Study
Associated gas excess to the requirements of the crude extraction process is burnt off at the flare stack.Shigeta [1990] and PEC [1998] (p.20) calculate flare stack energy expenditure and CO2 emissions. Shigeta[1990] sets out the associated gas oil ratio (Gas Oil Ratio, GOR) for Middle East light crude oil fields, MiddleEast heavy crude oil fields, Southeast Asia and China (source unknown). On the other hand, PEC [1998]reasons that the Middle East and Indonesia account for the majority of crude imports to Japan and sets outGOR for each country. Where available, information from the Information Center for Petroleum Explorationand Production (ICEP) database was used, and unknown values were estimated from API gravity and location.Calculations in either report are based on flare ratio figures (proportion of associated gases burnt off at theflare stack) given in Organization of the Petroleum Exporting Countries (OPEC) Annual Reports (1987Report used by Shigeta [1990], 1995 Report used by PEC [1998]). In addition, while PEC [2002-2] (p.19)follows the calculation method used in PEC [1998], flare ratio settings have been updated using data from the1999 OPEC Annual Statistical Bulletin.
<ii> This Study
This study follows the calculation methods used in PEC [1998]. Regarding crude import volume, from therelationship with data gathered in relation to domestic petroleum refining, although the data is slightly dated,actual values from 1997 given in Ministry of International Trade and Industry (MITI) [1998] were used. In
1 1 SCF (standard cubic feet) = 0.0263 Nm3, 1B (barrel) = 158.9873 litre

- 15 -
addition, GOR values set out for each country in PEC [1998] were used. Flare ratios for each country werecalculated from total production and flare amount figures of the natural gas production volume breakdowngiven in OPEC [2001]. In addition, regarding Middle East countries for which flare related information wasnot available, weighted average values calculated using values from Middle East countries with clear flareratios and import volumes were used.
(3) Associated CO2
<i> Existing Study
Regarding CO2 content of associated gas (emissions into the atmosphere) other than from in-houseconsumption or flared; IAE [1990] and Shigeta [1990] calculate values based on the associated gascomposition.
<ii> This Study
According to IAE [1990], as the percentage of CO2 in associated gas is 5.8%, associated CO2 volume wascalculated by multiplying the desired associated gas volume by this percentage.
(4) CH4 Vent
<i> Existing Study
Regarding CH4 vent during crude extraction, the carbon equivalent is given in Central Research Institute ofElectric Power Industry (CRIEPI) [1992] (p.32) and IEEJ [1999] (p.23). Of these, the basis for the figuregiven in CRIEPI [1992] is unclear. In addition, IEEJ [1990] assumes that there is no CH4 vent during crudeextraction and that leakage occurs only during associated gas production, and a theoretical calculation is usedto calculate the value.
<ii> This Study
Calculations in this study are based on values given in IEEJ [1999]. Furthermore, although the heating valuegiven in this literature is HHV and CO2 emissions are given as the carbon equivalent when thecharacterization factor for CH4 global warming is set at 21, this study conducts calculation into CO2
equivalent using the value 23, shown in Table 1.2. In addition, this study has also taken energy loss throughCH4 vent into consideration.
(5) Overseas Transportation (Sea)
<i> Existing Study
Large ocean tankers are used to transport crude oil from crude producing countries to Japan. While IAE[1990] (p.38) states that Southeast Asia and China use 100,000 t tankers and the Middle East/other regionsuse 250,000 t tankers, PEC [1998] (p.33) states 80,000 t tankers for China, 100,000 t tankers for North

- 16 -
America and Oceania, and 250,000 t tankers for the Middle East and other regions, with both calculating fuelconsumption factor per region from the fuel consumption of each ocean tanker.Regarding calculations, while IAE [1990] considered only the passage, PEC [1998] (p.34) also takes fuelconsumption while moored and for cargo heating for high viscosity crude into consideration. Regardingcalculation method, PEC [1998] sought the weighted average of shipping distance based on import volumefor each region and used this figure to calculate fuel consumption for one voyage. IAE [1990] gives no detailsconcerning calculation method.PEC [2002-2] follows the calculation methods used in PEC [1998].
<ii> This Study
In this study, using the ocean tanker sizes specified in PEC [1998], energy consumption and GHG emissionsare calculated inclusive of fuel consumption while moored and for cargo heating.This study specifies ocean tanker size and shipping distance for each crude producing country and ascertainsfuel consumption per voyage per country, and uses the weighted average value relative to import volume inorder to calculate fuel consumption per kg of crude. Furthermore, fuel consumption per kg crude for externaltransportation (sea) was calculated separately for refining or electricity generation depending on intendedusage.Regarding crude import volume, from the relationship with data gathered in relation to domestic petroleumrefining, although the data is slightly dated, actual values from 1997 given in MITI [1998] were used. Inaddition, the marine shipping distance was calculated as the distance from the port of shipment of the crudeproducing country to the Yokohama Port. Furthermore, regarding Brunei, Iraq, Equatorial Guinea and Congo,as data concerning the distance of crude produced in these countries from the port of shipment was notavailable, data from relatively nearby countries and regions was substituted.
(6) Refining in Japan
<i> Existing Study
In Shigeta [1990] and PEC [1997] (p.52), energy consumption and environmental burden per unit quantity ofpetroleum product is calculated from the material balance in the petroleum product producing industry (grossproduction volume of petroleum products, and input of raw materials/ingredients).PEC [2000] conducts further subdivision of the refining process of petroleum products and constructs aprocess flow diagram (PFD). Although energy consumption per product calculations are made based on thisdiagram, material balance data is cited for product yield settings (p.33-34). CO2 emissions were calculatedfrom energy consumption during refining per product, derived from material balance data and the PFD, underthe assumption that CO2 emissions are proportionate to energy consumption, as it was considered impossibleto gather detailed and accurate data representative of all refineries in Japan for each subdivided refiningprocess and fuel input for each (p.40).PEC [2002-2] (p.30) also subdivides the refining process and configures a PFD, and calculates energyconsumption for each product (current gasoline, future gasoline, current diesel, low sulfur diesel, naphtha)during the refining process, citing JPI [1998] and others, as the calculation basis for heat efficiency. Thisliterature also uses material balance data for CO2 emissions calculations, multiplying the weighted average

- 17 -
value derived from annual total emissions per fuel type in relation to the CO2 emissions index for the heatingvalue of each fuel type used, by energy consumption per product within the refining process.All reports source material balance data from the “Yearbook of Production, Supply and Demand of Petroleum,Coal and Coke”. Shigeta [1990] from the 1987 edition, PEC [1997] from the 1995 edition, PEC [2000] fromthe 1997 edition and PEC [2002-2] from the 2000 edition.
<ii> This Study
This study adopted the calculation method used in PEC [2000] to calculate energy consumption and GHGemissions. Although this selection was based on the need to calculate data regarding kerosene, heavy fuel oilsand LPG not covered in PEC [2002-2], as the calculations of both these reports are based on the samereasoning, it was inferred that the difference between these reference materials would have little effect oncalculation results.The “Yearbook of Production, Supply and Demand of Petroleum, Coal and Coke” edition used here is the1997 edition (MITI [1998]). Furthermore, although PEC [2000] uses only actual performance data of refiners,as actual values per refiner given in MITI [1998] were insufficient, general data (inclusive of refiners,lubricant manufacturers, other related industries) was used.To begin, energy consumption for petroleum refining was calculated. For calculation purposes figures givenin MITI [1998] for fuel consumption (p. 50-53), input and yield (p. 68-71), and electricity usage (p.150) wereused. Energy consumption (LHV) associated with the consumption of these fuels was 511,514 TJ/year, andCO2 emissions 31,859*103 t-CO2/year. Furthermore, on top of this energy consumption, PEC [2000] (p. 40-41) includes in-house consumption of catalytic coke and CO gas, and subsequently, this study also includesthese factors (LHV/HHV ratio 0.93 for coke, 0.9 for CO gas).To follow, these were then allocated to each petroleum product using energy consumption per product ratioscalculated in PEC [2000] (p.33-34) using the PFD. That is to say, allocation was conducted using the ratiobetween energy consumption for each product given in PEC [2000] (p.33-34) and their average values (67 L-FOE/kL).Regarding low-sulfur diesel, according to the trial calculations in PEC [2000] (p.45), the installation of ultradeep hydrodesulfurization unit will increase energy consumption by almost 1.5 times from 42 to 61 L-FOE/kL-Diesel, and increase the overall average for petroleum products from 68 to 71 L-FOE/kL-product.On the other hand, a report referenced by PEC [2002-2] (p.31) states that hydrogen consumption necessaryfor the desulfurization of 50ppm sulfur content would be 1.3 to 1.5 times greater than for 500ppm. Therefore,for this study, calculations for the required energy consumption for the production of low-sulfur diesel weremade based on the trial calculation results of PEC [2000].In addition, as no information regarding energy consumption for ultra low sulfur diesel and future gasolinewas obtainable, calculations were based on the assumption that the ratio in relation to the average would be 2times that of current diesel for ultra low sulfur diesel at approximately 1.2, and 2.0 for future gasoline.Furthermore, regarding the process yield of the petroleum refining process (ratio of petroleum products inrelation to processed crude volume), the ratio of total petroleum product volume (weight) in relation toprocessed crude volume (weight) was used.
- 18 -
(7) Domestic Transportation (Sea/Land)
<i> Existing Study
Shigeta [1990] cites CO2 emissions during domestic transportation at a uniform 10% of CO2 emissions duringmarine shipping. In addition, in PEC [1998] (p.43-51) based on the actual transportation status of petroleumproducts and fuel usage data gathered by the Petroleum Association of Japan (PAJ) in order to formulate the“Oil Industry Voluntary Action Plan for Global Environment Conservation”, environmental burden wascalculated specifying three transportation types (tanker lorries, coastal tankers, tanker truck). Environmentalload calculations in PEC [2002-2] (p. 48-50) are based on PAJ [2000].
<ii> This Study
This study cites data used in PEC [2002-2]. Specifically, energy consumption and GHG emissions duringtransportation of "white oil" (gasoline, diesel oil, kerosene, naphtha, LPG) and "black oil" (heavey fuel oil)were calculated using the data given on p.49 of the report regarding the domestic overland transportationprocess of petroleum products, and data given on p.50 regarding coastal transportation. Regarding fuelconsumed, diesel was considered as the fuel for the domestic overland transportation process, while for thecoastal transportation process, fuel consumption was split into 90% C-heavy fuel oil while under way and10% A-heavy fuel oil for port entry/exit, based on information provided in PEC [1998] (p.45). In addition, forfinal results, energy consumption and GHG emissions were calculated based on values obtained through thedistribution of fuel consumption over transportation volume, for both domestic overland and coastaltransportation.
(8) Fueling to Vehicles
No particular consideration has been given in either this or prior studies concerning energy consumption andGHG emissions during the fueling to vehicles with diesel or gasoline. In addition, this study set the value ofsuch at zero following confirmation through hearing surveys that levels were practically insignificant.
- 19 -
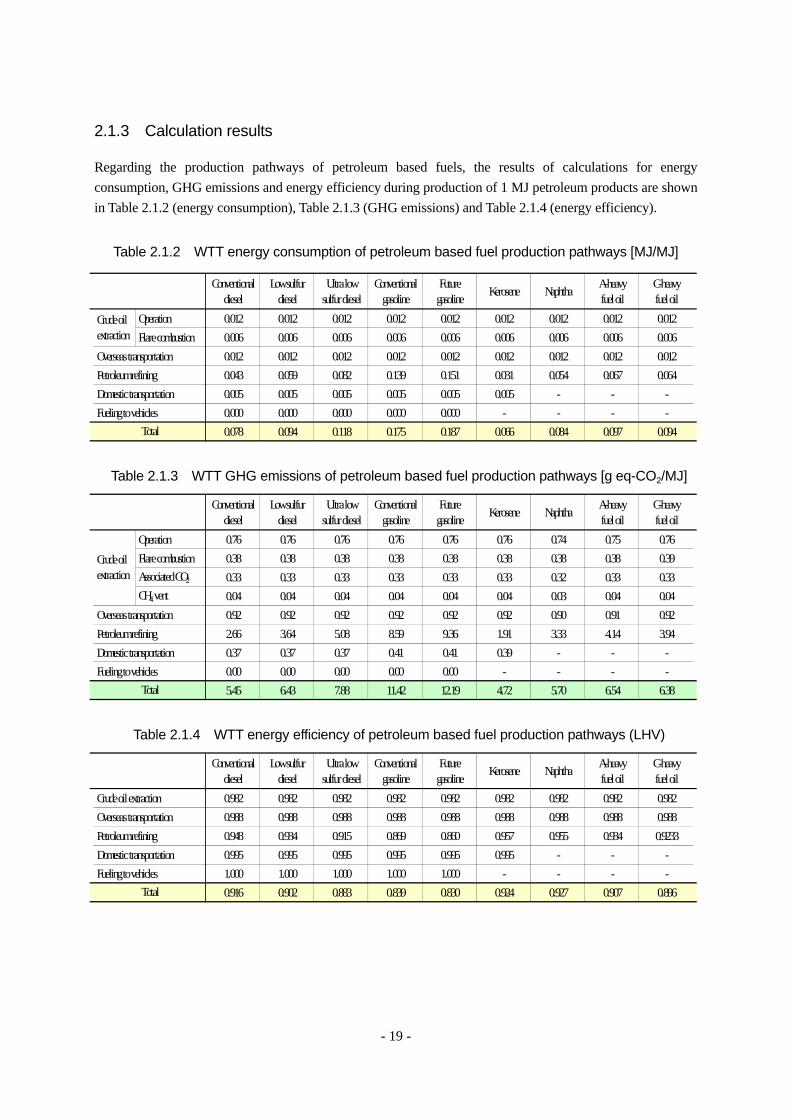
2.1.3 Calculation results
Regarding the production pathways of petroleum based fuels, the results of calculations for energyconsumption, GHG emissions and energy efficiency during production of 1 MJ petroleum products are shownin Table 2.1.2 (energy consumption), Table 2.1.3 (GHG emissions) and Table 2.1.4 (energy efficiency).
Table 2.1.2 WTT energy consumption of petroleum based fuel production pathways [MJ/MJ]
Table 2.1.3 WTT GHG emissions of petroleum based fuel production pathways [g eq-CO2/MJ]
Table 2.1.4 WTT energy efficiency of petroleum based fuel production pathways (LHV)
Conventionaldiesel
Low sulfurdiesel
Ultra lowsulfur diesel
Conventionalgasoline
Futuregasoline Kerosene Naphtha A-heavy
fuel oilC-heavyfuel oil
Operation 0.012 0.012 0.012 0.012 0.012 0.012 0.012 0.012 0.012 Flare combustion 0.006 0.006 0.006 0.006 0.006 0.006 0.006 0.006 0.006
Overseas transportation 0.012 0.012 0.012 0.012 0.012 0.012 0.012 0.012 0.012 Petroleum refining 0.043 0.059 0.082 0.139 0.151 0.031 0.054 0.067 0.064 Domestic transportation 0.005 0.005 0.005 0.005 0.005 0.005 - - - Fueling to vehicles 0.000 0.000 0.000 0.000 0.000 - - - -
0.078 0.094 0.118 0.175 0.187 0.066 0.084 0.097 0.094
Crude oil extraction
Total
Conventionaldiesel
Low sulfurdiesel
Ultra lowsulfur diesel
Conventionalgasoline
Futuregasoline Kerosene Naphtha A-heavy
fuel oilC-heavyfuel oil
Operation 0.76 0.76 0.76 0.76 0.76 0.76 0.74 0.75 0.76 Flare combustion 0.38 0.38 0.38 0.38 0.38 0.38 0.38 0.38 0.39 Associated CO2 0.33 0.33 0.33 0.33 0.33 0.33 0.32 0.33 0.33 CH4 vent 0.04 0.04 0.04 0.04 0.04 0.04 0.03 0.04 0.04
Overseas transportation 0.92 0.92 0.92 0.92 0.92 0.92 0.90 0.91 0.92 Petroleum refining 2.66 3.64 5.08 8.59 9.36 1.91 3.33 4.14 3.94 Domestic transportation 0.37 0.37 0.37 0.41 0.41 0.39 - - - Fueling to vehicles 0.00 0.00 0.00 0.00 0.00 - - - -
5.45 6.43 7.88 11.42 12.19 4.72 5.70 6.54 6.38Total
Crude oil extraction
Conventionaldiesel
Low sulfurdiesel
Ultra lowsulfur diesel
Conventionalgasoline
Futuregasoline Kerosene Naphtha A-heavy
fuel oilC-heavyfuel oil
Crude oil extraction 0.982 0.982 0.982 0.982 0.982 0.982 0.982 0.982 0.982 Overseas transportation 0.988 0.988 0.988 0.988 0.988 0.988 0.988 0.988 0.988 Petroleum refining 0.948 0.934 0.915 0.869 0.860 0.957 0.955 0.934 0.9233 Domestic transportation 0.995 0.995 0.995 0.995 0.995 0.995 - - - Fueling to vehicles 1.000 1.000 1.000 1.000 1.000 - - - -
0.916 0.902 0.883 0.839 0.830 0.924 0.927 0.907 0.896Total
- 20 -
2.2 Natural Gas Based Fuel Production Pathways
2.2.1 Abstract
Natural gas has low energy density and incurs high shipping costs. In order to reduce this shipping cost, it willbe necessary to physically or chemically improve the energy density of natural gas. Physical methods ofimprovement include liquefaction through cooling to produce liquefied natural gas (LNG), compression toproduce compressed natural gas (CNG), and hydration for transportation of natural gas in hydrated form.On the other hand, chemical improvement involves conversion into different substances through chemicalprocesses applied at the wellhead, and mainly involves the conversion of gas into a liquid fuel, hence thetechnology is called Gas-to-Liquid (GTL). This section concentrates on LNG (physical improvement) andproducts derived from LNG (e.g. city gas). GTL is covered in “2.4 Synthetic Fuel Production Pathways”.
(1) LNG
Natural gas, composed mainly of CH4, is chilled to ultra low temperatures and liquefied following theremoval of impurities such as moisture, sulfur compounds and CO2 to produce LNG. Natural gas liquefies atapproximately -160 degrees C, and is reduced in volume to one six-hundredth that of gas through liquefaction,facilitating convenience of transportation and storage. Accordingly, conversion to LNG for temporary storageis used as a method of peak shaving for natural gas, and LNG conversion of natural gas for transportation isused in cases of transoceanic transportation where natural gas transportation via pipeline is not possible.The main uses of LNG are for electricity and city gas.
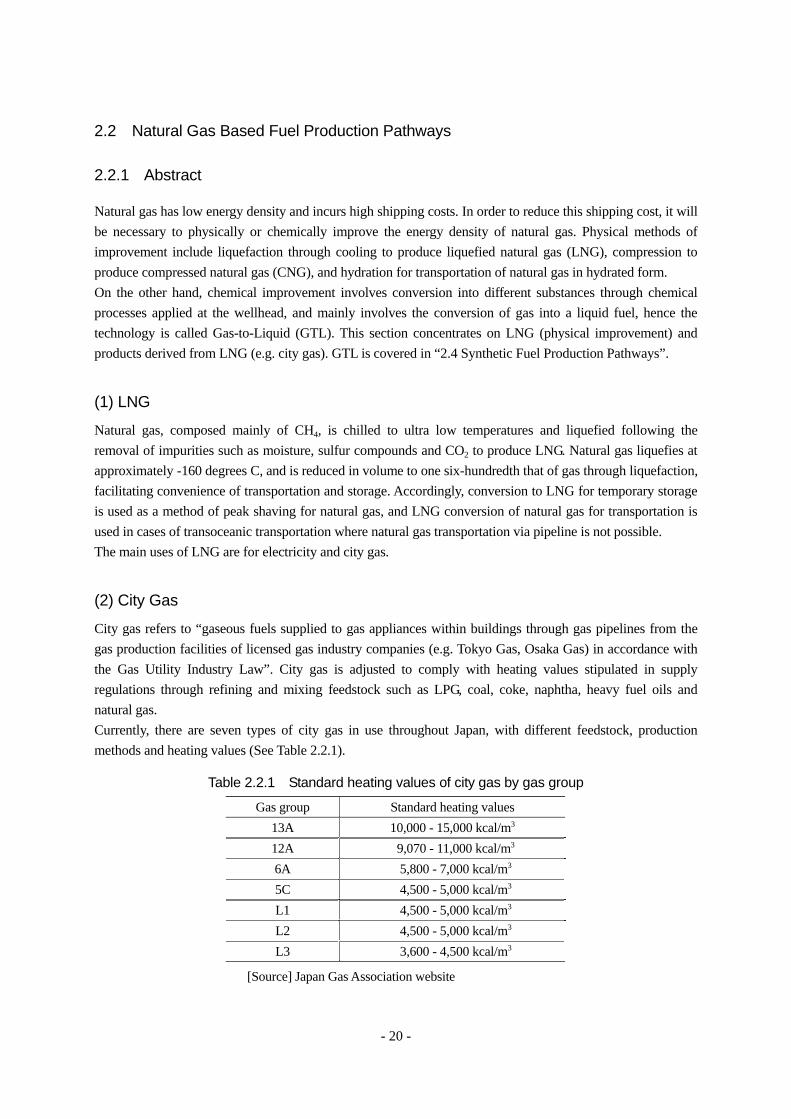
(2) City Gas
City gas refers to “gaseous fuels supplied to gas appliances within buildings through gas pipelines from thegas production facilities of licensed gas industry companies (e.g. Tokyo Gas, Osaka Gas) in accordance withthe Gas Utility Industry Law”. City gas is adjusted to comply with heating values stipulated in supplyregulations through refining and mixing feedstock such as LPG, coal, coke, naphtha, heavy fuel oils andnatural gas.Currently, there are seven types of city gas in use throughout Japan, with different feedstock, productionmethods and heating values (See Table 2.2.1).
Table 2.2.1 Standard heating values of city gas by gas group
Gas group Standard heating values13A 10,000 - 15,000 kcal/m3
12A 9,070 - 11,000 kcal/m3
6A 5,800 - 7,000 kcal/m3
5C 4,500 - 5,000 kcal/m3
L1 4,500 - 5,000 kcal/m3
L2 4,500 - 5,000 kcal/m3
L3 3,600 - 4,500 kcal/m3
[Source] Japan Gas Association website

- 21 -
Of these, the composition of city gas type 13A, the most commonly used type in within Japan, is shown inTable 2.2.2.
Table 2.2.2 The composition of city gas type 13A
Composition Content [wt%]
Methane CH4 70 - 80
Ethane C2H6 < 10
Propane C3H8 10 - 20
Butane C4H10 < 10
[Source] Japan Gas Association website
In this study, concerning supply pathways, other than cases where processing and liquefaction take place atoverseas production sites prior to importation as LNG, cases of direct overseas transportation via pipeline(from Sakhalin) were also considered. In addition, for methods fueling to automobiles, other than cases ofcompressed city gas (CNG vehicles), the direct fueling of LNG (LNG vehicles), which may become popularin the future, was also considered.
2.2.2 Procedures for data collection of unit process
The fuel production pathway flow for natural gas based fuels examined in this study are shown in Figure2.2.1:
Figure 2.2.1 Pathway flow for natural gas based fuels production
(1) Natural Gas Extraction
<i> Existing Study
Shigeta [1990] calculates CO2 emissions from extraction and production (liquefaction) processes based onvolume of raw natural gas as feedstock, obtained through the consideration of raw natural gas composition foreach producing region and the 1987 import volume ratio.NEDO [1996] (p.101) adopts the input volumes of A-heavy fuel oil as fuel used during exploration /extraction of natural gas based on data from the Bontang gas fields, Indonesia.
Rawnatural gas
Flarecombustion
Processingand
liquefaction
Gasextraction
CH4 vent
Overseastransportation
(sea)LNG
City gasproduction
Transportation(pipeline)
City gasCity gas
distributionFueling tovehicles
(CNG vehicle)
(LNG vehicle)
LPG
to synthetic fuel production pathways
Flarecombustion
CH4 vent
associated CO2
to on-site hydrogen production pathway to on-site/off-site hydrogen production pathway
Fueling tovehicles
to LPG production pathway
to power generation pathway

- 22 -
Tamura et al. [1999] conducted fields surveys in five source countries/regions of LNG for city gas (Alaska,Indonesia, Malaysia, Brunei, Australia), and calculated the weighted average value through the import volumeratio (1997) for CO2 emissions based on data obtained from four of these source countries/regions excludingAlaska. Calculations using similar calculation methods and based on similar data are conducted in IEEJ[1999] (p.24). For co-produced LPG, condensate, and so on, both give distributed values on a calorific basis.In addition, apart from the Japan average, IEEJ [1999] also conducts calculations regarding LNG for city gasbased on import volume ratio.PEC [2002-2] calculates energy efficiency based on IEEJ [1999]. In addition, Okamura et al. [2004] givesdata calculated after the addition of survey details related to the Middle East Project (Qatar, Oman) to thesurvey results of IEEJ [1999].
<ii> This Study
This study cites Okamura et al. [2004]. However, regarding energy consumption, calculations are made fromheating value based fuel ratio data using the entrance to liquefaction facilities as the reference point, obtainedfrom a hearing survey conducted with the Japan Gas Association (JGA) in relation to the content of Okamuraet al. [2004].
(2) Processing and Liquefaction
<i> Existing Study
IAE [1990] (p.121) provides data for LNG import volumes, raw natural gas composition, raw natural gasprocessing volumes, natural gas consumption and CO2 emissions for each country of origin (actual values for1987). Ogawa et al. [1998] calculates fuel ratios from this data and estimates CO2 emissions from LNGimport volumes per gas producing country for 1996. In addition, Hondo et al. [1999] also includes Australiaas a gas producing country, and uses similar methods to determine the natural gas volumes required forliquefaction. The fuel efficiency determined from the results of these reports is approximately 88 %.NEDO [1996] gives energy consumption during liquefaction as 9 vol% of natural gas produced, and statesthat 6 vol% of natural gas produced is associated gas (mainly CO2). According to these values, fuel efficiencyduring liquefaction, excluding associated gas, is approximately 90 %.Although Tamura et al. [1999] and IEEJ [1999] (p.24) both calculated the weighted average value through theimport volume ratio (1997) for CO2 emissions based on data obtained from fields surveys conducted in fivesource countries/regions of LNG for city gas, there are slight discrepancies in the results. Both reports givedistributed values on a calorific basis for co-produced LPG, condensate, and so on.PEC [2002-2] (p.53) calculates fuel efficiency based on IEEJ [1999], with a given result of 92 %.In addition, Okamura et al. [2004] gives data calculated after the addition of survey details related to theMiddle East Project (Qatar, Oman) to the survey results of IEEJ [1999].
<ii> This Study
As with the natural gas production (extraction) process, this study cites Okamura et al. [2004]. However,regarding energy consumption, calculations are made from heating value based fuel ratio data using theentrance to liquefaction facilities as the reference point, obtained from a hearing survey conducted with the

- 23 -
JGA in relation to the content of Okamura et al. [2004].
(3) Flare Combustion
<i> Existing Study
Shigeta [1990] does not conduct calculations for flared gas as the liquefaction facilities and the gas wells ofthe Japan LNG project are interlinked, and in comparison to the amount of gas consumed in the liquefactionprocess, the amount flared is practically insignificant. Ogawa et al. [1998] gives 4 % as the worldwideaverage flare combustion ratio in relation to natural gas production for 1996, while also stating that formodern LNG production facilities, the flare combustion ratio is 1 % as the amount of natural gas burnt duringproduction is lower.Tamura et al. [1999] and IEEJ [1999] (p.24) handle flare combustion during extraction and duringliquefaction separately, calculating the weighted average value through the import volume ratio (1997) forCO2 emissions based on data from the previously mentioned fields surveys conducted in five sourcecountries/regions of LNG for city gas, but there are slight discrepancies in the results. Both reports givedistributed values on a calorific basis for co-produced LPG, condensate, and so on.PEC [2002-2] (p.53) calculates fuel efficiency based on IEEJ [1999].In addition, Okamura et al. [2004] gives data calculated after the addition of survey details related to theMiddle East Project (Qatar, Oman) to the survey results of IEEJ [1999].
<ii> This Study
As with the other processes, this study cites Okamura et al. [2004]. However, regarding energy consumption,calculations are made from heating value based fuel ratio data using the entrance to liquefaction facilities asthe reference point, obtained from a hearing survey conducted with the JGA in relation to the content ofOkamura et al. [2004].
(4) Associated CO2
<i> Existing Study
IAE [1990] multiplies the raw natural gas input to liquefaction plants given per gas producing country by theCO2 content percentage of raw natural gas, and calculates associated CO2 by obtaining the weighted averagethrough the import volume ratio of 1987. Based on this, Ogawa et al. [1998] conducts similar calculationsusing import data for 1996.Tamura et al. [1999] gives the weighted average value of wellheads for CO2 content.Other than the previously mentioned fields surveys conducted in five source countries/regions of LNG for citygas, IEEJ [1999] (p.24) also applies and reflects data for Arun, Qatar and Abu Dhabi, taken from 1996 surveymaterials from the JNOC, and gives the results of calculations for emissions by heating value (distributedvalues on a calorific basis for co-produced LPG, condensate, and so on).In addition, Okamura et al. [2004] gives data calculated after the addition of survey details related to theMiddle East Project (Qatar, Oman) to the survey results of IEEJ [1999].

- 24 -
<ii> This Study
Okamura et al. [2004] is also cited here.
(5) CH4 Vent
<i> Existing Study
As with flare combustion, Ogawa et al. [1998] estimates CH4 vent ratio at approximately 1 % in relation tonatural gas production volume. Although the basis is unclear, CRIEPI [1992] (p.32) gives amounts for CH4
vent during extraction and liquefaction.Tamura et al. [1999] and IEEJ [1999] (p.24) both separate the source of leakage into eachproduction/liquefaction process, and calculate CH4 vent by obtaining the weighted average value from importvolume (1997) based on data from the previously mentioned field surveys conducted in five sourcecountries/regions of LNG for city gas, but there are slight discrepancies in the results. Both reports givedistributed values on a calorific basis for co-produced LPG, condensate, and so on.In addition, Okamura et al. [2004] gives data calculated after the addition of survey details related to theMiddle East Project (Qatar, Oman) to the survey results of IEEJ [1999].
<ii> This Study
As with the other processes, this study cites Okamura et al. [2004]. However, regarding energy consumption,calculations are made from heating value based fuel ratio data using the entrance to liquefaction facilities asthe reference point, obtained from a hearing survey conducted with the JGA in relation to the content ofOkamura et al. [2004].In addition, regarding the characterization factor for global warming, conversions back into CO2 equivalentare conducted using the value used in this study (see Table 1.2).
(6) Overseas Transportation (Sea)
<i> Existing Study
IAE [1990] (p.125) calculates CO2 emissions per unit weight of LNG from the fuel consumption duringpassage of 125,000 m3 class LNG vessels (return trip, boil off gas (BOG) and petroleum fuel usage), and theimport volumes and distance from each gas producing country.NEDO [1996] (p.105) calculates the amount of A-heavy fuel oil required for transportation of the annualLNG requirement for a LNG combined cycle plant (513,000 tons), using a 125,000 m3 capacity (53,750 t)vessel with a mileage of 63 kg-A-heavy fuel oil/km over a distance of 5,000km, taking the return trip intoconsideration.Hondo et al. [1999] asserts that the fuel during passage is the BOG of LNG and calculates the environmentalburden of transportation per unit weight of LNG from the boil off ratio of a 125,000 m3 class LNG vessel,import volume and distance from each gas producing country, and fuel consumption while moored (LNGusage).Tamura et al. [1999] calculates the CO2 emission factors for t-km from the actual records (1997) of LNG

- 25 -
transportations from the Bontang gas fields in Indonesia, and then calculates CO2 emissions per unit heat ofLNG during overseas transportation using the weighted average of shipping distance from each country andimport volume (1997). Furthermore, the fuels used are BOG and C-heavy fuel oil.IEEJ [1999] (p.25) calculates CO2 emissions of LNG during overseas transportation by using the weightedaverage of import volume ratio (1997) and actual data for 1997 gathered from 44 of the 65 LNG shippingvessels that carry LNG to Japan, in relation to BOG and C-heavy fuel oil consumption, LNG load, andshipping distance.In addition, Okamura et al. [2004] gives data calculated after the addition of survey details related to theMiddle East Project (Qatar, Oman) to the survey results of IEEJ [1999].
<ii> This Study
This study cites Okamura et al. [2004]. However, regarding energy consumption, calculations are made fromdata pertaining to LNG vessel fuel consumption, LNG load, weighted average values for transportationdistances one-way, obtained from a hearing survey conducted with the JGA in relation to the content ofOkamura et al. [2004]. Furthermore, separate calculations were conducted for overall LNG and LNG for citygas.
(7) Overseas Transportation via Pipelines
<i> Existing Study
Regarding the transportation of natural gas via pipelines, as a report focusing on supply within Japan, theEconomic Research Center, Fujitsu Research Institute (FRI-ERC)[2000] report calculates CO2 emissions, andstates that for a shipping distance of less than 16,000 km, transportation via pipeline is better than LNGtransportation.
<ii> This Study
In this study, energy consumption and GHG emissions are calculated from data related to pipelinetransportation obtained through hearing surveys (approximately 50 kW per km pipeline for 880 MCF/daynatural gas output). Furthermore, the power generating efficiency of natural gas output energy (assuminggeneration through natural gas) is 15 %.Regarding transportation distance, the pipeline transportation distance considered in this study (2,000 km) isthe distance from Sakhalin to Japan, given in Koide [2000] as the distance from Korsakov to Niigata (approx1,400 km) plus the distance from Niigata to Fukui (approx 600 km).In addition, regarding the heating value and CO2 emission factors for natural gas produced in Sakhalin,calculations were made using global natural gas composition data given in the Agency for Natural Resourcesand Energy (ANRE)[1992] (p.110) for natural gas produced in the former Soviet Union.
- 26 -
(8) City Gas Production and Distribution
<i> Existing Study
Although Tamura et al. [1999] and IEEJ [1999] (p.25) both calculate CO2 emissions based on actual energyconsumption figures (1996) for processes such as re-gasification of LNG and heating value adjustment for thedomestic LNG facilities of three gas companies, there are slight discrepancies in the results. Both reportsconsider environmental burden from the upstream process for LPG input for heating value adjustment, andalso considers CO2 reductions from the cold usage of LNG. Regarding the distribution process, as the energyfrom the pump that pressurizes LNG before re-gasification is used, this is already included in the city gasproduction process.Based on values given in IEEJ [1999], PEC [2002-2] (p.60) calculates fuel efficiency to be 99.8 %.In addition, Okamura et al. [2004] gives data calculated after the addition of survey details related to theMiddle East Project (Qatar, Oman) to the survey results of IEEJ [1999]. As with IEEJ [1999], LPG for heatingvalue adjustment and cold usage of LNG are also considered.
<ii> This Study
The environmental burden of the city gas production process itself can be calculated using statistics given inANRE [2002-2]. However, it is difficult to calculate the environmental burden for in-house consumption ofLNG, city gas, and so on, from this information alone. Therefore, calculations in this study are based on thehearing survey conducted with the JGA in relation to the content of Okamura et al. [2004].Although Okamura et al. [2004] considers the CO2 emissions reduction effect of cold usage, this study doesnot consider aspects that are not directly related to the production process of automotive fuels.
(9) Fueling to Vehicles
<i> Existing Study
PEC [2002-2] gives 95 % as the energy efficiency of the compression/fueling process for CNG vehicles atservice stations, the default value of the model developed at the U.S. Argonne National Laboratory (ANL) forthe evaluation of environmental effect of automotive fuels “GREET 1.6” (ANL [2001]). From the assumptionthat the power source for the compression device is either natural gas or electricity, and that both will be usedin equal measure, calculations are based on the assumption that for the U.S., CNG vehicles will be filled withnatural gas compressed to 3,000 lb/in2 (= approx. 200 kg/cm2). Furthermore, “GREET 1.6” gives the defaultvalue for the energy efficiency of compression devices using natural gas as 93 %, and 97 % for devices usingelectricity.
<ii> This Study
Of the natural gas powered vehicles currently in use, CNG vehicles are the most common. In Japan,compression devices (normally 250 m3/h) are used to compress medium pressure gas received throughpipelines to pressures higher (approx. 25 MPa) than the maximum fueling pressure for vehicles (20 MPa).In this study, calculations for energy consumption and GHG emissions of the fueling process for CNG and

- 27 -
LNG vehicles are based on natural gas fueling station data obtained through a hearing survey conducted withthe JGA and others.
[Fueling to CNG vehicle]
Given that the rated output of a 250 m3/h compression device is 55 kW (medium pressure A) and 75 kW(medium pressure B), energy consumption is calculated under the assumption that, for both, the compressiondevice is operated at 85 % rated power when fueling to a CNG vehicle.
[Fueling to LNG vehicle]
Regarding LNG vehicles, energy consumption estimations for fueling to LNG vehicles are made based on theLNG pump discharge rate and the output of electric motors given in Organization for the Promotion of LowEmission Vehicles (LEVO) [2003] (p.86). In addition, natural vaporization of LNG while in storage is alsoconsidered.
2.2.3 Calculation results
Regarding the production pathways of natural gas based fuels, the results of calculations for energyconsumption, GHG emissions and energy efficiency during production of 1 MJ petroleum products are shownin Table 2.2.3 (energy consumption), Table 2.2.4 (GHG emissions) and Table 2.2.5 (energy efficiency).
Table 2.2.3 WTT energy consumption of natural gas based fuel production pathways [MJ/MJ]
From LNG(conventional) From pipeline gas
Operation 0.011 0.011 0.011 Flare combustion 0.002 0.002 0.002 Operation 0.102 0.100 - Flare combustion 0.009 0.008 - Sea 0.036 0.030 - Pipeline - - 0.054 Operation - 0.004 0.004 LPG addition - 0.005 0.005
Fueling to vehicles 0.000 0.046 0.0460.161 0.206 0.120
Reduction by cold heat utilization △ 0.004
City gas to CNG vehicle
Processing/ liquefaction
LNG
Production/ distribution
Natural gasextraction
Overseastransportation
Total

- 28 -
Table 2.2.4 WTT GHG emissions of natural gas based fuel production pathways [g eq-CO2/MJ]
Table 2.2.5 WTT energy efficiency of natural gas based fuel production pathways (LHV)
From LNG(conventional) From pipeline gas
Operation 0.56 0.54 0.48 Flare combustion 0.17 0.17 0.15 CH4 vent 0.25 0.24 0.22 Operation 6.11 5.60 - Flare combustion 0.48 0.39 - Associated CO2 2.17 1.77 - CH4 vent 0.64 0.55 - Sea 2.28 1.89 - Pipeline - - 3.09 Operation - 0.21 0.21 LPG addition - 0.34 0.34
Fueling to vehicles 0.01 1.82 1.8212.68 13.52 6.30
Reduction by cold heat utilization △ 0.34
Production/ distribution
Total
LNGCity gas to CNG vehicle
Natural gasextraction
Processing/ liquefaction
Overseastransportation
From LNG(conventional) From pipeline gas
Natural gas extraction 0.987 0.987 0.987 Processing / liquefaction 0.901 0.903 -
Sea 0.965 0.971 - Pipeline - - 0.949
Production / distribution of city gas - 0.998 0.998 Fueling to vehicles 1.000 0.983 0.983
0.858 0.848 0.918
LNGCity gas to CNG vehicle
Total
Overseastransportation

- 29 -
2.3 Fuel Production Pathways from Biomass Resources
2.3.1 Abstract
Although the term “Biomass”, a compound term consisting of “bio” signifying organisms and “mass”signifying quantity or weight, is generally used in biology, it has in recent years come to be used frequently inreference to subjects such as “Organisms as a resource for energy and industrial materials” (Yamaji et al.[2000]) and “Substantial plant based substances that can be used for energy” (Yokoyama [2001]). From theperspective of usage as fuel, biomass can be categorized into liquid fuel production processes and gaseousfuel (intermediate product) production processes.This section looks into bio-diesel fuel (BDF) production (esterification) and ethanol conversion as methods ofliquid fuel production, and CH4 fermentation as a method of gaseous fuel production. Furthermore, regardingCH4 fermentation, this section focuses on the process up to distribution into the natural gas supply line afterproduction following fermentation, and considers the processes after this point (e.g. fueling to CNG vehicle,syngas production, hydrogen production) to be the same as for natural gas.
(1) BDF
Bio diesel fuel (BDF) is a general term used in reference to methyl esters of higher fatty acid obtained when atransesterification reaction takes place between vegetable oils (ester of glycerin and higher fatty acids) andmethanol in the presence of a catalyst. The chemical reaction to obtain BDF is as follows.
There are a variety of fatty acids that compose vegetable oil, depending on the resource, such as rapeseed andpalm. In addition, as there is no single variety of fatty acid that is ester bonded to glycerin, the composition iscomplex. Although the structures of the molecules are not fixed, the term BDF is used since the physical andchemical properties are similar to that of diesel. Research into BDF is currently in progress in countries suchas Italy (rapeseed oil, sunflower oil), France (rapeseed oil, sunflower oil, palm oil, soybean oil), the U.S.(soybean oil) and Malaysia (palm oil).
CH2COOR
CH2COOR
CH2OH
CH2OH
CHCOOR + 3CH3OH → 3RCOOCH3 + CHOH
[ Oil / fat ] [ Methanol ] [ Methylester ] [ Glycerin ]

- 30 -
Table 2.3.1 Comparison of properties of diesel and BDF
Diesel BDF inTown A Diesel BDF in
Town A
Density (15℃) g/cm2 0.8299 0.8866 Carbon residuecontent mass% 0.1 or less 0.05
Kinematicviscosity (40℃) mm2/s 1.7-2.7 or over 4.688 Sulfur content mass% 0.20 or less less than
0.01Flash point
(COC) ℃ 45 - 50 or over 190 Heating value(cal) kcal/kg 10,997 9,507
Pour point ℃ +5 - -30 or less 2.5 Heating value(J) MJ/kg 46.0 39.8
[Source] Energy Policy Division, Natural Resources and Energy Department, Kansai Bureau of Economy, Tradeand Industry (METI Kansai) [2002]
(2) Ethanol
Ethanol conversion technology, which uses microorganisms, has been long established in the manufacturingprocesses of alcoholic beverages. Relative to this, the oil shock of the 1970s triggered research anddevelopment into the production of ethanol for fuel, with Brazil promoting sugar (molasses) and the U.S. cornas the resource for ethanol production.In the ethanol yielding reaction, 1) starch is saccharified by amylase to become glucose, 2) through manymicroorganisms, one glucose molecule is broken down into two pyruvic acid molecules and eventually intotwo ethanol molecules.
Of the progress of biotechnology in recent years, ethanol conversion using cellulosic biomass resources isdrawing particular attention. In this process, ethanol is produced after the saccharification of cellulosicbiomass using acid saccharification or cellulase saccharification through a fermentation process using yeastsand bacteria cultivated through genetic recombination to enable the fermentation of both hexose and pentose.Research into this process is being vigorously pursued in countries such as the U.S., and plans forindustrialization are being promoted (the diagram shows an example of a current bio-ethanol productionprocess concept).
(C6H10O5)n + n H2O → n C6H12O6
C6H10O6 → 2C2H5OH + 2CO2
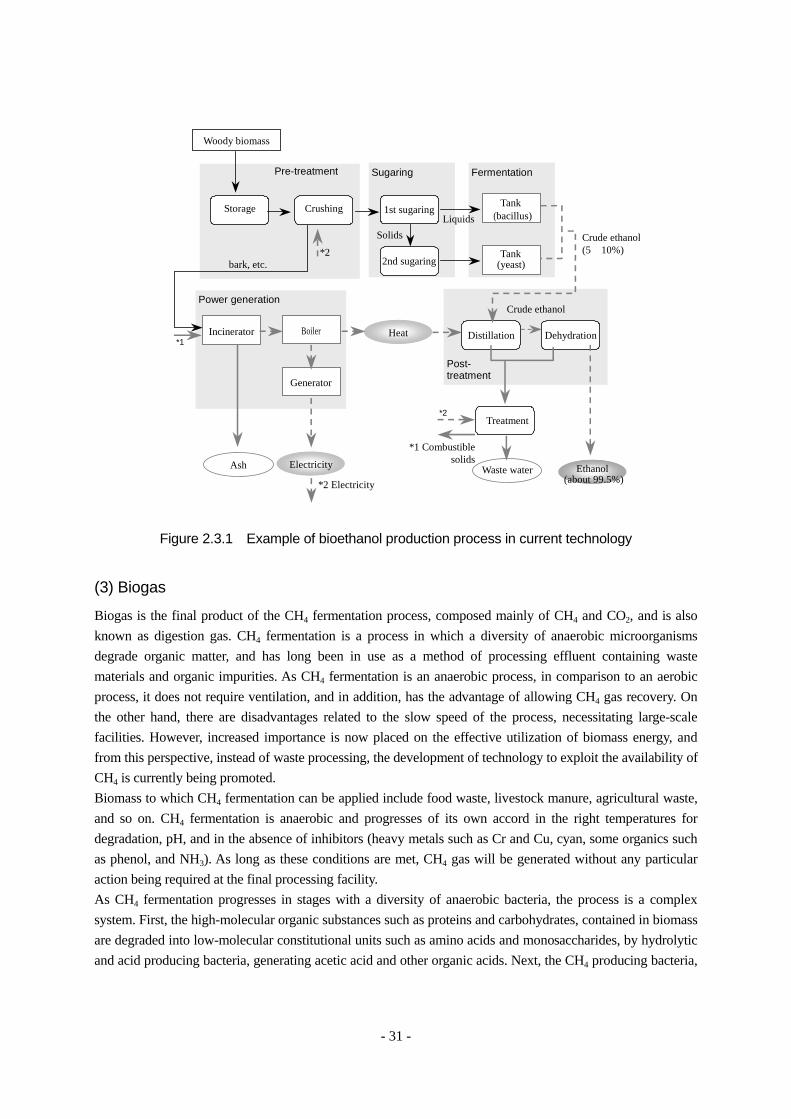
- 31 -
Figure 2.3.1 Example of bioethanol production process in current technology
(3) Biogas
Biogas is the final product of the CH4 fermentation process, composed mainly of CH4 and CO2, and is alsoknown as digestion gas. CH4 fermentation is a process in which a diversity of anaerobic microorganismsdegrade organic matter, and has long been in use as a method of processing effluent containing wastematerials and organic impurities. As CH4 fermentation is an anaerobic process, in comparison to an aerobicprocess, it does not require ventilation, and in addition, has the advantage of allowing CH4 gas recovery. Onthe other hand, there are disadvantages related to the slow speed of the process, necessitating large-scalefacilities. However, increased importance is now placed on the effective utilization of biomass energy, andfrom this perspective, instead of waste processing, the development of technology to exploit the availability ofCH4 is currently being promoted.Biomass to which CH4 fermentation can be applied include food waste, livestock manure, agricultural waste,and so on. CH4 fermentation is anaerobic and progresses of its own accord in the right temperatures fordegradation, pH, and in the absence of inhibitors (heavy metals such as Cr and Cu, cyan, some organics suchas phenol, and NH3). As long as these conditions are met, CH4 gas will be generated without any particularaction being required at the final processing facility.As CH4 fermentation progresses in stages with a diversity of anaerobic bacteria, the process is a complexsystem. First, the high-molecular organic substances such as proteins and carbohydrates, contained in biomassare degraded into low-molecular constitutional units such as amino acids and monosaccharides, by hydrolyticand acid producing bacteria, generating acetic acid and other organic acids. Next, the CH4 producing bacteria,
Sugaring Fermentation
Woody biomass
Pre-treatment
Crushing
Power generation
Storage
Incinerator
Tank
Ethanol Waste water
Heat
Solids
1st sugaring
2nd sugaringTank
Liquids (bacillus)
(yeast) bark, etc.
Post- treatment
Distillation Dehydration
(about 99.5%)
Treatment
Crude ethanol
*1 CombustiblesolidsAsh
Generator
Boiler *1
Electricity
*2 Electricity
*2
*2
Crude ethanol(5~10%)

- 32 -
a strict anaerobe, degrades the molecules to the final product such as CH4 and CO2.As CH4 fermentation is a microbial process, it is affected by temperature. In general, although the process isseparated into low temperature, medium temperature range of 30-35 degrees C and a high temperature rangeof 50-55 degrees C, since the degradation speed increases with fermentation temperature, high temperaturefermentation is increasingly being adopted as this will lead to the downsizing of processing vats.As CH4 gas obtained from processes such as the above contains small amounts of substance such as H2S,further refining may be necessary depending on usage. The main forms of energy required for the CH4
fermentation process are heating energy required to maintain fermentation temperature, and energy requiredto convey the reaction mixture and pump the CH4 gas.
2.3.2 Procedures for data collection of unit process
In relation to fuel production pathways using biomass resources as the source, in view of the fact that thescope of the reference materials and finer details concerning conditions cannot be fully understood, this studyorganizes and presents data that clarifies energy consumption range and CO2 emissions range, and datatypifying processes and resource/energy input, as calculation results.In biomass production, along with the feedstock for energy conversion, byproducts are cultivatedsimultaneously. Specifically, energy is also consumed in the cultivation process in areas other than for theparts that can be used for energy conversion (for example, seeds from rapeseed and corn). However, as this isessential to the cultivation of the parts that can be used for energy conversion, this study treats all energyconsumed as energy required for the production of the energy conversion feedstock.Carbon ingested during the biomass production stage is treated as an assimilated amount and is given as anegative value. The given amount for assimilated carbon is a value equivalent to that of the amount generatedduring combustion (carbon balance zero).Additionally, in the energy conversion process, only the heating value of the biomass resource is considered incases where biomass is used as the in-house heat source (e.g. ethanol conversion of sugarcane), and data iscreated with CO2 emissions generated from biomass resource combustion as zero.Regarding the byproduct emissions from each process, some may be utilized as in-house energy sources or asanimal feed. However, the purpose of byproducts vary depending on value (e.g. quality and cost), andalthough processing as waste will be necessary where the value is low, calculations in this study are based onthe premise that byproducts will be disposed of.

- 33 -
(1) BDF
The BDF production pathway flow examined in this study are shown in Figure 2.3.2:
Figure 2.3.2 Pathway flow for BDF production
1) Farming
<i> Existing Study
Biomass resources used in BDF production (esterification) include oil crops such as palm, soybean, rapeseedand sunflower, and the waste food oils originating from these crops.Energy input for palm production is considered in Fuel Policy Subcommittee (FPS) [2003].Regarding rapeseed, European rapeseed farming data is presented in EUCAR, CONCAWE, & JRC/IES[2003] Appendix 1, and similar data for the UK is compiled in ETSU [1996].Regarding waste food oil, from the waste materials perspective, although the production energy is beyond thesphere of the system, the Kansai Bureau of Economy, Trade and Industry [2002] report provides figures forthe generation of waste food oil per household, while the Ministry of Agriculture, Forestry and Fishery(MAFF) General Food Policy Bureau – Consumption and Lifestyle Division [2001] provides figures for thegeneration of waste food oil per individual.
<ii> This Study
N2O emissions from soil have been calculated using the emission factors (15.6 [kg-N2O/t-N]) for directemissions [Synthetic Fertilizer] given in MOE [2002-2] (p.II-79). This is based on a flux study of N2O fromfields conducted nationwide, and is an estimated value which takes crop species into consideration.Specifically, N2O emissions from the farming process were calculated by multiplying the amount of nitrogeninput to farming with this emission factor.Regarding farming of BDF production pathway, this study considers rapeseed and palm. For rapeseed, asrapeseed production in Canada and Australia, the two major rapeseed import sources (producing countries) toJapan, is in decline, import was not assumed and the study focuses on domestic production. In addition,concerning palm, farming in Malaysia is assumed.
[Rapeseed farming]
Regarding the rapeseed farming process, as there is no detailed data for rapeseed cultivation in Japan,estimates were made from assumed fertilizer input and energy consumption values derived through hearingsurveys conducted in Aomori, Japan’s largest rapeseed producing region, and publications (Aomori Prefecture,
(diesel vehicle)Palm oil
extractionPalm BDF
Overseastransportation
(sea/land)
Domestictransportation
(sea/land)
Esterification BDFWaste food oilDomestic
transportation(recovery)
Esterification BDFRapseed oilextraction
RapeseedFarming
Farming Esterification

- 34 -
Agriculture and Forestry Dept. [1994]). Regarding the production processes for fertilizer and insecticide,calculations were made using information given in Turhollow, A.F. et al. [1991].
[Palm farming]
Calculations for the palm farming process are based on FPS [2003]. Since palm production is mainly amanual process, energy for processes such as cultivation was assumed to be zero, and calculations were madeonly for energy consumption through fertilizer input.
[Waste food oil]
Regarding waste food oils, since the premise is the collection and use of oils generated as a waste product,energy consumption and GHG emissions related to waste food oil generation are ignored.
2) Transportation (Harvestry)
<i> Existing Study
Regarding palm harvesting, FPS [2003] gives the average shipping distance as 10 km.On the other hand, regarding the collection of waste food oils, calculations in the Mitsubishi ResearchInstitute (MRI), et al. [2002] (p. II.84) assume that a medium sized truck (fuel consumption 3.5 km/L) willtravel an average 3 km per t of collected waste cooking oil.
<ii> This Study
Energy regarding rapeseed harvesting is treated as zero, as energy for harvesting has already been consideredas a part of cultivation in the farming process. In addition, regarding palm harvest, although there a largevariations depending on harvest area, energy consumption is treated as zero in this study as energyconsumption related to harvesting represents only a small part of the energy consumption for the overall BDFproduction pathway.Regarding the collection of waste food oils, as with MRI, et al. [2002], calculations were based on theassumption that a medium sized truck (fuel consumption 3.5 km/L) will travel an average 3 km per t ofcollected waste food oil.In addition, regarding transportation from harvest location to BDF production facility, as it is important thatconversion to BDF at the harvest location is practical and that for BDF production from high quality raw palmoil, free fatty acid is not generated, proximity between raw palm oil production facility and BDF productionfacility is desirable (NEDO [2003-2]), therefore the energy for transportation from harvest location to BDFproduction facility is treated as zero.
3) BDF Production (Oil Extraction)
<i> Existing Study
Regarding oil extraction, data related to raw oil production from rapeseed in Japan is provided in FPS [2003].

- 35 -
In addition, entries concerning oil extraction can be found in ETSU [1996], Shaine Tyson [1998], Sheehan, J.et al. [1998], Kadam, K.L. et al. [1999], Armstrong, A.P. et al. [2002], Ahlvik, P. et al. [2002], and EUCAR,CONCAWE, & JRC/IES [2003] Appendix 1, and so on.
<ii> This Study
Prior studies concerning oil extraction from rapeseed give figures for overall energy input (MJ), althoughsome are unclear as to energy type. In addition, of those that do give clear indication of energy type, manyinvolve the use of natural gas, which cannot be assumed in relation to oil extraction from rapeseed in Japan.Therefore, this study uses data provided in ETSU [1996] (p.97, p.156-157), which uses only electricity as theenergy related to oil extraction from rapeseed.In addition, regarding palm, as the related data was unobtainable, energy consumption and GHG emissionscalculations were conducted using data provided in EUCAR, CONCAWE, & JRC/IES [2003] Appendix 1(p.40), a relatively recent document regarding oil extraction from rapeseed2. Furthermore, NEDO [1992] wasused for reference concerning palm oil yield from palm (excluding surplus material).
4) BDF Production (Refining)
<i> Existing Study
Regarding the refining process required for esterification, inventory data concerning the refining of rapeseedoil (raw oil) is provided in EUCAR, CONCAWE, & JRC/IES [2003] Appendix 1 (p.40).
<ii> This Study
Regarding the refining of rapeseed oil (raw oil), data provided in EUCAR, CONCAWE, & JRC/IES [2003]Appendix 1 (p.40) has been used. In addition, regarding palm oil (raw oil), as the related data wasunobtainable, it was assumed to be included in the BDF production (esterification) process.
5) BDF Production (Esterification)
<i> Existing Study
In relation to the BDF production process, NEDO [2003-2] shows FS results relative to BDF production on ascale of 15,000,000 t per year. The process assumed here is the ECB Enviro Berlin AG process.Regarding BDF production from soybean oil, information based on examples in the U.S. is compiled inSheehan, J. et al. [1998]. The example given in the study is not of mechanical oil extraction but of oilextraction through the use of solvents.Regarding rapeseed oil, EUCAR, CONCAWE, & JRC/IES [2003] Appendix 1 studies energy input for ahypothetical plant on a production scale of 20,000 t/year, using a 10,000-15,000 t/year system currently inoperation in the EU for reference. It is considered in this system that materials remaining above ground after
2 Regarding oil expression from palm, although the use of electricity or natural gas is anticipated, as there are casesin Malaysia where oil expression is conducted manually, there may be cases where energy consumption and GHGemissions of this process are not taken into consideration.

- 36 -
rapeseed harvest are partly used as an energy resource and that all in-house power is provided through naturalgas.In addition, although BDF production is gradually progressing in Japan, in principle, the focus is on wastefood oil. In many cases, data related to energy input is derived from materials based on hearing surveys.
<ii> This Study
[Esterification of rapeseed oil]
As existing research has considered the input of energy resources other than electricity in relation to theesterification of rapeseed oil, the following four cases were considered in this study.
Case 1) Use of rapeseed strawCase 2) Use of natural gasCase 3) Use of electricity + natural gasCase 4) Use of electricity only
The cases here consider cases where electricity is purchased from the networks, and cases where in-house co-generation is conducted using rapeseed straw or natural gas to provide electricity.In addition, regarding energy consumption and GHG emissions in the process leading to methanol production,calculations were based on relatively recent studies with natural gas as the resource, conducted by PEC [2002-2] and General Motors, et al. [2002], giving fuel efficiency at 67 % (worst case scenario).
[Esterification of palm oil]
Esterification of palm oil is studied in NEDO [2003-2] (p.97), and this data is also used in this study.
[Esterification of waste food oil]
Regarding processes of esterification of waste food oil already in progress in Japan, as there are onlyexamples of electricity for energy input, in this study, the esterification of rapeseed oil (Case 4) is also appliedto waste food oil.
6) Overseas Transportation (Sea/Land)
<i> Existing Study
In FPS [2003], calculations are made with distance from South-East Asia to Japan at 5,000 km (one-way) anda crude oil tanker (0.059 MJ/t-km) as the tanker.
<ii> This Study
This study also conducted calculations with distance from South-East Asia to Japan set at 5,000 km. (one-way). In addition, the tanker in this study is a 100,000 t class crude oil tanker.

- 37 -
7) Domestic Transportation (Sea/Land)
<i> Existing Study
In FPS [2003], calculations are made with the average domestic shipping distance (round trip) set atapproximately 209 km for transportation undertaken by tank lorry from distribution base to gas station.
<ii> This Study
In this study, data related to the domestic transportation of diesel calculated in “2.1 Petroleum Based FuelProduction Pathways” has been substituted.
(2) Ethanol
The ethanol production pathway flow examined in this study are shown in Figure 2.3.3:
Figure 2.3.3 Pathway flow for ethanol production
Ethanol is not supplied directly into a vehicle, but is used as a blend with gasoline or converted into ethyltertiary butyl ether (ETBE) and then blended with gasoline. Assuming blending with current gasolinecalculated in “2.1 Petroleum Based Fuel Production Pathways”, this study focuses on three fuels types; 3 %ethanol blend gasoline, 10 % ethanol blend gasoline and gasoline/ETBE blend.
Farming Corn
SugarcaneFarming
Overseastransportation
(land)
Overseastransportation
(land)
Ethanolconversion
Ethanolconversion
Ethanol
EthanolOverseas
transportation(sea)
Domestictransportation
(sea/land)
WoodFarmingOverseas
transportation(land)
Ethanolconversion
Ethanol
Domestictransportation
(recovery)
Ethanolconversion
Ethanol
(gasoline vehicle)BlendingDomestic
transportation(sea/land)
(gasoline vehicle)BlendingDomestic
transportation(sea/land)
ETBEproduction
Waste wood

- 38 -
1) Farming
<i> Existing Study
Regarding corn farming, the results of studies in North America have been compiled by Marland, G. et al.[1991], Lorenz, D. et al. [1995], Levelton Engineering Ltd. et al. [2000], Aden, A. et al., and variations can beseen depending on fertilizer input and irrigation.A report on sugarcane farming in Brazil can be found in Isaias de Carvalho Macedo [1998]. The energy forcultivation reported in the study is mainly diesel, fertilizer and insecticide, with both average and optimumdata compiled in the report. Mechanization of harvesting is currently at 20%, with the report indicating futuremechanization up to 50 %.Data pertaining to fertilizer, insecticide and energy input related to cultivation is compiled in EUCAR,CONCAWE, & JRC/IES [2003] Appendix 1 for wheat, and ETSU [1996] for winter wheat. In particular,wheat drying is included along with machinery fuel in data related to diesel in EUCAR, CONCAWE, &JRC/IES [2003] Appendix 1. EUCAR, CONCAWE, & JRC/IES [2003] Appendix 1 also compiles datarelated to sugar beet farming.For data regarding cellulosic biomass farming, an example of hybrid poplar is compiled in Lorenz, D. et al.[1995]. As little fertilizer is used and there is no irrigation, energy input is low in comparison to other cropssuch as corn.Regarding waste wood, as the use of waste materials generated from the demolition of houses and so on isassumed, energy input and GHG emissions are treated as zero.
<ii> This Study
[Corn farming]
As a number of reports from prior studies are available regarding corn farming, these reports were comparedand data given for the maximum energy consumption case (Lorenz, D. et al. [1995]) and the minimum energyconsumption case (Marland, G. et al. [1991]) has been used to calculate energy consumption and GHGemissions. This data also includes energy consumption related to fertilizer production, irrigation, corn drying,and so on.
[Sugarcane farming]
Regarding sugarcane farming, calculations for energy consumption and GHG emissions were based onaverage data and optimum data provided in Isaias de Carvalho Macedo [1998]. This data also includes energyfor fertilizer production, insecticide and cultivation. As Isaias de Carvalho Macedo [1998] cites everything interms of input energy, CO2 emissions were calculated under the assumption that energy for cultivationreferred mainly to cultivation related machinery, and that fuel for such would be diesel.
[Cellulosic biomass farming]
Regarding cellulosic biomass farming, energy consumption and GHG emissions calculations were based dataprovided in Lorenz, D. et al. [1995]. Ethanol conversion using cellulosic biomass has yet to be industrialized,

- 39 -
and the results here are from trial calculations from theoretical values for hybrid poplar.
2) Overseas Transportation (Land) / Domestic Transportation (Collection)
<i> Existing Study
Energy figures for the transportation of sugarcane to ethanol conversion plants in Brazil are given in Isaias deCarvalho Macedo [1998]. A lecture given by the Nanotech Department of Mitsui & Co., Ltd., stated thattransportation of sugarcane was conducted mainly by truck, and that profitability for such transportation to adistillery could only be maintained within a 50 km radius of the distillery.
<ii> This Study
In this study, calculations are based on 10 t trucks (fuel consumption 3.5 km/L) and a shipping distance of 50km (one-way). Transportation related to domestic waste wood collection is treated in the same manner.
3) Ethanol Conversion
<i> Existing Study
Many reports in the U.S., such as Lorenz, D. et al. [1995] and Graboski, M.S. [2002], compile data regardingcorn based ethanol conversion. There are two types of pre-treatment process that can be used in corn basedethanol production, the dry-mill process and the wet-mill process, and energy input varies depending on thepre-treatment process.In the dry-mill process, corn is ground and water added to produce corn slurry. Once enzymes havehydrolyzed the slurry, the resulting sugar content undergoes ethanol conversion. Fermentation residue is driedand gathered, and sold on as DDGS (Distillers Dried Grains with Solubles).In the wet-mill process, sugar content undergoes ethanol conversion once the corn oil, in particular thenutrients known as gluten feed and gluten meal, has been separated.ETSU [1996] compiles data related to ethanol conversion using wheat as the feedstock, summarizing energyinput for a system that extracts starch after the wheat has been ground and conducts ethanol conversion on ascale of approximately 140 t/d. Here, the source of in–house electricity is wheat-straw and natural gas, and thebyproduct is DDGS for use as animal feed. Although similar studies have been undertaken in EUCAR,CONCAWE, & JRC/IES [2003] Appendix 1, the scale of the plant is unclear.Energy input related to cellulosic biomass ethanol production in the U.S. is compiled in Lorenz, D. et al.[1995]. This reports shows the results of a process simulation of the U.S. Arkenol, Inc. process on anindustrial scale, and provides data ranging from biomass farming through to ethanol production.Average data and optimum data is compiled in Isaias de Carvalho Macedo [1998] regarding molasses basedethanol conversion in Brazil.Regarding ethanol conversion of cellulosic biomass, Kadam, K.L. et al. [1999] compiles process simulationresults regarding ethanol conversion following two types of pre-treatment process, the acid degradationprocess currently under development and the enzymatic hydrolysis process under consideration for futuredevelopment. In addition, Kadam, K.L. [2000] conducts a similar study into the ethanol conversion of bagassein India. These studies assume a production scale of 800 t/d.

- 40 -
In addition, EUCAR, CONCAWE, & JRC/IES [2003] Appendix 1 also compiles data regarding the ethanolconversion of sugar beet fibre remaining after juicing.
<ii> This Study
[Ethanol conversion from corn]
Regarding the ethanol conversion of corn, there are differences in energy consumption depending on whetherthe corn degradation pre-treatment is conducted using the dry-mill or the wet-mill process. In this study,following consideration and comparison of Levelton Engineering Ltd. et al. [2000] (Canada) and Graboski,M.S. [2002] (U.S.) for the dry-mill process, and Marland, G. et al. [1991] and Graboski, M.S. [2002] (U.S.)for the wet-mill process, energy consumption and GHG emissions were calculated based on data provided formaximum energy consumption (Marland, G. et al. [1991]) and minimum energy consumption (LeveltonEngineering Ltd. et al. [2000]).
[Ethanol conversion from sugarcane]
Regarding the ethanol conversion of sugarcane, calculations for energy consumption and GHG emissionswere based on average data and optimum data provided in Isaias de Carvalho Macedo [1998].Regarding the ethanol conversion of sugarcane, there are many cases where bagasse (sugarcane residue)combustion is used to power steam turbines for power generation. When calculating GHG emissions in thisstudy, GHG emissions for purchased power equivalent to power generated through bagasse combustion werealso studied for comparison purposes. Calculations here for total bagasse generation are based on materialbalance data given in Japan Energy Research Center [2002] (p.102).
[Ethanol conversion from cellulosic biomass]
Regarding the ethanol conversion of cellulosic biomass, the process using acid as a pre-treatment for biomasssaccharification, has been included.Regarding the ethanol conversion of cellulosic biomass, energy consumption and GHG emissions calculationsare based on data provided in Kadam, K.L. et al. [1999] (p.34). The calculations in this data separatecellulosic materials into shrubs, softwoods and rice straw, of which this study uses data for shrubs andsoftwoods.Regarding the ethanol conversion of waste wood, data related to softwoods with comparatively similarcompositions is applied, and conversion into heating value in Japan and re-calculation was conducted only inrelation to natural gas consumption.
4) Overseas Transportation (Sea)
<i> Existing Study
In FPS [2003], calculations are made with shipping distance from India to Japan at 8,900 km (one-way) and acrude oil tanker (0.068 MJ/t-km) as the tanker.

- 41 -
<ii> This Study
In this study, calculations are made under the assumption of transportation to Japan of, corn from the U.S.(Los Angeles: 4,849 miles), sugarcane from Brazil (Rio de Janeiro: 11,768 miles) and cellulosic biomass fromMalaysia (Bintulu: 2,511 miles). In addition, assuming that the tanker used will be the same vessel as used formethanol, details given in NEDO [2001-3] for capacity of methanol vessels, and speed and fuel consumptionfor GTL vessels was substituted.
5) Domestic Transportation (Sea/Land)
<i> Existing Study
In FPS [2003], calculations are made with the average domestic shipping distance (round trip) set atapproximately 209 km for transportation undertaken by tank lorry from distribution base to gas station.
<ii> This Study
In this study, data calculated in “2.1 Petroleum Based Fuel Production Pathways” in relation to the domestictransportation of gasoline has been substituted.
6) ETBE Production
Regarding the ETBE production from ethanol process, energy consumption calculations are based on Kadam,K.L. et al. [1999] (p.38) and “Regarding ETBE” found at the MOE website (http://www.env.go.jp/earth/ondanka/renewable/03/mat_03.pdf).
7) Blending
Energy consumption and GHG emissions of the blending process have been omitted, as the informationrequired to create inventory data was unobtainable.
(3) Biogas (Methane Gas)
The CH4 fermentation pathway flow examined in this study are shown in Figure 2.3.4:
Figure 2.3.4 Pathway flow for CH4 fermentation
Domestictransportation
(recovery)
MethaneFermentation
CH4
Livestock manure
regard as same as city gasSewege sludge

- 42 -
1) Domestic Transportation (Collection)
CH4 fermentation feedstock in Japan focuses on sewage sludge and livestock manure, and very little focus isplaced on food waste and others.Regarding sewage sludge, the main form of transportation is pipeline from the sewage plant, with some septictank sludge shipped by sewage vacuum car. In addition, regarding livestock manure, in many cases themanure is accumulated in tanks at the farm and then shipped in by overland transportation (e.g. light trucks)owned by the farms. Therefore, calculations in this study are based on 2 t trucks (fuel: gasoline, fuelconsumption: 6.0 km/L) and a shipping distance of 10 km (one-way).
2) CH4 Fermentation
<i> Existing Study
The operational data for the system in Yagi Town, Kyoto Prefecture, in which digestive gas obtained throughthe CH4 fermentation processing of livestock manure and bean curd lees is used for gas engine powergeneration, is shown in Ogawa et al. [2003].The Central Purification Center (CPC) of Nagaoka-City, Niigata Prefecture, supplies digestive gas obtainedthrough the CH4 fermentation of sewage sludge to city gas holders.
<ii> This Study
Calculations are made in this study for energy consumption and GHG emissions in relation to the CH4
fermentation processes of the previously mentioned Yagi system detailed in Ogawa et al. [2003] and theNagaoka CPC example.In recent years, although many small-scale CH4 fermentation facilities have been established, the utilization ofthese in terms of CH4 fermentation for automotive fuel production is considered difficult. On the other hand,the Yagi Bio-Ecology Center covered in this study is the most famous and largest livestock manure CH4
fermentation facility in Japan.In addition, the Nagaoka CPC is most representative of biogas generation through CH4 fermentation for use asa substitute for city gas. In this study, energy consumption and GHG emissions calculations were based ondata obtained through a hearing survey conducted in relation to the Nagaoka CPC.
3) Distribution
Regarding distribution to city gas holders, energy consumption and GHG emissions calculations were basedon data obtained through a hearing survey conducted in relation to the Nagaoka CPC.

- 43 -
2.3.3 Calculation results
Regarding the fuel production pathways from biomass resources, the results of calculations for energyconsumption, GHG emissions and energy efficiency during production of 1 MJ BDF are shown in Table 2.3.2(energy consumption), Table 2.3.3 (GHG emissions) and Table 2.3.4 (energy efficiency).The results of calculations for energy consumption, GHG emissions and energy efficiency during productionof 1 MJ ethanol are shown in Table 2.3.5 (energy consumption), Table 2.3.6 (GHG emissions) and Table 2.3.7(energy efficiency).The results of calculations for energy consumption, GHG emissions and energy efficiency during productionof 1 MJ biogas are shown in Table 2.3.8 (energy consumption), Table 2.3.9 (GHG emissions) and Table 2.3.10(energy efficiency).
Table 2.3.2 WTT energy consumption of BDF production pathways [MJ/MJ]
Table 2.3.3 WTT GHG emissions of BDF production pathways [g eq-CO2/MJ]
Straw Natural gas Electricity +Natural gas Electricity
CO2 emissionmaximum case
Includingoil extraction
Excludingoil extraction
Farming 0.107 0.107 0.110 0.113 0.153 0.128 0.128 - Recovery - - - - - - - 0.001 Oil extraction 0.223 0.223 0.229 0.236 0.223 0.068 0.000 - Oil refining 0.010 0.010 0.011 0.011 0.010 ↓ ↓ ↓
Esterification 0.271 0.241 0.101 0.055 0.241 0.076 0.076 0.055 Overseas transportation - - - - - 0.011 0.011 - Domestic transportation 0.006 0.006 0.006 0.006 0.006 0.006 0.006 0.006
0.616 0.586 0.456 0.420 0.633 0.289 0.220 0.061
BDF from palmBDF from
waste food oil
Total
BDF from rapeseed
Straw Natural gas Electricity +Natural gas Electricity
CO2 emissionmaximum case
Includingoil extraction
Excludingoil extraction
Farming 13.9 13.9 14.3 14.8 13.6 14.4 14.4 - Recovery - - - - - - - 0.1 Oil extraction 8.9 8.9 9.1 9.4 8.9 3.9 0.0 - Oil refining 0.6 0.6 0.6 0.6 0.6 ↓ ↓ ↓
Esterification 1.4 13.3 5.2 2.4 13.3 3.7 3.7 2.4 Overseas transportation - - - - - 0.8 0.8 - Domestic transportation 0.4 0.4 0.4 0.4 0.4 0.4 0.4 0.4
25.2 37.1 29.7 27.6 36.8 23.2 19.4 2.9 Fixed CO2 △ 76.2 △ 76.2 △ 76.2 △ 76.2 △ 76.2 △ 76.2 △ 76.2 △ 76.2
Total
BDF from palmBDF from
waste food oil
BDF from rapeseed

- 44 -
Table 2.3.4 WTT energy efficiency of BDF production pathways (LHV)
Table 2.3.5 WTT energy consumption of ethanol production pathways [MJ/MJ]
Table 2.3.6 WTT GHG emissions of ethanol production pathways [g eq-CO2/MJ]
(worst) (best) (average) (best) (average) (best) (worst) (best) Farming 0.328 0.258 0.076 0.067 0.076 0.067 0.280 0.105 - Overseas transportation (land) 0.013 0.012 ↑ ↑ ↑ ↑ 0.046 0.017 - Recovery - - - - - - - - 0.017 Ethanol production 0.648 0.611 0.843 0.748 0.081 0.072 2.307 1.366 1.634 Overseas transportation (sea) 0.057 0.057 0.133 0.133 0.133 0.133 0.031 0.031 - Domestic transportation 0.009 0.009 0.009 0.009 0.009 0.009 0.009 0.009 0.009
Total 1.055 0.946 1.060 0.957 0.299 0.281 2.673 1.527 1.660
Ethanol fromsugarcane
(power grid utilization)
Ethanol from foreign wood
Ethanol fromdomestic waste
wood
Ethanol from cornEthanol from
sugarcane(bagasse utilization)
Straw Natural gas Electricity +Natural gas Electricity
CO2 emissionmaximum case
Includingoil extraction
Excludingoil extraction
Farming ↓ ↓ ↓ ↓ ↓ ↓ ↓ - Recovery ↓ ↓ ↓ ↓ ↓ ↓ ↓ ↓
Oil extraction ↓ ↓ ↓ ↓ ↓ ↓ ↓ - Oil refining ↓ ↓ ↓ ↓ ↓ ↓ ↓ ↓
Esterification 0.738 0.756 0.853 0.896 0.713 0.932 0.985 0.994 Overseas transportation - - - - - 0.989 0.989 - Domestic transportation 0.994 0.994 0.994 0.994 0.994 0.994 0.994 0.994
0.734 0.751 0.848 0.891 0.709 0.916 0.969 0.988
BDF from rapeseed
Total
BDF from palmBDF from
waste food oil
(worst) (best) (average) (best) (average) (best) (worst) (best) Farming 32.14 28.23 6.94 6.04 6.94 6.04 25.15 9.40 - Overseas transportation (land) 0.96 0.89 ↑ ↑ ↑ ↑ 3.39 1.27 - Recovery - - - - - - - - 1.27 Ethanol production 55.06 34.82 0.00 0.00 1.52 1.35 143.49 84.91 93.31 Overseas transportation (sea) 4.39 4.39 10.28 10.28 10.28 10.28 2.40 2.40 - Domestic transportation 0.66 0.66 0.66 0.66 0.66 0.66 0.66 0.66 0.66
Total 93.21 68.98 17.87 16.97 19.39 18.32 175.09 98.64 95.24 Fixed CO2 △ 71.28 △ 71.28 △ 71.28 △ 71.28 △ 71.28 △ 71.28 △ 71.28 △ 71.28 △ 71.28
Ethanol fromsugarcane
(bagasse utilization)
Ethanol fromsugarcane
(power grid utilization)
Ethanol from foreign wood
Ethanol fromdomestic waste
wood
Ethanol from corn

- 45 -
Table 2.3.7 WTT energy efficiency of ethanol production pathways (LHV)
Table 2.3.8 WTT energy consumption of CH4 Table 2.3.9 WTT GHG emissions of CH4 gas gas production pathways [MJ/MJ] production pathways [g eq-CO2/MJ]
Table 2.3.10 WTT energy efficiency of CH4 fermentation pathways (LHV)
(worst) (best) (average) (best) (average) (best) (worst) (best) Farming ↓ ↓ ↓ ↓ ↓ ↓ ↓ ↓ ↓
Overseas transportation (land) ↓ ↓ ↓ ↓ ↓ ↓ ↓ ↓ ↓
Recovery - - - - - - - - ↓
Ethanol production 0.588 0.590 0.533 0.562 0.924 0.931 0.282 0.408 0.377 Overseas transportation (sea) 0.946 0.946 0.882 0.882 0.882 0.882 0.970 0.970 - Domestic transportation 0.991 0.991 0.991 0.991 0.991 0.991 0.991 0.991 0.991
Total 0.552 0.554 0.466 0.492 0.809 0.815 0.271 0.392 0.374
Ethanol fromsugarcane
(bagasse utilization)
Ethanol fromdomestic waste
wood
Ethanol fromsugarcane
(power grid utilization)
Ethanol from foreign woodEthanol from corn
Livestockmanure
Sewagesludge
Recovery 0.054 -
CH4 fermentation 0.521 0.584
Distribution 0.194 0.194
Fueling to vehicles 0.046 0.046
Total 0.814 0.823
Livestockmanure
Sewagesludge
Recovery 4.0 -
CH4 fermentation 15.0 16.8
Distribution 5.4 5.4
Fueling to vehicles 1.8 1.8
Total 26.3 24.1
Fixed CO2 △ 57.0 △ 57.0
Livestockmanure
Sewagesludge
Recovery ↓ -
CH4 fermentation 0.835 0.861
Distribution 0.951 0.951
Fueling to vehicles 0.983 0.983
Total 0.780 0.804

- 46 -
2.4 Synthetic Fuel Production Pathways
2.4.1 Abstract
Gas-to-Liquid (GTL) technology, which converts natural gas to liquid fuel, has recently become the focus ofattention. The background to this is that upstream there is an abundance of undeveloped gas fields and anincreased need for development in gas producing countries, while midstream there is improved economicefficiency due to improved GTL technology, and downstream there is an increased need for clean fuels due tostricter environmental regulations (Suzuki [2001]).Methods for the conversion of natural gas into liquid fuel can be divided into two broad categories, theindirect method, in which the gas is first converted into a highly reactive syngas (a mixture of CO andhydrogen) and then converted into FT synthetic oil, DME, methanol and so on, and the direct method, inwhich natural gas is converted directly to methanol and so on, without requiring initial conversion to syngas.Although the direct method was heavily researched in the 1980s in order to find a method of reducing costsrelated to the syngas production process, there were technical difficulties concerning the inhibition of carbondioxide gas generation as a side reaction, and although research is still undertaken at universities and others,there is no current industry level research (Suzuki [2001]).The synthetic fuel production process consists of three processes, the syngas production process, the FTsynthesis (DME synthesis, methanol synthesis) process and the hydrocracking/product refining process.
(1) Syngas Production from Natural Gas
Reforming processes are applied to produce syngas from natural gas; these include the following fourmethods:
⁃ Steam Reforming (SMR)⁃ Steam / CO2 Reforming⁃ Autothermal Reforming (ATR)⁃ Partial Oxidation (POX)
The H2/CO molar ratio for the composition of syngas generated from the above four methods is different foreach gas (See Figure 2.4.1).
Figure 2.4.1 Relation between syngas production process and H2/CO molar ratio([Source] Asaoka, et.al [2001])
1 3 4 5 62
Steam reforming
Steam/CO2 reforming
Autothermal reforming
Partial oxidation
H2/CO molar ratio

- 47 -
1) Steam Reforming (SMR)
This process has the greatest track record. Generally, this method uses a reaction between the hydrocarbons inthe feedstock and steam, in the presence of a nickel catalyst, at 600-850 degrees C and 2-3 MPa. The chemicalformula is as follows.
CH4 + H2O CO + 3H2
As this is a strong endothermic reaction, the method is characterized by the need for the heat source (Sato[2001]).
2) Steam / CO2 Reforming
This method combines the steam reforming reaction and the CO2 reforming reaction, using steam and CO2 asoxidizing agents to convert natural gas into syngas. Although the optimum H2/CO ratio of syngas for a FTreaction is 2, as steam reforming of natural gas generates a H2/CO ratio greater than 3, a CO2 reformer isadded to allow adjustment through CO2 reforming. JNOC is also conducting research and development of thisprocess, which allows CO2 contained in the feedstock gas to be utilized along with the natural gas as part ofthe feedstock without requiring removal.
3) Autothermal Reforming (ATR)
This reforming method combines the partial oxidization process (an exothermic reaction) with the steamreforming process (an endothermic reaction) in order to improve thermal efficiency, while maintainingthermal balance through one or two reactors. Autothermal reforming uses pure oxygen. As with the steamreforming process, a nickel catalyst is used (Sato [2001]).
4) Partial Oxidation (POX)
By providing less oxygen than would be required for complete combustion in the absence of a catalyst, thismethod causes incomplete combustion and uses the heat obtained from the exothermal reaction forgasification. As no catalyst is used, no problems occur even if impurities are present in the feedstock. Thismethod can be applied to many hydrocarbons other than natural gas, such as coal, heavy oil and biomass.Pure oxygen or air is used as the oxidizing agent. The chemical reaction formula is as follows (Sato [2001]).
CH4 + (1/2) O2 CO + 2H2
(2) FT Synthesis, DME Synthesis and Methanol Synthesis
Possible processes following on from syngas include FT synthesis, DME synthesis and methanol synthesis.However, as each process has its own suitable H2/CO molar ratio3, a process combined with a reformingprocess to attain the suitable H2/CO molar ratio is desirable.
3 Although for methanol synthesis the ratio is (H2 - CO2) / (CO + CO2), this shall also be cited henceforth as H2/COratio

- 48 -
⁃ FT synthesis : 2H2 + CO (1/n)(CH2)n + H2O + 167 kJ/mol⁃ DME synthesis (direct) : 3CO + 3H2 CH3OCH3 + CO2 + 244.9 kJ/mol⁃ Methanol synthesis : CO + 2H2 CH3OH + 90 kJ/mol
CO2 + 3H2 CH3OH + H2O + 49 kJ/mol
The reaction formula for each is shown below. As is apparent from the reaction formula, the H2/CO molarratio suitable for FT synthesis and methanol synthesis is 2, and the ratio suitable for DME synthesis is 1.Therefore, for FT synthesis and methanol synthesis, the reforming processes that attain a H2/CO molar ratio inthe region of 2, as shown in Fig 2.4.1, namely the autothermal reforming process and the partial oxidizationprocess are suitable. Although a FT synthesis process using Steam/CO2 reforming has recently beendeveloped, as this reforming process is able to attain H2/CO molar ratio=2, it is also extremely suited to FTsynthesis.
* FT synthesis, DME synthesis, methanol synthesis through the gasification of coal or biomass
Where gasification of coal or biomass is conducted, a wet gas cleaning process is first applied, as substancessuch as tar are present in the syngas. Afterwards, depending on the CH4 concentration present in the syngas,the gas is passed through a reformer and then on to a process to attain the suitable H2/CO molar ratio for thesubsequent stages. If the H2/CO molar ratio is greater than required at this point, surplus H2 is generatedcausing deterioration in efficiency.As with the reforming of natural gas, when coal is gasified a syngas containing H2 and CO is generated, but asthe hydrogen content in coal is low the H2/CO molar ratio of the gas is H2/CO≦1.With the gasification of biomass, the composition of the generated syngas varies depending on the type ofgasification furnace (furnace shape, different amounts of steam, oxygen/air input during gasification). H2/COmolar ratios can be either H2/CO≦1 or H2/CO≧1.As FT synthesis and methanol synthesis require a syngas with H2/CO molar ratio=2, for syngas with H2/COmolar ratio≦2, the following shift reaction is used to adjust ratio to H2/CO molar ratio=2.
Shift reaction : CO + H2O CO2 + H2
An example of biomass gasification including CH4 reforming and FT synthesis process flow is shown inFigure 2.4.2.
Figure 2.4.2 Process flow of biomass gasification and FT synthesis
gasificationfurnace
Woodybiomass
BFW
O2 / air
FTreformer
FT oil
FT gas*
reformer
shift reactor
scruber
CO2 remover
compressor 1 compressor 2
compressor 3
compressor 4
compressor 5
Drying

- 49 -
(3) Hydrocracking of Hydrocarbons
Although, a range of products such as naphtha, kerosene and diesel can be derived from FT synthesis, theprincipal constituent of these is normal paraffin with a variety of carbon chains. In this process, each productis obtained through distillation following the hydrocracking of hydrocarbons obtained through FT synthesis.The principal qualities and characteristics of synthetic fuels are shown in Table 2.4.1 and Table 2.4.2.
Table 2.4.1 The principal qualities of synthetic fuels
FT Diesel Methanol DMESasol
SSPD DieselShell
SMDS Diesel CH3OH C2H6O
Molecular weight 32.04 46.07Composition ratio C wt% 84.9 84.91 37.5 52.2
H wt% 15.1 14.97 12.6 13.1N wt% 0.67O wt% 0 0 49.9 34.7
Density 15/15℃ kg/L 0.7698 0.7845 0.796 0.6670℃, 1atm kg/m3 2.05
Freezing point ℃ -97.5Boiling point ℃ 159 - 352 210 - 338 65 -25Vapor pressure @38℃ kPa 32
@38℃ Psi 4.6Specific heat kJ/ (kg-k) 2.5 2.99Kinematic viscosity @20℃ mPa-s 0.59 < 1
@20℃ CSt 0.74@40℃ CSt 2.08 3.57
Water solubility @21℃ Moisture vol% 100Electrical conductivity mhos/cm 4.4 * 10-7
Latent heat of evapolation kJ/kg 1,178 467.13Higher heating value MJ/kg 46.7 47.2 22.7 31.7
MJ/L 35.9 37.0 18.1 21.1Lower heating value MJ/kg 44.0 19.7 28.8
MJ/L 34.5 15.8 19.2Flash point ℃ 59 72 11Auto ignition temperature ℃ 464 235Combustion limit Lower limit vol% 7.3 3.4
Upper limit vol% 36.0 18.6Theoretical air/fuel ratio 6.45 9.0Velocity of diffusion flame m/s 2 - 4 0.54Octane number RON 108.7
MON 88.6Cethane number > 74.8 > 74 55 - 60
Source Myburgh, et al[2000]
Norton, et al.[1998]
Bechtold[1997]
Bosch [2000]EIA[1994]
Kajitani, et al.[1998]
Bosch [2000]

- 50 -
Table 2.4.2 Properties of synthetic fuels
([Source] 1):Suzuki [2001], 2):Nakamura [2002], 3):PEC [2002-1], 4):JHFC website)
Advantage Disadvantage
FT diesel
・ No need to develop new infrastructure andtechnology to be used, since its property isalmost the same as petroleum-based diesel (Aswith other FT synthetic oils). 1)
・ Easily comply with quality standard ofautomobile diesel regulation due to its propertyof high cetane number and low aromaticcontent. 1)
・ Experience as commercially operated plants.2)
・ Also valuable as a blending material ofpetroleum products. 3)
・ Could worsen fuel efficiency because itsdensity is relatively low. 1)
・ Poor lubrication due to its low sulfur andaroma contents, while low expansivity of sealdue to its high paraffin with low aromacontent. 3)
FTkerosene
・ Superior in combustion quality due to its lowsulfur content and high smoke point. 3)
・ Has a potential to be used as a fuel forhousehold fuel cell besides an alternative ofkerosene. 3)
・ Expected to be used as an aviation fuel (inSouth Africa, a mixed fuel of FT kerosene andpetroleum-based jet fuel has been utilized). 3)
・ The existing petroleum-based kerosene issufficient in quality, so the issue is how muchdegree of premium it would be able to gain. 2)
FT naphtha
・ Suitable for petrochemical naphtha as afeedstock for ethylene degradation due to itshigh paraffin content. 3)
・ Expected as a fuel for fuel cell vehicles due toits few sulfur and aroma contents. 3)
・ If used at conventional internal combustionengine for gasoline, its low octane numberneeds to be increased by means such asalkylation. 2)
DME
・ Similar property to LPG, so that infrastructurefor LPG would be available. 2)
・ R&D has been underway to use it as asubstitute fuel of diesel (fuel for diesel engine)besides LPG substitute. 2)
・ Used for a limited purpose such as aerosolpropellant as the CFC substitute so far, so themarket is quite small. 2)
・ Its properties as a fuel, such as combustionquality, have not been sufficiently figured out.2)
・ Infrastructure building and technologydevelopments are necessary in order to use itas a fuel 2)
・ There are other issues to be solved such asproduction specification as a fuel, safetyrecognition, establishment of standard foruse.2)
Methanol
・ Methanol vehicle is classified as low emissionvehicles in Japan. 2)
・ For the use of a fuel for fuel cell vehicles, itcan be reformulated in lower reactiontemperature in comparison with other fuels. 4)
・ One of the toxic agents designated by"Poisonous and Deleterious SubstancesControl Law". 2)
・ If used as automobile fuel, fuel efficiency tendsto get worse because of its low heating value,although its octane number is high. 2)
・ Unsuitable for diesel engine due to its lowcetane number. 2)

- 51 -
2.4.2 Procedures for data collection of unit process
The synthetic fuel production pathway flow examined in this study is shown in Figure 2.4.3. Of thesepathways, this study acquired prior studies related to FT synthetic oil, DME, methanol production fromnatural gas, FT synthetic oil production from coal, FT synthetic oil, DME, methanol production from biomass.Prior studies related to other pathways, specifically DME and methanol production from coal, could not beacquired. Consequently, this study has attempted to make estimates for these pathways. Specifically, inrelation to all synthetic fuel production pathways, including these pathways, conditions were set for aparticular process, and energy efficiency estimates were made according to those conditions. Conditions setfor the estimates and the estimates are shown in “(10) Energy Efficiency Estimates” at the end of this section.
Figure 2.4.3 Pathway flow for synthetic fuels production
(1) FT Synthetic Oil Production Pathway from Natural Gas
<i> Existing Study
Table 2.4.3 shows data calculated in prior studies. As the range of fuel types studied varies with each report,fuel types are also clearly indicated.
from natural gasextraction process
Raw natural
gas
Syngas production/ DME directsynthesis
Syngas production/ FT synthesis
Syngas production/ Methanol synthesis
FTsynthetic oil
DME
Methanol
Domestictransportation
(sea/land)
Domestictransportation
(sea/land)
Domestictransportation
(sea/land)
Fueling tovehicles
(diesel vehicle) (diesel hybrid vehicle)
Fueling tovehicles
(DME-fueled vehicle)
Fueling tovehicles
(methanol vehicle)
to on-site hydrogen production pathways
to on-site hydrogen production pathways
to on-site hydrogen production pathways
Overseastransportation
(sea)
Overseastransportation
(sea)
Overseastransportation
(sea)
from coal mining/ washing process Coal
Biomass

- 52 -
Table 2.4.3 Energy efficiencies and carbon efficiencies regarding natural gas based FT syntheticoil production pathways in existing studies
Data given in Bechtel Corporation [1998] has been used to calculate some of the data given in Marano, J.J etal. [2001]. In addition, Beer, T., et al. [2001] (p.128) adopts values for fuel efficiency (taking calorific valueof steam into account) and carbon efficiency (for FT diesel) as given in Wang, M.Q., et al. [1999] (p.34).PricewaterhouseCoopers [2003] was released in May 2003 as the final report of a study on SMDS (ShellMiddle Distillate Synthesis) technology, developed by Shell. Shell Gas & Power [2002] and some otherreports are thought to be publications generated by this study.
<ii> This Study
In this study, energy consumption and GHG emissions calculations for the FT synthetic oil production fromnatural gas process are based on PricewaterhouseCoopers [2003], which focuses on new technologies andprovides comparatively detailed data. As the report assumes a SMDS plant in the Middle East with unitheating value for natural gas feedstock at 43.2 MJ/kg, this study also uses this value. In addition, as the reportalso implements load distribution through weight, this study also follows suit.
Reference Feedstock Product Cogeneration, etc.
Natural gas FT diesel 66 % 76 % Energy efficiency takes into account the Btu in steam. Natural gas FT diesel 49 % 76 % Energy efficiency does not take into account the Btu in steam. Natural gas FT diesel 57 % 73 % Design does not include steam or electricity export. Flared gas FT diesel 55 % 73 % Flared gas as feedstock. No electricity cogeneration. Incremental. Flared gas FT diesel 57 % 73 % Flared gas as feedstock. No electricity cogeneration. Leap-forward.
Marano, J.J et al.[2001](E2S, LLC)
Natural gas (Pipeline) FT synthetic oil 59.1 % 57 % With conventional product upgrading.
Associated gas FT synthetic oil 57.3 % 39.3 % Associated gas as feedstock. Associated gas FT synthetic oil 57.1 % 39.2 % Associated gas as feedstock. Once-through power generation.
Argonne National Lab. [2001] Natural gas FT diesel,
naphtha 61 - 65 % 75 - 85 % Without steam or electricity export.
Natural gas FT diesel, naphtha 53 - 57 % 75 - 85 % Excluding energy in co-products.
Ahlvik, P. et al.[2001] (Ecotraffic) Natural gas FT synthetic oil 57 %
Natural gas FT diesel 62 % 78.3 % Mossgas Design. Standalone. Natural gas FT diesel 54 % 68.4 % Rentech Design. Standalone. Natural gas FT diesel 49.6 % 68.4 % Rentech Design. With electricity cogeneration. Natural gas FT diesel 57 % 72 % Syntroleum Design. Standalone. Natural gas FT diesel 49 % 72 % Syntroleum Design. With steam cogeneration. Flared gas FT diesel 57 % 65 % Flared gas as feedstock. Syntroleum Design. Standalone.
PEC[2002-2] Natural gas FT diesel 49 - 66 % 1,370 - 2,780 g-CO2/kg-FTD GM, et al. [2002] Natural gas FT diesel 61 - 65 % 15.8 - 21.5 g-CO2/MJ-FTD
Natural gas FT naphtha 61 - 65 % 17.3 - 23.0 g-CO2/MJ-FTN Shell Gas & Power [2002] Natural gas FT synthetic oil 60 - 65 % 80 - 82 % SMDS (Shell Middle Distillate Synthesis)
Energy efficiency orenergy consumption
CO2 emission orcarbon efficiency
Wang, M.Q. et al. [1999] (Argonne National Lab.)
Wang, M.Q.[2001] (Argonne National Lab.)

- 53 -
(2) DME Production Pathway from Natural Gas
<i> Existing Study
Table 2.4.4 shows data calculated in prior studies.
Table 2.4.4 Energy efficiencies and carbon efficiencies regarding natural gas based DMEproduction pathways in existing studies
Of the above prior studies, the report of a study conducted by Denmark’s Haldor Topsøe A/S into thecompany’s own DME direct synthesis technology (Haldor Topsøe [2001]), provides specific input/output datarelated to the entire plant based on actual measurements, although it does not go into analysis of eachindividual process (see Figure.2.4.4).
<ii> This Study
For calculation purposes, this study uses data given in Haldor Topsøe [2001] for reference, as the basis forcalculation is comparatively clear (see Figure.2.4.4).
Figure 2.4.4 DME direct synthesis process by Haldor Topsøe
20.8
% Energy fromexothermicreactions
Ideal Process
2 CH4 + O2
2 * LHV CH4
1,605 MJ
Haldor TopsøeDME process
LHV DME1,329 MJ
Additional energyto cover non-idealities
CH3OCH3 + H2O
120.8% 100%
19.2
%
Reference Feedstock Product Cogeneration, etc.
Hansen, J. B. et al.[1995] (Haldor Topsøe) Natural gas DME 0.44 t-CO2/t-DME
Natural gas DME 69 % 0.446 t-CO2/t-DME No electricity cogeneration. incremental Natural gas DME 70 % 0.446 t-CO2/t-DME No electricity cogeneration. leap-forward Flared gas DME 68 % 0.446 t-CO2/t-DME Flared gas as feedstock. No electricity cogeneration. incremental Flared gas DME 69 % 0.446 t-CO2/t-DME Flared gas as feedstock. No electricity cogeneration. leap-forward
NEDO [2001-3] Natural gas DME 71 % 0.112 g-C/10kcal Natural gas input : 1.114 Nm3 / t-DME355 kg-CO2/t-DME12.3 g-CO2/MJ-DME
Ahlvik, P. et al.[2001] (Ecotraffic) Natural gas DME 74 %
Energy efficiency orenergy consumption
CO2 emission orcarbon efficiency
Wang, M.Q. et al.[1999] (Argonne National Lab.)
Haldor Topsøe[2001] Natural gas DME 71.2 %

- 54 -
(3) Methanol Production Pathway from Natural Gas
<i> Existing Study
Table 2.4.5 shows data calculated in prior studies.
Table 2.4.5 Energy efficiencies and carbon efficiencies regarding natural gas based methanolproduction pathways in existing studies
<ii> This Study
Unlike FT synthetic oil and DME, for the methanol production from natural gas process, there is no data witha clear basis for calculation. Consequently, in this study, energy consumption and GHG emissions for themethanol production from natural gas process were calculated for two cases, from worst (67%) and optimum(70%) fuel efficiency figures given in PEC [2002-2] and General Motors, et al. [2002]. Furthermore, CO2
emissions calculations were made according to the method used in IAE [1990]. Specifically, according to thefollowing procedure.
1) Calculation of carbon content in natural gas used for feedstock and for fuel2) Calculation of carbon content in the produced methanol product3) Difference in carbon content converted to CO2 weight, result given as CO2 emissions
However, although IAE [1990] subtracts associated CO2 from the CO2 emissions calculated in this mannerand notes associated CO2 separately, this study stops at figures for CO2 emissions inclusive of associated CO2.In addition, methanol heating values and carbon content (%) are as given in Table 2.4.1 and ANRE [1992]was used as reference for properties of natural gas used as feedstock and fuel. Regarding natural gasproducing regions, although places indicated in PEC [2002-1] (p.119) may be considered such as Malaysia,Indonesia, Australia, Iran and Qatar, where plant construction is planned, this study uses simple averagesderived from data regarding three countries (Malaysia, Indonesia (Badak), Australia) mentioned in ANRE[1992].
Reference Feedstock Product Cogeneration, etc.
IAE [1990] Natural gas Methanol 7.1 *106 kcal/t-MeOH 315.8 kg-CO2/t-MeOH Energy cosumption includes energy as feedstock. Natural gas Methanol 67 % Incremental. Natural gas Methanol 70 % Leap-forward Flared gas Methanol 65 % 65 % Incremental. Flared gas Methanol 67 % 67 % Leap-forward Natural gas Methanol 67.5 % Without steam or electricity export. Natural gas Methanol 64 % Excluding energy in co-products.
Ahlvik, P. et al.[2001] (Ecotraffic)
Natural (hydrogen-rich) Methanol 70 % 90 %
PEC[2002-2] Natural gas Methanol 67 - 70 % 710 - 820 g-CO2/kg-MeOH GM, et al. [2002] Natural gas Methanol 67.3 - 69.4 % 12.4 - 14.9 g-CO2/MJ-MeOH
Energy efficiency orenergy consumption
CO2 emission orcarbon efficiency
Wang, M.Q. et al.[1999] (Argonne National Lab.)
Argonne National Lab. [2001]

- 55 -
(4) FT Synthetic Oil Production Pathway from Coal
<i> Existing Study
Table 2.4.6 shows data calculated in prior studies. Regarding the FT synthetic oil production from coalprocess, Marano, J.J et al.[2001] calculates fuel efficiency and carbon efficiency for several cases accordingto coal producing region and production technology. These calculations are based on data given in BechtelCorporation [1998].
Table 2.4.6 Energy efficiencies and carbon efficiencies regarding coal based FT systhetic oilproduction pathways in existing studies
<ii> This Study
[Mining / washing process of imported coal]
As data obtained through hearing surveys with industry related to the coal mining process, Hondo et al.[1999] gives figures for fuel input (diesel, gasoline, electricity) per unit weight during coal mining and coalwashing for open-pit and underground coal mining in Australia, and calculates environmental burden for theentire lifecycle of imported coal consumption in Japan. These values are also used in CRIEPI [2000] (p.19).In this study also, energy consumption and GHG emissions were calculated for the extraction process andwashing process of imported coal based on data given in Hondo et al. [1999], the extraction method at theimported coal source and actual import volumes. Furthermore, regarding energy consumption and CO2
emission factors during power generation in each country, data reflecting the power generation circumstancesof each was created and applied.
[FT synthetic oil production process]
As with methanol production from natural gas, regarding the FT synthetic oil production from coal process,there is no data with a clear basis for calculation. Consequently, in this study, energy consumption and GHGemissions for the FT synthetic oil production from coal process were calculated for two cases, from worst(47.4%) and optimum (52%) fuel efficiency figures given in Marano, J.J et al. [2001]. Furthermore, CO2
emissions calculations were made according to the method used in IAE [1990]. Here, the carbon content infeedstock coal is the weighted average of carbon content (%) in coal from each country and import ratio.
Reference Feedstock Product Cogeneration, etc.
Coal (Illinois) FT synthetic oil 50.4 % 40.1 % Shell Design. With conventional product upgrading. Coal (Illinois) FT synthetic oil 52 % 41.1 % Shell Design. With ZSM-5 product upgrading.
Coal (Illinois) FT synthetic oil 47.4 % 37.7 % Shell Design. With conventional product upgrading + fluidized-bed catalytic cracking for wax conversion.
Coal (Wyoming) FT synthetic oil 49.3 % 39.1 % Shell Design. With conventional product upgrading.
Marano, J.J et al.[2001] (E2S, LLC)
Energy efficiency orenergy consumption
CO2 emission orcarbon efficiency

- 56 -
(5) FT Synthetic Oil Production Pathway from Biomass
<i> Existing Study
Table 2.4.7 shows data calculated in prior studies for FT synthetic oil, DME and methanol production frombiomass processes.
Table 2.4.7 Energy efficiencies and carbon efficiencies regarding coal based synthetic fuelproduction pathways in existing studies
<ii> This Study
Regarding the FT synthetic oil production from biomass process, energy consumption and GHG emissionswere calculated for two cases, from worst (45%) and optimum (51%) fuel efficiency figures given in Ahlvik,P. [2001] and Marano, J.J et al. [2001].
(6) DME Production Pathway from Biomass
<i> Existing Study
Shown in Table 2.4.7.
<ii> This Study
Regarding the DME production from biomass process, energy consumption and GHG emissions werecalculated from fuels efficiency figures (57%) given in Ahlvik, P. [2001].
(7) Methanol Production Pathway from Biomass
<i> Existing Study
Shown in Table 2.4.7.
<ii> This Study
Regarding the methanol production from biomass process, energy consumption and GHG emissions were
Reference Feedstock Product Cogeneration, etc.
Marano, J.J et al.[2001] (E2S, LLC)
Biomass (Maplewood) FT synthetic oil 51 % 37.2 % With conventional product upgrading and once-through power
generation. BCL Design. Ahlvik, P. et al.[2001] (Ecotraffic) Biomass FT synthetic oil 45 %
Ahlvik, P. et al.[2001] (Ecotraffic) Biomass DME 57 %
Biomass Methanol 54 % 104 g-CO2 /MJ-MeOH Excluding by-product : hot water. Biomass Methanol 65 % 104 g-CO2 /MJ-MeOH Including by-product : hot water for district heating.
Energy efficiency orenergy consumption
CO2 emission orcarbon efficiency
Ahlvik, P. et al.[2001] (Ecotraffic)

- 57 -
calculated for two cases, from worst (54%) and optimum (65%) fuel efficiency figures given in Ahlvik, P.[2001] and Marano, J.J et al. [2001].
(8) Overseas Transportation (Sea)
<i> Existing Study
In relation to GTL (FT synthetic oil), NEDO [2001-3] (p. I-124 - I-130) assumes an 80,000 t shipping vessel,and provides fuel consumption data for passage and while moored at loading/unloading ports. In addition,although the report gives the standard vessel size for methanol as 45,000 t, no fuel consumption data isprovided. Although there is also no shipping vessel data given for DME, vessels are considered to have thesame structural and functional properties as LPG vessels.PEC [2002-2] gives the vessel size for both GTL and methanol as 50,000 t, with import sources (producingcountries) stated as the Southeast Asia, the Middle East and Australia.
<ii> This Study
Regarding FT synthetic oil, this study uses data given for GTL vessels in NEDO [2001-3]. Other than theomission of energy for cargo heating, which is not required for GTL, this data is the same as data for 80,000 tcrude oil tankers given in PEC [1998] and PEC [2002-2].Regarding DME, LPG vessel data used later in “2.5 Liquid Petroleum Gas Production Pathways” also applieshere. This data is based on data given in IEEJ [1999] for overseas transportation of LPG, while for vesselspeed, figures given in PEC [1998] for crude oil tankers have been substituted.Regarding methanol, figures given for methanol vessel capacity in NEDO [2001-3] are used, while figuresgiven in the report for GTL vessel speed and fuel consumption have been substituted.Furthermore, regarding the import sources (producing countries) of each synthetic fuel, for natural gas basedfuels, for the five countries (Malaysia, Indonesia, Australia, Iran, Qatar) given in PEC [2002-1] as having ahigh probability of becoming GTL suppliers to Japan, simple averages were calculated from data per countryto obtain final values. For coal based fuels, suppliers were considered based on the actual import volume ofcoal given in METI [2002], and the weighted average was calculated from the actual import volume as thefinal value. Australia is considered for biomass based fuels.
(9) Domestic Transportation (Sea/Land)
<i> Existing Study
Regarding the transportation process of synthetic fuels in Japan, NEDO [2001-3] states that GTL andmethanol can be handled through the same supply route as gasoline, and DME can be handled through thesame route as LPG. In addition, PEC [2002-2] also states that the environmental burden related to thetransportation process of GTL and methanol in Japan is the same as for petroleum products.
<ii> This Study
In this study, for FT synthetic oil and methanol, data calculated in “2.1 Petroleum Based Fuel Production

- 58 -
Pathways” for the domestic transportation of diesel has been substituted, while for DME, data related to thedomestic transportation of LPG has been substituted.
(10) Energy Efficiency Estimates
In this study, in relation to each synthetic fuel production path, conditions were set for a particular process,and energy efficiency estimates were made according to those conditions.Regarding the production processes of synthetic fuels from all feedstock types, existing information isinsufficient as the number of operational facilities is limited. Therefore, in this study, for reference purposes,energy efficiency estimates were made by calculating material balance and heat balance for the mainproduction processes of each fuel from feedstock, in order to estimate the general energy efficiency of eachprocess. The natural gas considered here is pure CH4. In addition, as each process involves an exothermicreaction under pressure, calculations were conducted under the assumption that the heat recovered from themain process is used to power the compressor which is the main powered equipment in the process, whileenergy consumption of processes other than the main process, which was thought to be comparatively small,were not considered in the calculations. The conditions set are shown below.
<i> Syngas production process
Settings for the operating conditions of reformers are shown in Table 2.4.8.
Table 2.4.8 Operating conditions of natural gas reformer
Reforming method Temperature [℃] Pressure [MPa]Steam reforming 850 2.1Steam/CO2 reforming 850 2.1Partial oxidation 1,300 2.1Autothermal reforming 1,050 2.1Coal gasification (Shell) 1,371 2.4Woody biomass 982 3.4
The composition of syngas from natural gas reforming were calculated from equilibrium composition underoperating conditions shown in Table 2.4.8 for the reaction combinations given below.
CH4 + H2O ⇔ CO + 3H2 (formula 1)
CO + H2O ⇔ CO2 + H2 (formula 2)
CH4 + CO2 ⇔ 2CO + 2H2 (formula 3)
CH4 + 2O2 → CO2 + 2H2O (formula 4)
Regarding coal gasification and woody biomass, calculations cannot be made as there are no clear reactionformulas such as those above, and data based on actual measurements given in Williams, R.H, et al. [1995]and Tijmensen, M.JA. [2000] has been used.

- 59 -
<ii> H2/CO molar ratios
H2/CO molar ratios obtained from equilibrium calculations using the above “formula 1” - “formula 4” areshown in Table 2.4.9. “Formula 4” is used for partial oxidation and autothermal reforming.
Table 2.4.9 H2/CO molar ratio in syngas
Reforming method H2/CO molar ratioSteam reforming 3Steam/CO2 reforming 2Partial oxidation 1.7Authothermal reforming 2Coal gasification (Shell) 0.5Woody biomass 1.4
<iii> Achieve the appropriate H2/CO molar ratios
When the syngas has a higher H2/CO molar ratio than required for the subsequent process, the processprogresses without any additional action.On the other hand, when the syngas has a lower H2/CO molar ratio than required for the subsequent process, aCO shift reaction is introduced to achieve the appropriate H2/CO molar ratio. As the CO shift reaction isexothermic, values of removed heat were also calculated.For syngas from biomass, as there is substantial CH4 residue, the introduction of a CO shift reaction afterpassage through a reformer was assumed. The heat required by the reformer was assumed to be provided byheat recovered from the subsequent process.
<iv> Calculate the volume of the fuel produced
For the volume of fuel produced in the subsequent process, values were set for CO [kmol] in the syngas,product molecular weight [kg/kmol] and CO conversion rate (CO reaction rate in syngas) [-] (set at 0.95), andcalculations were made according to the following formula.
(Synthetic Product Volume [kg])= (CO [kmol]) * (Product Molecular Weight [kg/kmol]) * (CO conversion rate [-])
For FT synthetics, although various carbon number compounds are generated, FT oil was treated as the totalof C5+ constituents (carbon number greater than C5). C1 - C4 gas constituents are used as gases (Tijmensen,M.JA. [2000] assumes in-house use for IGCC power generation).In addition, the constituent ratio of carbon numbers n in FT synthetic oil have been calculated using chaingrowth probability α through α(n-1) * (1-α), as shown in Figure 2.4.5.

- 60 -
Figure 2.4.5 Composition of FT synthetics
<v> Calculate the product efficiency
Efficiency was then calculated from the product volume obtained through the above using the followingformula.
(Product Efficiency [%])= (Product Volume [kg] * Heating Value [MJ/kg]) / (Feedstock and Fuel Heating Value [MJ]) * 100
2.4.3 Calculation results
Regarding the synthetic fuel production pathways, the results of calculations for energy consumption, GHGemissions and energy efficiency during production of 1 MJ petroleum products are shown in Table 2.4.10(energy consumption), Table 2.4.11 (GHG emissions) and Table 2.4.12 (energy efficiency).
Table 2.4.10 WTT energy consumption of synthetic fuel production pathways [MJ/MJ]
* Reference values estimated in this study (tentative calculation) [see (10)]
CO,H2
↓↓ → C1 1-α↓α 1-α
α ↓ → C2 α(1-α)↓
α2
↓ 1-α
α ↓ → C3 α2(1-α)
α3
・・・・
best worst best worst best worst best worst Upstream process of feedstock 0.017 0.016 0.016 0.017 0.028 0.030 0.074 0.084 0.066 0.058 0.070 Fuel synthesis 0.514 0.404 0.429 0.493 0.923 1.110 0.961 1.222 0.754 0.538 0.852 Overseas transportation 0.017 0.036 0.069 0.069 0.012 0.012 0.013 0.013 0.026 0.050 0.050 Domestic transportation 0.005 0.011 0.010 0.010 0.005 0.005 0.005 0.005 0.011 0.010 0.010
Total 0.553 0.468 0.524 0.589 0.968 1.156 1.052 1.324 0.858 0.657 0.983
From natural gas From coal From biomass
FTsynthetic
oilDME
Methanol FT syntheticoil
FT syntheticoil DME
Methanol
best worst best worst best worst Upstream process of feedstock 0.016 0.023 0.014 0.018 0.019 0.024 0.025 0.028 0.033 0.112 0.062 0.082 Fuel synthesis 0.446 1.025 0.260 0.606 0.678 1.102 0.719 0.695 0.731 1.956 0.649 1.178 Overseas transportation 0.017 0.017 0.036 0.036 0.069 0.069 0.012 0.025 0.047 0.013 0.026 0.050 Domestic transportation 0.005 0.005 0.011 0.011 0.010 0.010 0.005 0.011 0.010 0.005 0.011 0.010
Total 0.484 1.070 0.322 0.671 0.777 1.205 0.761 0.759 0.821 2.085 0.749 1.321
FTsynthetic
oil
DME MethanolMethanol
From natural gas From coal From biomass
DME MethanolFT
syntheticoil
DMEFT synthetic
oil

- 61 -
Table 2.4.11 WTT GHG emissions of synthetic fuel production pathways [g eq-CO2/MJ]
* Reference values estimated in this study (tentative calculation) [see (10)]
Table 2.4.12 Energy efficiency of synthetic fuel production pathways (LHV)
* Reference values estimated in this study (tentative calculation) [see (10)]
best worst best worst best worst best worst Upstream process of feedstock 1.28 1.19 1.21 1.27 10.86 11.87 5.01 5.68 4.48 3.93 4.73 Fuel synthesis 20.00 12.33 15.63 19.42 54.63 54.97 0.00 0.00 0.00 0.00 0.00 Overseas transportation 1.34 2.78 5.28 5.28 0.93 0.93 0.99 0.99 2.03 3.87 3.87 Domestic transportation 0.36 0.84 0.80 0.80 0.36 0.36 0.36 0.36 0.84 0.80 0.80
Total 22.99 17.14 22.93 26.77 66.78 68.14 6.36 7.03 7.35 8.61 9.41 Fixed CO2 △ 70.76 △ 70.76 △ 66.46 △ 69.00 △ 69.00
FT syntheticoil DME
MethanolFTsynthetic
oilDME
Methanol FT syntheticoil
From biomassFrom natural gas From coal
best worst best worst best worst Upstream process of feedstock 1.23 1.72 1.07 1.36 1.42 1.78 9.76 9.87 10.38 7.56 4.22 5.57 Fuel synthesis 14.88 49.20 8.21 28.68 30.44 55.54 48.07 50.69 50.61 0.00 0.00 0.00 Overseas transportation 1.34 1.34 2.78 2.78 5.28 5.28 0.93 1.91 3.65 0.99 2.03 3.87 Domestic transportation 0.36 0.36 0.84 0.84 0.80 0.80 0.36 0.84 0.80 0.36 0.84 0.80
Total 17.82 52.63 12.90 33.66 37.94 63.40 59.13 63.31 65.43 8.91 7.08 10.24 Fixed CO2 △ 70.76 △ 66.46 △ 69.00
From coalFrom natural gas
Methanol
From biomassFT synthetic
oil DME Methanol FTsynthetic
oilDME Methanol
FTsynthetic
oilDME
best worst best worst best worst best worst Upstream process of feedstock 0.987 0.987 0.987 0.987 0.993 0.993 ↓ ↓ ↓ ↓ ↓
Fuel synthesis 0.661 0.712 0.700 0.670 0.520 0.474 0.497 0.439 0.556 0.634 0.527 Overseas transportation 0.983 0.965 0.936 0.936 0.988 0.988 0.987 0.987 0.974 0.952 0.952 Domestic transportation 0.995 0.989 0.990 0.990 0.995 0.995 0.995 0.995 0.989 0.990 0.990
Total 0.638 0.671 0.640 0.613 0.508 0.463 0.489 0.431 0.536 0.597 0.496
FT syntheticoil DME
MethanolFTsynthetic
oilDME
Methanol FT syntheticoil
From natural gas From coal From biomass
best worst best worst best worst Upstream process of feedstock 0.987 0.987 0.987 0.987 0.987 0.987 0.993 0.993 0.992 ↓ ↓ ↓
Fuel synthesis 0.692 0.494 0.793 0.623 0.596 0.476 0.582 0.590 0.578 0.330 0.591 0.448 Overseas transportation 0.983 0.983 0.965 0.965 0.936 0.936 0.988 0.976 0.955 0.987 0.974 0.952 Domestic transportation 0.995 0.995 0.989 0.989 0.990 0.990 0.995 0.989 0.990 0.995 0.989 0.990
Total 0.668 0.477 0.748 0.587 0.545 0.435 0.568 0.565 0.542 0.324 0.570 0.422
DMEFT
syntheticoil
DME MethanolFT
syntheticoil
Methanol
From natural gas From coal From biomassFT synthetic
oil DME Methanol

- 62 -
2.5 Liquefied Petroleum Gas Production Pathways
2.5.1 Abstract
LPG is a hydrocarbon with carbon number 3 or 4, specifically propane, propylene, butane, butylene, or otherpetroleum products with these as the main constituents (see 2.1.1 (5)).LPG production methods include the following three methods.
1) Gas associated with crude oil from oil fields is separated and refined and LPG is collected(associated gas derivative)
2) Gas extracted from gas fields (mainly CH4) is separated and refined, and LPG is collected(raw natural gas derivative)
3) Collection as a byproduct gas at petroleum refineries/petrochemical plants(from petroleum refining)
Of these, the process of 2) up to the processing/liquefaction process is calculated in “2.2 Natural Gas BasedFuel Production Pathways”, and the process of 3) up to the petroleum refining process is calculated in “2.1Petroleum Based Fuel Production Pathways”. Here, along with calculations for the LPG production fromassociated gas pathways of 1), weighted average values for actual LPG supply and demand ratio in Japan(associated gas derivative 61.4%, raw natural gas derivative 15.4%, petroleum refining derivative 23.2%(Source: IEEJ [1999] (p.37))) were also calculated for each pathway.
2.5.2 Procedures for data collection of unit process
LPG production pathway flow examined in this study are shown in Figure 2.5.1:
Figure 2.5.1 Pathway flow for LPG production
(1) Processing and Liquefaction of Associated Gas
<i> Existing Study
The CO2 emissions values given on a calorific basis for the production (extraction) process, accompanyingflare combustion and CH4 vent, in IEEJ [1999] (p.35), are the same values calculated for petroleum productsinventory data in the report. In addition, as data could not be obtained for the processing/liquefaction process,a simulation was conducted based on the specifications of an overseas processing/liquefaction plant of thesame scale. Furthermore, the report contains no mention of associated CO2, even in the petroleum products
Fueling tovehicles
(LPG vehicle)from raw natural gas
processing and liquefactionprocess (overseas)
LPGProcessing and
Liquefaction
LPG
from petroleum refineryprocess (domestic) LPG
Overseastransportation
(sea) Domestictransportation
(sea/land) to on-site hydrogen production pathways
Associatedgas

- 63 -
section, and seems to assume that CO2 will not be generated even in the processing/liquefaction process ofLPG from associated gas.
<ii> This Study
For the production (extraction) process, this study uses the calculation results of “2.1 Petroleum Based FuelProduction Pathways”. In addition, regarding the processing/liquefaction process, CO2 emissions are quotedfrom simulation values in IEEJ [1999] (p.50), and energy consumption was calculated according to the dataupon which the same simulation was based.
(2) Overseas Transportation (Sea)
<i> Existing Study
IEEJ [1999] (p.35) considers the tank capacity and stowage factor of a standard LPG shipping vessel, assumesthe fuel used to be C-heavy fuel oil and A-heavy fuel oil and, taking the propane and butane ratio of LPG foreach region into account, cites weighted averages for CO2 emissions based on import distribution ratios for1997.
<ii> This Study
This study cites values given in IEEJ [1999] (p.51) for data related to LPG vessels, and calculates importdistribution ratio using actual figures for 2001. Regarding LPG vessel speed, which is not mentioned in IEEJ[1999], the value given in PEC [1998] for 80,000 t and 100,000 t crude oil tankers (15.1 knots) was used.Furthermore, although IEEJ [1999] considers LPG vessel tank capacity in m3 units, as LPG is shipped inliquid form over the marine shipping process, unit notation here has been changed to kL to avoid confusion.
(3) Domestic Transportation (Sea/Land)
<i> Existing Study
Although IEEJ [1999] gives figures for CO2 emissions for domestic LPG transportation under the assumptionof overland transportation (tank lorry) and coastal transportation (coastal tanker), the reasoning behind thecalculations is not clear.
<ii> This Study
In this study, values for the domestic transportation process of petroleum based fuel production pathways(gasoline) have been substituted.
(4) Fueling to Vehicles
As the main constituent of LPG for vehicles is butane, as with gasoline the energy consumption for supply tovehicles is considered negligible. Consequently, this study treats this value as zero.

- 64 -
2.5.3 Calculation results
Regarding the LPG production pathways, the results of calculations for energy consumption, GHG emissionsand energy efficiency during production of 1 MJ petroleum products are shown in Table 2.5.1 (energyconsumption), Table 2.5.2 (GHG emissions) and Table 2.5.3 (energy efficiency).
Table 2.5.1 WTT energy consumption of LPG production pathways [MJ/MJ]
Table 2.5.2 WTT GHG emissions of LPG production pathways [g eq-CO2/MJ]
Table 2.5.3 WTT energy consumption of LPG production pathways (LHV)
Fromassociated gas
Fromraw natural gas
Frompetroleum refinery
Weightedaverage
Shares 61.4% 15.4% 23.2% 100% Operation 0.012 0.011 0.011 0.012 Flare combustion 0.006 0.002 0.006 0.005 Operation 0.059 0.099 - 0.052 Flare combustion - 0.009 - 0.001
Overseas transportation 0.035 0.035 0.011 0.030 Petroleum refining - - 0.116 0.027 Domestic transportation 0.007 0.007 0.007 0.007 Fueling to vehicles 0.000 0.000 0.000 0.000
Total 0.120 0.163 0.151 0.134
Processing/ liquefaction
Extraction
Fromassociated gas
Fromraw natural gas
Frompetroleum refinery
Weightedaverage
Shares 61.4% 15.4% 23.2% 100% Operation 0.75 0.49 0.70 0.70 Flare combustion 0.37 0.15 0.35 0.34 CH4 vent 0.04 0.22 0.03 0.06 Operation 3.36 5.34 - 2.88 Flare combustion - 0.42 - 0.06 CH4 vent - 0.56 - 0.09
Associated CO2 0.00 1.90 0.30 0.36 Overseas transportation 2.72 2.72 0.85 2.28 Petroleum refining - - 7.16 1.66 Domestic transportation 0.52 0.52 0.52 0.52 Fueling to vehicles 0.00 0.00 0.00 0.00
Total 7.76 12.32 9.93 8.96
Extraction
Processing/ liquefaction
Fromassociated gas
Fromraw natural gas
Frompetroleum refinery
Weightedaverage
Shares 61.4% 15.4% 23.2% 100% Extraction 0.982 0.987 0.982 - Processing / liquefaction 0.944 0.901 - - Overseas transportation 0.966 0.966 0.988 - Petroleum refining - - 0.950 - Domestic transportation 0.993 0.993 0.993 - Fueling to vehicles 1.000 1.000 1.000 -
Total 0.889 0.853 0.916 0.890

- 65 -
2.6 Electricity (Electric Power Generation Pathways)
2.6.1 Abstract
Power generation can be broadly classified into hydroelectric power generation, thermal power generation,nuclear power generation, and other power generation methods using natural energy such as solar power,wind power, geothermal power and biomass power generation which uses waste wood. From the perspectiveof automotive fuel production, electricity can be used in electric vehicles and in electrolysis for hydrogenproduction.
(1) Hydroelectric Generation
This method of generation utilizes the power of falling water (potential energy) to turn generators and produceelectricity. As this system can be activated and deactivated at short notice, it can be used to supply power atpeak power consumption times during the day and to respond to sharp variations in demand. For a nation likeJapan, relying mainly on imports for energy, hydroelectric power generation, which utilizes the abundantwater resources, is a valuable purely domestic energy source in which much hope is placed.
(2) Thermal Power Generation
This method burns fossil fuels such as petroleum, LNG and coal in boilers to produce high-temperature/ high-pressure steam, which is then used to turn turbines and generate electricity. This system provides high outputpower generation and also allows output to be adjusted to demand, performing a central role in present daypower generation. There are four types of thermal power generation:
<i> Steam power
Fuel is burned in boilers to produce high-temperature/high-pressure steam, which is used to turn turbines andgenerate electricity. At present, thermal power generation accounts for an overwhelmingly large proportion ofpower generation capacity and output.
<ii> Internal combustion power
Internal combustion engines such as diesel engines are used to generate electricity. This is used in small-scalepower generation mainly on isolated islands.
<iii> Gas turbine power
Combustion gas from fuels such as kerosene and diesel are used to turn turbines and generate electricity. Thismethod is used in response to demand at peak times.
<iv> Combined cycle thermal power
This is a new power generation method with excellent heat efficiency, which combines gas turbines and steam

- 66 -
turbines. This system can easily be activated and deactivated at short notice, and allows instantaneousresponse to sharp variations in demand.
(3) Nuclear Power Generation
With nuclear power generation, the heat generated by the nuclear fission of uranium within a nuclear reactoris used to produce high-temperature/high-pressure steam, which is used to turn turbines and generateelectricity. Although there are a number of nuclear reactor types, reactors most commonly in use in Japan arelight water reactors.Light water reactors are the reactor type most commonly in use throughout the world, using moderators(substance which retards the speed of neutrons generated through fission to facilitate subsequent fission),coolants (fluid used to remove heat generated by fission from reactor core) and light water (normal water).There are two types of light water reactor, (1) the Boiling Water Reactor (BWR) and (2) the Pressurized WaterReactor (PWR), with both reactor types in equal use in Japan. BWR is a method in which steam generatedinside the reactor is sent directly to the turbine. After turning the turbine, the steam is cooled in a condenser,reduced to water, and then returned to the reactor. On the other hand, the PWR method sends hot watergenerated in the reactor to a steam generator, where this water converts water running in a separate system tosteam, which is then used to turn turbines.
(4) Solar Power Generation
This is a power generation method that utilizes solar batteries (photoelectric cells), which produce electricitywhen exposed to light. While this energy source is “clean” and inexhaustible, it requires vast surface area togenerate large amounts of power, is subject to the weather, and cannot be utilized at night. Japan leads theworld in the implementation of solar power generation, and although there are still many problems to solve,the use of solar power as a distributed power source is increasing.
(5) Wind Power Generation
This method generates electricity by utilizing wind to turn windmills, which turn generators. Since the OilCrisis of 1973, wind power generation gained prominence throughout the world, especially in the U.S. andCanada, as the new energy to replace oil. The low energy density of wind, the high-energy fluctuation, andissues concerning durability and reliability due to the severe climate in locations in Japan applicable for windpower generation, remain to be solved.
(6) Geothermal Power Generation
Geothermal power generation is a method that generates electricity by turning turbines using steam generatedunderground. According to no fuel costs, the high operating rate and a cheap and safe energy source, it hasalready been industrialized. Problems with this method include difficulties in constructing high capacitypower plants, plant sites limited to volcanic zones, and the high cost and time involved in investigatingsuitable sites.

- 67 -
(7) Biomass Power Generation
Through thermochemical conversion such as direct combustion and gasification, or biochemical conversionsuch as CH4 fermentation, biomass energy is converted into steam or gas and used to generate electricity. Theformer mainly uses dry biomass such as wood and rice straw, while the latter uses wet biomass such aslivestock waste, raw garbage and sewage sludge. For the power generation method, steam turbines, gasturbines and gas engines are used.For direct combustion-steam turbine power generation, biomass is burned directly in a boiler and the resultingsteam is used to turn a turbine and generate electricity. This method is currently the most common.Stoker and fluid bed furnaces are commonly used direct combustion furnaces. Problems with biomass powergeneration using steam turbines include low generating efficiency.Gasification-gas turbine power generation exhibits higher generating efficiency in comparison to steamturbine power generation, and with the advantage of requiring smaller initial investment, this method isdrawing attention as the biomass power generation method of the near future. In addition, since gas turbinepower generation exhibits high efficiency even on a small scale, it is an effective system for distributed powergeneration, such as biomass power generation.CH4 fermentation-gas engine power generation generates power through gas engines which use gas obtainedfrom the CH4 fermentation of animal manure, raw garbage, sewage sludge, and so on (generally CH4: 60-70%,CO2: 30-40%). Rather than energy use, the main objectives are related to control of waste processingproblems such as bad smells and landfill site acquisition, and the inhibition of CH4, a greenhouse gas, and ingeneral the scale of individual plants is small. When considering energy use as the main objective, problemssuch as lengthy fermentation time are apparent.
Furthermore, for considerations of energy efficiency during power generation in this study, the effects ofpower conversion are treated as virtually non-existent in relation to hydroelectric, solar, wind and geothermalpower generation, and efficiency is considered only in terms of the power generated. Consequently,calculations conducted here are for energy consumption, GHG emissions and energy efficiency over thelifecycle, from extraction of feedstock to power generation, in relation to all types of thermal, nuclear andbiomass power generation.
Descriptions of the above power generation methods are from The Federation of Electric Power Companiesof Japan website (http://www.fepc.or.jp/hatsuden/index.html) and Saka [2001].

- 68 -
2.6.2 Procedures for data collection of unit process
Power generation pathway flow examined in this study are shown in Figure 2.6.1:
Figure 2.6.1 Pathway flow for power generation
(1) Petroleum Fired Thermal Power Generation
<i> Existing Study
IAE [1990] (p.144) calculates CO2 emissions for the power generation stages based on the FY1988 annualaverage values for generating efficiency (38.84%), power distribution efficiency (37.18%) and in-house ratio(4.27%).CRIEPI [1991] (p. 19-27) calculates the energy input and energy balance of petroleum fired thermal powergeneration, assuming values for petroleum fired plant capacity (generating end output) at 1,000 MW,capability factor 75 %, generating efficiency (generating end) 39 % and in-house ratio 6.1 %. Although thelater studies implemented by CRIEPI (CRIEPI [1992], [1995]) have some adjustments, they are based on datagiven in CRIEPI [1991]. In addition, CRIEPI [2000] re-estimates GHG emissions over the lifecycle ofpetroleum fired power generation technology using technology and import conditions of power generationfuels for 1996 as a point of reference. All studies conducted by CRIEPI consider not only the fuel lifecycle,but also construction of power plant and so on.
UF6
(enriched)Mining
/ refining U3O8
Overseastransportation
(land)Fluorination Enrichment
Overseastransportation
(land)
Overseastransportation
(sea/land)
FuelAssembly
Re-conversion/ fabrication
Nuclear powergeneration
SFstorage
ElectricityDomestic
transportation(land)
(electric vehicle)
UF6
from crude oilextraction process Crude oil
Overseastransportation
(sea)
Thermal powergeneration
(crude)Electricity (electric vehicle)
from petroleum refineryprocess (domestic)
Heavy fuel oilDomestic
transportation(sea)
Thermal powergeneration
(HFO)Electricity (electric vehicle)
from raw natural gasprocessing and liquefaction
process (overseas)LNG
Thermal powergeneration
(LNG)Electricity (electric vehicle)
Overseastransportation
(sea)
CoalOverseas
transportation(sea/land)
Thermal powergeneration
(coal)
Coal ashlandfilling
Electricity (electric vehicle)
Open pitmining
Undergroundmining
coalwashing
Domestictransportation
(recovery)
Powergeneration
Electricity (electric vehicle)Waste wood

- 69 -
<ii> This Study
[Overseas transportation (sea)]
Regarding overseas transportation (sea) of crude for power generation, calculation results given in “2.1Petroleum Based Fuel Production Pathways” are used.
[Domestic transportation]
Regarding the domestic transportation of heavy fuel oils, calculation results given in “2.1 Petroleum BasedFuel Production Pathways” are used.
[Petroleum fired thermal power generation]
Petroleum fired thermal power plant energy consumption and GHG emissions (based on sending end) werecalculated based on year 2000 actual values for fuel consumption, generating end heat efficiency, in-houseratio, power generation (sending end, receiving end), distribution loss ratio and distribution loss, given inANRE [2002-3] for petroleum fired thermal power plants.Other than the above, with regards to the operating process of petroleum fired power plants, CRIEPI [2000](p.26) also calculates consumption of limestone and ammonia required for desulfurization and denitration.This study also follows this example. Inventory data for limestone and ammonia production is cited fromNEDO [1995] (p.130). This inventory data was researched and created by National Institute for Resourcesand Environment (current National Institute of Advanced Industrial Science and Technology), a subordinatebody of the Agency of Industrial Science and Technology.
(2) LNG Fired and LNG Combined Cycle Thermal Power Generation
<i> Existing Study
IAE [1990] (p.145-146) calculates CO2 emissions for the power generation stages based on the FY1988annual average values for generating efficiency (LNG: 39.29 %, LNG combined cycle 42.42 %), powerdistribution efficiency (LNG: 37.82 %, LNG combined cycle: 41.38 %) and in-house ratio (LNG: 3.75 %,LNG combined cycle: 2.45 %).CRIEPI [1991] (p.27-31) calculates the energy input and energy balance of LNG fired thermal powergeneration, assuming values for LNG fired plant capacity (generating end output) at 1,000 MW, capabilityfactor 75 %, generating efficiency (generating end) 39 % and in-house ratio 3.5 %. Although the later studiesimplemented by CRIEPI (CRIEPI [1992], [1995]) have some adjustments, they are based on data given inCRIEPI [1991]. In addition, CRIEPI [2000] re-estimates GHG emissions over the lifecycle of LNG firedpower generation technology using technology and import conditions of power generation fuels for FY1996as a point of reference. All studies conducted by CRIEPI consider not only the fuel lifecycle, but alsoconstruction of power plant and so on.
<ii> This Study
[Overseas transportation (sea)]

- 70 -
Regarding overseas transportation (sea) of LNG for power generation, calculation results given in “2.2Natural Gas Based Fuel Production Pathways” are used.
[LNG fired and LNG combined cycle thermal power generation]
LNG fired and LNG combined cycle thermal power plant energy consumption and GHG emissions (based onsending end) were calculated based on FY2000 actual values for fuel consumption, generating end heatefficiency, in-house ratio, power generation (sending end, receiving end), distribution loss ratio anddistribution loss, given in ANRE [2002-3] for LNG fired and LNG combined cycle thermal power plants.In addition, as with petroleum fired thermal power generation, regarding the operating process of LNG firedand LNG combined cycle thermal power plants, CRIEPI [2000] (p.26) calculates consumption of limestoneand ammonia required for desulfurization and denitration. This study also follows this example.
(3) Coal Fired Thermal Power Generation
<i> Existing Study
IAE [1990] (p.147) calculates CO2 emissions for the power generation stages based on the FY1988 annualaverage values for generating efficiency (39.37 %), power distribution efficiency (36.26 %) and in-house ratio(7.96 %).CRIEPI [1991] (p.11-19) calculates the energy input and energy balance of coal fired thermal powergeneration, assuming values for coal fired plant capacity (generating end output) at 1,000 MW, capabilityfactor 75 %, generating efficiency (generating end) 39 % and in-house ratio 7.4 %. Although the later studiesimplemented by CRIEPI (CRIEPI [1992], [1995]) have some adjustments, they are based on data given inCRIEPI [1991]. In addition, CRIEPI [2000] re-estimates GHG emissions over the lifecycle of coal firedpower generation technology using technology and import conditions of power generation fuels for 1996 as apoint of reference. All studies conducted by CRIEPI consider not only the fuel lifecycle, but also constructionof power plant and so on.
<ii> This Study
[Coal mining / washing]
As data obtained through hearing surveys with industry related to the coal mining process, Hondo et al.[1999] gives figures for fuel input (diesel, gasoline, electricity) per unit weight during coal mining and coalwashing for open-pit and underground coal mining in Australia, and calculates environmental burden for theentire lifecycle of imported coal for power generation consumed in Japan. These values are also used inCRIEPI [2000] (p.19).In this study also, energy consumption and GHG emissions were calculated for the extraction process andwashing process of imported coal based on data given in Hondo et al. [1999], the extraction method at theimported coal source and actual import volumes. Furthermore, regarding energy consumption and CO2
emission factors during power generation in each country, data reflecting the power generation circumstancesof each was created and applied.Regarding CH4 vent, values per country were taken from IEEJ [1999] (p.13) and the weighted average wascalculated using import volumes given in ANRE [2002-1].

- 71 -
[Overseas transportation (land / sea)]
Regarding overland transportation of coal at the producing region, both IEEJ [1999] (p.6) and CRIEPI [2000](p.17) conduct calculations on the assumption that all transportation of coal for export from the producingregion to the shipping port takes place via rail. In addition, although there are various electrificationconditions concerning the railways of each country, the use of diesel engines is assumed, and consequently thefuel consumed is diesel. Regarding fuel consumption factor, values given in Ministry of Transport (MOT)Transport Policy Bureau [2000] are used.This study also adopted the same calculation methods used in prior studies. The overland transportationdistances in the producing country were taken from values (one-way) given in IEEJ [1999] (p.12). Energyconsumption and GHG emissions for the overland transportation of coal in the producing country werecalculated using the weighted average of these values multiplied by fuel consumption factor (0.0126 L/t-km),and import volumes given in ANRE [2002-1].Regarding the overseas transportation (sea) of coal, energy consumption and GHG emissions for the overseastransportation of coal was calculated using values taken from NEDO [1996] (p.105-106) for average vesselsize for transportation (50,000 t deadweight tonnage), speed (15 knots) and fuel consumption (60 kg-C-heavyfuel oil/km), and import volume and distance from port of shipment to Japan. In addition, regarding loadingand unloading (energy consumption through handling), values given in IAE [1990] (p.138) were used.Although the values given here are for electricity consumption (0.95 kWh/t) per t coal at Tomakomai Port,Hokkaido, since there is generally little difference in energy consumption through handling for either loadingor unloading (IAE [1990]), this study substitutes values for energy consumption per t coal at Tomakomai Portfor energy consumption at the port of shipment for each country.
[Coal fired thermal power generation]
Coal fired thermal power plant energy consumption and GHG emissions (based on sending end) werecalculated based on year 2000 actual values for fuel consumption, generating end heat efficiency, in-houseratio, power generation (sending end, receiving end), distribution loss ratio and distribution loss, given inANRE [2002-3] for coal fired thermal power plants.As with other forms of thermal power generation, regarding the operating process of coal fired thermal powerplants, CRIEPI [2000] (p.26) calculates consumption of limestone and ammonia required for desulfurizationand denitration. This study also follows this example.
[Coal ash landfilling]
CRIEPI [2000] (p.27) calculates energy consumption required for coal ash landfilling from data obtainedthrough hearing surveys with related industry. This study also follows this example.
(4) Nuclear Power Generation
<i> Existing Study
CRIEPI [1991] (p.31-36) conducts calculations for PWR light water reactors assuming plant capacity at 1,000MW, capability factor 75 %, and in-house ratio 3.4 %. Furthermore, regarding data from each process, from

- 72 -
uranium extraction to enrichment, shaping and transportation, as no publicly disclosed data was available inJapan, U.S. data (Asad T. Amr [1981]) has been used for reference.CRIEPI [2000] (p. 27-32) conducts calculations for the nuclear fuel production process using Institute forPolicy Sciences (IPS) [1977], and calculations for the power generation process (plant operation), energyconsumption per unit power generation, based on average values of eight power plants obtained throughhearing surveys conducted with electricity companies. However, as some data could not be obtained inrelation to uranium enrichment for nuclear power generation, analysis has been conducted under theassumption that all enrichment will be conducted in the U.S. using the gas diffusion method. In addition,power generation systems, which reprocess spent fuel and use the resultant MOX fuel, have not beenconsidered.Consequently, CRIEPI [2001], released the following year, uses data that more accurately reflects actualstatus concerning uranium enrichment, and provides analyses of CO2 emissions over the nuclear powergeneration lifecycle that reflects actual status in Japan. Furthermore, analysis is also provided concerning thepossible effects the nuclear fuel cycle currently being planned in Japan may have on CO2 emissions over theentire lifecycle.Furthermore, all the above CRIEPI studies consider not only the fuel lifecycle, but also construction of powerplant and so on.
<ii> This Study
In principle, this study used CRIEPI [2001] for reference. However, in order to be consistent with other fuelproduction pathways, power plant construction and so on, was excluded from evaluation. In addition, only thebasic BWR and PWR systems were considered, and recycling systems that use MOX fuel produced fromreprocessed spent nuclear fuel are also excluded from evaluation.
[Mining / Refining]
Annual energy consumption and data per kWh were calculated based on data for nuclear fuel requirementsand energy consumption for the production of 1 t-U yellow cake. Uranium ore mining is assumed to be at5,000 t-ore per day through open-pit mining. In relation to refining, considerations are for facilities with anannual yellow cake production capacity of 1,350 t-U and a serviceable life of thirty years. The data is fromIPS [1977].
[Conversion (Fluorination)]
Annual energy consumption and data per kWh were calculated based on data for resource requirements andenergy consumption for the production of 1 t-U UF6. Considerations are for facilities with an annual UF6
production capacity of 5,000 t-U and a serviceable life of thirty years. The data is from IPS [1977].
[Enrichment]
Enrichment methods taken into consideration are the gas diffusion method (overseas) and the centrifugalseparation method (domestic and overseas).

- 73 -
Gas diffusion facilities (overseas) with a production capacity of 8,750 t-SWU4/year and serviceable life of 30years, centrifugal separation facilities (domestic) with a production capacity of 600 t-SWU/year andserviceable life of 40 years, and centrifugal separation facilities (overseas) with a production capacity of 1,000t-SWU/year and serviceable life of 30 years, are considered. According to CRIEPI [2001], basic data for gasdiffusion (overseas) and centrifugal separation (overseas) is from IPS [1977], while basic data for centrifugalseparation (domestic) is taken from internal papers of the Tokyo Electric Power Company (TEPCO)Energy/Environment Technology Research Institute.Annual consumption and data per kWh were calculated based on data for resource requirements and energyconsumption to produce 1 t-U of enriched UF6.
[Re-conversion / Fabrication]
Annual consumption and data per kWh were calculated based on data for resource requirements and energyconsumption to produce 1 t-U of fuel assembly. Considerations are for facilities with an annual productioncapacity of 900 t-U and a serviceable life of 30 years. The data is generally cited from IPS [1977].
[Domestic transportation (sea)]
Although CRIEPI [2000] calculates data for each transportation process, this study cites aggregate data givenin CRIEPI [2001].
[Power generation]
Nuclear fuel requirements for 1 year were estimated using the following formula (CRIEPI [2000] (p.28)).
[Nuclear Fuel Consumption]= [Generating Capacity] * 365 * [Capability factor] / ([Combustion degree] * [Heat Efficiency])
Energy consumption and GHG emissions were calculated from fuel consumption for supplementary boilersused for power plant heating and so on. These are average values of eight power plants obtained throughhearing surveys conducted with electricity companies.
[Storage of spent fuel assembly]
Data per kWh was calculated based on energy consumption data for the storage of one BWR spent fuelassembly for one year. Here, data given in CRIEPI [2001] for naturally ventilated facilities with dry caskstorage capacity of 860 assemblies of 8 * 8 fuel is cited as given, with calculations conducted for a 50-year-storage term. Data for the interim storage of spent fuel was sourced from TEPCO Energy/EnvironmentTechnology Research Institute internal papers.On the other hand, regarding PWR, CRIEPI [2001] cites BWR data, as data for the long-term interim storageof spent PWR fuel was not available. Consequently, this study has also adopted this method.
4 Separative Work Unit

- 74 -
(5) Biomass Power Generation (Direct combustion-steam turbine power generation)
<i> Existing Study
Although biomass comes in a variety of forms such as raw garbage and woody biomass, power generationthrough incineration has long since been implemented for municipal waste containing raw garbage. HokkaidoUniversity Graduate School of Engineering [1998] conducts a life cycle analysis of municipal wasteincineration power plants. Regarding woody biomass studied in this study, Ohki et al. [2002] provides dataconcerning woodchip fired boiler power generation currently implemented or planned in Japan.
<ii> This Study
Calculations in this study are based on Ohki et al. [2002]. As biomass power plants normally operate usingpart of the power generated from biomass for in-house power, all plant operating energy is derived frombiomass, and therefore CO2 emissions derived from fossil fuels can be treated as zero. However, as the plantconsumes chemicals for exhaust gas treatment, calculations include energy required for the production ofthese chemicals.
(6) Biomass Power Generation (Gasification-gas turbine power generation)
<i> Existing Study
The power generation system considered here is the IGCC system (combination of gas turbine powergeneration and boiler power generation from exhaust heat), which generates electricity using syngas obtainedthrough the gasification of biomass. Regarding municipal waste including raw garbage, although manydomestic furnace makers have developed gasification melting power generation systems, since the majority ofthese involve normal boiler power generation without gas turbines, they are not included in the gasificationpower generation of prior studies mentioned here. Mann, M.K., et al. [1997] uses a simulation to provide alife cycle analysis of woody biomass (hybrid poplar) gasification power generation. Details of actualgasification power plants are given in Krister Ståhl, et al. [2000]. This report provides general data (e.g.generating efficiency) for a gasification power plant using woody biomass currently in operation in Varnamo,Sweden.
<ii> This Study
Calculations in this study are based on Mann, M.K., et al. [1997] (p.21), which contains all the necessary data.Although the majority of energy consumed can be attributed to power for operation, as all this power isgenerated in-house through biomass, CO2 emissions derived from fossil fuels can be treated as zero. Inaddition, as exhaust gas treatment only involves dust in the exhaust gas, the use of chemicals is not considered.Krister Ståhl, et al. [2000] gives a figure of 32 % for generating efficiency (net), which is generally in thesame range as Mann, M.K. et al. [1997].

- 75 -
(7) Biomass Power Generation (CH4 fermentation-gas engine power generation)
<i> Existing Study
Operational data for actual gas engine power plants using digestion gas obtained through CH4 fermentation(gas containing CH4 gas) are given in Ogawa et al. [2003]. The plant generates 3,200 kWh/day through theCH4 fermentation of livestock manure, bean curd lees and sewage sludge from in-house wastewaterprocessing facilities.Facilities which compost dehydrated cake remaining after CH4 fermentation are also included.
<ii> This Study
Calculations in this study are based on Ogawa et al. [2003], which provides detailed data on actual operations.Power consumed by facilities which compost dehydrated cake remaining after CH4 fermentation is calculatedas beyond the sphere of the system. As previously mentioned, the main raw biomass is livestock manure andbean curd lees, which differs from dry biomass such as wood, in that the water content is extremely high.Consequently, the in-house wastewater treatment load is high, and although the gas engine generatingefficiency is comparatively high at 29 %, the overall generating efficiency of the plant (net) is low.
(8) Distribution Loss
Distribution loss occurring during distribution from large-scale intensive power plants, such as all thermal andnuclear power plants, to consumers, is calculated based on values for power generation at sending end andreceiving end, given in ANRE [2002-1].Furthermore, the same value for distribution loss has been applied to petroleum fired, LNG fired and LNGcombined cycle, coal fired and nuclear power generation.

- 76 -
2.6.3 Calculation results
Regarding electricity (power generation pathway), calculation results for energy consumption, GHGemissions and energy efficiency during 1MJ power generation are shown in Table 2.6.1 (energy consumption),Table 2.6.2 (GHG emissions) and Table 2.6.3 (energy efficiency).
Table 2.6.1 WTT energy consumption of power generation pathways [MJ/MJ]
Table 2.6.2 WTT GHG emissions of power generation pathways [g eq-CO2/MJ]
Table 2.6.3 WTT energy efficiency of power generation pathways (LHV)
Petroleum LNG LNGcombined Coal BWR PWR Direct
combustion GasificationCH4
fermentation Total upstream process 0.181 0.386 0.333 0.115 0.119 0.155 0.506 0.089 0.553 0.259
(Crude oil) (0.031) (0.002) (0.000) (0.002) (Heavy fuel oil) (0.146) (0.006) (0.002) (0.014) (LNG) (0.374) (0.333) (0.099) (Coal) (0.112) (0.016) (Nuclear fuel) (0.119) (0.155) (0.127) (others) (0.004) (0.004) (0.001) (0.001) (0.506) (0.089) (0.553) (0.001)
Fuel combustion (power generation) 1.770 1.527 1.081 1.662 0.002 0.002 5.150 0.761 0.479 1.614 Ash landfilling, SF storage, etc. 0.004 0.004 0.004 Distribution loss
Total 1.951 1.913 1.414 1.777 0.125 0.160 5.656 0.850 1.032 1.877
Thermal Nuclear Biomass Japanaverage
(2000FY)
Petroleum LNG LNGcombined Coal BWR PWR Direct
combustion GasificationCH4
fermentation Total upstream process 12.54 30.25 26.21 21.70 5.72 7.41 45.34 7.97 41.17 18.71
(Crude oil) (2.31) (0.14) (0.01) (0.18) (Heavy fuel oil) (9.96) (0.43) (0.15) (0.93) (LNG) (29.44) (26.17) (7.77) (Coal) (21.51) (3.70) (Nuclear fuel) (5.72) (7.41) (6.06) (others) (0.26) (0.25) (0.04) (0.04) (45.34) (7.97) (41.17) (0.08)
Fuel combustion (power generation) 205.13 145.26 117.54 250.89 0.12 0.12 104.20 Ash landfilling, SF storage, etc. 0.01 0.16 0.16 0.15 Distribution loss
Total 217.66 175.51 143.75 272.60 6.00 7.70 45.34 7.97 41.17 123.06
Thermal Nuclear Biomass Japanaverage
(2000FY)
Petroleum LNG LNGcombined Coal BWR PWR Direct
combustion GasificationCH4
fermentation Total upstream process 0.928 0.858 0.858 0.964 ↓ ↓ 0.674 0.921 0.653 0.948
(Crude oil) (0.972) (0.972) (Heavy fuel oil) (0.891) (0.891) (LNG) (0.858) (0.858) (0.858) (Coal) (0.964) (0.964) (Nuclear fuel) ↓ ↓ -
(others) (0.674) (0.921) (0.653) -
Fuel combustion (power generation) 0.402 0.431 0.513 0.417 0.966 0.957 0.145 0.372 0.292 0.383 Ash landfilling, SF storage, etc. 1.000 ↑ ↑ 1.000 Distribution loss 0.959 0.959 0.959 0.959 0.959 0.959 0.959 0.959 0.959 0.959
Total 0.358 0.354 0.422 0.386 0.927 0.918 0.094 0.329 0.183 0.348
Thermal Nuclear Biomass Japanaverage
(2000FY)

- 77 -
2.7 Hydrogen Production Pathways
2.7.1 Abstract
Hydrogen is a nonmetallic element, atomic number 1, represented by the atomic symbol “H”. It is the lightestand most common element in the universe and exists profusely in water, organic compounds and life forms.Hydrogen is colorless, odorless and highly combustible. Lately, from the global environment perspective,hydrogen energy, which produces only water on combustion, is drawing attention.Various supply and production methods have been proposed concerning the supply of hydrogen as anautomotive fuel for FCVs.
(1) Hydrogen Production by Stream Reforming
Steam reforming is a method in which steam is added to a hydrocarbon feedstock to promote a reformingreaction and produce a syngas containing hydrogen.Promising feedstock for steam reforming include methanol, city gas (natural gas), LNG, LPG, desulfurizedgasoline and so on, and a field test of a refueling station for hydrogen from reformed natural gas has beenconducted (NEDO [2001-2]).
(2) Byproduct Hydrogen
Byproduct hydrogen refers to hydrogen that is obtained as a byproduct of another process. Byproducthydrogen can be broadly classified into three categories:
・ Hydrogen from salt electrolysis: Hydrogen that is produced during the electrolysis of industrial salt toproduce caustic soda. Hydrogen refueling stations providing salt electrolysis hydrogen are already inoperation
・ Hydrogen from coke oven gas refining: Hydrogen contained in coke oven gas produced during thecarbonization of coal to produce coke for the iron and steel industry
・ Hydrogen from petroleum industry: Hydrogen produced for the hydrogenation process through thesteam reforming, partial oxidization and so on, of naphtha (although not strictly a byproduct, surplusproduction can occur and is therefore classified as byproduct hydrogen)
Figure 2.7.1. shows the domestic production capability and supply capacity of each byproduct hydrogencategory.
Figure 2.7.1 Domestic production capability and supply availability of byproduct hydrogen
Domestic hydrogen production ability : 238,3 [108Nm3/year] (NEDO [2001-1])
from salt electrolysis 13.6 [108Nm3/year] from coke oven gas refining 88.7 [108Nm3/year] from petroleum industry 136.0 [108Nm3/year]
Domestic hydrogen supply ability : 92.7 [108Nm3/year] (NEDO [2001-1])
from salt electrolysis 12.4 [108Nm3/year] * value taken sold hydrogen from hydrogen production calculated from caustic soda production
from petroleum industry 27.1[108Nm3/year] * hydrogen from surplus production of facilities
from coke oven gas refining 53.2 [108Nm3/year] * 60% recover rate is considered as supply ability

- 78 -
(3) Hydrogen Production by Water Electrolysis
Water electrolysis is a method of producing hydrogen through the electrolysis of water. The electrolysisefficiency of the solid polymer electrolyte membrane, also used in fuel cells, is drawing attention, and a fieldtest for a solid polymer electrolyte membrane electrolysis-hydrogen refueling station has been conducted(NEDO [2001-1]). In addition, through the development of a reversible cell, namely an electrolysis cell thatcan function as a fuel cell, an attempt has been made, by the solid polymer electrolyte membrane electrolysis-hydrogen refueling station, to generate the additional value of power load equalization through hydrogenproduction using surplus power (IAE [2002]).
Other methods include the thermolysis (IS Process) process, currently being researched by the Japan AtomicEnergy Research Institute (JAERI) from the perspective of utilizing heat supplied from high temperature gasreactors.
※ Properties of hydrogenThe properties of hydrogen applied in this study are as follows.
[Source] http://www.enaa.or.jp/WE-NET/phs/butsu.html
Chemical symbol HAtomic weight 1.00794 - Explosive limit (air mixture, 20℃, 1atm) 4~75 %Molecular weight 2.0158 - Spontaneous ignition temperature (air mixture, 1atm) 570 ℃Density at normal condition 0.08989 kg/m3 Explosive limit (oxygen mixture, 20℃, 1atm) 4~94 %
Spontaneous ignition temperature (oxygen mixture, 20℃, 1atm) 560 ℃13.803 K Minimum ignition energy 0.02 mJ
-259.347 ℃ Quenching distance (atmospheric, 1atm, normal temperature) 0.06 cm Pressure 0.0704 bar Theoretic air/fuel weight ratio 34.3 - Solid staturation density 86.48 kg/m3 Diffusion coefficient (atmospheric, 0℃, 1atm) 0.611 m2/s Liquid staturation density 77.019 kg/m3 Higher heating value (0℃, 1atm) 12,790 kJ/m3
Gas staturation density 0.1256 kg/m3 Lower heating value (0℃, 1atm) 10,780 kJ/m3
Latent heat of fusion 58.2 kJ/kg Latent heat of evaporation 449 kJ/kg H2O (gaseous) -241.82 kJ/mol
H 217.97 kJ/mol20.268 K H2 0 kJ/mol
-252.882 ℃ O2 0 kJ/mol Latent heat of evaporaion 446 kJ/kg Liquid saturation density 70.779 kg/m3 H2O (gaseous) -228.59 kJ/mol Gas saturation density 1.3378 kg/m3 H 203.26 kJ/mol
H2 0 kJ/mol32.976 K O2 0 kJ/mol
-240.174 ℃ Pressure 12.928 bar H2O (gaseous) 188.72 J/mol/K Density 31.426 kg/m3 H 114.6 J/mol/K
H2 130.57 J/mol/K H (protium) 99.9885 % O2 205.03 J/mol/K D (deuterium) 0.0115 %
Standard enthalpy of formation (25℃, 1atm)
[Stable isotope (natural content)]
[Explosive combustion]
[Triple point]
[Boiling point at atmospheric pressure]
Standard Gibbs energy of formation (25℃, 1atm)
[Critical point]
Standard entropy of formation (25℃, 1atm)
Temperature
Temperature
Temperature

- 79 -
2.7.2 Procedures for data collection of unit process
Hydrogen production pathway flow examined in this study are shown in Figure 2.7.2 (onsite) and Figure 2.7.3(offsite):
Figure 2.7.2 Pathway flow for on-site hydrogen production
Figure 2.7.3 Pathway flow for off-site hydrogen production
The data calculation for the processes that compose these pathways are organized into (1) hydrogenproduction, (<i> steam reforming ((A) city gas reforming, (B) naphtha reforming, (C) methanol reforming,(D) gasoline reforming, (E) LPG reforming, (F) DME reforming, (G) reforming of kerosene and FT syntheticoil), <ii> coke oven gas (COG) refining, <iii> salt electrolysis, <iv> water electrolysis ((A) solid polymerelectrolysis, (B) pure water electrolysis, (C) alkali water electrolysis, (D) packaged water electrolysis, (E)
(fuel cell vehicle) (fuel cell hybrid vehicle)
(fuel cell vehicle) (fuel cell hybrid vehicle)
from petroleum refineryprocess (domestic) Naphtha Gasification PSA HydrogenDesulfurization
/ reforming
Salt electrolysis(hydrogen by-product)
Hydrogen
COG refining(hydrogen by-product) Hydrogen
Compression Hydrogen(20MPa)
Domestictransportation
(land)
Gasification/ fueling to vehicles
Fueling to vehiclesas liquid
Strage atrefueling station
as liquid
MethaneFermentation
Hydrogen
Hydrogen(40MPa)
Compression atrefuelingstation
(fuel cell vehicle) (fuel cell hybrid vehicle)
Fueling tovehicles
Liquefaction HydrogenDomestic
transportation(land)
from pipelinetransportation process
(Raw natural gas)Raw natural gas PSA Hydrogenreforming
from domestictransportation process
(kerosene)Kerosene Gasification PSA Hydrogen
(fuel cell vehicle) (fuel cell hybrid vehicle)
Desulfurization/ reforming
from city gasdistribution process City gas PSA HydrogenDesulfurization
/ reforming
from domestictransportation process
(FT synthetic oil)FT synthetic oil PSA HydrogenReformingGasification
from domestictransportation process
(DME)DME PSA HydrogenReformingGasification
from domestictransportation process
(methanol)Methanol PSAReformingGasification
from domestictransportation process
(LPG)LPG PSA Hydrogen
Desulfurization/ reforming
Pure waterelectrolysis
Hydrogen
Hydrogen
Compression atrefuelingstation
Hydrogen(40MPa)
Fueling tovehicles
Alkaline WaterElectrolysis
Hydrogen
from pipelinetransportation process
(Raw natural gas)Raw natural gas PSA HydrogenReforming

- 80 -
reversible cell pure water electrolysis), <v> CH4 fermentation) + compression for storage & fueling/compression or liquefaction for distribution, (2) transportation (compressed hydrogen transportation, liquefiedhydrogen transportation), (3) storage & fueling.Furthermore, regarding the “heating value of hydrogen supplied to a vehicle” required for energy efficiencycalculations, in this study the FCV fuel tank is taken as the point of transfer of hydrogen, and for compressedhydrogen, the pressure energy required to compress hydrogen to 35 MPa or 40 MPa at 25 degrees C is addedto the heating value of hydrogen at standard atmospheric pressure, as shown below:
Where, : gas constant (8.3151 [Jmol-1K-1]): temperature of hydrogen (298.15 [K]): standard atmospheric pressure (101.325 [kPa]): pressure of gaseous hydrogen (35,000 [kPa])
In addition, as for liquefied hydrogen, as information related to the specific heat for hydrogen at 20 K (gas)could not be obtained, for energy efficiency calculations, the heating value of hydrogen at standardatmospheric pressure was also applied to liquefied hydrogen.
Table 2.7.1 Heating values of compressed hydrogen used in this study
HHV LHV
MJ/kg 142.3 119.9Atmosphericpressure (25℃) MJ/Nm3 12.79 10.78
MJ/kg 148.8 126.420 MPa (25℃)
MJ/Nm3 13.37 11.36
MJ/kg 149.5 127.135 MPa (25℃)
MJ/Nm3 13.44 11.43
MJ/kg 149.6 127.340 MPa (25℃)
MJ/Nm3 13.45 11.44
For energy consumption and GHG emissions calculations for each process from hydrogen production tosupply to vehicle, conversion to energy consumption [MJ] at the point where electricity as energy input isconsumed is calculated as 1 kWh = 3.6 MJ and CO2 emissions are treated as zero, with increases in thesevalues given separately depending on the electricity source (e.g. thermal, nuclear, biomass). This is becausethese values differ according to the electricity source (e.g. thermal, nuclear, biomass).
( )0H2H2 ln PPTREpress ××=
R
H2PH2T
0P

- 81 -
(1) Hydrogen Production + Compression for Storage & Fueling / Compression orLiquefaction for Distribution
<i> Steam Reforming
In many cases, hydrogen production through hydrocarbon reforming consists of the following two processes:
Reformingprocess
・ A process to generate hydrogen by means of reforming reactions such as steamreforming and partial oxidation.
・ This term will comprehend not only reforming reaction itself but also accompanyingreactions such as an aqueous reaction in which byproduct CO generated by reformingreaction is further reformed to hydrogen. (This definition applies to this study.)
Refiningprocess
・ A process to purify hydrogen from hydrogen-contained gas obtained from reformingprocess.
・ Methods to be used for refining process include membrane separation, cryogenicseparation, pressure swing absorption (PSA), and so on.
The source of CO2 emissions generated through hydrocarbon reforming is as follows:
・ CO2 derived from fuel (fossil fuel, electricity)・ CO2 derived from feedstock (hydrocarbons)
CO2 derived from feedstock refers to the carbon content discharged as CO2 from the hydrocarbon used ashydrogen feedstock. In this study, calculations for CO2 emissions from feedstock also use the CO2 emissionfactors during combustion given in Table 1.3. This is because theoretically, all carbon content in thehydrocarbon is converted to CO2 regardless of the applied reforming process, and the resulting CO2 isconsidered to be equivalent to CO2 emissions attributed to the complete combustion of the hydrocarbon.An example is given below.
- Steam reforming:
[reforming reaction] CnHm + nH2O → nCO + (n+m/2) H2
[aqueous reaction] nCO + nH2O → nH2 + nCO2
From hydrocarbon CnHm 1 mol, n mol CO2 is generated. Although there are cases where, after the reformingreaction, part of the gas containing hydrogen (nCO+ (n+m/2) H2) is not directed to the water reaction and isused as fuel for the reforming reaction, in this case also, all CO is converted to CO2 and overall CO2
generation is n mol from CnHm 1 mol.
- Partial oxidation:
[partial oxidation] CnHm + nO2 → nCO2 + m/2 H2
(A) City gas reforming
Prior studies related to hydrogen production through city gas reforming include the “Hydrogen Utilization –International Clean Energy Systems Technology (WE-NET)” conducted by NEDO. Calculations in this studyare also based on WE-NET.Two sets of data are calculated here, current status data based on specifications provided in the feasibilitystudy for a 100 Nm3/h, 300 Nm3/h, 500 Nm3/h class hydrogen station, NEDO [2002-1] (p.17), and updateddata in which improvements in reforming efficiency (70% 80%) shown in NEDO [2003-1] (p. 64-65) are

- 82 -
reflected in the current status data.Regarding the allocation of power consumption other than for reforming/refining, values given in NEDO[2003-1] for a 300 Nm3/h case have been used.City gas input into the process has two different roles, one as the feedstock for hydrogen and the other as theheat source for the reforming reaction, and the ratio between these two roles is reported to be Feedstock: Fuel= 4.2: 0.2 (Tabata [2002]). However, as variations in this ratio may occur due to the size of reformer, and asthe values calculated in this study for energy consumption, GHG emissions and energy efficiency do not vary,the total city gas input is treated as feedstock in this study.Moreover, the properties of the hydrogen produced are 0.8 MPa, purity above 99.99 %, and for impurities,less than 10 ppm CO and less than 100 ppm CO2 (NEDO [2002-1], [2002-2]).
(B) Naphtha reforming
Although much reference data is available for hydrogen production through naphtha reforming, as thismethod was established in the refinery and petrochemical industries long before hydrogen production forFCVs, the availability of reliable data is limited. Of these, this study selected the highly reliable studies ofNakajima et al. [1993], PEC [2003], NEDO [1995] and Japan Hydrogen & Fuel Cell Demonstration Project(JHFC) [2004] for reference.
B-1) Nakajima, et al. [1993]
There is a hydrogen production process using naphtha steam reforming known as the Topsøe method,developed by Denmark’s Haldor Topsøe A/S. The company that the authors of this report belong to, theChiyoda Corporation, had already established 20 facilities using this method in Japan and 5 facilities abroadby 1991. At the time, there were 136 such facilities worldwide.
B-2) PEC [2003]
This refers to a case where the PSA process was added on to the petrochemical industry’s 1 million Nm3/dayclass hydrogen production device.Preconditions for inventory data calculation are taken from feedstock and utilities data for the hydrogenproduction device given in PEC [2003].
B-3) NEDO [1995]
While the process in Nakajima et al. [1993] and PEC [2003] obtains hydrogen through PSA refining afternaphtha steam reforming, the process in NEDO [1995] obtains hydrogen through the partial oxidization ofnaphtha and aqueous reaction. Although the data in NEDO [1995] pertains to the hydrogen productionprocess in oil refineries and petrochemical plants, there is also a statement saying “this data was createdthrough surveys as publications regarding the production of hydrogen could not be obtained”, and it is unclearwhether the given values are from hearing surveys or from calculations based on assumptions.
B-4) JHFC [2004]

- 83 -
JHFC [2004] (p. 35-36) provides field test results for the Yokohama-Asahi Hydrogen Station. Calculationshere are based on data for 50 Nm3/h capacity reformers during rated operation.
Figure 2.7.4 Hydrogen production process by NEDO [1995]
(C) Methanol reforming
Regarding hydrogen production through methanol reforming, NEDO [2001-3] provides diagrams and processspecifications in relation to the high-purity hydrogen production method, with an established commercialperformance record, owned by the Mitsubishi Gas Chemical Company, Inc. (MGC). In addition, JHFC [2004]provides field test results for the Kawasaki Hydrogen Station. This study focuses on these two cases.
C-1) NEDO [2001-3]
The MGC has an established commercial performance record for the on-site generation of high-purityhydrogen from methanol, using a combination of steam reforming and PSA.Methanol steam reforming is conducted in a cracking reactor at an ambient temperature of 240-290 degrees Cin the presence of a copper based catalyst. Steam is removed from the resulting hydrogen compound gas usingcoolers and steam-water separators, and the gas is refined into high-purity hydrogen gas through PSAseparation/refining apparatus.Pre-conditions for inventory data calculation are taken from high-purity hydrogen production processspecifications given in NEDO [2001-3] (p. II-32).
C-2) JHFC [2004]
JHFC [2004] (p.37-38) provides field test results for the Kawasaki Hydrogen Station. Calculations here arebased on data for 50 Nm3/h capacity reformers during rated operation.
(D) Gasoline reforming
Regarding hydrogen production through gasoline reforming, JHFC [2004] (p.34-35) provides field test resultsfor desulfurized gasoline at the Yokohama-Daikoku Hydrogen Station. Calculations here are based on data for30 Nm3/h capacity reformers during rated operation
HydrogenProduction
(Feedstock)Naphtha 0.333 kg
H2 1 m3
Steam 0.68 kg
(Emissions) CO2 0.700 kg
NOx 0.00017 kg
waste water 0.03 kg
(Supply)Electricity 0.013 kWh

- 84 -
(E) LPG reforming
Regarding hydrogen production through LPG reforming, NEDO [2001-3] provides examples of trialcalculations made by applying the naphtha reforming model of Nakajima et al. [1993] to LPG. In addition,JHFC [2004] provides field test results for the Senju Hydrogen Station, Tokyo. This study focuses on thesetwo cases.
E-1) NEDO [2001-3]
NEDO [2001-3] (p.II-31) conducts trial calculations for energy balance (desk study) when the naphthareforming model of Nakajima et al. [1993] is applied to LPG.
E-2) JHFC [2004]
JHFC [2004] (p.36-37) provides field test results for the Senju Hydrogen Station. Calculations here are basedon data for 50 Nm3/h capacity reformers during rated operation.
(F) DME reforming
The hydrogen production system through DME reforming given in NEDO [2001-3] (p.Ⅱ -33) isfundamentally the same as the methanol fueled system, and assumes a steam reforming reaction taking placein the presence of a catalyst at temperatures between 250-450 degrees C.NEDO [2001-3] estimates DME reforming efficiency based on these assumptions. Specifically, based onreference materials related to the methanol reforming hydrogen production device of MGC mentioned in C-1)of this study, the material balance for the DME steam reforming reaction is estimated, and reformingefficiency is also assessed through trial calculations per unit utility. Here, DME reactivity (excludingtemperature) and PSA hydrogen separation efficiency is considered equivalent to a methanol plant.
(G) Kerosene / FT synthetic oil reforming
Data related to hydrogen production through the reforming of kerosene and FT synthetic oil could not beobtained for this study. Consequently, using data related to hydrogen production through the reforming ofnaphtha and desulfurized gasoline, given in JHFC [2004] for reference, resources required for the productionof 1 kg hydrogen were assumed to be 4.8 kg kerosene or FT synthetic oil, and 7 kWh electricity.
<ii> Hydrogen Production through COG Refining
Other than hydrogen, rest gas (fuel gas that does not contain hydrogen) is produced during the separation andrefining process. Hydrogen can also be recovered from byproduct gases such as coke oven gas (COG), blastfurnace gas (BFG) and Linz-Donawitz converter gas (LDG), produced in new iron and steel manufacturingprocesses. Of these, COG has the highest hydrogen ratio.COG contains more than 50 % hydrogen, and high purity hydrogen can be recovered with ease following theremoval of impurities and PSA refining. Regarding hydrogen production through COG refining, this study

- 85 -
calculates energy consumption and GHG emissions based on data given in NEDO [2002-1]. Although datarelated to hydrogen production through COG refining is also given in PEC [2003], the source for this data isNEDO [2002-1], and the two are basically the same. Furthermore, this study does not take energyconsumption and GHG emissions during the production of the COG feedstock into consideration.In the process of hydrogen production through COG refining, other than hydrogen, REST gas (fuel gas thatdoes not contain hydrogen) is produced during the PSA separation and refining of hydrogen contained in theCOG. Although NEDO [2002-1] (p.10) provides specifications for five cases of average hydrogen productioncapacity (556 Nm3/h, 1,669 Nm3/h, 5,562 Nm3/h, 16,685 Nm3/h, 55,617 Nm3/h), as the feedstock / utilityconsumption for 16,685 Nm3/h and 55,617 Nm3/h is equal to that of 5,562 Nm3/h, these have been omittedfrom this study.
<iii> Hydrogen Derived from Caustic Soda Production through Salt Electrolysis
One method of hydrogen supply involves the utilization of byproduct hydrogen derived from caustic sodaproduction through salt electrolysis. As the main objective of this process is the production of caustic soda,the environmental burden generated here is considered non-attributable to hydrogen. However, in cases wherethis hydrogen is already utilized as a heat source, as extra energy will be required to supplement this usage,usage of byproduct hydrogen can be misjudged unless some manner of environmental burden is consideredfor byproduct hydrogen.Regarding the salt electrolysis process, data given in Plastic Waste Management Institute (PWMI) [1993] isfrequently cited. By using the product (NaOH, chlorine, hydrogen) weight composition ratio to distributeburden data given in PWMI [1993], it is possible to apportion environmental burden to byproduct hydrogenfrom salt electrolysis, however, for this study, processes related to byproduct hydrogen production throughsalt electrolysis are treated as beyond the sphere of the system.
<iv> Hydrogen Production through Water Electrolysis
Although hydrogen production through water electrolysis is an important industrial hydrogen productionmethod, this method has not gained much attention in Japan, as the production of hydrogen directly fromcarbonaceous fuel resources is cheaper in comparison. However, with the WE-NET concept of hydrogenproduction through water electrolysis using cheap overseas hydroelectric power, this technology has beenreviewed, and technological development in this field is progressing.In this study, energy consumption and GHG emissions calculations regarding hydrogen production throughwater electrolysis are based on specifications for the solid polymer electrolysis hydrogen production devicecurrently marketed by Hitachi Zosen Corporation (HITZ), and data given in NEDO [2003-1] and IAE other[2002].
(A) On-site water electrolysis hydrogen production device (Hitachi Zosen Corporation)
The on-site water electrolysis hydrogen production device of the HITZ is a highly efficient system using asolid polymer water electrolysis cell, which achieves on-site hydrogen production without using any alkalis or

- 86 -
other chemical solutions. There are three levels of hydrogen production capability (0.5 Nm3/h, 1.0 Nm3/h, 3.0Nm3/h) and each is currently marketed. Data calculations are based on the specifications for these waterelectrolysis hydrogen production devices.
(B) Pure water electrolysis hydrogen production device (NEDO [2003-1])
Energy consumption and GHG emissions for hydrogen production through pure water electrolysis arecalculated from data given in NEDO [2003-1]. Although facility scale is from 100-500 Nm3/h, power andutility consumption per unit is fixed.
(C) Alkali water electrolysis hydrogen production device (NEDO [2003-1])
Energy consumption and GHG emissions for hydrogen production through alkali water electrolysis arecalculated from data given in NEDO [2003-1].
(D) Packaged water electrolysis hydrogen production device (NEDO [2003-1])
Energy consumption and GHG emissions for hydrogen production using packaged pure water electrolysis andpackaged alkali water electrolysis devices are calculated from data given in NEDO [2003-1].
(E) Hydrogen production using reversible cell device (IAE [2002])
IAE other [2002] introduces a pure water electrolysis device, which uses reversible cells (reversible cell stackcapable of water electrolysis and fuel cell operation) as a power load equalization system for installation intobuildings. Calculations for energy consumption and GHG emissions for hydrogen production using thisreversible cell were conducted using specification data (calculations based on assumptions) for hydrogen/airsystems provided in IAE other [2002] for reference.
From the above, 4.3-6.2 kWh was derived for energy consumption during the production of 1 Nm3 hydrogen.In general, energy consumption for 1 Nm3 hydrogen through water electrolysis is said to be 4.5-6.2 kWh(Ishiguro [1981]), 4.8-5.3 kWh (Electrochemical Society of Japan (ECSJ) [2000]), and the value indicated in(E) (4.3 kWh) (based on assumption) is an estimated value for ideal conditions. In addition, (A) (5.5-6.0kWh) is for an actual device, and is considered an appropriate value taking into account the comparativelysmall size of the device.
<v> Hydrogen Production through CH4 Fermentation
In this study, hydrogen production through CH4 fermentation is treated as equivalent to hydrogen productionthrough city gas reforming (see “<i> (A) City gas reforming”).
<vi> Compression for Storage & Fueling/ Compression or Liquefaction for Distribution

- 87 -
For hydrogen transportation or supply to FCVs, it is necessary to increase energy density throughcompression or liquefaction. Here, process data is calculated in relation to compression or liquefaction fortransportation purposes when hydrogen is produced off-site.
(A) Compression for distribution (0.8 MPa 19.6 MPa)
Calculations are based on data given in NEDO [2002-1] (p.11) for a 556-55,617 Nm3/h class off-sitehydrogen station. Furthermore, this data is for the transportation process of pure hydrogen, obtained fromCOG refining, for delivery to an off-site hydrogen refueling station as compressed hydrogen.Regarding the pressure of compressed hydrogen, this study uses the value, 19.6 MPa, given in NEDO [2003-1] (p.56).
(B) Liquefaction for distribution (0.8 MPa 0.0708 kg/L)
Calculations are based on data given in NEDO [2002-1] (p.12) for a 556-55,617 Nm3/h class off-sitehydrogen station. Furthermore, this data is for the transportation process of pure hydrogen, obtained fromCOG refining, for delivery to an off-site hydrogen refueling station as liquefied hydrogen.
(2) Transportation (Compressed / Liquefied)
<i> Transportation of Compressed Hydrogen
NEDO [2003-1] (p.56) states, “transportation of compressed hydrogen from an off-site hydrogen productionplant to a station will be in hydrogen trailers carrying multiple long copper containers, towed by a tractor”.According to the same document, for a trailer carrying 22 * 715 L containers, the disposable load is 2,460Nm3/vehicle. This study also uses this data. The tractor fuel consumption value of 3km/L-diesel, given inNEDO [2000] (p.45), was adopted.In addition, assuming transportation to prefectures in the Kanto area, shipping distance was set at a round tripvalue of 100 km.
<ii> Transportation of Liquefied Hydrogen
Calculations for energy consumption and GHG emissions during transportation of liquefied hydrogen arebased on the liquefied hydrogen load value, 14,561 Nm3/vehicle (lorry), given in NEDO [2002-1] (p.15) andthe fuel consumption value, 2.2km/L-diesel (lorry), given in JHFC [2004] (p.90).In addition, assuming transportation to prefectures in the Kanto area, shipping distance was set at a round tripvalue of 100 km.
(3) Storage & Fueling
<i> High Pressure Fueling of Compressed Hydrogen (19.6 MPa)
NEDO [2002-1] (p.16) provides data related to three examples of off-site hydrogen station, 100 Nm3/h, 300

- 88 -
Nm3/h, 500 Nm3/h (high-pressure storage & high-pressure fueling, average 10 MPa 40 MPa), regardingthe further compression of compressed hydrogen shipped by trailer for high-pressure fueling of FCVs. Inaddition, JHFC [2004] (p.38) provides field test results for a mobile hydrogen station (19.6 MPa 35 MPa).For this study, the values given in JHFC [2004], which are close to actual values, were used.
(A) NEDO [2002-1]
The power consumed during high-pressure refueling of compressed hydrogen to a FCV, calculated based onspecifications provided in NEDO [2002-1] (p.16) for high-pressure storage & high-pressure fueling stations,is 0.12-0.15 kWh/Nm3-H2.
(B) JHFC [2004]
Calculations are based on data given in JHFC [2004] (p.38). Here, the pressure of compressed hydrogensupplied to a FCV is 35 MPa.
<ii> High Pressure Fueling of Liquefied Hydrogen (0.0708 kg/L)
In this process, the liquefied hydrogen is stored as liquefied hydrogen and supplied through high-pressurefueling to a FCV as compressed hydrogen (40 MPa). NEDO [2002-1] (p.16) provides data related to threeexamples of off-site hydrogen station, 100 Nm3/h, 300 Nm3/h, 500 Nm3/h (liquefied storage & high-pressurefueling, average 0.0708 kg/L 40 MPa), regarding this process. Here, data calculated based on specificationsfor liquefied storage – high-pressure fueling stations, provided in NEDO [2002-1] (p.16), is used.
<iii> Fueling as Liquefied Hydrogen (0.0708 kg/L)
In this process, the liquefied hydrogen is stored as liquefied hydrogen and supplied to a FCV without changeduring fueling. NEDO [2002-1] (p.17) provides data related to three examples of off-site hydrogen station,100 Nm3/h, 300 Nm3/h, 500 Nm3/h (liquefied storage & liquefied fueling, average 0.0708 kg/L 40 MPa),regarding this process. Here, data calculated based on specifications for liquefied storage & liquefied fuelingstations, provided in NEDO [2002-1] (p.17), is used.

- 89 -
2.7.3 Calculation results
The calculation results for hydrogen production pathways are indicated separately for on-site (hydrocarbonreforming, on-site water electrolysis) and off-site (compressed hydrogen transportation compressedhydrogen fueling, liquefied hydrogen transportation compressed hydrogen fueling, liquefied hydrogentransportation liquefied hydrogen fueling).Regarding the no-site hydrocarbon reforming, the results of calculations for energy consumption, GHGemissions and energy efficiency during production of 1 MJ petroleum products are shown in Table 2.7.2(energy consumption), Table 2.7.3 (GHG emissions) and Table 2.7.4 (energy efficiency).
Table 2.7.2(A) WTT energy consumption of hydrogen production pathways [MJ/MJ] (on-site hydrocarbon reforming (city gas, petroleum products))
Table 2.7.2(B) WTT energy consumption of hydrogen production pathways [MJ/MJ](on-site hydrocarbon reforming (synthetic fuels))
(best) (worst) (best) (worst) (best) (worst) (best) (worst) Feedstock production 0.97 1.70 2.04 1.85 2.33 0.58 1.07 0.56 0.79 0.70 1.32 Hydrogen production (reforming) 0.09 0.09 0.09 0.09 0.09 0.21 0.21 0.17 0.24 0.17 0.24 Compression / fueling 0.12 0.12 0.12 0.12 0.12 0.09 0.09 0.09 0.08 0.09 0.08 Total (*1) 1.18 1.91 2.25 2.06 2.54 0.89 1.37 0.83 1.11 0.97 1.64 Additional energy consumption to generate 1kWh = 3.6MJ electric power by means of power generation [MJ/MJ-H2] (Petroleum) +0.41 +0.41 +0.41 +0.41 +0.41 +0.23 +0.23 +0.21 +0.63 +0.21 +0.63 (LNG) +0.40 +0.40 +0.40 +0.40 +0.40 +0.23 +0.23 +0.20 +0.62 +0.20 +0.62 (LNG combined) +0.30 +0.30 +0.30 +0.30 +0.30 +0.17 +0.17 +0.15 +0.46 +0.15 +0.46 (Coal) +0.37 +0.37 +0.37 +0.37 +0.37 +0.21 +0.21 +0.19 +0.58 +0.19 +0.58 (Japan average) (*2) +0.39 +0.39 +0.39 +0.39 +0.39 +0.23 +0.23 +0.20 +0.61 +0.20 +0.61 (*1) + (*2) 1.58 2.31 2.64 2.46 2.94 1.11 1.60 1.03 1.72 1.17 2.25
Frombiomass
Fromnatural gas From biomassFrom
naturalgas
From coal From biomass Fromnatural
gas
FT synthetic oil reforming DME reforming Methanol reforming
(Conventional) (Improved) (Conventional) (Improved) (NEDO) (JHFC) (NEDO) (JHFC) (NEDO) (JHFC) Feedstock production 0.23 0.20 0.11 0.09 0.33 0.11 0.24 0.27 0.18 0.20 0.23 0.25 H2 production (reforming) 0.08 0.08 0.08 0.08 0.11 0.09 0.33 0.05 0.33 0.05 0.33 0.05 Compression / fueling 0.09 0.09 0.09 0.09 0.10 0.12 0.09 0.15 0.09 0.15 0.09 0.15 Total (*1) 0.40 0.37 0.28 0.27 0.54 0.32 0.66 0.46 0.60 0.39 0.64 0.44
(Petroleum) +0.33 +0.33 +0.33 +0.33 +0.41 +0.41 +0.24 +0.38 +0.24 +0.38 +0.24 +0.38 (LNG) +0.32 +0.32 +0.32 +0.32 +0.40 +0.40 +0.24 +0.38 +0.24 +0.38 +0.24 +0.38 (LNG combined) +0.24 +0.24 +0.24 +0.24 +0.29 +0.30 +0.18 +0.28 +0.18 +0.28 +0.18 +0.28 (Coal) +0.30 +0.30 +0.30 +0.30 +0.37 +0.37 +0.22 +0.35 +0.22 +0.35 +0.22 +0.35 (Japan average) (*2) +0.32 +0.32 +0.32 +0.32 +0.39 +0.39 +0.24 +0.37 +0.24 +0.37 +0.24 +0.37 (*1) + (*2) 0.72 0.69 0.60 0.59 0.93 0.72 0.90 0.83 0.83 0.76 0.88 0.81
Additional energy consumption to generate 1kWh = 3.6MJ electric power by means of power generation [MJ/MJ-H2]
Desulfurizedgasolinereforming
City gas reformingKerosenereformingFrom LNG From pipeline
LPG reformingFrom raw natural gas From associated gas From petroleum refinery

- 90 -
Table 2.7.3(A) WTT GHG emissions of hydrogen production pathways [g eq-CO2/MJ] (on-site hydrocarbon reforming (city gas, petroleum products))
Table 2.7.3(B) WTT GHG emissions of hydrogen production pathways [g eq-CO2/MJ](on-site hydrocarbon reforming (synthetic fuels))
Table 2.7.4(A) WTT energy efficiency of hydrogen production pathways (LHV)(on-site hydrocarbon reforming (city gas, petroleum products))
(best) (worst) (best) (worst) (best) (worst) (best) (worst) Feedstock production 40.5 117.6 120.0 14.2 15.8 21.4 11.1 24.6 35.9 10.7 14.8 Hydrogen production / Compression 12.1 12.1 CO2 from feedstock 125.9 125.9 125.9 1.3 1.3 96.9 14.1 74.0 92.4 Total (*1) 166.4 243.5 245.9 15.5 17.1 118.3 25.1 110.7 128.3 22.8 14.8 Additional GHG emission to generate 1kWh = 3.6MJ electric power by means of power generation [g eq-CO2/MJ-H2] (Petroleum) +45.7 +45.7 +45.7 +45.7 +45.7 +26.1 +26.1 +23.2 +70.6 +23.2 +70.6 (LNG) +36.8 +36.8 +36.8 +36.8 +36.8 +21.1 +21.1 +18.7 +57.0 +18.7 +57.0 (LNG combined) +30.2 +30.2 +30.2 +30.2 +30.2 +17.3 +17.3 +15.3 +46.7 +15.3 +46.7 (Coal) +57.2 +57.2 +57.2 +57.2 +57.2 +32.7 +32.7 +29.1 +88.5 +29.1 +88.5 (Japan average) (*2) +25.9 +25.9 +25.9 +25.9 +25.9 +14.8 +14.8 +13.2 +40.0 +13.2 +40.0 (*1) + (*2) 192.3 269.4 271.8 41.4 43.0 133.1 39.9 123.8 168.3 35.9 54.8
Fromnatural
gas
Frombiomass
Fromnatural gas From biomass
FT synthetic oil reforming DME reforming Methanol reforming
Fromnatural
gas
From coal From biomass
(Conventional) (Improved) (Conventional) (Improved) (NEDO) (JHFC) (NEDO) (JHFC) (NEDO) (JHFC) Feedstock production 17.1 14.9 6.6 5.7 21.4 8.1 18.4 20.2 11.6 12.7 14.9 16.3 H2 production / Compression CO2 from feedstock 83.3 72.3 83.3 72.3 129.6 125.9 95.4 104.5 95.4 104.5 95.4 104.5 Total (*1) 100.4 87.2 89.8 78.0 151.0 134.0 113.8 124.7 107.0 117.2 110.2 120.8
(Petroleum) +37.0 +37.0 +37.0 +37.0 +45.4 +45.7 +27.2 +42.8 +27.2 +42.8 +27.2 +42.8 (LNG) +29.8 +29.8 +29.8 +29.8 +36.6 +36.8 +22.0 +34.5 +22.0 +34.5 +22.0 +34.5 (LNG combined) +24.4 +24.4 +24.4 +24.4 +30.0 +30.2 +18.0 +28.3 +18.0 +28.3 +18.0 +28.3 (Coal) +46.3 +46.3 +46.3 +46.3 +56.9 +57.2 +34.1 +53.6 +34.1 +53.6 +34.1 +53.6 (Japan average) (*2) +21.0 +21.0 +21.0 +21.0 +25.7 +25.9 +15.4 +24.2 +15.4 +24.2 +15.4 +24.2 (*1) + (*2) 121.3 108.1 110.8 99.0 176.7 159.9 129.2 148.9 122.4 141.4 125.6 145.0
Additional GHG emission to generate 1kWh = 3.6MJ electric power by means of power generation [g eq-CO2/MJ-H2]
Desulfurizedgasolinereforming
Kerosenereforming
LPG reformingFrom raw natural gas From associated gas From petroleum refineryFrom pipeline
City gas reformingFrom LNG
(Conventional) (Improved) (Conventional) (Improved) (NEDO) (JHFC) (NEDO) (JHFC) (NEDO) (JHFC) Feedstock production 0.863 0.863 0.934 0.934 0.830 0.924 0.853 0.853 0.889 0.889 0.916 0.916 H2 production (reforming) 0.650 0.743 0.650 0.743 0.536 0.555 0.654 0.591 0.654 0.591 0.654 0.591 Compression / fueling 0.971 0.971 0.971 0.971 0.968 0.949 0.971 0.925 0.971 0.925 0.971 0.925 Total (*1) 0.545 0.622 0.590 0.674 0.431 0.486 0.541 0.467 0.565 0.486 0.582 0.501
(Petroleum) (LNG) (LNG combined) (Coal) (Japan average) (*2)
Energy efficiency to generate 1kWh = 3.6MJ electric power by means of power generation (LHV)
City gas reforming LPG reformingFrom petroleum refinery
Desulfurizedgasolinereforming
KerosenereformingFrom LNG From pipeline
0.3480.3860.4220.3540.358
From raw natural gas From associated gas

- 91 -
Table 2.7.4(B) WTT energy efficiency of hydrogen production pathways (LHV)(on-site hydrocarbon reforming (synthetic fuels))
Regarding the on-site water electrolysis, the results of calculations for energy consumption, GHG emissionsand energy efficiency during production of 1 MJ petroleum products are shown in Table 2.7.5 (energyconsumption), Table 2.7.6 (GHG emissions) and Table 2.7.7 (energy efficiency).
Table 2.7.5 WTT energy consumption of hydrogen production pathways [MJ/MJ](on-site water electrolysis)
(best) (worst) (best) (worst) (best) (worst) (best) (worst) Feedstock production 0.638 0.508 0.463 0.489 0.431 0.671 0.536 0.640 0.613 0.597 0.496 Hydrogen production (reforming) 0.555 0.555 0.555 0.555 0.555 0.687 0.687 0.804 0.632 0.804 0.632 Compression / fueling 0.949 0.949 0.949 0.949 0.949 0.971 0.971 0.971 0.979 0.971 0.979 Total (*1) 0.336 0.267 0.244 0.257 0.227 0.447 0.357 0.500 0.379 0.466 0.307 Energy efficiency to generate 1kWh = 3.6MJ electric power by means of power generation (LHV) (Petroleum) (LNG) (LNG combined) (Coal) (Japan average) (*2)
FT synthetic oil reforming DME reforming Methanol reforming
Fromnatural
gas
From coal From biomass Fromnatural
gas
Frombiomass
Fromnatural gas From biomass
0.4220.3860.348
0.3580.354
HS2505 HS2510 HS2530 KOH100 KOH300 KOH500 PA-P PA-K 40kW 500kW 1000kW
Hydrogen production (electrolysis) 2.00 1.84 1.84 1.50 1.78 1.64 1.65 2.07 1.60 1.44 1.44 1.44 Compression / fueling ↑ ↑ ↑ 0.09 0.09 0.09 0.09 0.09 0.09 0.09 0.09 0.09 Total (*1) 2.00 1.84 1.84 1.60 1.87 1.73 1.74 2.16 1.70 1.54 1.53 1.53 Additional energy consumption to generate 1kWh = 3.6MJ electric power by means of power generation [MJ/MJ-H2] (Petroleum) +3.90 +3.57 +3.57 +3.11 +3.65 +3.37 +3.39 +4.21 +3.30 +2.99 +2.98 +2.98 (LNG) +3.82 +3.50 +3.50 +3.05 +3.57 +3.30 +3.33 +4.13 +3.24 +2.93 +2.92 +2.92 (LNG combined) +2.83 +2.59 +2.59 +2.25 +2.64 +2.44 +2.46 +3.05 +2.39 +2.16 +2.16 +2.16 (Coal) +3.55 +3.25 +3.25 +2.83 +3.32 +3.07 +3.09 +3.83 +3.01 +2.72 +2.71 +2.71 (Japan average) (*2) +3.76 +3.45 +3.45 +3.00 +3.52 +3.25 +3.27 +4.06 +3.18 +2.88 +2.88 +2.88 (*1) + (*2) 5.77 5.28 5.28 4.59 5.39 4.98 5.02 6.23 4.88 4.42 4.41 4.41
Pure water electrolysisusing reversible cell
PEFC(Hitachi Zosen)
Purewater
electrolysis
Alkali water electrolysis Package type

- 92 -
Table 2.7.6 WTT GHG emissions of hydrogen production pathways [g eq-CO2/MJ](on-site water electrolysis)
Table 2.7.7 WTT energy efficiency of hydrogen production pathways (LHV)(on-site water electrolysis)
In relation to off-site handling, depending on transportation method and fueling method, three cases wereconsidered (compressed hydrogen transportation compressed hydrogen fueling, liquefied hydrogentransportation compressed hydrogen fueling, liquefied hydrogen transportation liquefied hydrogenfueling).Calculation results for each process ((A) compressed hydrogen transportation compressed hydrogenfueling, (B) liquefied hydrogen transportation compressed hydrogen fueling, (C) liquefied hydrogentransportation liquefied hydrogen fueling) for energy consumption, GHG emissions and energy efficiencyduring the production of 1MJ hydrogen, are shown in Table 2.7.8 (Energy Consumption), Table 2.7.9 (GHGEmissions) and Table 2.7.10 (Energy Efficiency).
HS2505 HS2510 HS2530 KOH100 KOH300 KOH500 PA-P PA-K 40kW 500kW 1000kW
Hydrogen production (electrolysis) 0.0 0.0 0.0 0.0 0.0 0.0 0.0 0.0 0.0 0.0 0.0 0.0 Compression / fueling 0.0 0.0 0.0 0.0 0.0 0.0 0.0 0.0 0.0 0.0 0.0 0.0 Total (*1) 0.0 0.0 0.0 0.0 0.0 0.0 0.0 0.0 0.0 0.0 0.0 0.0 Additional GHG emission to generate 1kWh = 3.6MJ electric power by means of power generation [g eq-CO2/MJ-H2] (Petroleum) +435.4 +399.1 +399.1 +346.9 +407.1 +375.9 +378.8 +470.2 +368.6 +333.6 +332.8 +332.9 (LNG) +351.1 +321.8 +321.8 +279.7 +328.3 +303.1 +305.4 +379.2 +297.2 +269.0 +268.4 +268.4 (LNG combined) +287.5 +263.6 +263.6 +229.1 +268.9 +248.3 +250.2 +310.6 +243.5 +220.3 +219.8 +219.9 (Coal) +545.3 +499.8 +499.8 +434.4 +509.8 +470.8 +474.4 +588.9 +461.7 +417.8 +416.8 +416.9 (Japan average) (*2) +246.6 +226.0 +226.0 +196.4 +230.5 +212.9 +214.5 +266.3 +208.8 +188.9 +188.5 +188.5 (*1) + (*2) 246.6 226.0 226.0 196.4 230.5 212.9 214.5 266.3 208.8 188.9 188.5 188.5
Alkali water electrolysis Package type Pure water electrolysisusing reversible cell
PEFC(Hitachi Zosen)
Purewater
electrolysis
HS2505 HS2510 HS2530 KOH100 KOH300 KOH500 PA-P PA-K 40kW 500kW 1000kW
Hydrogen production (electrolysis) 0.499 0.544 0.544 0.665 0.562 0.611 0.606 0.483 0.624 0.694 0.695 0.695 Compression / fueling ↑ ↑ ↑ 0.971 0.971 0.971 0.971 0.971 0.971 0.971 0.971 0.971 Total (*1) 0.499 0.544 0.544 0.646 0.545 0.593 0.588 0.469 0.606 0.673 0.675 0.675 Energy efficiency to generate 1kWh = 3.6MJ electric power by means of power generation (LHV) (Petroleum) (LNG) (LNG combined) (Coal) (Japan average) (*2)
0.3580.3540.422
0.3480.386
PEFC(Hitachi Zosen)
Purewater
electrolysis
Alkali water electrolysis Package type Pure water electrolysisusing reversible cell

- 93 -
Table 2.7.8(A) WTT energy consumption of hydrogen production pathways [MJ/MJ](compressed hydrogen transportation→compressed hydrogen fueling)
Table 2.7.8(B) WTT energy consumption of hydrogen production pathways [MJ/MJ](liquefied hydrogen transportation→compressed hydrogen fueling)
Topsøe PEC NEDO JHFC case.1 case.2 case.3 (conventional) (future) (conventional) (future) Feedstock production 0.12 0.14 0.11 0.15 0.10 0.08 0.85 0.74 Hydrogen production / refining 0.30 0.80 0.004 0.07 0.15 0.15 0.11 0.08 0.08 0.08 0.08 Compression for distribution 0.11 0.11 0.11 0.11 0.11 0.11 0.11 0.11 0.11 0.11 0.11 0.11 Domestic transport 0.04 0.04 0.04 0.04 0.04 0.04 0.04 0.04 0.04 0.04 0.04 0.04 Compression / fueling 0.04 0.04 0.04 0.04 0.04 0.04 0.04 0.04 0.04 0.04 0.04 0.04 Total (*1) 0.62 1.14 0.32 0.41 0.35 0.34 0.31 0.20 0.37 0.36 1.13 1.02 Additional energy consumption to generate 1kWh = 3.6MJ electric power by means of power generation [MJ/MJ-H2] (Petroleum) +0.31 +0.33 +0.31 +0.43 +0.59 +0.58 +0.51 +0.30 +0.45 +0.45 +0.45 +0.45 (LNG) +0.30 +0.32 +0.30 +0.42 +0.58 +0.57 +0.50 +0.29 +0.44 +0.44 +0.44 +0.44 (LNG combined) +0.22 +0.24 +0.22 +0.31 +0.43 +0.42 +0.37 +0.22 +0.32 +0.32 +0.32 +0.32 (Coal) +0.28 +0.30 +0.28 +0.39 +0.54 +0.53 +0.47 +0.27 +0.41 +0.41 +0.41 +0.41 (Japan average) (*2) +0.30 +0.32 +0.30 +0.42 +0.57 +0.56 +0.50 +0.29 +0.43 +0.43 +0.43 +0.43 (*1) + (*2) 0.92 1.45 0.61 0.83 0.92 0.90 0.80 0.49 0.80 0.79 1.56 1.45
Naphtha reforming CH4 fermentation/ reformingCOG refining Salt
electrolysis
Raw natural gasreforming
Topsøe PEC NEDO JHFC case.1 case.2 case.3 (conventional) (future) (conventional) (future) Feedstock production 0.12 0.14 0.11 0.15 0.10 0.08 0.85 0.74 Hydrogen production / refining 0.30 0.80 0.004 0.07 0.15 0.15 0.11 0.08 0.08 0.08 0.08 Liquefaction for distribution 0.36 0.36 0.36 0.36 0.36 0.36 0.36 0.36 0.36 0.36 0.36 0.36 Domestic transport 0.01 0.01 0.01 0.01 0.01 0.01 0.01 0.01 0.01 0.01 0.01 0.01 Gasification / compression / fueling 0.07 0.07 0.07 0.07 0.07 0.07 0.07 0.07 0.07 0.07 0.07 0.07 Total (*1) 0.86 1.38 0.55 0.65 0.59 0.58 0.55 0.44 0.61 0.60 1.37 1.25 Additional energy consumption to generate 1kWh = 3.6MJ electric power by means of power generation [MJ/MJ-H2] (Petroleum) +0.84 +0.86 +0.84 +0.96 +1.12 +1.11 +1.04 +0.83 +0.98 +0.98 +0.98 +0.98 (LNG) +0.82 +0.84 +0.82 +0.94 +1.10 +1.09 +1.02 +0.81 +0.96 +0.96 +0.96 +0.96 (LNG combined) +0.61 +0.62 +0.61 +0.70 +0.81 +0.81 +0.76 +0.60 +0.71 +0.71 +0.71 +0.71 (Coal) +0.76 +0.78 +0.76 +0.88 +1.02 +1.01 +0.95 +0.75 +0.89 +0.89 +0.89 +0.89 (Japan average) (*2) +0.81 +0.83 +0.81 +0.93 +1.08 +1.07 +1.01 +0.80 +0.94 +0.94 +0.94 +0.94 (*1) + (*2) 1.67 2.20 1.36 1.58 1.67 1.65 1.55 1.24 1.55 1.54 2.31 2.20
CH4 fermentation/ reformingCOG refining Salt
electrolysis
Raw natural gasreformingNaphtha reforming

- 94 -
Table 2.7.8(C) WTT energy consumption of hydrogen production pathways [MJ/MJ](liquefied hydrogen transportation→liquefied hydrogen fueling)
Table 2.7.9(A) WTT GHG emissions of hydrogen production pathways [g eq-CO2/MJ](compressed hydrogen transportation→compressed hydrogen fueling)
Topsøe PEC NEDO JHFC case.1 case.2 case.3 (conventional) (future) (conventional) (future) Feedstock production 0.12 0.14 0.11 0.15 0.10 0.08 0.85 0.74 Hydrogen production / refining 0.30 0.80 0.004 0.07 0.15 0.15 0.11 0.08 0.08 0.08 0.08 Liquefaction for distribution 0.36 0.36 0.36 0.36 0.36 0.36 0.36 0.36 0.36 0.36 0.36 0.36 Domestic transport 0.01 0.01 0.01 0.01 0.01 0.01 0.01 0.01 0.01 0.01 0.01 0.01 Fueling as liquid 0.01 0.01 0.01 0.01 0.01 0.01 0.01 0.01 0.01 0.01 0.01 0.01 Total (*1) 0.81 1.32 0.50 0.60 0.53 0.53 0.49 0.38 0.55 0.54 1.31 1.20 Additional energy consumption to generate 1kWh = 3.6MJ electric power by means of power generation [MJ/MJ-H2] (Petroleum) +0.73 +0.75 +0.73 +0.86 +1.02 +1.00 +0.94 +0.72 +0.87 +0.87 +0.87 +0.87 (LNG) +0.72 +0.74 +0.72 +0.84 +1.00 +0.99 +0.92 +0.71 +0.85 +0.85 +0.85 +0.85 (LNG combined) +0.53 +0.54 +0.53 +0.62 +0.74 +0.73 +0.68 +0.52 +0.63 +0.63 +0.63 +0.63 (Coal) +0.67 +0.68 +0.67 +0.78 +0.93 +0.92 +0.85 +0.66 +0.79 +0.79 +0.79 +0.79 (Japan average) (*2) +0.71 +0.72 +0.70 +0.83 +0.98 +0.97 +0.90 +0.70 +0.84 +0.84 +0.84 +0.84 (*1) + (*2) 1.51 2.05 1.20 1.42 1.52 1.50 1.40 1.08 1.40 1.38 2.15 2.04
Naphtha reforming CH4 fermentation/ reformingCOG refining Salt
electrolysis
Raw natural gasreforming
Topsøe PEC NEDO JHFC case.1 case.2 case.3 (conventional) (future) (conventional) (future) Feedstock production 8.4 9.9 7.7 9.9 5.7 5.0 24.6 21.4 Hydrogen production / refining 20.7 54.8 Compression for distribution Domestic transport 3.3 3.3 3.3 3.3 3.3 3.3 3.3 3.3 3.3 3.3 3.3 3.3 Compression / fueling CO2 from feedstock 83.0 66.6 94.4 121.6 83.3 72.3 Total (*1) 115.5 134.6 105.4 134.8 3.3 3.3 3.3 3.3 92.4 80.6 27.9 24.7 Additional GHG emission to generate 1kWh = 3.6MJ electric power by means of power generation [g eq-CO2/MJ-H2] (Petroleum) +34.4 +36.5 +34.3 +48.4 +66.4 +64.9 +57.3 +33.4 +50.1 +50.1 +50.1 +50.1 (LNG) +27.7 +29.4 +27.7 +39.0 +53.5 +52.4 +46.2 +26.9 +40.4 +40.4 +40.4 +40.4 (LNG combined) +22.7 +24.1 +22.7 +32.0 +43.9 +42.9 +37.9 +22.0 +33.1 +33.1 +33.1 +33.1 (Coal) +43.1 +45.7 +43.0 +60.6 +83.2 +81.3 +71.8 +41.8 +62.7 +62.7 +62.7 +62.7 (Japan average) (*2) +19.5 +20.7 +19.4 +27.4 +37.6 +36.8 +32.5 +18.9 +28.4 +28.4 +28.4 +28.4 (*1) + (*2) 135.0 155.3 124.9 162.2 40.9 40.1 35.8 22.2 120.7 109.0 56.3 53.0
CH4 fermentation/ reformingNaphtha reforming COG refining Salt
electrolysis
Raw natural gasreforming

- 95 -
Table 2.7.9(B) WTT GHG emissions of hydrogen production pathways [g eq-CO2/MJ](liquefied hydrogen transportation→compressed hydrogen fueling)
Table 2.7.9(C) WTT GHG emissions of hydrogen production pathways [g eq-CO2/MJ](liquefied hydrogen transportation→liquefied hydrogen fueling)
Topsøe PEC NEDO JHFC case.1 case.2 case.3 (conventional) (future) (conventional) (future) Feedstock production 8.4 9.9 7.7 9.9 5.7 5.0 24.6 21.4 Hydrogen production / refining 20.7 54.8 Liquefaction for distribution Domestic transport 0.8 0.8 0.8 0.8 0.8 0.8 0.8 0.8 0.8 0.8 0.8 0.8 Gasification / compression / fueling CO2 from feedstock 83.0 66.6 94.4 121.6 83.3 72.3 Total (*1) 112.9 132.0 102.9 132.2 0.8 0.8 0.8 0.8 89.8 78.1 25.4 22.1 Additional GHG emission to generate 1kWh = 3.6MJ electric power by means of power generation [g eq-CO2/MJ-H2] (Petroleum) +93.5 +95.6 +93.4 +107.5 +125.5 +124.1 +116.4 +92.5 +109.2 +109.2 +109.2 +109.2 (LNG) +75.4 +77.1 +75.3 +86.7 +101.2 +100.0 +93.9 +74.6 +88.0 +88.0 +88.0 +88.0 (LNG combined) +61.7 +63.1 +61.7 +71.0 +82.9 +81.9 +76.9 +61.1 +72.1 +72.1 +72.1 +72.1 (Coal) +117.1 +119.7 +117.0 +134.6 +157.2 +155.4 +145.8 +115.8 +136.7 +136.7 +136.7 +136.7 (Japan average) (*2) +53.0 +54.1 +52.9 +60.9 +71.1 +70.3 +65.9 +52.4 +61.8 +61.8 +61.8 +61.8 (*1) + (*2) 165.9 186.2 155.8 193.1 71.8 71.0 66.7 53.1 151.6 139.9 87.2 84.0
COG refining Saltelectrolysis
Raw natural gasreforming
CH4 fermentation/ reformingNaphtha reforming
Topsøe PEC NEDO JHFC case.1 case.2 case.3 (conventional) (future) (conventional) (future) Feedstock production 8.4 9.9 7.7 9.9 5.7 5.0 24.6 21.4 Hydrogen production / refining 20.7 54.8 Liquefaction for distribution Domestic transport 0.8 0.8 0.8 0.8 0.8 0.8 0.8 0.8 0.8 0.8 0.8 0.8 Fueling as liquid CO2 from feedstock 83.0 66.6 94.4 121.6 83.3 72.3 Total (*1) 112.9 132.0 102.9 132.2 0.8 0.8 0.8 0.8 89.8 78.1 25.4 22.1 Additional GHG emission to generate 1kWh = 3.6MJ electric power by means of power generation [g eq-CO2/MJ-H2] (Petroleum) +81.6 +83.7 +81.6 +95.7 +113.7 +112.2 +104.6 +80.6 +97.3 +97.3 +97.3 +97.3 (LNG) +65.8 +67.5 +65.8 +77.1 +91.7 +90.5 +84.3 +65.0 +78.5 +78.5 +78.5 +78.5 (LNG combined) +53.9 +55.3 +53.9 +63.2 +75.1 +74.1 +69.1 +53.3 +64.3 +64.3 +64.3 +64.3 (Coal) +102.3 +104.9 +102.2 +119.8 +142.3 +140.5 +131.0 +101.0 +121.9 +121.9 +121.9 +121.9 (Japan average) (*2) +46.2 +47.4 +46.2 +54.2 +64.4 +63.5 +59.2 +45.7 +55.1 +55.1 +55.1 +55.1 (*1) + (*2) 159.2 179.5 149.1 186.4 65.1 64.3 60.0 46.4 144.9 133.2 80.5 77.3
CH4 fermentation/ reformingNaphtha reforming COG refining Salt
electrolysis
Raw natural gasreforming

- 96 -
Table 2.7.10(A) WTT energy efficiency of hydrogen production pathways (LHV)(compressed hydrogen transportation→compressed hydrogen fueling)
Table 2.7.10(B) WTT energy efficiency of hydrogen production pathways (LHV)(liquefied hydrogen transportation→compressed hydrogen fueling)
Topsøe PEC NEDO JHFC case.1 case.2 case.3 (conventional) (future) (conventional) (future) Feedstock production 0.927 0.927 0.927 0.927 0.936 0.936 0.861 0.861 Hydrogen production / refining 0.674 0.573 0.740 0.555 0.868 0.873 0.901 0.650 0.743 0.650 0.743 Compression for distribution 0.950 0.950 0.950 0.950 0.950 0.950 0.950 0.950 0.950 0.950 0.950 0.950 Domestic transport 0.959 0.959 0.959 0.959 0.959 0.959 0.959 0.959 0.959 0.959 0.959 0.959 Compression / fueling 0.966 0.966 0.966 0.966 0.966 0.966 0.966 0.966 0.966 0.966 0.966 0.966 Total (*1) 0.549 0.467 0.604 0.452 0.764 0.768 0.792 0.880 0.536 0.612 0.492 0.563 Energy efficiency to generate 1kWh = 3.6MJ electric power by means of power generation (LHV) (Petroleum) (LNG) (LNG combined) (Coal) (Japan average) (*2)
Saltelectrolysis
Raw natural gasreforming
CH4 fermentation/ reforming
0.3480.3860.4220.3540.358
Naphtha reforming COG refining
Topsøe PEC NEDO JHFC case.1 case.2 case.3 (conventional) (future) (conventional) (future) Feedstock production 0.927 0.927 0.927 0.927 0.936 0.936 0.861 0.861 Hydrogen production / refining 0.674 0.573 0.740 0.555 0.868 0.873 0.901 0.650 0.743 0.650 0.743 Liquefaction for distribution 0.735 0.735 0.735 0.735 0.735 0.735 0.735 0.735 0.735 0.735 0.735 0.735 Domestic transport 0.990 0.990 0.990 0.990 0.990 0.990 0.990 0.990 0.990 0.990 0.990 0.990 Gasification / compression / fueling 0.995 0.995 0.995 0.995 0.995 0.995 0.995 0.995 0.995 0.995 0.995 0.995 Total (*1) 0.452 0.384 0.497 0.372 0.628 0.632 0.652 0.724 0.441 0.504 0.405 0.463 Energy efficiency to generate 1kWh = 3.6MJ electric power by means of power generation (LHV) (Petroleum) (LNG) (LNG combined) (Coal) (Japan average) (*2)
Naphtha reforming COG refining CH4 fermentation/ reforming
0.3480.3860.4220.3540.358
Saltelectrolysis
Raw natural gasreforming

- 97 -
Table 2.7.10(C) WTT energy efficiency of hydrogen production pathways (LHV)(liquefied hydrogen transportation→liquefied hydrogen fueling)
Topsøe PEC NEDO JHFC case.1 case.2 case.3 (conventional) (future) (conventional) (future) Feedstock production 0.927 0.927 0.927 0.927 0.936 0.936 0.861 0.861 Hydrogen production / refining 0.674 0.573 0.740 0.555 0.868 0.873 0.901 0.650 0.743 0.650 0.743 Liquefaction for distribution 0.735 0.735 0.735 0.735 0.735 0.735 0.735 0.735 0.735 0.735 0.735 0.735 Domestic transport 0.990 0.990 0.990 0.990 0.990 0.990 0.990 0.990 0.990 0.990 0.990 0.990 Fueling as liquid 0.989 0.989 0.989 0.989 0.989 0.989 0.989 0.989 0.989 0.989 0.989 0.989 Total (*1) 0.449 0.382 0.494 0.370 0.625 0.628 0.648 0.720 0.438 0.501 0.403 0.460 Energy efficiency to generate 1kWh = 3.6MJ electric power by means of power generation (LHV) (Petroleum) (LNG) (LNG combined) (Coal) (Japan average) (*2)
Saltelectrolysis
Raw natural gasreforming
CH4 fermentation/ reforming
0.3480.3860.4220.3540.358
Naphtha reforming COG refining

- 98 -
3. Results and Conclusions
3.1 Well-to-Tank Analysis Results
(1) Energy Consumption [MJ/MJ-fuel (LHV)]
Well-to-TankBest Representative Worst
Crude oil Conventional diesel 0.078 Crude oil Low sulfur diesel 0.094 Crude oil Ultra low sulfur diesel 0.118 Crude oil Conventional gasoline 0.175 Crude oil Conventional gasoline 3% Ethanol blend gasoline 0.177 0.222 Crude oil Conventional gasoline 10% Ethanol blend gasoline 0.182 0.338 Crude oil Conventional gasoline ETBE blend gasoline 0.177 0.218 Crude oil Future gasoline 0.187 Crude oil Future gasoline (on) Compressed Hydrogen 0.929 Crude oil Kerosene 0.066 Crude oil Kerosene (on) Compressed Hydrogen 0.718 Crude oil Naphtha (on) Compressed Hydrogen (source:JHFC) 0.733 Crude oil Naphtha (off) Compressed Hydrogen 0.612 1.455 Crude oil Naphtha (off) Liquefied Hydrogen (Compressed fueling) 1.360 2.203 Crude oil Naphtha (off) Liquefied Hydrogen (Fueling as liquid) 1.203 2.046 Crude oil LPG from associated gas 0.120 Crude oil LPG from associated gas (on) Compressed Hydrogen 0.763 0.833 Crude oil LPG from petroleum refinery 0.151 Crude oil LPG from petroleum refinery (on) Compressed Hydrogen 0.814 0.880 Crude oil Crude / heavy fuel oil Electricity 1.951 Crude oil Crude / heavy fuel oil Electricity (on) Compressed Hydrogen 4.512 6.375 Raw natural gas LPG from raw natural gas 0.163 Raw natural gas LPG from raw natural gas (on) Compressed Hydrogen 0.835 0.898 Raw natural gas LNG 0.161 Raw natural gas LNG City gas (Fueling as CNG) 0.206 Raw natural gas LNG City gas (on) Compressed Hydrogen 0.693 0.724 Raw natural gas LNG Electricity (LNG thermal) 1.913 Raw natural gas LNG Electricity (LNG thermal) (on) Compressed Hydrogen 4.454 6.293 Raw natural gas LNG Electricity (LNG combined) 1.414 Raw natural gas LNG Electricity (LNG combined) (on) Compressed Hydrogen 3.691 5.215 Raw natural gas (Pipeline transportation) City gas (Fueling as CNG) 0.120 Raw natural gas (Pipeline transportation) City gas (on) Compressed Hydrogen 0.585 0.599 Raw natural gas (Pipeline transportation) (off) Compressed Hydrogen 0.791 0.804 Raw natural gas (Pipeline transportation) (off) Liquefied Hydrogen (Compressed fueling) 1.540 1.553 Raw natural gas (Pipeline transportation) (off) Liquefied Hydrogen (Fueling as liquid) 1.383 1.396 Raw natural gas Syngas FT synthetic oil 0.553
< Estimation in this study > < 0.484> < 1.070> Raw natural gas Syngas FT synthetic oil (on) Compressed Hydrogen 1.579
< Estimation in this study > < 1.457> < 2.489> Raw natural gas Syngas DME 0.468
< Estimation in this study > < 0.322> < 0.671> Raw natural gas Syngas DME (on) Compressed Hydrogen 1.112
< Estimation in this study > < 0.930> < 1.365> Raw natural gas Syngas Methanol 0.524 0.589
< Estimation in this study > < 0.777> < 1.205> Raw natural gas Syngas Methanol (on) Compressed Hydrogen 1.027 1.724
< Estimation in this study > < 1.298> < 2.550>
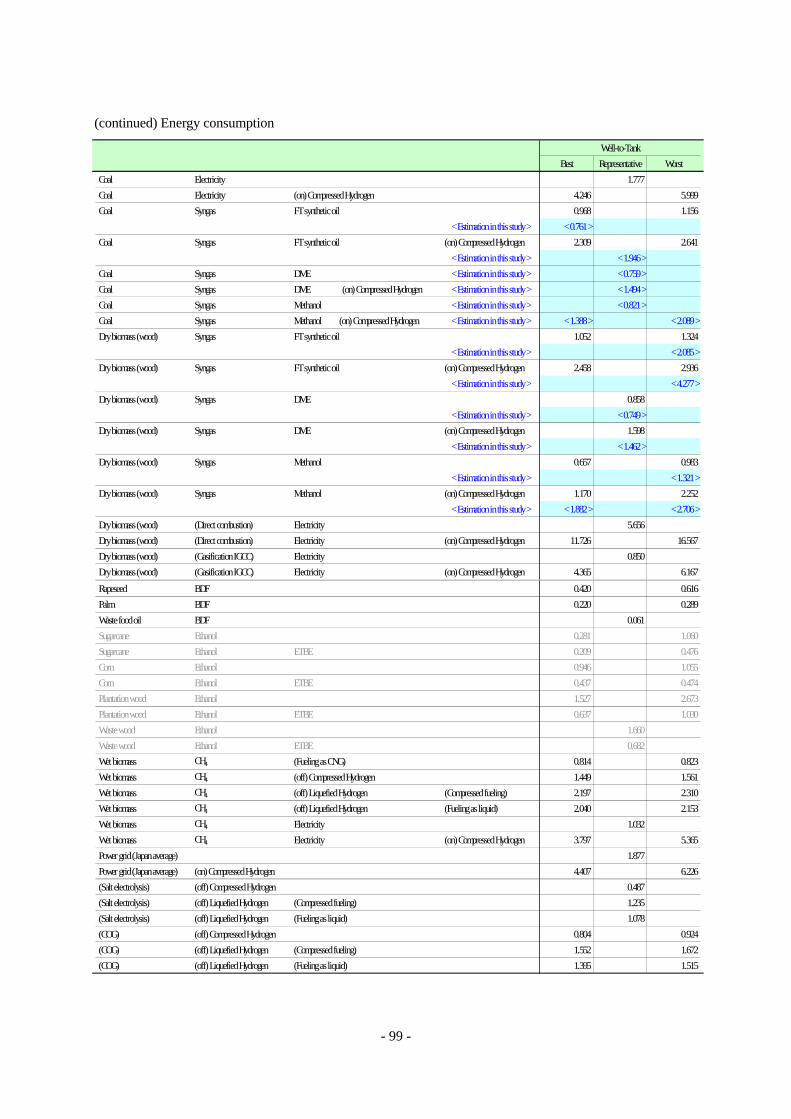
- 99 -
(continued) Energy consumption
Well-to-TankBest Representative Worst
Coal Electricity 1.777 Coal Electricity (on) Compressed Hydrogen 4.246 5.999 Coal Syngas FT synthetic oil 0.968 1.156
< Estimation in this study > < 0.761> Coal Syngas FT synthetic oil (on) Compressed Hydrogen 2.309 2.641
< Estimation in this study > < 1.946> Coal Syngas DME < Estimation in this study > < 0.759> Coal Syngas DME (on) Compressed Hydrogen < Estimation in this study > < 1.494> Coal Syngas Methanol < Estimation in this study > < 0.821> Coal Syngas Methanol (on) Compressed Hydrogen < Estimation in this study > < 1.388> < 2.089> Dry biomass (wood) Syngas FT synthetic oil 1.052 1.324
< Estimation in this study > < 2.085> Dry biomass (wood) Syngas FT synthetic oil (on) Compressed Hydrogen 2.458 2.936
< Estimation in this study > < 4.277> Dry biomass (wood) Syngas DME 0.858
< Estimation in this study > < 0.749> Dry biomass (wood) Syngas DME (on) Compressed Hydrogen 1.598
< Estimation in this study > < 1.462> Dry biomass (wood) Syngas Methanol 0.657 0.983
< Estimation in this study > < 1.321> Dry biomass (wood) Syngas Methanol (on) Compressed Hydrogen 1.170 2.252
< Estimation in this study > < 1.882> < 2.706> Dry biomass (wood) (Direct combustion) Electricity 5.656 Dry biomass (wood) (Direct combustion) Electricity (on) Compressed Hydrogen 11.726 16.567 Dry biomass (wood) (Gasification IGCC) Electricity 0.850 Dry biomass (wood) (Gasification IGCC) Electricity (on) Compressed Hydrogen 4.365 6.167 Rapeseed BDF 0.420 0.616 Palm BDF 0.220 0.289 Waste food oil BDF 0.061 Sugarcane Ethanol 0.281 1.060 Sugarcane Ethanol ETBE 0.209 0.476 Corn Ethanol 0.946 1.055 Corn Ethanol ETBE 0.437 0.474 Plantation wood Ethanol 1.527 2.673 Plantation wood Ethanol ETBE 0.637 1.030 Waste wood Ethanol 1.660 Waste wood Ethanol ETBE 0.682 Wet biomass CH4 (Fueling as CNG) 0.814 0.823 Wet biomass CH4 (off) Compressed Hydrogen 1.449 1.561 Wet biomass CH4 (off) Liquefied Hydrogen (Compressed fueling) 2.197 2.310 Wet biomass CH4 (off) Liquefied Hydrogen (Fueling as liquid) 2.040 2.153 Wet biomass CH4 Electricity 1.032 Wet biomass CH4 Electricity (on) Compressed Hydrogen 3.797 5.365 Power grid (Japan average) 1.877 Power grid (Japan average) (on) Compressed Hydrogen 4.407 6.226 (Salt electrolysis) (off) Compressed Hydrogen 0.487 (Salt electrolysis) (off) Liquefied Hydrogen (Compressed fueling) 1.235 (Salt electrolysis) (off) Liquefied Hydrogen (Fueling as liquid) 1.078 (COG) (off) Compressed Hydrogen 0.804 0.924 (COG) (off) Liquefied Hydrogen (Compressed fueling) 1.552 1.672 (COG) (off) Liquefied Hydrogen (Fueling as liquid) 1.395 1.515

- 100 -
(2) GHG Emissions [g-eq CO2/MJ-fuel (LHV)]
Well-to-TankBest Representative Worst
Crude oil Conventional diesel 5.45 Crude oil Low sulfur diesel 6.43 Crude oil Ultra low sulfur diesel 7.88 Crude oil Conventional gasoline 11.42 Crude oil Conventional gasoline 3% Ethanol blend gasoline 10.17 13.18 Crude oil Conventional gasoline 10% Ethanol blend gasoline 7.14 17.44 Crude oil Conventional gasoline ETBE blend gasoline 10.34 13.05 Crude oil Future gasoline 12.19 Crude oil Future gasoline (on) Compressed Hydrogen 176.68 Crude oil Kerosene 4.72 Crude oil Kerosene (on) Compressed Hydrogen 159.87 Crude oil Naphtha (on) Compressed Hydrogen (source:JHFC) 163.43 Crude oil Naphtha (off) Compressed Hydrogen 124.86 162.19 Crude oil Naphtha (off) Liquefied Hydrogen (Compressed fueling) 155.78 193.11 Crude oil Naphtha (off) Liquefied Hydrogen (Fueling as liquid) 149.07 186.40 Crude oil LPG from associated gas 7.76 Crude oil LPG from associated gas (on) Compressed Hydrogen 122.39 141.45 Crude oil LPG from petroleum refinery 9.93 Crude oil LPG from petroleum refinery (on) Compressed Hydrogen 125.64 145.01 Crude oil Crude / heavy fuel oil Electricity 217.66 Crude oil Crude / heavy fuel oil Electricity (on) Compressed Hydrogen 332.83 470.22 Raw natural gas LPG from raw natural gas 12.32 Raw natural gas LPG from raw natural gas (on) Compressed Hydrogen 129.22 148.93 Raw natural gas LNG 12.68 Raw natural gas LNG City gas (Fueling as CNG) 13.52 Raw natural gas LNG City gas (on) Compressed Hydrogen 108.13 121.34 Raw natural gas LNG Electricity (LNG thermal) 175.51 Raw natural gas LNG Electricity (LNG thermal) (on) Compressed Hydrogen 268.37 379.16 Raw natural gas LNG Electricity (LNG combined) 143.75 Raw natural gas LNG Electricity (LNG combined) (on) Compressed Hydrogen 219.81 310.55 Raw natural gas (Pipeline transportation) City gas (Fueling as CNG) 6.30 Raw natural gas (Pipeline transportation) City gas (on) Compressed Hydrogen 98.98 110.80 Raw natural gas (Pipeline transportation) (off) Compressed Hydrogen 108.99 120.71 Raw natural gas (Pipeline transportation) (off) Liquefied Hydrogen (Compressed fueling) 139.92 151.63 Raw natural gas (Pipeline transportation) (off) Liquefied Hydrogen (Fueling as liquid) 133.20 144.92 Raw natural gas Syngas FT synthetic oil 22.99
< Estimation in this study > < 17.82> < 52.63> Raw natural gas Syngas FT synthetic oil (on) Compressed Hydrogen 192.27
< Estimation in this study > < 183.17> < 244.48> Raw natural gas Syngas DME 17.14
< Estimation in this study > < 12.90> < 33.66> Raw natural gas Syngas DME (on) Compressed Hydrogen 133.06
< Estimation in this study > < 127.78> < 153.65> Raw natural gas Syngas Methanol 22.93 26.77
< Estimation in this study > < 37.94> < 63.40> Raw natural gas Syngas Methanol (on) Compressed Hydrogen 123.84 168.32
< Estimation in this study > < 139.94> < 217.40>

- 101 -
(continued) GHG emissions
Well-to-TankBest Representative Worst
Coal Electricity 272.60 Coal Electricity (on) Compressed Hydrogen 416.82 588.90 Coal Syngas FT synthetic oil 66.78 68.14
< Estimation in this study > < 59.13> Coal Syngas FT synthetic oil (on) Compressed Hydrogen 269.41 271.79
< Estimation in this study > < 255.92> Coal Syngas DME < Estimation in this study > < 63.31> Coal Syngas DME (on) Compressed Hydrogen < Estimation in this study > < 230.43> Coal Syngas Methanol < Estimation in this study > < 65.43> Coal Syngas Methanol (on) Compressed Hydrogen < Estimation in this study > < 248.41> < 318.84> Dry biomass (wood) Syngas FT synthetic oil △64.40 △63.73
< Estimation in this study > < △61.85> Dry biomass (wood) Syngas FT synthetic oil (on) Compressed Hydrogen 41.39 42.97
< Estimation in this study > < 47.40> Dry biomass (wood) Syngas DME △59.11
< Estimation in this study > < △59.38> Dry biomass (wood) Syngas DME (on) Compressed Hydrogen 39.95
< Estimation in this study > < 39.50> Dry biomass (wood) Syngas Methanol △60.40 △59.60
< Estimation in this study > < △58.76> Dry biomass (wood) Syngas Methanol (on) Compressed Hydrogen 35.95 54.77
< Estimation in this study > < 38.30> < 56.27> Dry biomass (wood) (Direct combustion) Electricity 45.34 Dry biomass (wood) (Direct combustion) Electricity (on) Compressed Hydrogen 69.45 98.12 Dry biomass (wood) (Gasification IGCC) Electricity 7.97 Dry biomass (wood) (Gasification IGCC) Electricity (on) Compressed Hydrogen 12.21 17.26
Rapeseed BDF △50.95 △39.10 Palm BDF △56.84 △52.95 Waste food oil BDF △73.28 Sugarcane Ethanol △54.31 △51.89 Sugarcane Ethanol ETBE △10.26 △9.43 Corn Ethanol △2.31 21.92 Corn Ethanol ETBE 7.60 15.92 Plantation wood Ethanol 27.36 103.80 Plantation wood Ethanol ETBE 17.78 44.04 Waste wood Ethanol 23.95 Waste wood Ethanol ETBE 16.61 Wet biomass CH4 (Fueling as CNG) △32.93 △30.73 Wet biomass CH4 (off) Compressed Hydrogen 53.05 56.29 Wet biomass CH4 (off) Liquefied Hydrogen (Compressed fueling) 83.97 87.21 Wet biomass CH4 (off) Liquefied Hydrogen (Fueling as liquid) 77.26 80.50 Wet biomass CH4 Electricity 41.17 Wet biomass CH4 Electricity (on) Compressed Hydrogen 63.07 89.10 Power grid (Japan average) 123.06 Power grid (Japan average) (on) Compressed Hydrogen 188.49 266.30 (Salt electrolysis) (off) Compressed Hydrogen 22.23 (Salt electrolysis) (off) Liquefied Hydrogen (Compressed fueling) 53.15 (Salt electrolysis) (off) Liquefied Hydrogen (Fueling as liquid) 46.44 (COG) (off) Compressed Hydrogen 35.79 40.93 (COG) (off) Liquefied Hydrogen (Compressed fueling) 66.71 71.85 (COG) (off) Liquefied Hydrogen (Fueling as liquid) 60.00 65.14

- 102 -
(3) Energy efficiency (LHV)
Well-to-TankBest Representative Worst
Crude oil Conventional diesel 0.916 Crude oil Low sulfur diesel 0.902 Crude oil Ultra low sulfur diesel 0.883 Crude oil Conventional gasoline 0.839 Crude oil Conventional gasoline 3% Ethanol blend gasoline 0.838 0.822 Crude oil Conventional gasoline 10% Ethanol blend gasoline 0.836 0.782 Crude oil Conventional gasoline ETBE blend gasoline 0.833 0.803 Crude oil Future gasoline 0.830 Crude oil Future gasoline (on) Compressed Hydrogen 0.431 Crude oil Kerosene 0.924 Crude oil Kerosene (on) Compressed Hydrogen 0.486 Crude oil Naphtha (on) Compressed Hydrogen (source:JHFC) 0.452 Crude oil Naphtha (off) Compressed Hydrogen 0.604 0.452 Crude oil Naphtha (off) Liquefied Hydrogen (Compressed fueling) 0.497 0.372 Crude oil Naphtha (off) Liquefied Hydrogen (Fueling as liquid) 0.494 0.370 Crude oil LPG from associated gas 0.889 Crude oil LPG from associated gas (on) Compressed Hydrogen 0.565 0.486 Crude oil LPG from petroleum refinery 0.916 Crude oil LPG from petroleum refinery (on) Compressed Hydrogen 0.582 0.501 Crude oil Crude / heavy fuel oil Electricity 0.358 Crude oil Crude / heavy fuel oil Electricity (on) Compressed Hydrogen 0.241 0.168 Raw natural gas LPG from raw natural gas 0.853 Raw natural gas LPG from raw natural gas (on) Compressed Hydrogen 0.541 0.467 Raw natural gas LNG 0.858 Raw natural gas LNG City gas (Fueling as CNG) 0.848 Raw natural gas LNG City gas (on) Compressed Hydrogen 0.622 0.545 Raw natural gas LNG Electricity (LNG thermal) 0.354 Raw natural gas LNG Electricity (LNG thermal) (on) Compressed Hydrogen 0.239 0.166 Raw natural gas LNG Electricity (LNG combined) 0.422 Raw natural gas LNG Electricity (LNG combined) (on) Compressed Hydrogen 0.285 0.198 Raw natural gas (Pipeline transportation) City gas (Fueling as CNG) 0.918 Raw natural gas (Pipeline transportation) City gas (on) Compressed Hydrogen 0.674 0.590 Raw natural gas (Pipeline transportation) (off) Compressed Hydrogen 0.612 0.536 Raw natural gas (Pipeline transportation) (off) Liquefied Hydrogen (Compressed fueling) 0.504 0.441 Raw natural gas (Pipeline transportation) (off) Liquefied Hydrogen (Fueling as liquid) 0.501 0.438 Raw natural gas Syngas FT synthetic oil 0.638
< Estimation in this study > < 0.668> < 0.477> Raw natural gas Syngas FT synthetic oil (on) Compressed Hydrogen 0.336
< Estimation in this study > < 0.352> < 0.251> Raw natural gas Syngas DME 0.671
< Estimation in this study > < 0.748> < 0.587> Raw natural gas Syngas DME (on) Compressed Hydrogen 0.447
< Estimation in this study > < 0.499> < 0.391> Raw natural gas Syngas Methanol 0.640 0.613
< Estimation in this study > < 0.545> < 0.435> Raw natural gas Syngas Methanol (on) Compressed Hydrogen 0.500 0.379
< Estimation in this study > < 0.425> < 0.269>

- 103 -
(continued) Energy efficiency
Well-to-TankBest Representative Worst
Coal Electricity 0.386 Coal Electricity (on) Compressed Hydrogen 0.260 0.181 Coal Syngas FT synthetic oil 0.508 0.463
< Estimation in this study > < 0.568> Coal Syngas FT synthetic oil (on) Compressed Hydrogen 0.267 0.244
< Estimation in this study > < 0.299> Coal Syngas DME < Estimation in this study > < 0.565> Coal Syngas DME (on) Compressed Hydrogen < Estimation in this study > < 0.377> Coal Syngas Methanol < Estimation in this study > < 0.542> Coal Syngas Methanol (on) Compressed Hydrogen < Estimation in this study > < 0.423> < 0.335> Dry biomass (wood) Syngas FT synthetic oil 0.489 0.431
< Estimation in this study > < 0.324> Dry biomass (wood) Syngas FT synthetic oil (on) Compressed Hydrogen 0.257 0.227
< Estimation in this study > < 0.171> Dry biomass (wood) Syngas DME 0.536
< Estimation in this study > < 0.570> Dry biomass (wood) Syngas DME (on) Compressed Hydrogen 0.357
< Estimation in this study > < 0.380> Dry biomass (wood) Syngas Methanol 0.597 0.496
< Estimation in this study > < 0.422> Dry biomass (wood) Syngas Methanol (on) Compressed Hydrogen 0.466 0.307
< Estimation in this study > < 0.329> < 0.261> Dry biomass (wood) (Direct combustion) Electricity 0.094 Dry biomass (wood) (Direct combustion) Electricity (on) Compressed Hydrogen 0.063 0.044 Dry biomass (wood) (Gasification IGCC) Electricity 0.329 Dry biomass (wood) (Gasification IGCC) Electricity (on) Compressed Hydrogen 0.222 0.154
Rapeseed BDF 0.891 0.734 Palm BDF 0.969 0.916 Waste food oil BDF 0.988 Sugarcane Ethanol 0.815 0.466 Sugarcane Ethanol ETBE 0.739 0.423 Corn Ethanol 0.554 0.552 Corn Ethanol ETBE 0.502 0.501 Plantation wood Ethanol 0.392 0.271 Plantation wood Ethanol ETBE 0.356 0.246 Waste wood Ethanol 0.374 Waste wood Ethanol ETBE 0.339 Wet biomass CH4 (Fueling as CNG) 0.804 0.780 Wet biomass CH4 (off) Compressed Hydrogen 0.563 0.492 Wet biomass CH4 (off) Liquefied Hydrogen (Compressed fueling) 0.463 0.405 Wet biomass CH4 (off) Liquefied Hydrogen (Fueling as liquid) 0.460 0.403 Wet biomass CH4 Electricity 0.183 Wet biomass CH4 Electricity (on) Compressed Hydrogen 0.123 0.086 Power grid (Japan average) 0.348 Power grid (Japan average) (on) Compressed Hydrogen 0.235 0.163 (Salt electrolysis) (off) Compressed Hydrogen 0.880 (Salt electrolysis) (off) Liquefied Hydrogen (Compressed fueling) 0.724 (Salt electrolysis) (off) Liquefied Hydrogen (Fueling as liquid) 0.720 (COG) (off) Compressed Hydrogen 0.792 0.764 (COG) (off) Liquefied Hydrogen (Compressed fueling) 0.652 0.628 (COG) (off) Liquefied Hydrogen (Fueling as liquid) 0.648 0.625

- 104 -
3.2 Case Study: Tank-to-Wheel and Well-to-Wheel GHG Emissions
3.2.1 Assumptions about Tank-to-Wheel analysis
Tank-to-Wheel data derived from previous research studies conducted by TMC was used. The outline of thisdata is as follows.
(1) Vehicle Specification
Sedan type passenger vehicle, weight: 1,250 kg, displacement: 2,000cc, four-cylinder gasoline engine,automatic transmission.
(2) Running Conditions
The great effect that running conditions will have on Well-to-Wheel calculation results is acknowledged.Although various running conditions should be considered for evaluation purposes, as this study is classed asa reference case study, the running pattern used in Japan for fuel consumption measurements, the “10/15mode run”, has been used.
(3) Powertrains
The internal combustion engine, hybrid engine and fuel cell were selected as typical powertrains, andcombined with the relevant fuels indicated in “3.1 Well-to-Tank Calculation Results for Evaluated Fuels”.
The fuel consumption ratios and exhaust gas levels (emissions targets) for each powertrain in relation to thebase vehicle is shown in Table 3.2.1.
Table 3.2.1 Mileage and emission target of representative powertrains covered in this study
Representative powertrain Mileage*1 (ratio of base value) Emission target
Gasoline vehicle 1.00 (base value) Lower than the new long-termregulation value for gasoline
Gasoline hybrid vehicle 2.31 ↑
LPG vehicle 1.00 ↑
Natural gas vehicle 1.00 ↑
Diesel vehicle 1.25Lower than the new short-termregulation value for diesel (complyingwith the acts for NOx and PM)
Diesel hybrid vehicle 2.44*2 ↑
Fuel cell vehicle 3.75*3 0 (equivalent to the U.S. Tier-2 Bin 1)
Note *1: Mileage per litre in which each fuel is converted into gasoline equivalence based on heatingvalue. Represented in relative values to that of gasoline vehicle.
*2 : Estimation from public documents *3 : Future target
Regarding power performance, powertrain specifications were adjusted to generally match the base vehicle,taking the system weight and performance of each powertrain into consideration.

- 105 -
3.2.2 Well-to-Wheel GHG emissions under fixed conditions of driving sedan type vehicles
Well-to-Wheel GHG emissions under the condition described in 3.2.1 are shown in Figure 3.2.1
Figure 3.2.1 An example of calculation of Well-to-Wheel GHG emissions
As with prior studies, at the comparatively slow running speed of the “10/15 mode run”, the superiority of thehybrid vehicle (gasoline, diesel) in relation to GHG emissions is significant.For synthetic fuels such as Fischer-Tropsch diesel oil and Dimethyl ether (DME), and hydrogen, largevariations in Well-to-Tank GHG emissions were apparent depending on the primary energy used as feedstock,and it is clear that an important aspect of future considerations will be the production of fuels through lowGHG emission pathways. In addition, fuels derived from biomass resources have comparatively low GHGemission values, and future utilization is anticipated.The calculation results for Well-to-Wheel GHG emissions indicated in this report represent a case study undera given set of conditions, and cannot be applied to discussion concerning the superiority of particular futureautomotive fuels and powertrains. Further evaluation from a comprehensive perspective encompassing theprice of each vehicle and fuels (economical efficiency), supply, ease of use, and so on, is necessary.
-1.0 -0.5 0.0 0.5 1.0 1.5
Well-to-TankTank-to-Wheel
Relative CO2 emission ( Gasoline - ICE = 1.0 )
Gasoline - ICE
Gasoline - ICE/HV
LPG - ICE
LNG → CNG - ICE
Diesel - ICE
Diesel - ICE/HV
Natural Gas → FTD - ICE
Natural Gas → DME - ICE
Coal → FTD - ICE
Coal → DME - ICE
Biomass → FTD - ICE
Rape seed → FAME - ICE
Waste food oil → FAME - ICE
Waste wood → Ethanol - ICE
Gasoline → (on) CGH2 - FC
Kerosene → (on) CGH2 - FC
Naphtha → (on) CGH2 - FC
LPG → (on) CGH2 - FC
Natural Gas → (on) CGH2 - FC
Natural Gas → (off) CGH2 - FC
Natural Gas → MeOH → (on) CGH2 - FC
COG → (off) LH2 - FC
Electrolysis → (on) CGH2 - FC
* Pow ertrain performances of LPG, CNG, and ethnol ICE are the same as gasoline ICE, and pow ertrain performances of FTD, DME, and FAME ICE are the same as diesel ICE.

- 106 -
3.3 Considerations and Future Tasks
3.3.1 Considerations about Well-to-Tank analysis
The calculations of this study mainly concern Well-to-Tank (=consideration of the fuel from extraction ofprimary energy to vehicle fuel tank) energy consumption, greenhouse gas (GHG) emissions and energyefficiency of current and near future automotive fuels in Japan. No fixed timeframe was set for the datacollected, with efforts focusing on understanding and organizing existing data. Moreover, where data used incalculation has a broad range, the range is indicated through minimum to maximum values.
The fuel production pathways considered were; 21 petroleum based fuels, 20 natural gas based fuels, 8 coalbased fuels, 19 biomass resource related fuels (3 bio-diesel fuels, 10 dry biomass based fuels, 6 wet biomassbased fuels), power grid mix (Japan average) and hydrogen production through electrolysis, 6 byproducthydrogen, totaling 76 pathways. The calculation results are as shown in “3.1 Well-to-Tank Analysis Results”.
(1) Petroleum Based Fuel Production Pathways 2.1
For petroleum based fuel production pathways, focusing on fuels for current mainstream internal combustionengines, diesel and gasoline, this study considered low-sulfur diesel, ultra low sulfur diesel and future (sulfur-free) gasoline derived through ultra deep hydrodesulfurization, and biomass based ethanol and ETBE blendgasoline (hydrogen from reformed petroleum products will be mentioned later). Energy efficiency related tothe production of these fuels is high at 0.83-0.92.There are two main uncertain factors in the calculation of data related to petroleum based fuel productionpathways. The first is the effect of sulfur content in crude. The effects of differences in producing region aregreater than the effects of technological factors related to desulfurization. As the vast majority of crude oilcurrently consumed in Japan is imported from the Middle East, data calculated from statistical values, such asin this study, will tend to reflect the properties of Middle East crude. The sulfur content of Middle East crudeis just under 2 %, with high aromatic content. On the other hand, the import of low sulfur content Russian andAfrican crude has recently increased. African crude is a low-sulfur crude with properties similar to North Seacrude. Although North Sea crude is a top quality crude with less than 0.1% sulfur content, it is rarely importedinto Japan. In addition, Russian crude is currently drawing the most attention, and this too has comparativelylow sulfur content. Should these crude oils replace 20-30 % of the imported Middle East crude, the data givenhere may change dramatically (petroleum refining process including desulfurization). Such significant effectsof sulfur content at source are a characteristic of petroleum based fuels (effects of differences in producingregion).The second is the effect of petroleum resources known as “unconventional resources” (= low-sulfur petroleumfeedstock for refining produced through the processing of such as oil sands. Synthetic crude), which are notincluded in current statistics. The use of this feedstock is increasing rapidly in the U.S. In addition, statisticsfor Canada show that synthetic crude exceeded natural crude this year. Regarding price, crude iscomparatively expensive at 40-50 dollars per barrel, whereas synthetic crude is less than 20 dollars per barrel.Moreover, as resource stocks are practically inexhaustible, depending on price, the importance of syntheticcrude may increase in the future. However, on the other hand, problems do exist in that increase in syntheticcrude usage will be accompanied by an increase in CO2 emissions.

- 107 -
It is also necessary to consider the petroleum refining process as a factor specific to Japan. The characteristicof refining in Japan is that unlike the U.S., which uses thermal cracking to produce maximum gasoline, Japanuses mild cracking, applying large amounts of hydrogen to yield approximately 20% kerosene (there is almostno kerosene usage overseas). Although there are thermal cracking techniques using catalysts that can beapplied to increase gasoline yield, as in the U.S., these will result in decreased energy efficiency. In reality, incomparison to the U.S., overall efficiency in Japan is said to be 2-4 % better. In addition, an uncertain factorin the future of the petroleum refining process in Japan is the positioning of C-heavy fuel oil. Until now,industrial use of C-heavy fuel oil centered on power companies, however this usage may be discontinued.Should current consumption conditions progress as they are, in the future, C-heavy fuel oil may be brokendown into gasoline or diesel, resulting in a decrease in process efficiency.
(2) Natural Gas Based Fuel Production Pathways 2.2
For natural gas based fuel production pathways, this study considered liquid natural gas (LNG), whichphysically enhances energy density, and compressed natural gas (CNG) derived from compressed city gas(hydrogen from reformed natural gas will be mentioned later). Regarding supply routes, other than LNG, acase study of pipeline transportation from Sakhalin was also undertaken.Okamura et al. [2004] referenced in this study, gathers the latest information regarding the LNG Middle Eastproject (Qatar, Oman) implemented from the perspective of diversification of LNG procurement, andanalyzes the effects on GHG emissions over the LNG lifecycle (LNG used in Japan) with the addition of theMiddle East LNG project. Okamura et al. [2004] reported that although the shipping distance doubled for theMiddle East, representing a possibility of GHG emissions increasing for the overall lifecycle, as the CO2
content of feedstock from the Middle East LNG project was lower, overall GHG emissions were also lower.Feedstock from Arun, Indonesia contains the most CO2, however this is nearing depletion. Although Japanwill cover the volume previously procured from Arun with imports from the Middle East, GHG emissions forthe overall lifecycle will not increase. CO2 content of feedstock from Sakhalin is also though to be low.In addition, under the preconditions set in this study, the results showed that GHG emissions would be lowerin the case of pipeline transportation from Sakhalin. The FRI-ERC [2000] report also states, “From theenvironmental perspective, if the shipping distance is less than 16,000 km, pipeline transportation is betterthan LNG, and for shorter distances of 2,000-3,000 km, pipeline transportation is significantly better”. Thereare currently many difficult problems of investment risk, politics and so on concerning pipeline transportation.When taken into consideration as a measure against global warming in the future, should the pipelinetransportation of natural gas from neighboring countries become a possibility, it will be an attractive prospectworthy of implementation.
(3) Fuel Production Pathways from Biomass Resources 2.3
For fuel production pathways from biomass resources, this study considered BDF from oil crops and wastefood oil, ethanol and ETBE produced from cellulosic materials such as sugar/starch and wood (used as ablend with gasoline), and CH4 fermentation (synthetic fuels from biomass will be mentioned later). As theconversion technology for biomass resources is still in the research stages, how the future is viewed from thecurrent stages of research will be important.In addition, considerations must be made concerning a variety of restrictions regarding introduction and

- 108 -
dissemination. For example, the introduction and dissemination of BDF may involve restrictions in cost andproduction volume.At present, with BDF usage in Japan, tax equivalent to tax on diesel is imposed when the BDF is blended withdiesel (diesel excise duty). Assuming usage as a blend with diesel, the desirable Well-to-Tank BDF productioncost, taking diesel excise duty into account, would be about 30 yen. In addition, according to data provided inreference materials, assuming daily production of about 200-300 L-BDF, in order to recover the cost of theesterification device within the serviceable life of the reclaimed oil production device (8 years), about 10-20yen per liter BDF needs to be gained. In other words, large-scale production to exploit scale merit, and BDFdissemination on the premise of single BDF usage (not blended with diesel) will be necessary. Furthermore,for BDF production from agricultural products, as labor costs are a major burden in areas that cannot bemechanized, there are generally many cases of increased cost. Therefore, the maintenance of costcompetitiveness through the use of waste cooking oils, which can be recovered free of charge (or inverseonerous contracts) is important.On the other hand, on the production side, due to competition with food crops, the use of abandoned croplandand unused land is assumed for the cultivation of rapeseed. Currently, in Japan, although there are over210,000 ha of abandoned cropland consisting of paddies, fields and orchards, approximately three quarters ofthis land is in plots of less than 5 ha. As a plot of land less than 5 ha can only be expected to produce about 3.7kL-BDF per year, for a 1,500 kL/year class plant such as the one under consideration by Kyoto City, it will benecessary to cultivate rapeseed in 400 plots. In addition, as there will be great differences in the distribution oflarge-scale plots of unused land (greater than 30 ha) depending on region, from the perspective of nationwidedissemination, the utilization of unused plots is unrealistic. Consequently, the establishment of a schemewhereby as much waste cooking oil as possible is collected from homes in a metropolitan area, and the wastecooking oil generated by businesses is collected on a stable basis, is desired.When considering these restrictions, the stable dissemination of BDF in Japan will most likely stem fromBDF derived from imported palm oil, and this accompanied by the utilization of waste cooking oil isconsidered realistic. However, should political backing favor rapeseed (oil crop cultivation includingrapeseed), dissemination may progress with the production of low-cost BDF through mechanized agriculturalwork. In addition, when the premise is of importation, attention must be paid to important points such asdemand/supply balance with other countries and measures against country risk.Following on, for the introduction and dissemination of ethanol, food demand and supply trends must be keptin mind when using saccharides (e.g. corn, sugarcane), and farming and waste treatment trends must be keptin mind when using cellulosic resources (e.g. wood, waste wood).Although ethanol production using corn and other farinaceous crops as feedstock is currently being promoted,mainly in the U.S. and Europe, crops such as corn are also important food crops, and variations in climate cancause sharp increases in trading prices. This will also greatly affect the ethanol production cost. In fact, theeffect of climate risk in relation to corn ethanol is said to be greater than that of country risk on crude prices.The relationship with sugar production is thought to have great influence regarding sugarcane. This trend isparticularly noticeable in Brazil where cane expression businesses directly produce ethanol. In addition,Brazil produces approximately 30 % of the worlds sugar and accounts for approximately 40 % of exports.This suggests the possibility that, if growers in Brazil focus on sugar production due to variations ininternational sugar prices, ethanol demand and supply may become restricted.The ethanol conversion of cellulosic biomass is currently in the stages of technological development, and it isthought that the introduction and dissemination of this technology will be promoted in countries such as Japan

- 109 -
that have difficulty in securing saccharide resources. Other than woody biomass, viable cellulosic resourcesinclude rice straw, wheat straw, wastepaper and so on. Although in many cases in the U.S., the target is wheat-straw, the same cannot be expected in Japan as paddy fields are not necessarily large-scale and are alsodispersed, therefore the focus is expected to be on the utilization of construction generated wood (wastewood).When considering these restrictions, implementation will progress for the time being with imported alcohol asthe main source, with a changeover to cellulosic ethanol production in line with technological advancements.As it is difficult to imagine the import of corn from the U.S., this is not a realistic option for Japan.
(4) Synthetic Fuel Production Pathways 2.4
For synthetic fuel production pathways, considerations were made for 3 types of primary energy (gas) thatwould be the source (natural gas, gas from coal cracking, biomass gasification gas) and 3 types of syntheticfuel (FT synthetic oil, DME, methanol), so calculations energy efficiency and so on were made regarding the9 (= 3 * 3) production pathways these represent.In this study, as existing studies were not available for all nine pathways, other than using prior research forreference in calculations of energy efficiency and so on, conditions were set for a given process, and estimatesof energy efficiency were made under those conditions. Although the estimate results generally matched theresults calculated using prior researches for reference, significant discrepancies were shown for somepathways. This is because the estimates for gas composition assumed total volume to be CH4, however thereality was that some non-CH4 constituents were included, and synthetic fuel is thought to be producedthrough a reforming method suitable for that composition (it is thought that for the production of all syntheticfuels from natural gas, the optimum reforming process is determined automatically according to the requiredH2/CO ratio). In other words, in an industrialized facility, the optimum process has been adopted, and basedon this the values given in reference literature are considered to be the good efficiency values. However, forthe estimate results of this study, all four reforming process types were considered and trial calculationsconducted for each with best and worst values given, resulting in the aforementioned discrepancies. Inaddition, since in some cases there was insufficient information for the conditions set for trial calculations,further information related to the process should be considered with a view to improving accuracy, and thetrial calculation model should be studied.Furthermore, unlike petroleum products and natural gas, which are already in industrial use, usage ofsynthetic fuels as automotive fuel does not have an established industrial usage base, and in relation to allthese pathways, considerations into product quality as an automotive fuel have not been made. Regarding theproduction pathways of synthetic fuels as automotive fuels, improving the accuracy of calculation resultsderived from such considerations remains as a future objective.
(5) Liquefied Petroleum Gas Production Pathways 2.5
For LPG production pathways, the LPG production methods used in Japan – collection of LPG throughseparation and processing of gas associated with crude oil (LPG from associated gas), collection of LPGthrough separation and processing of gas extracted from gas fields (LPG from raw natural gas), and collectionof LPG as a byproduct from refineries and petrochemical plants (LPG from petroleum refining), wereconsidered.
- 110 -
As an automotive fuel, LPG is supplied to established LPG vehicles already in use such as taxis, commercialvehicles and trucks. The propane/butane constituent ratio (weight) of LPG used in motor vehicles is about20:80 in summer and about 30:70 in winter. In prior studies referenced in this study, information regarding thequality of these ratios is unclear. Regarding the production pathways of LPG as an automotive fuel, improvingthe accuracy of calculation results derived from such considerations remains as a future objective.
(6) Electricity (Electric Power Generation Pathways) 2. 6
For electrical power (power generation pathways), petroleum fired thermal, LNG and LNG combined cycle,coal fired thermal, nuclear and biomass power generation, and the electricity mix from the average powergeneration structure of Japan, were considered. Electric power is used to recharge electric vehicles and forhydrogen production through water electrolysis.Attention must be paid to data used in the calculation of CO2 emissions and energy efficiency associated withelectricity usage, as changes in this data will occur depending on perspective, such as the use of a single fossilfuel or the use of energy to power vehicles. From the perspective of how a fossil fuel should be used, it isappropriate to investigate how CO2 emissions and energy efficiency is affected through the various pathwaysfrom one fossil fuel. On the other hand, from the perspective of what should be used to power motor vehicles,it is appropriate to consider energy use as 1 kWh = 3.6 MJ, regardless of the primary energy.Regarding electricity generation mix (Japan average), when using the calculation results, attention must bepaid to the fact that CO2 emissions associated with electricity use are thinned out. If electricity is to provideenergy for transportation, new power plants will be required, and considerations must be made into what willbe used in the new power plants to supply the energy to meet the new demand.In addition, for biomass power generation (direct combustion, steam gas turbine power generation,gasification gas turbine power generation, CH4 fermentation gas engine power generation), differences in thecomposition of the input and processes (including reaction conditions) greatly affect the results. Thecalculation results of biomass power generation in this study are all derived from information relevant to aspecific site, and may be uncertain and varied in comparison to the calculation results for all thermal andnuclear power generation. Improvement of accuracy here also remains as a future objective.
(7) Hydrogen Production Pathways 2. 7
For hydrogen production pathways, following transportation to hydrogen stations in the form of petroleumproducts, city gas, pure water and so on, considerations were made for cases where hydrogen is producedthrough hydrogen production devices (on-site), and cases where hydrogen is produced at large-scale facilitiessuch as a central plant and shipped out in the form of compressed or liquefied hydrogen (off-site).Hydrogen for use as fuel for FCVs does not exist as elementary substance in a natural state, and as shown inpathways considered in this study, conventional energy sources must be relied upon for production (althoughGHG emissions associated with hydrogen production are practically zero when renewable energy is used, atpresent, such renewable energy is not in general use).The majority of hydrogen production pathways considered in this study have not as yet reached levels suitablefor practical application. In other words, much of the data used for calculation in this study is based on ideals,and the task remains as to how estimates should be made concerning deviation between these results and datathat will become available following industrialization.

- 111 -
In addition, this study considers byproduct hydrogen as a secondary product. However, for ironworks andcaustic soda plants where byproduct hydrogen is used effectively, it will be necessary to consider alternativefuels to supplement energy deficiencies incurred through the use of hydrogen as fuel for FCVs. In such cases(where utilization is sufficient), by the calculation results of this study, usage for FCVs will not be effective.At this point, based on the calculation results of this study, hydrogen cannot be said to be particularly superiorto conventional fuels. However, the attraction of hydrogen is in <i> no GHG emissions during use and <ii>can be extracted from various resources (diversity of feedstock). In addition, unlike CO2 emissions fromexisting systems such as gasoline vehicles, CO2 emissions from the hydrogen production process aregenerated in specific locations and may be recovered and sequestered. Depending on trends in the recoveryand sequestration of CO2, huge reductions can be expected in GHG emissions from hydrogen productionpathways. Furthermore, depending greatly on regional characteristics, further improvements can be made onthe energy efficiency of hydrogen such as through the use of waste heat from reforming for cogeneration.Taking all these points into consideration, it will be necessary to seek appropriate hydrogen productionpathways.
3.3.2 Future Tasks
The credibility and applicability of calculations in this study depends greatly on calculation preconditionssuch as implemented load distribution methods and quality of data. In reality, some fuels such as petroleumproducts, city gas, LPG and electricity are already in industrial use, while biomass resources, synthetic fuels,hydrogen and so on are still in the early stages of technological development. In addition, even wherecalculation results of this study are based on actual values, as there is a high degree of uncertainty concerningmatters such as future technological innovation, market size, new laws and regulations, many problems existconcerning the simple comparison of these fuels. Furthermore, regarding load distribution between mainproducts and co-products/byproducts, although this study has been conducted under the premise that, inprinciple, byproducts will be disposed of, the usage of certain byproducts has been considered in existingstudies although the possibility of realizing this usage is unclear (load distribution considerations). For thesereasons, the calculation results of this study are not unlike preliminary approximations, and in order tocontribute further to the initial objectives, the consistency of preconditions and the accuracy of data used incalculations must be improved, and the credibility of the results must be enhanced.
The emphasis of this study is on Well-to-Tank analysis. In future, these results will be combined with variousTank-to-Wheel analysis results and basic data, and various further analyses will be scheduled in relation tooverall efficiency from extraction of primary energy to actual vehicle fuel consumption “Well-to-Wheel” (seeFigure 3.2.1). At such a time, it may also become necessary to modify or adjust the calculation results of thisstudy in order to comply with analysis preconditions.
Well-to-Wheel analysis results will be an important factor in the selection of future technologies and fuels.However, technologies and fuels that will be implemented in the future will not be determined by this factoralone. This is because a variety of other factors such as cost, infrastructure, completeness of the technology,supply potential and usability will also be taken into consideration. In future, it will be necessary to seek outoptimum vehicle/fuel combinations according to the energy circumstances, available infrastructure andregulations that apply in each country or region.

- 112 -
4. References
Aden, A., M. Ruth, K. Ibsen, J. Jechura, K. Neeves, J. Sheehan, B. Wallace, L. Montague, A. Slayton,and J. Lukas [2002]“Lignocellulosic Biomass to Ethanol Process Design and Economics Utilizing Co-Current Dilute Acid Prehydrolysis and Enzymatic Hydrolysis for Corn Stover”, prepared under Task No.BFP2.A410, National Renewable Energy Laboratory (NREL), U.S. DOE, NREL/TP-510-32438,Download at : http://www.afdc.doe.gov/pdfs/6483d.pdf (English)
Agency of Natural Resources and Energy (ANRE), Ministry of International Trade and Industry (MITI,current Ministry of Economy, Trade and Industry (METI)) [1992]: “Saishin-ban Karyoku Handobukku”(Thermal power handbook -- Latest version), published by Denryoku Shinpo-sha Inc.
Agency for Natural Resources and Energy (ANRE), Ministry of Economy, Trade and Industry [2002-1]:“Sougou Enerugii Toukei Heisei 13-nen-do-ban” (Energy Balance Tables in Japan 2001)
Agency for Natural Resources and Energy (ANRE), Ministry of Economy, Trade and Industry [2002-2]:“Gasu Jigyou Nenpou, Heisei 13-nen (2001-nen)” (Gas Industry Manual (2001 edition))
Agency for Natural Resources and Energy (ANRE), Ministry of Economy, Trade and Industry [2002-3]:“Heisei 13-nen-do Denryoku Jukyuu no Gaiyou 51” (2001 Outlook for Electric Supply and Demand)
Argonne National Laboratory (ANL) [2001]: “Greenhouse Gases, Regulated Emissions, and Energy Usein Transportation (GREET) Model”, ver.1.6β, Download at : http://greet.anl.gov/greet1-6_beta.html(English)
Armstrong, A.P., J. Baro, J. Dartoy, A.P. Groves, J. Nikkonen, and D.J. Rickeard [2002]: “energy andgreen gas balance of biofuels for europe – an update”, prepared by the CONCAWE Ad Hoc Group onAlternative Fuels, report No.2/02 (English)
Asad T. Amr [1981]: “Energy Systems in the United States”, Energy, Power and Environment Series, Vol.12, New York, NY, U.S.A. Marcel Dekker Incorporated, ISBN Number: 0824712757 (English)
ASAOKA, Sachio, Mitsunori SHIMURA [2001]: “Gousei Gasu Seizou Gijutsu” (processingtechnologies of synthetic gas), PETROTECH, Vol. 24, No. 3, pp.226-229
Bechtel Corporation [1998]: “Baseline Design/Economics for Advanced Fischer-Tropsch Technology”,Technical Report, Report No. DE-AC22-91PC90027-01, sponsored by U.S. Department of Enegy,Download at : http://www.osti.gov/dublincore/gpo/servlets/purl/14176-YzKSu3/webviewable/ (English)
Bechtold, R. L. [1997]: “Alternative Fuels Guidebook Properties, Storage, Dispensing, and VehicleFacility Modifications”, ISBN 0 7680 0052 1 (English)
・ Titles in brackets are the original ones.
・ Names of books, articles, and organizations in lower cases are tentative translation.
・ Items are Japanese only unless otherwise noted.

- 113 -
Beer, T., T. Grant, G. Morgan, J. Lapszewicz, P. Anyon, J. Edwards, P. Nelson, H. Watson, and D.Williams [2001]: “Comparison of Transport Fuels”, Final Report (EV45A/2/F3C) to the AustralianGreenhouse Office on the Stage 2 study of “Life-cycle Emissions Analysis of Alternative Fuels forHeavy Vehicles”, by CSIRO in association with The University of Melbourne the Centre for Design atRMIT Parsons Australia Pty Ltd and Southern Cross Institute of Health Research, Download at :http://www.greenhouse.gov.au/transport/comparison/index.html (English)
Bosch, R. [2000]: “Automotive Handbook 5th Edition”, ISBN 0837606144 (English)
Central Research Institute of Electric Power Industry (CRIEPI) [1991]: “Hatshuden Puranto no EnerugiiShuushi Bunseki”, (Energy Analysis of Power Generation Plants), research report of Central ResearchInstitute of Electric Power Industry, Y90015
Central Research Institute of Electric Power Industry (CRIEPI) [1992]: “Hatsuden Puranto no OndankaEikyou Bunseki” (Greenhouse Effect Analysis of Power Generation Plants), research report of CentralResearch Institute of Electric Power Industry, Y91005
Central Research Institute of Electric Power Industry (CRIEPI) [1995]: “Hatsuden Shisutemu no RaifuSaikuru Bunseki” (Life Cycle Analysis of Power Generation System), research report of CentralResearch Institute of Electric Power Industry, Y94009
Central Research Institute of Electric Power Industry (CRIEPI) [2000]: “Raifu Saikuru CO2 Haishutsu-ryo ni yoru Hatsuden Gijutsu no Hyouka – Saishin Deeta ni yoru Sai-suikei to Zentei Jouken no Chigaini yoru Eikyou--” (Evaluation of Power Generation Technologies based on Life Cycle CO2 Emissions –Re-estimation Using the Latest Data and Effects of the Difference of Conditions--), research report ofCentral Research Institute of Electric Power Industry, Y99009
Central Research Institute of Electric Power Industry (CRIEPI) [2001]: “Raihu Saikuru CO2 Haisyutsu-ryou ni yoru Genshi-ryoku Hatsuden Gijutsu no Hyouka” (Evaluation of Nuclear Power GenerationTechnologies based on Life Cycle CO2 Emissions), research report of Central Research Institute ofElectric Power Industry, Y01006
Chemical Daily Co., Ltd., the [2002]: “14120 no Kagaku Shouhin” (14120 articles of chemical product)
Consumer’s life Division, General Food Policy Bureau, Ministry of Agriculture, Forestry and Fisheries(MAFF) [2001]: “Heisei 13 nendo Shokuhin Shouhi Monitaa dai-1-kai Teiki Chousa” (periodic survey formonitoring food consumption, FY2001 -- 1st survey)
Department of Agriculture, Forestry and fisheries, Aomori Prefecture [1994]: “Miryoku aru NougyouJitsugen ni muketa Shuyou Sakumotsu no Gijutsu Keiei Shihyou” (technological and managerialindicators of major crops for achieving an attractive agriculture), appendix to the exercise plan for anattractive agriculture. potential direction to develop Aomori’s agriculture
Economic Research Center, Fujitsu Research Institute (FRI-ERC) [2000]: “Paipu Rain to LNG noOndanka-kouka Gasu Haisyutsu no Raihu Saikuru Asesumento Hikaku” (comparison of life cycleassessment of GHG emissions by pipeline and by LNG), Oil and Gas Review, February 2000, pp.2-28
Electrochemical Society of Japan, the [2000]: “Dai 5-han, Denki Kagaku Binran” (electrochemicalhandbook, 5th edition), Maruzen Co., Ltd., ISBN 4-621-04759-0 C3058

- 114 -
Energy Information Administration (EIA) [1994]: “Alternatives to Traditional Transportation Fuels1994”, DOE/EIA-0585 (94) (English)
Energy Policy Division, Natural Resources and Energy Department, Kansai Bureau of Ministry ofInternational Trade and Industry [2002]: “Junkan-gata Keizai Syakai no Keisei wo mezashita BaiomasuEnerugii Katsuyou Sokushin ni muketa Chousa – Kinki Chiiki ni okeru Baiomasu Enerugii Riyou noTenbou – Chousa Houkoku-sho” (study to promote biomass energy use towards creation of a societywith recycling-based economy – prospect for biomass energy use in Kansai Region – study report)
Energy Technology Support Unit (ETSU) [1996]: “Alternative Road Transport Fuels – A PreliminaryLife-cycle Study for the UK”, Volume 2, ISBN 0 11 515411 6
EU Alternative Fuels Contact Group [2003]: “Market Development of Alternative Fuels”, Download at :http://europa.eu.int/comm/energy_transport/en/envir_alternative_fuels_en.html (English)
European Council for Automotive R&D (EUCAR), CONCAWE, and European Commission’s JointResearch Centre (JRC/IES) [2003]: “Well-to-Wheels Analysis of Future Automotive Fuels andPowertrains in the European Context”, Well-to-Tank Report Version 1, December 2003, Download at :http://ies.jrc.cec.eu.int/Download/eh (English)
Fuel Policy Subcommittee [2003]: “Baiomasu Nenryou no CO2 Haisyutsu tou ni kansuru LCA (RaihuSaikuru Asesumento) Hyouka ni tsuite (2) – Waga Kuni de Soutei sareru Dounyuu Keitai e no LCATekiyou ni yoru Shisan Kekka--” (LCA evaluation on CO2 emissions from biomass (2) – estimationresult by applying LCA to the types to be possibly introduced in Japan--), handout material No.4-2 forthe 9th meeting of Fuel Policy Subcommittee, Petroleum Subcommittee, Petroleum Committee,Advisory Committee for Natural Resources and Energy.Download at : http://www.meti.go.jp/report/data/g30723aj.html
General Motors, Argonne National Laboratory (ANL), BP, Exxon Mobil, and Shell [2001]: “Well-to-Wheel Energy Use and Greenhouse Gas Emissions of Advanced Fuel/Vehicle Systems – North AmericanAnalysis –”, Download at : http://greet.anl.gov/publications.html (English)
General Motors, L-B-Systemtechnik GmbH, BP, Exxon Mobil, Shell, and TotalFinaElf [2002]: “GMWell-to-Wheel Analysis of Energy Use and Greenhouse Gas Emissions of Advanced Fuel/Vehicle Systems– A European Study”, Download at : http://www.lbst.de/gm-wtw/ (English)
Graboski, M.S. [2002]: “Fossil Energy Use in the Manufacture of Corn Ethanol”, Colorado School ofMines, prepared for the National Corn Growers Association (English)
Haldor Topsøe [2001]: “DME as a Transportation Fuel”, Download at http://www.topsoe.dk/site.nsf/vALLWEBDOCID/KVOO-5PGFAZ?open&returnid=BBNN-5PNJ3F (English)
Hansen, J.B., B. Voss, F. Joensen, I.D. Siguroardottir [1995]: “Large Scale Manufacture of DimethylEther--A New Alternative Diesel Fuel From Natural Gas”, SAE 950063 (English)
HONDO, Yuki, Yoji UCHIYAMA [1999]: “Kokunai Enerugii Shouhi ni yori Yuuhatsu-sareru Kaigaideno Kankyou Huka” (overseas environmental burden induced by Japan’s domestic energyconsumption), Proceedings of the 15th Conference on Energy, Economy, and Environment, pp.431-436

- 115 -
Intergovernmental Panel on Climate Change (IPCC) [2001]: “Contribution of Working Group I to theThird Assessment Report of the Intergovernmental Panel on Climate Change” (English)
International Energy Agency (IEA) [2003-1]: “Energy Balances of OECD Countries 1971-2001”, 2003Edition/CD-ROM (English)
International Energy Agency (IEA) [2003-2]: “Energy Balances of Non-OECD Countries 1971-2000”,2003 Edition/CD-ROM (English)
Isaias de Carvalho Macedo [1998]: “Greenhouse gas emissions and energy balances in bio-ethanolproduction and utilization in Brazil (1996)”, Biomass and Bioenergy Vol.14, No.1, pp.77-81 (English)
Isaias de Carvalho Macedo, Manoel Regis Lima Verde Leal and Suleiman Jose Hassuani (Centro deTecnologia Copersucar) [1998]: “Sugar cane residues for power generation in the sugar / ethanol millsin Brazil”, Energy for Sustainable Development, Volume V, No.1, March 2001 (English)
ISHIGURO, Takayoshi [1981]: “Kiso Kogyo Denki Kagaku” (basic industrial electrochemistry), SangyoTosho Inc., ISBN4-7828-2521-8 C3058
Institute for Policy Sciences, Japan, the [1977]: “Enerugii Riyou Kouzou to Enerugii Shuushi ni kansuruChosa” (study on energy use structure and energy balance)
Institute of Applied Energy, the (IAE) [1990]: “Karyoku Hatsudensho Taiki Eikyou Hyouka GijutsuJissho Chousa Houkoku-sho” (report of experimental study for atmospheric impact assessmenttechnology of thermal power plants), research project commissioned by Agency of Natural Resourcesand Energy (ANRE), Ministry of International Trade and Industry (MITI). IAE-C8917
Institute of Applied Energy, the (IAE), Takasago Thermal Engineering Co., Ltd. [2002]: “Heisei 13-nendo Suiso wo Mochiita Denryoku Huka Heijun-ka Sisutemu ni kansuru Chousa Houkoku-sho” (reportof a research on electric load leveling system using hydrogen, FY2001), research project of strategicelectric technology development (commissioned by Agency for National Resources and Energy,Ministry of Economy, Trade and Industry)
Institute of Energy Economics, Japan, the (IEEJ) [1999]: “Waga kuni ni okeru Kaseki Enerugii nikansuru Raihu Saikuru Inbentori Bunseki” (Life Cycle Inventory Analysis of Fossil Energies in Japan),handout material of 353rd Forum on Research Works
Japan Energy Research Center Co., Ltd. [2001]: “Ondan-ka Taisaku Kuriin Kaihatsu MekanizumuJigyou Chousa – Betonamu ni okeru Satoukibi kara Etanooru-ganyu-gasorin no Seizou ni kansuruChousa Houkoku-sho” (Feasibility Studies on Climate Change Mitigation Projects for CleanDevelopment Mechanism – Report: Study on Production of Ethanol-containing Gasoline, with EthanolMade from Sugar Cane Refuse in Vietnam), research project commissioned by Global EnvironmentCentre Foundation
Japan Environmental Management Association for Industry, the [2003]: “Heisei 14-nendo Shin EnerugiiSangyou Gijutsu Sougou Kaihatsu Kikou itaku Seihin-tou Raihu Saikuru Kankyou Eikyou HyoukaGijutsu Kaihatsu Seika Houkoku-sho” (report of Development of Technology to Assess and Verify LifeCycle CO2 Emissions project, FY2002, commissioned by the New Energy and Industrial TechnologyDevelopment Organization), CO2 Fixation and Utilization technologies development project

- 116 -
Japan Hydrogen & Fuel Cell Demonstration Project (JHFC) [2004]: “Heisei 15 nendo Suiso Nenryou-denchi Jisshou Purojekuto JHFC Seminaa Shiryou” (handouts for the JHFC Seminar FY2003 onHydrogen and Fuel Cell Demonstration Project), held at Tokyo Prince Hotel on March 12, 2004, JHFCActivity Report I: “Domain of Hydrogen Stations/Test Results”; JHFC Activity Report II: “Developmentof Liquid Hydrogen Manufacturing Technology/Demonstrations”
Japan Institute of Energy, the [2002]: “Baiomasu Handobukku” (Biomass Handbook), Ohmsha, Ltd.ISBN 4-274-02485-7 C3044
Japan Petroleum Institute, the (JPI) [1998]: “Sekiyu Seisei Purosesu” (poetroleum refining process)
Japan National Oil Corporation (now Japan Oil, Gas and Metals National Corporation) [1986]: “SekiyuYougo Jiten” (glossary of petroleum) (available online at http://oilresearch.jogmec.go.jp/glossary as“Sekiyu Tennen-Gasu Yougo Jiten” (glossary of petroleum & natural gas))
Japan Shipping Exchange, Inc., the [1992]: “Distance Tables For World Shipping (Eighth Edition)”(English)
JHFC Special Committee for Overall Efficiency Investigation, Japan Automobile Research Institute[2004]: “Heisei 15 nendo ‘JHFC Sougou Kouritsu Kentou Kekka’ Chuukan Houkoku-sho” (the results ofthe JHFC Overall Efficiency Investigation – FY2003 Interim Report), Download at:http://www.jhfc.jp/topics/pdf/h15houkoku.pdf
K. Shaine Tyson, Editor [1998]: “Biodiesel Reseach Progress 1992-1997”, prepared for NationalRenewable Energy Laboratory (NREL), U.S. DOE, NREL/TP-580-24433, prepared by InformationResources, Inc., Download at : http://www.eere.energy.gov/biomass/pdfs/biodiesel_92-97.pdf (English)
Kadam, K.L., V.J. Camobreco & B.E. Glazebrook, L.H. Forrest & W.A. Jacobson, D.C. Simeroth, W.J.Blackbum, and K.C. Nehoda [1999]: “Environmental Life Cycle Implications of Fuel OxygenateProduction from California Biomass”, Technical Report, prepared under Task No. WG900101, NationalRenewable Energy Laboratory (NREL), U.S. DOE, NREL/TP-580-25688, Download at :http://www.nrel.gov/docs/fy99osti/25688.pdf (English)
Kadam, K.L. [2000]: “Environmental Life Cycle Implications of Using Bagasse-Derived Ethanol as aGasoline Oxygenate in Mumbai (Bombay)”, prepared under Task No. WG88.0101, National RenewableEnergy Laboratory (NREL), U.S. DOE, NREL/TP-580-28705 (English)
Kajitani, S., Z. L. Chen, M. Oguma, M. Alam, K. TAI Rhee [1998]: “Direct-Injection Diesel EngineOperated With Propane-DME Blend Fuel”, SAE 982536 (English)
KATANISHI, Shoji, Kazuhiko KUNITOMI, Masanobu TAKEI, Tetsuo NAKATA, TakashiWATANABE, Toru IZUMIYA [2002]: “Kouon Gasu-ro Gasu-taabin Hatsuden Sisutemu (GTHTR300)yo Kou-nenshou-do Nenryou no Seiritsu-sei Hyouka (I)” (Feasibility Study on High Burn up Fuel forGas Turbine High Temperature Reactor (GTHTR300), (I)), Japanese journal of Atomic Energy Societyof Japan, Vol.1, No.4, pp.373-383
K.K. Sekiyutsushinsha [2002]: “Heisei 14 nen Sekiyu Siryou” (petroleum databook, FY2002)

- 117 -
KOIDE, Yasuhiro [2000]: “Ajia-Taiheiyou Chiiki no Tennen Gasu Jijo to LNG Jukyuu Doukou” (naturalgas status and LNG supply/demand trend in Asia-Pacific region), First Research Department, TheInstitute of Energy Economics, Japan (IEEJ),Download at: http://eneken.ieej.or.jp/data/old/pdf/azialng98.pdf
Krister Ståhl, Magnus Neergaard, Jorma Nieminen [2000]: “Värnamo Demonstration Programme –Final Report”, 1st World Conference on Biomass for Energy and Industry, Sevilla, Spain, 5-9 June 2000,pp.730-736 (English)
Levelton Engineering Ltd. And (S&T)2 Consulting Inc. [2000]: “Assessment of Net Emissions ofGreenhouse Gases from Ethanol-Gasoline Blends in Southern Ontario”, R-2000-1, File: 499-0418(English)
Lorenz, D. and D. Morris [1995]: “How Much Energy Does It Take to Make a Gallon of Ethanol?”,http://www.carbohydrateeconomy.org/library/admin/uploadedfiles/How_Much_Energy_Does_it_Take_to_Make_a_Gallon_.html (English)
Mann, M.K. and P.L. Spath [1997]: “Life Cycle Assessment of a Biomass Gasification Combined-CycleSystem”, prepared under Task No. BP811030, National Renewable Energy Laboratory (NREL), U.S.DOE, NREL/TP-430-23076 (English)
Marano, J.J and J.P. Ciferno [2001]: “Life-Cycle Greenhouse-Gas Emissions Inventory For Fischer-Tropsch Fuels”, prepared by U.S. DOE, NETL and Energy and Environmental Solutions, LCC,Download at : http://www.netl.doe.gov/coal/gasification/pubs/pdf/GHGfinalADOBE.pdf (English)
Marland, G. and A.F. Turhollow [1991]: “CO2 emissions from the production and combustion of fuelethanol from corn”, Energy Vol.16, No.11/12, pp.1307-1316 (English)
Ministry of Economy, Trade and Industry (METI) [2002]: “Yearbook of Production, Supply and Demandof Petroleum, Coal and Coke 2001”
Ministry of International Trade and Industry (MITI) [1998]: “Yearbook of Production, Supply andDemand of Petroleum, Coal and Coke 1997”
Ministry of the Environment (MOE) [2002-1]: “Heisei 14 nen-do Onshitsu-koka Gasu Haisyutsu-ryouSantei Houhou Kentou-kai Enerugii Kougyou-purosesu Bunka-kai Houkoku-sho (Nenryou)” (report byenergy and industrial process subcommittee (fuel), the panel on GHG emission calculation methodology,FY2002)
Ministry of the Environment (MOE) [2002-2]: “Onshitsu-koka Gasu Haisyutsu-ryou Santei ni kansuruKentou Kekka – Dai-3-bu, Unyu Bunka-kai Houkoku-sho, Nougyou Bunka-kai Houkoku-sho, Haiki-butsu Bunka-kai Houkoku-sho” (investigation results on GHG emission calculation, part 3: report bytransport subcommittee, report by agriculture subcommittee, report by waste subcommittee), the panelon GHG emission calculation methodology
Ministry of the Environment (MOE) [2003-1]: “ ‘Jidousha no Nenryou no Seijou ni kansuru KyouGendo oyobi Jidousha no Nenryou ni Fukumareru Bussitsu no Ryou no Kyoyou Gendo’ no Ichibu Kaiseini tsuite” (Amendment to the Maximum Permissible Limit for the Quality of Motor Vehicle Fuel and forthe Quantity of Substances in Motor Vehicle Fuel), News Release on August 25, 2003

- 118 -
Ministry of the Environment (MOE) [2003-2]: “Chuuou Kankyou Shingi-kai ‘Kongo no JidousyaHaisyutsu Gasu Teigen Taisaku no arikata ni tsuite (dai 7-ji Toushin)” (publishing the 7th report of“Future Policy for Motor Vehicle Emission Reduction” by Central Environment Council), News Releaseon July 29, 2003
Mitsubishi Research Institute, Inc. (MRI), Fuji Research Institute Corporation [2002]: “Heisei 13-nendoShokuhin Risaikuru Kinkyuu Chousa Hukyuu Itaku Jigyou Houkoku-sho” (report of urgent survey onfood waste recycle and promotion project, FY 2001), commissioned by Food Industry Policy Division,General Food Policy Bureau, Ministry of Agriculture, Forestry and Fisheries (MAFF) of Japan
Myburgh, Ian S., P. W. Schaberg, J. J. Botha, I. Khalek [2000]: “Comparative Emissions Performance ofSasol Fischer-Tropsch Diesel Fuel in Current and Older Technology Heavy-Duty Engines”, SAE 2000-01-1912 (English)
NAKAJIMA, Takeshi, Takao SAKAI [1993]: “Topuso-hou Suijouki Kaishitsu Purosesu” (Topsoemethod for steam reforming process), PETROTECH, Vol. 16, No. 10, pp.84-85
NAKAMURA, Arata, Motoki SATO [2002]: “GTL: Gasu-den Kaihatsu wo Sokushin suru Opusyon tonariuru-ka – GTL Nenryou no Shijousei to Kadai –” (GTL: an option to accelerate gas wellsdevelopment? – marketability and issues of GTL fuel –”, Oil and Gas Review, November 2001, pp.10-29
New Energy and Industrial Technology Development Organization, the (NEDO) [1992]: “Paamu-yukara no Yusou-you Baio-fueru Jitsuyou Kanousei Chousa” (Research on Possibility of Utilization ofPalm Methylester for Diesel Engines), NEDO-P-9213
New Energy and Industrial Technology Development Organization, the (NEDO) [1995]: “Heisei 6-nendo Enerugii Shiyou Gourika Syuhou Kokusai Chousa” (international research on methodologies ofincreasing the efficient use of energy, FY1994)
New Energy and Industrial Technology Development Organization, the (NEDO) [1996]: “ChikyuuKankyou kara Mita Sougou-teki Kaseki Nenryou Saikuru Bunseki Hyouka Syuhou no Chousa (III)”(investigation on evaluation methodology of comprehensive fossil fuel cycle analysis from the viewpointof global environment (III)), NEDO-GET-9507
New Energy and Industrial Technology Development Organization, the (NEDO) [2000]: “Suiso RiyouKokusai Kurin Enerugi Sisutemu Gijutsu (WE-NET) Dai II-ki Kenkyu Kaihatsu Tasuku 1 SisutemuHyouka ni Kansuru Chousa Kenkyu” (International Clean Energy Network Using Hydrogen (WE-NET),Phase II – Task 1: Surveys and Studies of System Analysis), NEDO-WE-NET-9901
New Energy and Industrial Technology Development Organization, the (NEDO) [2001-1]: “Suiso RiyouKokusai Kurin Enerugi Sisutemu Gijutsu (WE-NET) Dai II ki Kenkyu Kaihatsu Tasuku 1 SisutemuHyouka ni Kansuru Chousa Kenkyu” (International Clean Energy Network Using Hydrogen (WE-NET),Phase II – Task 1: Surveys and Studies of System Analysis), NEDO-WE-NET-0001
New Energy and Industrial Technology Development Organization, the (NEDO) [2001-2]: “Suiso RiyouKokusai Kurin Enerugi Sisutemu Gijutsu (WE-NET) Dai II ki Kenkyu Kaihatsu Tasuku 7 Suiso KyoukyuSuteshon no Kaihatsu” (International Clean Energy Network Using Hydrogen (WE-NET), Phase II –Task 7: Development of Hydrogen Refueling Station), NEDO-WE-NET-0007

- 119 -
New Energy and Industrial Technology Development Organization, the (NEDO) [2001-3]: “TennenGasu wo Nenryou Denchi tou ni mochiita baai no Sougou Henkan Kouritsu no Santei ni kansuruChousa” (study on calculation of comprehensive conversion efficiency when using natural gas for fuelcells), NEDO-00
New Energy and Industrial Technology Development Organization, the (NEDO) [2002-1]: “Suiso RiyouKokusai Kurin Enerugi Sisutemu Gijutsu (WE-NET) Dai II ki Kenkyu Kaihatsu Tasuku 1 SisutemuHyouka ni Kansuru Chousa Kenkyu” (International Clean Energy Network Using Hydrogen (WE-NET),Phase II – Task 1: Surveys and Studies of System Analysis), NEDO-WE-NET-0101
New Energy and Industrial Technology Development Organization, the (NEDO) [2002-2]: “Suiso RiyouKokusai Kurin Enerugi Sisutemu Gijutsu (WE-NET) Dai II ki Kenkyu Kaihatsu Tasuku 7 Suiso KyoukyuSuteshon no Kaihatsu” (International Clean Energy Network Using Hydrogen (WE-NET), Phase II –Task 7: Development of Hydrogen Refueling Station), NEDO-WE-NET-0107
New Energy and Industrial Technology Development Organization, the (NEDO) [2003-1]: “Suiso RiyouKokusai Kuriin Enerugii Shisutemu Gijutsu (WE-NET) Dai II-ki Kenkyuu Kaihatsu Tasuku 1 SisutemuHyouka ni kansuru Chousa, Kenkyuu” (International Clean Energy Network Using Hydrogen (WE-NET), Phase II – Task 1: Surveys and Studies of System Analysis), NEDO-WE-NET-0201
New Energy and Industrial Technology Development Organization, the (NEDO) [2003-2]: “KokusaiEnerugii Siyou Gourika tou Taisaku Jigyou, Kokusai Enerugii Shouhi Kouritsu-ka tou Moderu Jigyou,Paamu-yu Riyou Baio-diizeru Nenryou Seizou Moderu Jigyou Jisshi Kanousei Chousa” (feasibilitystudy of the model project for bio-diesel fuel manufacturing from palm oil, international model projectof increasing the efficiency of energy use, International Projects for Increasing the Efficient Use ofEnergy.), NEDO-IC-02EF09
Norton, P., K. Vertin, B. Bailey, N. N. Clark, D. W. Lyons, S. Goguen, and J. Eberhardt [1998]:“Emissions from Trucks using Fischer-Tropsch Diesel Fuel”, SAE 982526 (English)
OGAWA, Yoshiki, Sung Yee YOON [1998]: “Saikutsu kara Nensyou made Guroobaru ni mita kaku-Kaseki Enerugii-gen no Onshitsu-koka no Hikaku” (Comparison of Total Green House Effects of EachFossil Energy Examining at the Global Viewpoint from Mining to Combustion), Energy Economics, 24(5), pp.30-55
OGAWA, Yukimasa, Masanori FUJITA, Yoshiteru NAKAGAWA [2003]: “Fun-nyou Shokuhin Zansa noMetan Hakkou Shisetsu ni okeru Unten Deta no Kaiseki” (Analysis of the Operation Data of a MethaneFermentation Facility that Treats Manure and Tofu Refuse), Journal of the Japan Society of WasteManagement Experts, Vol.14, No.5, pp.258-267
OKAMURA, Tomohito, Michinobu FURUKAWA, Shinichi TADA, Hisashi ISHITANI [2004]: “LNGoyobi Toshi Gasu no LCCO2 Bunseki ni okeru Chuutou Purojekuto no Inpakuto Hyouka” (ImpactAnalysis of LNG Project in the Middle East in Life Cycle CO2 Analysis of LNG and City Gas),Proceedings of the 20th Conference on Energy, Economy, and Environment

- 120 -
OHKI, Yuichi, Koichi SASAKI, Hiroki KUDO [2002]: “Mokushitsu Baiomasu Hatsuden Dounyuu notameno Kadai Chousa” (feasibility study for introduction of woody biomass power generation), R&Dreport May 2002, environment group of 2nd research division, The Institute of Energy Economics, Japan.(IEEJ), Download at : http://eneken.ieej.or.jp/data/pdf/404.pdf
Organization of the Petroleum Exporting Countries (OPEC) [2001]: “OPEC Annual Statistical Bulletin2001” (English)
Organization for the Promotion of Low Emission Vehicles [2003]: “Tennen Gasu Jidousya no Shin-gijutsu Kaihatsu Joukyou Chousa Houkoku-sho” (report on a status of technological development ofnatural gas vehicles), research project for FY2002 commissioned by Ministry of Land, Infrastructure andTransport
Osaka Gas Co., Ltd., Tokyo Gas Co., Ltd. [2003]: “Kyuuchaku-zai wo mochiita Shinki-na Tennen GasuChozou Gijutsu Kaihatsu Seika Houkoku-sho” (Report on Development of New Natural Gas StorageSystem using an Absorbent), commissioned by the New Energy and Industrial Technology DevelopmentOrganization, “Development of Immediately Effective and Innovative Technology for Energy andEnvironment” project, FY2002
Peter Ahlvik and Åke Brandberg, Ecotraffic R&D3 AB [2001]: “Well-To-Wheel Efficiency for alternativefuels from natural gas or biomass”, Publication number: 2001: 85, ISSN: 1401-9612, Download at :http://www.vv.se/publ_blank/bokhylla/miljo/2001_85/2001-85.pdf (English)
Peter Ahlvik and Åke Brandberg, Ecotraffic R&D3 AB [2002]: “Sustainable fuels, Introduction ofbiomass”, Publication number: 2002: 144, ISSN: 1401-9612, Download at : http://www.vv.se/publ_blank/bokhylla/miljo/2002_144/2002-144.pdf (English)
Petroleum Association of Japan [2000]: “Keidanren Kankyou Jisyu Koudou Keikaku Forou-appuSiryou” (follow-up material for Keidanren Voluntary Action Plan on the Environment)
Petroleum Energy Center (PEC) [1997]: “Sekiyu Seihin no Raifu Saikuru Inbentorii no Sakusei niKansuru Chousa Houkoku-sho” (report on development of life cycle inventory of petroleum products),fundamental research project for petroleum refining rationalization, FY1996, PEC-1996R-09
Petroleum Energy Center (PEC) [1998]: “Yusou dankai wo hukumeta Sekiyu Seihin no Raifu SaikuruInbentorii no Sakusei ni kansuru Chousa Houkoku-sho” (report of a study on development of life cycleinventory for petroleum products, including transport phase), research project of a rationalization basisof petroleum refinery systems, FY1997, PEC-1997R-12
Petroleum Energy Center (PEC) [2000]: “Sekiyu Seihin Yushu betsu LCI Sakusei to Sekiyu SeihinKankyou Eikyou Hyouka Chousa Houkoku-sho” (report on LCI development by type of petroleumproducts and the environmental impact analysis of petroleum products), research project of arationalization basis of petroleum refinery systems, FY1999, PEC-1999R-13
Petroleum Energy Center (PEC) [2002-1]: “Shin Nenryou-yu no waga Kuni e no Dounyuu KanouseiChousa” (feasibility study for introducing new fuel oil to Japan), PEC- 2001L-02

- 121 -
Petroleum Energy Center (PEC) [2002-2]: “Yusou-you Nenryou Raihu Saikkuru Inbentorii ni kansuruChousa Houkoku-sho – Nenryou Jidousya to Kizon Jidousha no Hikaku –” (report for the study on lifecycle inventory for transport fuels – a comparison between fuel cell and conventional vehicles), projectof a basis for technological development in petroleum industry, FY2001, PEC-2001L-04
Petroleum Energy Center (PEC) [2003]: “Suiso Syakai ni okeru Suiso Kyoukyuu-sya no Bijinesu Moderuto Sekiyu Sangyou no Ichi-zuke ni kansuru Chousa Houkoku-sho” (report on business model of hydrogensuppliers and status of petroleum industry in hydrogen society), research project related onenvironmentally-friendly petroleum, FY 2002, PEC-2002P-04
Plastic Waste Management Institute [1993]: “Purasuchikku Seihin no Shiyou-ryou Zouka ga ChikyuuKankyou ni Oyobosu Eikyou Hyouka Houkoku-sho (Kaitei-ban)” (Life Cycle Assessment of PlasticPackaging (revised edition))
PricewaterhouseCoopers [2003]: “Shell Middle Distillate Synthesis (SMDS) Update of a Life CycleApproach to Assess the Environmental Inputs and Outputs, and Associated Environmental Impacts, ofProduction and Use of Distillates from a Complex Refinery and SMDS Route”, Technical Report v 3.1(English)
SAKA, Shiro [2001]: “Baiomasu Enerugii Kankyou” (biomass, energy and the environment)、ISBN 4-901493-13-2 C3043
SATO, Motoki [2001]: “Tennen Gasu no Ekitai Nenryou-ka Gijutsu (GTL) to Sekai no Saishin Doukou”(GTL technologies and current trend of the world), PETROTECH、Vol. 24, No. 7, pp.543-548
Science and Technology Agency [1992]: “Ajia no Enerugii Riyou to Chikyuu Kankyou” (energy use inAsia and global environment), compiled by Science and Technology Policy Research Institute, Scienceand Technology Agency. Published by Printing Bureau, Ministry of Finance
Sheehan, J., V. Camobreco, J. Duffield, M. Graboski, H. Shapouri [1998]: “Life Cycle Inventory ofBiodiesel and Petroleum Diesel for Use in an Urban Bus”, Final Report, prepared by U.S. Department ofAgriculture and U.S. Department of Energy, NREL/SR-580-24089 UC Category 1503, Down-load at :http://www.nrel.gov/docs/legosti/fy98/24089.pdf (English)
Shell Gas & Power [2002]: “Gas to Liquids: Shell Middle Distillate Synthesis and the Environment”(English)
SHIGETA, Jun [1990]: “Kaseki Nenryou Riyou no tame no Nisankatanso Haisyutsu-ryou no Teiryou-tekiHyouka” (quantitative evaluation of CO2 emissions for fossil fuel use), IAE Review Quarterly, Vol.13,No.3
SUZUKI, Shin’ichi [2001]: “Mikaihatsu Gasu-den wo Shijo ni Michibiku Sekiyu-koudan GTL GijutsuKaihatsu” (leading undeveloped gas wells to the market -- GTL technological development conductedby Japan National Oil Corporation), Oil and Gas Review, November 2001, pp.10-30
TABATA, Takeshi [2002]: “Osaka Gasu ni okeru Katei-you PEFC-you Nenryou Kaishitsu Gijutsu noKaihatsu” (fuel reforming technology development for household PEFC conducted by Osaka Gas), FuelCell journal, Vol.2, No.2, pp.11-13

- 122 -
TAKI, Masato [1997]: “Chou-juushitsu-yu Gasu-ka Konbaindo Hatsuden Gijutsu Kaihatsu”(Development of Ultra-Heavy Oil Gasification Combined Power Generation Technology), techologydevelopment news Vol. 73, Research and Development Division, CHUBU Electric Power Co., Inc.
TAMURA, Itaru, Toshimasa KAGAJO, Shigeru KUWAHARA, Tomoyuki YOSHIOKA, TakahiroNAGATA, Kazuhiro KURAHASHI, Hisashi ISHITANI [1999]: “Toshi Gasu oyobi LNG no RaihuSaikuru CO2 Bunseki,”, (life cycle CO2 analysis of city gas and LNG), collected papers of 15th EnergySystem / Economics / Environment Conference, pp.419-424, Proceedings of the 15th Conference onEnergy, Economy, and Environment, pp.419-424
Tijmensen, M.JA. [2000]: “The Production of Fischer Tropsch liquids and power through biomassgasification”, Science Technology Society, Universiteit Utrecht, NWS-E-2000-29, ISBN 90-73958-62-8(English)
Transport Policy Bureau, Ministry of Transport (MOT) [1999]: “Heisei 10-nen ban Un’yu KankeiEnerugii Youran” (The survey on transport energy, 1998)
Turhollow, A.F. and R.D. Perlack [1991]: “Emission of CO2 from Energy Crop Production”, Biomassand Bioenergy Vol.1, No.3, pp.129 (English)
Wang, M.Q. [2001]: “Assessment of Well-to-Wheel Energy Use and Greenhouse Gas Emissions ofFischer-Tropsch Diesel”, Center for Transportation Research, Argonne National Laboratory (ANL),prepared for U.S. DOE, Download at : http://www.ott.doe.gov/epact/pdfs/greenhouse_gas.pdf(English)
Wang, M.Q. and H.-S. Huang [1999]: “A Full Fuel-Cycle Analysis of Energy and Emissions Impacts ofTransportation Fuels Produced from National Gas”, Center for Transportation Research, ArgonneNational Laboratory (ANL), ANL/ESD-40,Download at : http://www.transportation.anl.gov/pdfs/TA/13.pdf (English)
Waste Treatment Technology, Research Group of Recyclable Resources Assessment, Graduate School ofEngineering, Hokkaido University [1998]: “Toshi Gomi no Sougou Kanri wo Shien suru Hyoka KeisanSisutemu no Kaihatsu ni kansuru Kenkyuu” (study on development of evaluation calculating system forsupporting integrated management of solid waste).
Williams, R.H, E.D. Larson, R.E. Katofsky, and J. Chen [1995]: “Methanol and hydrogen from bio-massfor transportation”, Energy for Sustainable Development, Vol. 1, No. 5, pp.18-34 (English)
YAMAJI, Kenji (compiler/author), Hiromi YAMAMOTO, Jun’ichi FUJINO (co-authors) [2000]: “BaioEnerugii” (Bioenergy), Myosin publishing Co., Ltd., ISBN 4-88701-861-4 C0030
YUASA, Toshiaki, Masaru TAKAHASHI [1991]: “Chikyuu Kankyou Mondai to Dengen Kousei”(global environment issues and power generation mix), Energy Economics Vol.17 (8), pp.27-39