Embed Size (px)
Citation preview
Report EUR 26237 EN
WELL-TO-TANK Appendix 2 - Version 4a
Summary of energy and GHG balance of individual pathways
WELL-TO-WHEELS ANALYSIS OF FUTURE AUTOMOTIVE FUELS AND POWERTRAINS IN THE EUROPEAN CONTEXT
Au t h o r s : Robert EDWARDS (JRC), Jean-François LARIVÉ (CONCAWE), David RICKEARD (CONCAWE), Werner WEINDORF (LBST) E d i t o r s : Simon Godwin (EUCAR), Heinz Hass (Ford/EUCAR), Alois Krasenbrink (JRC), Laura Lonza (JRC), Heiko Maas (Ford), Robin Nelson (CONCAWE), Alan Reid (CONCAWE), Kenneth D. Rose (CONCAWE)
2 0 1 4
European Commission
Joint Research Centre
Institute for Energy and Transport
Contact information
Laura Lonza
Address: Joint Research Centre, Via Enrico Fermi 2749, TP 230, 21027 Ispra (VA), Italy
E-mail: [email protected]
Tel.: +39 0332 78 3902
Fax: +39 0332 78 6671
http://iet.jrc.ec.europa.eu/
http://www.jrc.ec.europa.eu/
This publication is a Technical Report by the Joint Research Centre of the European Commission.
Legal Notice
This publication is a Technical Report by the Joint Research Centre, the European Commission’s in-house science service.
It aims to provide evidence-based scientific support to the European policy-making process. The scientific output expressed does not imply a
policy position of the European Commission. Neither the European Commission nor any person acting on behalf of the Commission is
responsible for the use which might be made of this publication.
JRC85326
EUR 26237 EN
ISBN 978-92-79-33888-5 (pdf)
ISSN 1831-9424 (online)
doi:10.2790/95629
Luxembourg: Publications Office of the European Union, 2014
© European Union, 2014
Reproduction is authorised provided the source is acknowledged.
Printed in Italy
WELLWELLWELLWELL----TOTOTOTO----WHEELS ANALYSIS OF FWHEELS ANALYSIS OF FWHEELS ANALYSIS OF FWHEELS ANALYSIS OF FUTURE UTURE UTURE UTURE AUTOMOTIVE FUELS ANDAUTOMOTIVE FUELS ANDAUTOMOTIVE FUELS ANDAUTOMOTIVE FUELS AND POWERTRAINS IN POWERTRAINS IN POWERTRAINS IN POWERTRAINS IN
THE EUROPEAN CONTEXTTHE EUROPEAN CONTEXTTHE EUROPEAN CONTEXTTHE EUROPEAN CONTEXT
WELLWELLWELLWELL----TOTOTOTO----TANK TANK TANK TANK (WTT) (WTT) (WTT) (WTT) RRRREPORTEPORTEPORTEPORT –––– AAAAPPENDIXPPENDIXPPENDIXPPENDIX 2222
VVVVERSIONERSIONERSIONERSION 4444aaaa, , , , APRIL APRIL APRIL APRIL 2012012012014444

Well-to-Wheels analysis of future automotive fuels and powertrains in the European context WELL-TO-TANK Report
This report is available as an ADOBE pdf file on the JRC/IET website at:
http://iet.jrc.ec.europa.eu/about-jec
Questions and remarks may be sent to:
Notes on version number: This is version 4a of this report replacing version 4 published in July 2013.
Well-to-Wheels analysis of future automotive fuels and powertrains in the European context WELL-TO-TANK Report
AcknowledgmentsAcknowledgmentsAcknowledgmentsAcknowledgments This JEC Consortium study was carried out jointly by experts from the JRC (EU Commission’s Joint Research Centre), EUCAR (the European Council for Automotive R&D), and CONCAWE (the oil companies’ European association for environment, health and safety in refining and distribution), assisted by experts from Ludwig-Bölkow-Systemtechnik GmbH (LBST) and AVL List GmbH (AVL).
Main Authors, Well-to-Tank (WTT) Report R. Edwards JRC J-F. Larivé CONCAWE D. Rickeard CONCAWE W. Weindorf LBST JEC Scientific Advisory Board R. Edwards JRC S. Godwin EUCAR H. Hass EUCAR/Ford A. Krasenbrink JRC L. Lonza JRC H. Maas EUCAR/Ford R. Nelson CONCAWE A. Reid CONCAWE K. Rose CONCAWE H.Hamje CONCAWE
JRC Task Force CONCAWE Task Force A. Agostini JRC F. Bernard TOTAL R. Edwards JRC S. Boreux TOTAL J. Giuntoli JRC V. Court CONCAWE M. Kousoulidou JRC C. Diaz Garcia Repsol L. Lonza JRC J. Farenback-Brateman ExxonMobil A. Moro JRC S. Kuusisto Neste Oil M. Padella JRC J-F. Larivé CONCAWE R. Malpas Shell EUCAR Task Force E. Marin Repsol T. Becker Opel C. Olivares Molina CEPSA V. Boch Renault C. Price Shell B. Bossdorf-Zimmer VW A. Rankine BP H-P. Deeg Porsche A. Reid CONCAWE V. Formanski Opel D. Rickeard CONCAWE T. Galovic BMW K. Rose CONCAWE A. Gerini Fiat T. Venderbosch CONCAWE H. Hass Ford H. Hamje CONCAWE F. Herb Daimler E. Iverfeldt Scania LBST (Well-to-Tank Consultant) L. Jacobs Volvo W. Weindorf J. Klemmer Opel H. Mass Ford AVL Consultants B. Moeller Daimler A. Huss B. Perrier PSA R. Albrecht W. Prestl BMW E. Morra J. Rizzon Daimler A. Roj Volvo A. Schattauer BMW J. Wind Daimler

Well-to-Wheels analysis of future automotive fuels and powertrains in the European context WELL-TO-TANK Report Version 4a, April 2014
Well-to-Wheels analysis of future automotive fuels and powertrains in the European context WELL-TO-TANK Report Version 4a, April 2014
WTT APPENDIX 2
WTT Appendix 2 v4a April 2014 Page 7 of 32
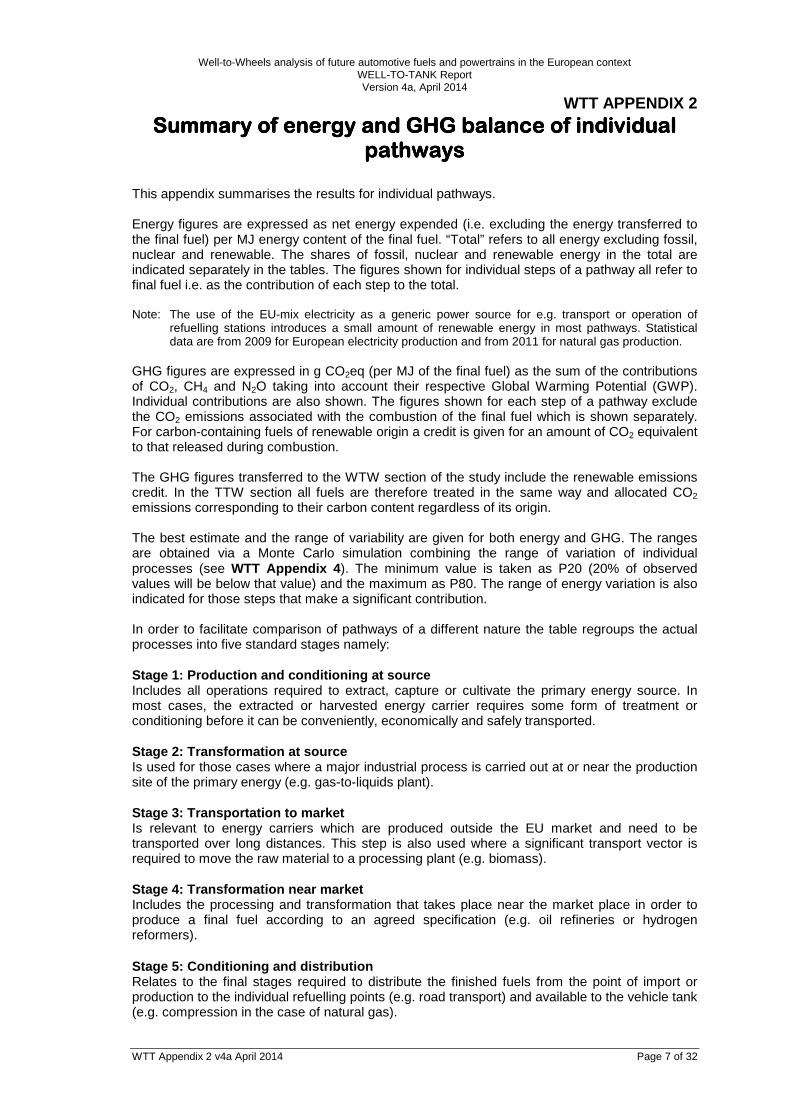
Summary of energy andSummary of energy andSummary of energy andSummary of energy and GHG balance of individual GHG balance of individual GHG balance of individual GHG balance of individual pathwayspathwayspathwayspathways
This appendix summarises the results for individual pathways. Energy figures are expressed as net energy expended (i.e. excluding the energy transferred to the final fuel) per MJ energy content of the final fuel. “Total” refers to all energy excluding fossil, nuclear and renewable. The shares of fossil, nuclear and renewable energy in the total are indicated separately in the tables. The figures shown for individual steps of a pathway all refer to final fuel i.e. as the contribution of each step to the total. Note: The use of the EU-mix electricity as a generic power source for e.g. transport or operation of
refuelling stations introduces a small amount of renewable energy in most pathways. Statistical data are from 2009 for European electricity production and from 2011 for natural gas production.
GHG figures are expressed in g CO2eq (per MJ of the final fuel) as the sum of the contributions of CO2, CH4 and N2O taking into account their respective Global Warming Potential (GWP). Individual contributions are also shown. The figures shown for each step of a pathway exclude the CO2 emissions associated with the combustion of the final fuel which is shown separately. For carbon-containing fuels of renewable origin a credit is given for an amount of CO2 equivalent to that released during combustion. The GHG figures transferred to the WTW section of the study include the renewable emissions credit. In the TTW section all fuels are therefore treated in the same way and allocated CO2 emissions corresponding to their carbon content regardless of its origin. The best estimate and the range of variability are given for both energy and GHG. The ranges are obtained via a Monte Carlo simulation combining the range of variation of individual processes (see WTT Appendix 4). The minimum value is taken as P20 (20% of observed values will be below that value) and the maximum as P80. The range of energy variation is also indicated for those steps that make a significant contribution. In order to facilitate comparison of pathways of a different nature the table regroups the actual processes into five standard stages namely: Stage 1: Production and conditioning at source Includes all operations required to extract, capture or cultivate the primary energy source. In most cases, the extracted or harvested energy carrier requires some form of treatment or conditioning before it can be conveniently, economically and safely transported. Stage 2: Transformation at source Is used for those cases where a major industrial process is carried out at or near the production site of the primary energy (e.g. gas-to-liquids plant). Stage 3: Transportation to market Is relevant to energy carriers which are produced outside the EU market and need to be transported over long distances. This step is also used where a significant transport vector is required to move the raw material to a processing plant (e.g. biomass). Stage 4: Transformation near market Includes the processing and transformation that takes place near the market place in order to produce a final fuel according to an agreed specification (e.g. oil refineries or hydrogen reformers). Stage 5: Conditioning and distribution Relates to the final stages required to distribute the finished fuels from the point of import or production to the individual refuelling points (e.g. road transport) and available to the vehicle tank (e.g. compression in the case of natural gas).
Well-to-Wheels analysis of future automotive fuels and powertrains in the European context WELL-TO-TANK Report Version 4a, April 2014
WTT APPENDIX 2
WTT Appendix 2 v4a April 2014 Page 8 of 32
Pathway listPathway listPathway listPathway list
1 Summary of energy and GHG balances 9
1.1 Oil-based fuels and CNG 9
1.2 Biogas and synthetic methane 11
1.3 Ethanol 12
1.4 Biodiesel 15
1.5 Synfuels 18
1.6 Electricity 21
1.7 Heat and Power 24
Well-to-Wheels analysis of future automotive fuels and powertrains in the European context WELL-TO-TANK Report Version 4a, April 2014
WTT APPENDIX 2
WTT Appendix 2 v4a, April 2014 Page 9 of 32
1111 Summary of energy and GHG balancesSummary of energy and GHG balancesSummary of energy and GHG balancesSummary of energy and GHG balances
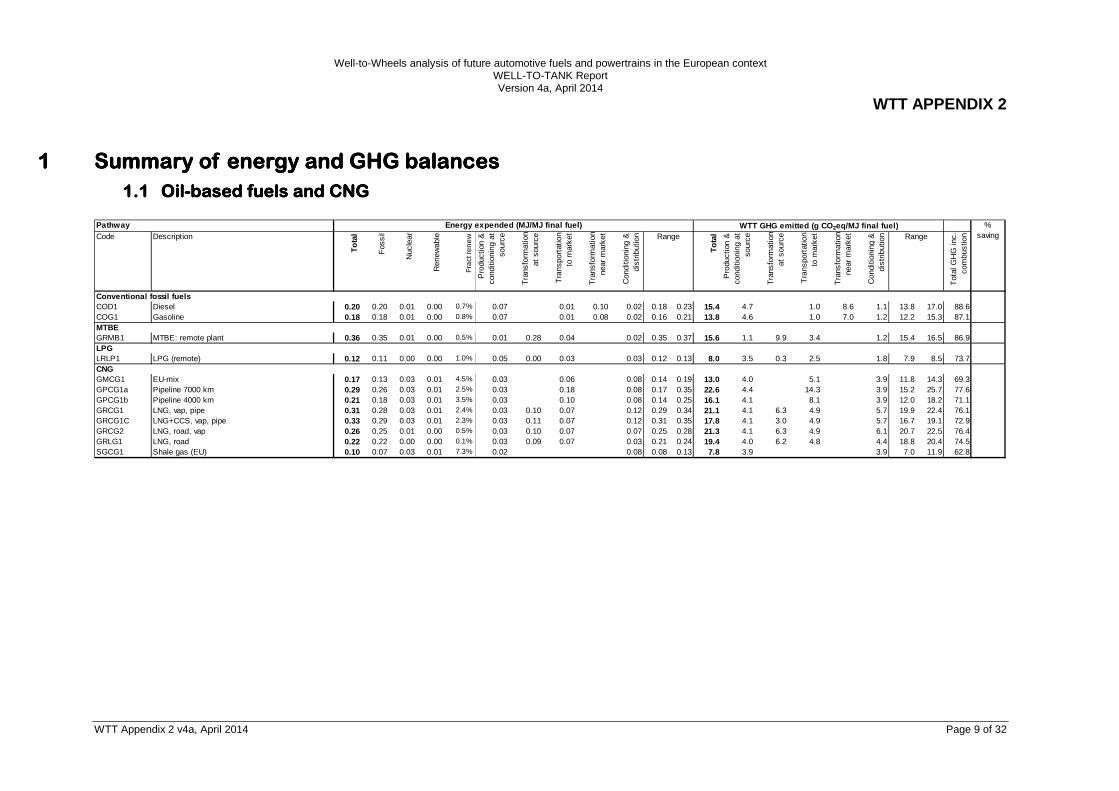
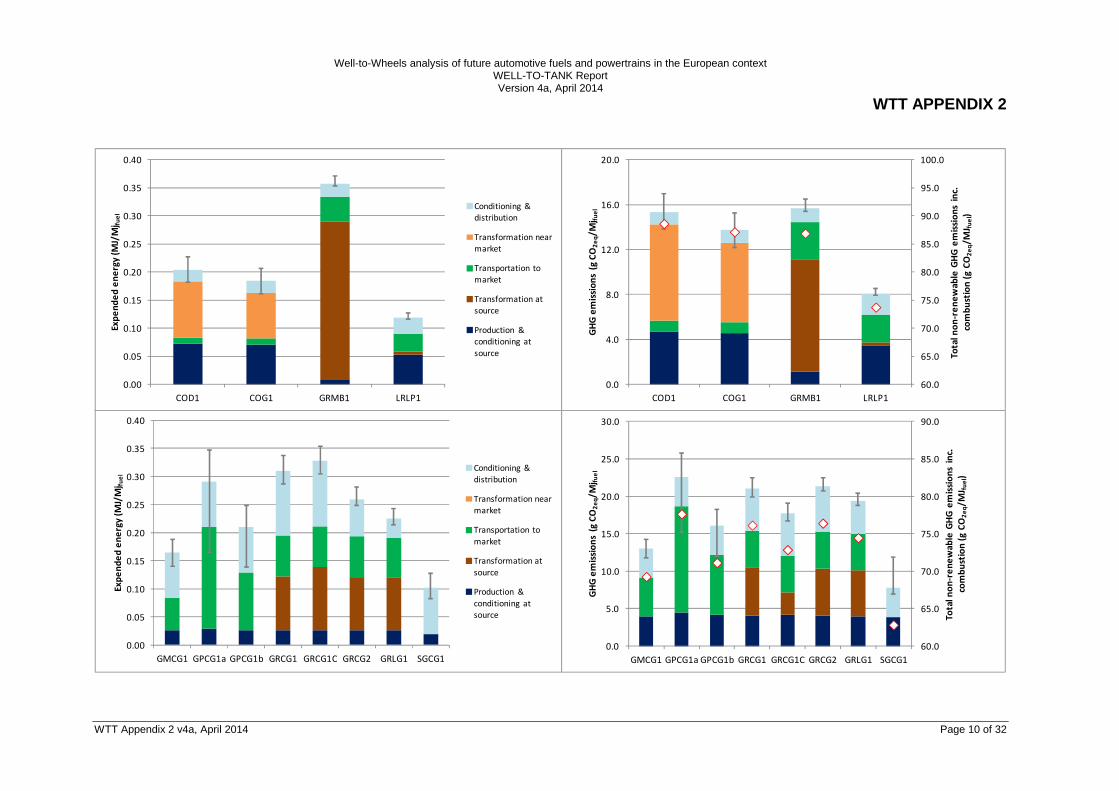
1.11.11.11.1 OilOilOilOil----based fuelsbased fuelsbased fuelsbased fuels and CNG and CNG and CNG and CNG PathwayCode Description
To
tal
Fos
sil
Nuc
lear
Ren
ewab
le
Fra
ct re
ne
w
Pro
duct
ion
&
cond
ition
ing
at
sour
ce
Tra
nsfo
rmat
ion
at s
ourc
e
Tra
nspo
rtat
ion
to m
arke
t
Tra
nsfo
rmat
ion
near
mar
ket
Con
ditio
ning
&
dist
ribut
ion Range
To
tal
Pro
duct
ion
&
cond
ition
ing
at
sour
ce
Tra
nsfo
rmat
ion
at s
ourc
e
Tra
nspo
rtat
ion
to m
arke
t
Tra
nsfo
rmat
ion
near
mar
ket
Con
ditio
ning
&
dist
ribut
ion Range
Tot
al G
HG
inc.
co
mbu
stio
n
Conventional fossil fuelsCOD1 Diesel 0.20 0.20 0.01 0.00 0.7% 0.07 0.01 0.10 0.02 0.18 0.23 15.4 4.7 1.0 8.6 1.1 13.8 17.0 88.6COG1 Gasoline 0.18 0.18 0.01 0.00 0.8% 0.07 0.01 0.08 0.02 0.16 0.21 13.8 4.6 1.0 7.0 1.2 12.2 15.3 87.1MTBEGRMB1 MTBE: remote plant 0.36 0.35 0.01 0.00 0.5% 0.01 0.28 0.04 0.02 0.35 0.37 15.6 1.1 9.9 3.4 1.2 15.4 16.5 86.9LPGLRLP1 LPG (remote) 0.12 0.11 0.00 0.00 1.0% 0.05 0.00 0.03 0.03 0.12 0.13 8.0 3.5 0.3 2.5 1.8 7.9 8.5 73.7CNGGMCG1 EU-mix 0.17 0.13 0.03 0.01 4.5% 0.03 0.06 0.08 0.14 0.19 13.0 4.0 5.1 3.9 11.8 14.3 69.3GPCG1a Pipeline 7000 km 0.29 0.26 0.03 0.01 2.5% 0.03 0.18 0.08 0.17 0.35 22.6 4.4 14.3 3.9 15.2 25.7 77.6GPCG1b Pipeline 4000 km 0.21 0.18 0.03 0.01 3.5% 0.03 0.10 0.08 0.14 0.25 16.1 4.1 8.1 3.9 12.0 18.2 71.1GRCG1 LNG, vap, pipe 0.31 0.28 0.03 0.01 2.4% 0.03 0.10 0.07 0.12 0.29 0.34 21.1 4.1 6.3 4.9 5.7 19.9 22.4 76.1GRCG1C LNG+CCS, vap, pipe 0.33 0.29 0.03 0.01 2.3% 0.03 0.11 0.07 0.12 0.31 0.35 17.8 4.1 3.0 4.9 5.7 16.7 19.1 72.9GRCG2 LNG, road, vap 0.26 0.25 0.01 0.00 0.5% 0.03 0.10 0.07 0.07 0.25 0.28 21.3 4.1 6.3 4.9 6.1 20.7 22.5 76.4GRLG1 LNG, road 0.22 0.22 0.00 0.00 0.1% 0.03 0.09 0.07 0.03 0.21 0.24 19.4 4.0 6.2 4.8 4.4 18.8 20.4 74.5SGCG1 Shale gas (EU) 0.10 0.07 0.03 0.01 7.3% 0.02 0.08 0.08 0.13 7.8 3.9 3.9 7.0 11.9 62.8
Energy expended (MJ/MJ final fuel) WTT GHG emitted (g CO2eq/MJ final fuel) %saving
Well-to-Wheels analysis of future automotive fuels and powertrains in the European context WELL-TO-TANK Report Version 4a, April 2014
WTT APPENDIX 2
WTT Appendix 2 v4a, April 2014 Page 10 of 32
0.00
0.05
0.10
0.15
0.20
0.25
0.30
0.35
0.40
COD1 COG1 GRMB1 LRLP1
Ex
pe
nd
ed
en
erg
y (
MJ/
Mj f
ue
l
Conditioning &
distribution
Transformation near
market
Transportation to
market
Transformation at
source
Production &
conditioning at
source
60.0
65.0
70.0
75.0
80.0
85.0
90.0
95.0
100.0
0.0
4.0
8.0
12.0
16.0
20.0
COD1 COG1 GRMB1 LRLP1
To
tal
no
n-r
en
ew
ab
le G
HG
em
issi
on
s in
c.
com
bu
stio
n (
g C
O2
eq/M
J fu
el)
GH
G e
mis
sio
ns
(g C
O2
eq/
Mj f
ue
l
0.00
0.05
0.10
0.15
0.20
0.25
0.30
0.35
0.40
GMCG1 GPCG1a GPCG1b GRCG1 GRCG1C GRCG2 GRLG1 SGCG1
Ex
pe
nd
ed
en
erg
y (
MJ/
Mj f
ue
l
Conditioning &
distribution
Transformation near
market
Transportation to
market
Transformation at
source
Production &
conditioning at
source
60.0
65.0
70.0
75.0
80.0
85.0
90.0
0.0
5.0
10.0
15.0
20.0
25.0
30.0
GMCG1 GPCG1a GPCG1b GRCG1 GRCG1C GRCG2 GRLG1 SGCG1
To
tal
no
n-r
en
ew
ab
le G
HG
em
issi
on
s in
c.
com
bu
stio
n (
g C
O2
eq/
MJ f
ue
l)
GH
G e
mis
sio
ns
(g C
O2
eq/
Mj f
ue
l
Well-to-Wheels analysis of future automotive fuels and powertrains in the European context WELL-TO-TANK Report Version 4a, April 2014
WTT APPENDIX 2
WTT Appendix 2 v4a, April 2014 Page 11 of 32
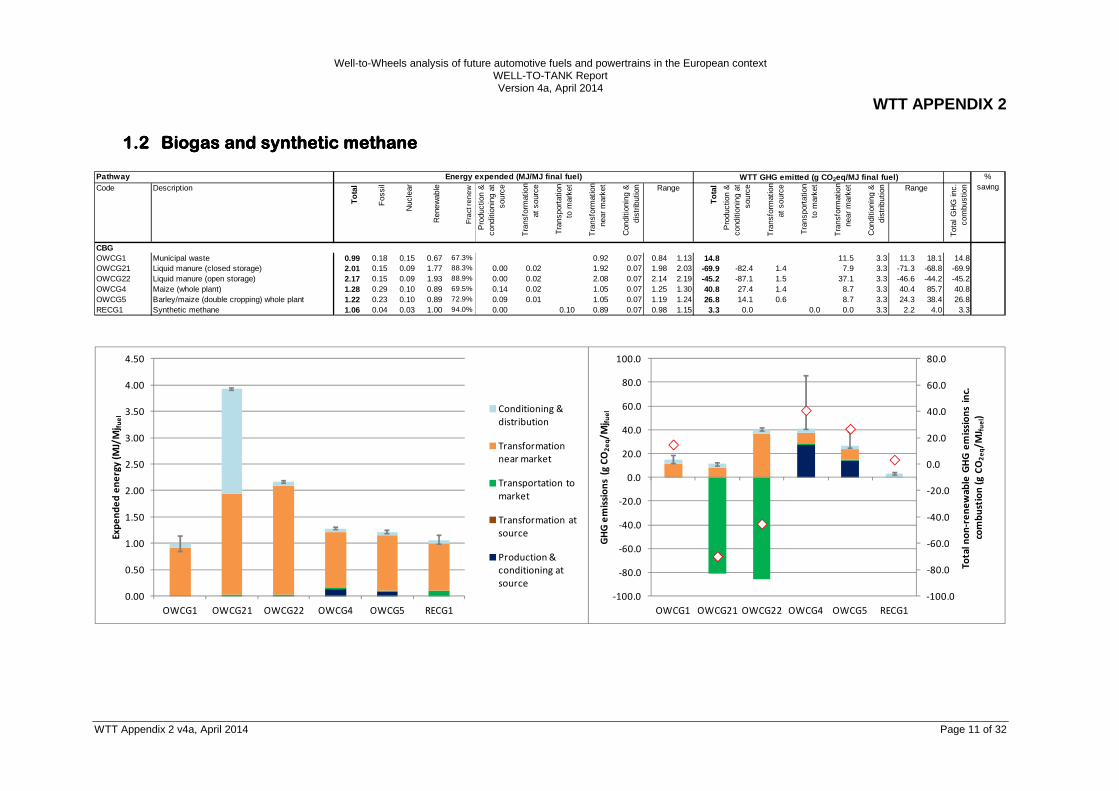
1.21.21.21.2 BiogasBiogasBiogasBiogas and synthetic methaneand synthetic methaneand synthetic methaneand synthetic methane PathwayCode Description
To
tal
Fos
sil
Nuc
lear
Ren
ewab
le
Fra
ct r
ene
w
Pro
duct
ion
&
cond
ition
ing
at
sour
ce
Tra
nsfo
rmat
ion
at s
ourc
e
Tra
nspo
rtat
ion
to m
arke
t
Tra
nsfo
rmat
ion
near
mar
ket
Con
ditio
ning
&
dist
ribut
ion Range
To
tal
Pro
duct
ion
&
cond
ition
ing
at
sour
ce
Tra
nsfo
rmat
ion
at s
ourc
e
Tra
nspo
rtat
ion
to m
arke
t
Tra
nsfo
rmat
ion
near
mar
ket
Con
ditio
ning
&
dist
ribut
ion Range
Tot
al G
HG
inc.
co
mbu
stio
n
CBGOWCG1 Municipal waste 0.99 0.18 0.15 0.67 67.3% 0.92 0.07 0.84 1.13 14.8 11.5 3.3 11.3 18.1 14.8OWCG21 Liquid manure (closed storage) 2.01 0.15 0.09 1.77 88.3% 0.00 0.02 1.92 0.07 1.98 2.03 -69.9 -82.4 1.4 7.9 3.3 -71.3 -68.8 -69.9OWCG22 Liquid manure (open storage) 2.17 0.15 0.09 1.93 88.9% 0.00 0.02 2.08 0.07 2.14 2.19 -45.2 -87.1 1.5 37.1 3.3 -46.6 -44.2 -45.2OWCG4 Maize (whole plant) 1.28 0.29 0.10 0.89 69.5% 0.14 0.02 1.05 0.07 1.25 1.30 40.8 27.4 1.4 8.7 3.3 40.4 85.7 40.8OWCG5 Barley/maize (double cropping) whole plant 1.22 0.23 0.10 0.89 72.9% 0.09 0.01 1.05 0.07 1.19 1.24 26.8 14.1 0.6 8.7 3.3 24.3 38.4 26.8RECG1 Synthetic methane 1.06 0.04 0.03 1.00 94.0% 0.00 0.10 0.89 0.07 0.98 1.15 3.3 0.0 0.0 0.0 3.3 2.2 4.0 3.3
Energy expended (MJ/MJ final fuel) WTT GHG emitted (g CO2eq/MJ final fuel) %saving
0.00
0.50
1.00
1.50
2.00
2.50
3.00
3.50
4.00
4.50
OWCG1 OWCG21 OWCG22 OWCG4 OWCG5 RECG1
Ex
pe
nd
ed
en
erg
y (
MJ/
Mj f
ue
l
Conditioning &
distribution
Transformation
near market
Transportation to
market
Transformation at
source
Production &
conditioning at
source
-100.0
-80.0
-60.0
-40.0
-20.0
0.0
20.0
40.0
60.0
80.0
-100.0
-80.0
-60.0
-40.0
-20.0
0.0
20.0
40.0
60.0
80.0
100.0
OWCG1 OWCG21 OWCG22 OWCG4 OWCG5 RECG1
To
tal
no
n-r
en
ew
ab
le G
HG
em
issi
on
s in
c.
com
bu
stio
n (
g C
O2
eq/
MJ f
ue
l)
GH
G e
mis
sio
ns
(g C
O2
eq/
Mj f
ue
l
Well-to-Wheels analysis of future automotive fuels and powertrains in the European context WELL-TO-TANK Report Version 4a, April 2014
WTT APPENDIX 2
WTT Appendix 2 v4a, April 2014 Page 12 of 32
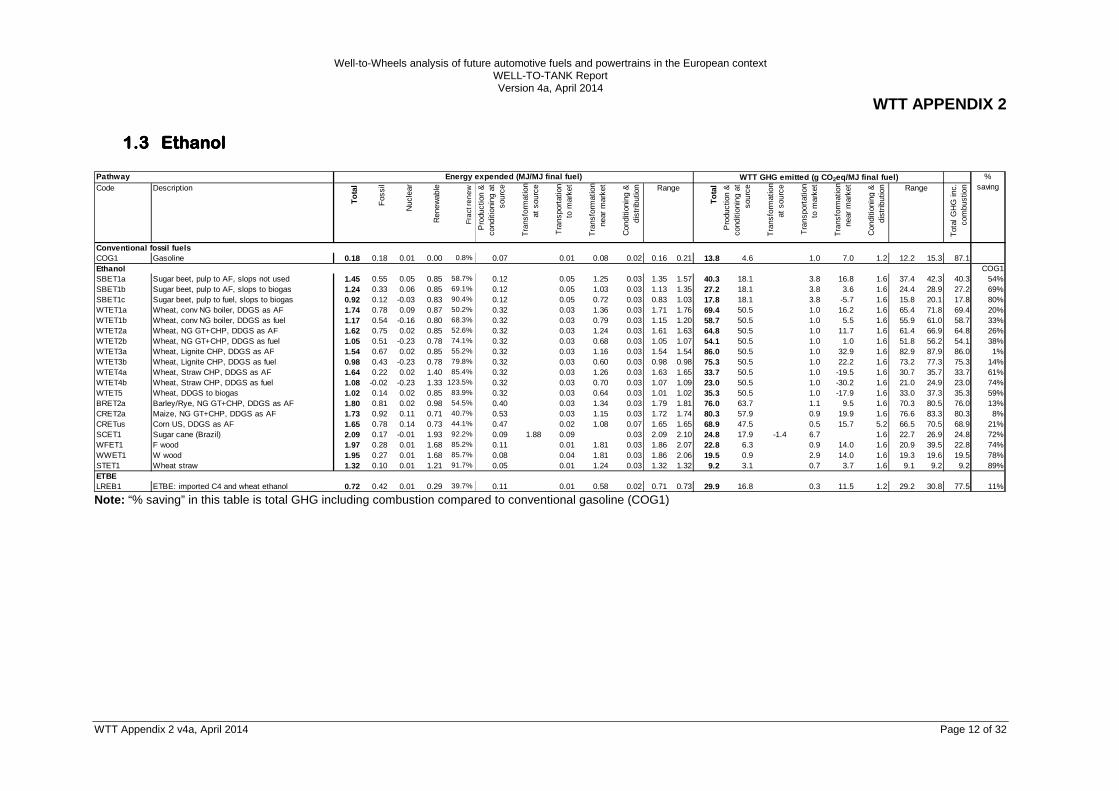
1.31.31.31.3 EthanolEthanolEthanolEthanol PathwayCode Description
To
tal
Fos
sil
Nuc
lear
Ren
ewab
le
Fra
ct re
ne
w
Pro
duct
ion
&
cond
ition
ing
at
sour
ce
Tra
nsfo
rmat
ion
at s
ourc
e
Tra
nspo
rtat
ion
to m
arke
t
Tra
nsfo
rmat
ion
near
mar
ket
Con
ditio
ning
&
dist
ribut
ion Range
To
tal
Pro
duct
ion
&
cond
ition
ing
at
sour
ce
Tra
nsfo
rmat
ion
at s
ourc
e
Tra
nspo
rtat
ion
to m
arke
t
Tra
nsfo
rmat
ion
near
mar
ket
Con
ditio
ning
&
dist
ribut
ion Range
Tot
al G
HG
inc.
co
mbu
stio
n
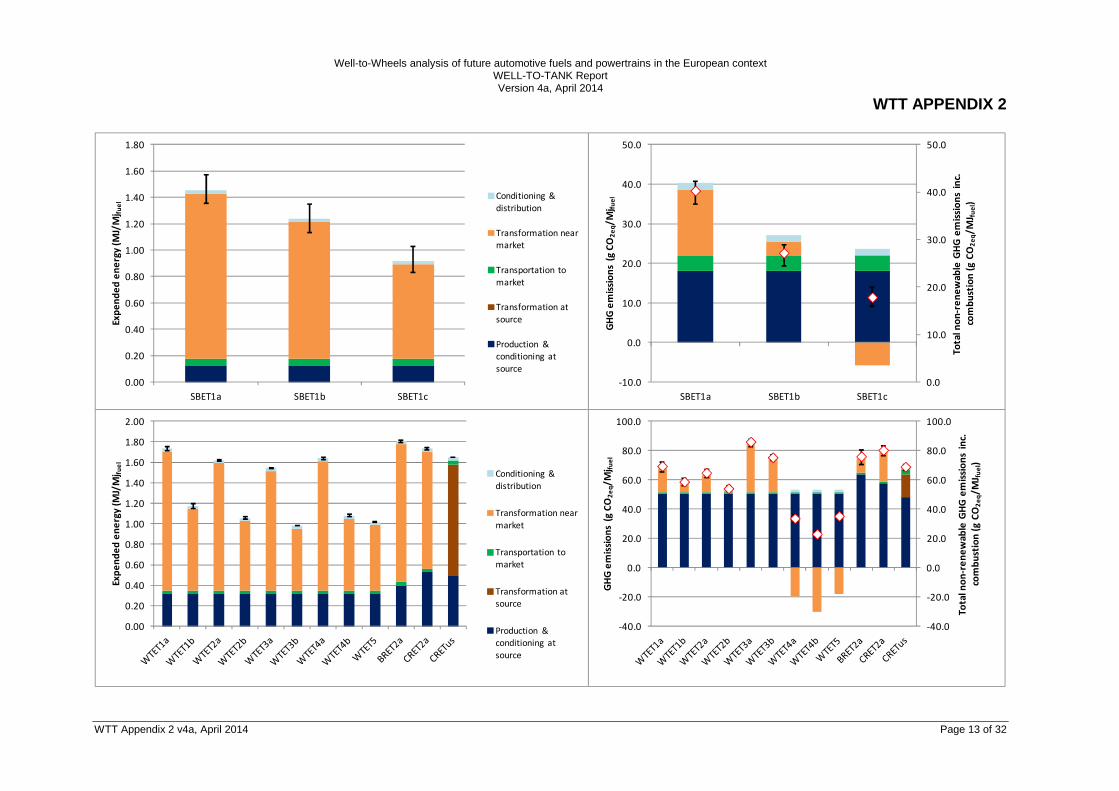
Conventional fossil fuelsCOG1 Gasoline 0.18 0.18 0.01 0.00 0.8% 0.07 0.01 0.08 0.02 0.16 0.21 13.8 4.6 1.0 7.0 1.2 12.2 15.3 87.1Ethanol COG1SBET1a Sugar beet, pulp to AF, slops not used 1.45 0.55 0.05 0.85 58.7% 0.12 0.05 1.25 0.03 1.35 1.57 40.3 18.1 3.8 16.8 1.6 37.4 42.3 40.3 54%SBET1b Sugar beet, pulp to AF, slops to biogas 1.24 0.33 0.06 0.85 69.1% 0.12 0.05 1.03 0.03 1.13 1.35 27.2 18.1 3.8 3.6 1.6 24.4 28.9 27.2 69%SBET1c Sugar beet, pulp to fuel, slops to biogas 0.92 0.12 -0.03 0.83 90.4% 0.12 0.05 0.72 0.03 0.83 1.03 17.8 18.1 3.8 -5.7 1.6 15.8 20.1 17.8 80%WTET1a Wheat, conv NG boiler, DDGS as AF 1.74 0.78 0.09 0.87 50.2% 0.32 0.03 1.36 0.03 1.71 1.76 69.4 50.5 1.0 16.2 1.6 65.4 71.8 69.4 20%WTET1b Wheat, conv NG boiler, DDGS as fuel 1.17 0.54 -0.16 0.80 68.3% 0.32 0.03 0.79 0.03 1.15 1.20 58.7 50.5 1.0 5.5 1.6 55.9 61.0 58.7 33%WTET2a Wheat, NG GT+CHP, DDGS as AF 1.62 0.75 0.02 0.85 52.6% 0.32 0.03 1.24 0.03 1.61 1.63 64.8 50.5 1.0 11.7 1.6 61.4 66.9 64.8 26%WTET2b Wheat, NG GT+CHP, DDGS as fuel 1.05 0.51 -0.23 0.78 74.1% 0.32 0.03 0.68 0.03 1.05 1.07 54.1 50.5 1.0 1.0 1.6 51.8 56.2 54.1 38%WTET3a Wheat, Lignite CHP, DDGS as AF 1.54 0.67 0.02 0.85 55.2% 0.32 0.03 1.16 0.03 1.54 1.54 86.0 50.5 1.0 32.9 1.6 82.9 87.9 86.0 1%WTET3b Wheat, Lignite CHP, DDGS as fuel 0.98 0.43 -0.23 0.78 79.8% 0.32 0.03 0.60 0.03 0.98 0.98 75.3 50.5 1.0 22.2 1.6 73.2 77.3 75.3 14%WTET4a Wheat, Straw CHP, DDGS as AF 1.64 0.22 0.02 1.40 85.4% 0.32 0.03 1.26 0.03 1.63 1.65 33.7 50.5 1.0 -19.5 1.6 30.7 35.7 33.7 61%WTET4b Wheat, Straw CHP, DDGS as fuel 1.08 -0.02 -0.23 1.33 123.5% 0.32 0.03 0.70 0.03 1.07 1.09 23.0 50.5 1.0 -30.2 1.6 21.0 24.9 23.0 74%WTET5 Wheat, DDGS to biogas 1.02 0.14 0.02 0.85 83.9% 0.32 0.03 0.64 0.03 1.01 1.02 35.3 50.5 1.0 -17.9 1.6 33.0 37.3 35.3 59%BRET2a Barley/Rye, NG GT+CHP, DDGS as AF 1.80 0.81 0.02 0.98 54.5% 0.40 0.03 1.34 0.03 1.79 1.81 76.0 63.7 1.1 9.5 1.6 70.3 80.5 76.0 13%CRET2a Maize, NG GT+CHP, DDGS as AF 1.73 0.92 0.11 0.71 40.7% 0.53 0.03 1.15 0.03 1.72 1.74 80.3 57.9 0.9 19.9 1.6 76.6 83.3 80.3 8%CRETus Corn US, DDGS as AF 1.65 0.78 0.14 0.73 44.1% 0.47 0.02 1.08 0.07 1.65 1.65 68.9 47.5 0.5 15.7 5.2 66.5 70.5 68.9 21%SCET1 Sugar cane (Brazil) 2.09 0.17 -0.01 1.93 92.2% 0.09 1.88 0.09 0.03 2.09 2.10 24.8 17.9 -1.4 6.7 1.6 22.7 26.9 24.8 72%WFET1 F wood 1.97 0.28 0.01 1.68 85.2% 0.11 0.01 1.81 0.03 1.86 2.07 22.8 6.3 0.9 14.0 1.6 20.9 39.5 22.8 74%WWET1 W wood 1.95 0.27 0.01 1.68 85.7% 0.08 0.04 1.81 0.03 1.86 2.06 19.5 0.9 2.9 14.0 1.6 19.3 19.6 19.5 78%STET1 Wheat straw 1.32 0.10 0.01 1.21 91.7% 0.05 0.01 1.24 0.03 1.32 1.32 9.2 3.1 0.7 3.7 1.6 9.1 9.2 9.2 89%ETBELREB1 ETBE: imported C4 and wheat ethanol 0.72 0.42 0.01 0.29 39.7% 0.11 0.01 0.58 0.02 0.71 0.73 29.9 16.8 0.3 11.5 1.2 29.2 30.8 77.5 11%
Energy expended (MJ/MJ final fuel) WTT GHG emitted (g CO2eq/MJ final fuel) %saving
Note: “% saving” in this table is total GHG including combustion compared to conventional gasoline (COG1)
Well-to-Wheels analysis of future automotive fuels and powertrains in the European context WELL-TO-TANK Report Version 4a, April 2014
WTT APPENDIX 2
WTT Appendix 2 v4a, April 2014 Page 13 of 32
0.00
0.20
0.40
0.60
0.80
1.00
1.20
1.40
1.60
1.80
SBET1a SBET1b SBET1c
Ex
pe
nd
ed
en
erg
y (
MJ/
Mj f
ue
l
Conditioning &
distribution
Transformation near
market
Transportation to
market
Transformation at
source
Production &
conditioning at
source
0.0
10.0
20.0
30.0
40.0
50.0
-10.0
0.0
10.0
20.0
30.0
40.0
50.0
SBET1a SBET1b SBET1c
To
tal
no
n-r
en
ew
ab
le G
HG
em
issi
on
s in
c.
com
bu
stio
n (
g C
O2
eq/
MJ f
ue
l)
GH
G e
mis
sio
ns
(g C
O2
eq/
Mj f
ue
l
0.00
0.20
0.40
0.60
0.80
1.00
1.20
1.40
1.60
1.80
2.00
Ex
pe
nd
ed
en
erg
y (
MJ/
Mj f
ue
l
Conditioning &
distribution
Transformation near
market
Transportation to
market
Transformation at
source
Production &
conditioning at
source
-40.0
-20.0
0.0
20.0
40.0
60.0
80.0
100.0
-40.0
-20.0
0.0
20.0
40.0
60.0
80.0
100.0
To
tal
no
n-r
en
ew
ab
le G
HG
em
issi
on
s in
c.
com
bu
stio
n (
g C
O2
eq/
MJ f
ue
l)
GH
G e
mis
sio
ns
(g C
O2
eq/
Mj f
ue
l

Well-to-Wheels analysis of future automotive fuels and powertrains in the European context WELL-TO-TANK Report Version 4a, April 2014
WTT APPENDIX 2
WTT Appendix 2 v4a, April 2014 Page 14 of 32
0.00
0.50
1.00
1.50
2.00
2.50
SCET1 WFET1 WWET1 STET1 LREB1
Ex
pe
nd
ed
en
erg
y (
MJ/
Mj f
ue
l Conditioning &
distribution
Transformation near
market
Transportation to
market
Transformation at
source
Production &
conditioning at
source -20.0
-10.0
0.0
10.0
20.0
30.0
40.0
50.0
60.0
70.0
80.0
90.0
-10.0
0.0
10.0
20.0
30.0
40.0
SCET1 WFET1 WWET1 STET1 LREB1
To
tal
no
n-r
en
ew
ab
le G
HG
em
issi
on
s in
c.
com
bu
stio
n (
g C
O2
eq/
MJ f
ue
l)
GH
G e
mis
sio
ns
(g C
O2
eq/
Mj f
ue
l
Well-to-Wheels analysis of future automotive fuels and powertrains in the European context WELL-TO-TANK Report Version 4a, April 2014
WTT APPENDIX 2
WTT Appendix 2 v4a, April 2014 Page 15 of 32
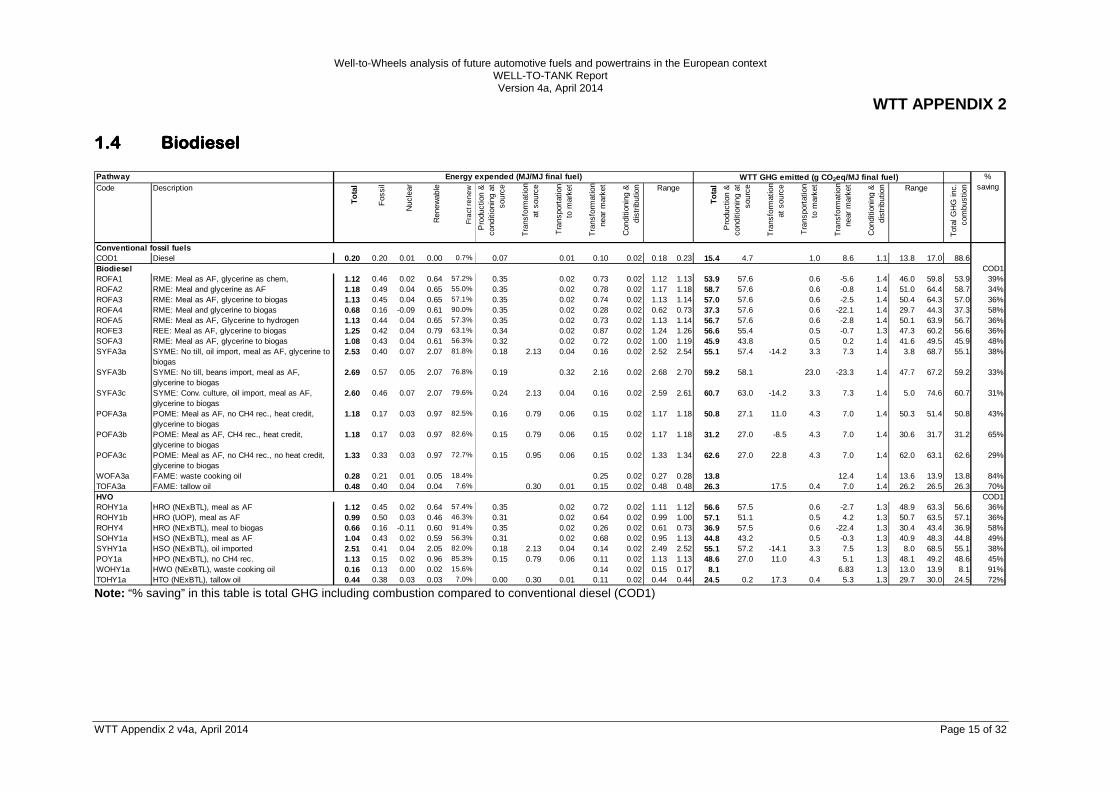
1.41.41.41.4 BiodieselBiodieselBiodieselBiodiesel PathwayCode Description
To
tal
Fos
sil
Nuc
lear
Ren
ewab
le
Fra
ct re
ne
w
Pro
duct
ion
&
cond
ition
ing
at
sour
ce
Tra
nsfo
rmat
ion
at s
ourc
e
Tra
nspo
rtat
ion
to m
arke
t
Tra
nsfo
rmat
ion
near
mar
ket
Con
ditio
ning
&
dist
ribut
ion Range
To
tal
Pro
duct
ion
&
cond
ition
ing
at
sour
ce
Tra
nsfo
rmat
ion
at s
ourc
e
Tra
nspo
rtat
ion
to m
arke
t
Tra
nsfo
rmat
ion
near
mar
ket
Con
ditio
ning
&
dist
ribut
ion Range
Tot
al G
HG
inc.
co
mbu
stio
n
Conventional fossil fuelsCOD1 Diesel 0.20 0.20 0.01 0.00 0.7% 0.07 0.01 0.10 0.02 0.18 0.23 15.4 4.7 1.0 8.6 1.1 13.8 17.0 88.6Biodiesel COD1ROFA1 RME: Meal as AF, glycerine as chem, 1.12 0.46 0.02 0.64 57.2% 0.35 0.02 0.73 0.02 1.12 1.13 53.9 57.6 0.6 -5.6 1.4 46.0 59.8 53.9 39%ROFA2 RME: Meal and glycerine as AF 1.18 0.49 0.04 0.65 55.0% 0.35 0.02 0.78 0.02 1.17 1.18 58.7 57.6 0.6 -0.8 1.4 51.0 64.4 58.7 34%ROFA3 RME: Meal as AF, glycerine to biogas 1.13 0.45 0.04 0.65 57.1% 0.35 0.02 0.74 0.02 1.13 1.14 57.0 57.6 0.6 -2.5 1.4 50.4 64.3 57.0 36%ROFA4 RME: Meal and glycerine to biogas 0.68 0.16 -0.09 0.61 90.0% 0.35 0.02 0.28 0.02 0.62 0.73 37.3 57.6 0.6 -22.1 1.4 29.7 44.3 37.3 58%ROFA5 RME: Meal as AF, Glycerine to hydrogen 1.13 0.44 0.04 0.65 57.3% 0.35 0.02 0.73 0.02 1.13 1.14 56.7 57.6 0.6 -2.8 1.4 50.1 63.9 56.7 36%ROFE3 REE: Meal as AF, glycerine to biogas 1.25 0.42 0.04 0.79 63.1% 0.34 0.02 0.87 0.02 1.24 1.26 56.6 55.4 0.5 -0.7 1.3 47.3 60.2 56.6 36%SOFA3 RME: Meal as AF, glycerine to biogas 1.08 0.43 0.04 0.61 56.3% 0.32 0.02 0.72 0.02 1.00 1.19 45.9 43.8 0.5 0.2 1.4 41.6 49.5 45.9 48%SYFA3a SYME: No till, oil import, meal as AF, glycerine to
biogas2.53 0.40 0.07 2.07 81.8% 0.18 2.13 0.04 0.16 0.02 2.52 2.54 55.1 57.4 -14.2 3.3 7.3 1.4 3.8 68.7 55.1 38%
SYFA3b SYME: No till, beans import, meal as AF, glycerine to biogas
2.69 0.57 0.05 2.07 76.8% 0.19 0.32 2.16 0.02 2.68 2.70 59.2 58.1 23.0 -23.3 1.4 47.7 67.2 59.2 33%
SYFA3c SYME: Conv. culture, oil import, meal as AF, glycerine to biogas
2.60 0.46 0.07 2.07 79.6% 0.24 2.13 0.04 0.16 0.02 2.59 2.61 60.7 63.0 -14.2 3.3 7.3 1.4 5.0 74.6 60.7 31%
POFA3a POME: Meal as AF, no CH4 rec., heat credit, glycerine to biogas
1.18 0.17 0.03 0.97 82.5% 0.16 0.79 0.06 0.15 0.02 1.17 1.18 50.8 27.1 11.0 4.3 7.0 1.4 50.3 51.4 50.8 43%
POFA3b POME: Meal as AF, CH4 rec., heat credit, glycerine to biogas
1.18 0.17 0.03 0.97 82.6% 0.15 0.79 0.06 0.15 0.02 1.17 1.18 31.2 27.0 -8.5 4.3 7.0 1.4 30.6 31.7 31.2 65%
POFA3c POME: Meal as AF, no CH4 rec., no heat credit, glycerine to biogas
1.33 0.33 0.03 0.97 72.7% 0.15 0.95 0.06 0.15 0.02 1.33 1.34 62.6 27.0 22.8 4.3 7.0 1.4 62.0 63.1 62.6 29%
WOFA3a FAME: waste cooking oil 0.28 0.21 0.01 0.05 18.4% 0.25 0.02 0.27 0.28 13.8 12.4 1.4 13.6 13.9 13.8 84%TOFA3a FAME: tallow oil 0.48 0.40 0.04 0.04 7.6% 0.30 0.01 0.15 0.02 0.48 0.48 26.3 17.5 0.4 7.0 1.4 26.2 26.5 26.3 70%HVO COD1ROHY1a HRO (NExBTL), meal as AF 1.12 0.45 0.02 0.64 57.4% 0.35 0.02 0.72 0.02 1.11 1.12 56.6 57.5 0.6 -2.7 1.3 48.9 63.3 56.6 36%ROHY1b HRO (UOP), meal as AF 0.99 0.50 0.03 0.46 46.3% 0.31 0.02 0.64 0.02 0.99 1.00 57.1 51.1 0.5 4.2 1.3 50.7 63.5 57.1 36%ROHY4 HRO (NExBTL), meal to biogas 0.66 0.16 -0.11 0.60 91.4% 0.35 0.02 0.26 0.02 0.61 0.73 36.9 57.5 0.6 -22.4 1.3 30.4 43.4 36.9 58%SOHY1a HSO (NExBTL), meal as AF 1.04 0.43 0.02 0.59 56.3% 0.31 0.02 0.68 0.02 0.95 1.13 44.8 43.2 0.5 -0.3 1.3 40.9 48.3 44.8 49%SYHY1a HSO (NExBTL), oil imported 2.51 0.41 0.04 2.05 82.0% 0.18 2.13 0.04 0.14 0.02 2.49 2.52 55.1 57.2 -14.1 3.3 7.5 1.3 8.0 68.5 55.1 38%POY1a HPO (NExBTL), no CH4 rec. 1.13 0.15 0.02 0.96 85.3% 0.15 0.79 0.06 0.11 0.02 1.13 1.13 48.6 27.0 11.0 4.3 5.1 1.3 48.1 49.2 48.6 45%WOHY1a HWO (NExBTL), waste cooking oil 0.16 0.13 0.00 0.02 15.6% 0.14 0.02 0.15 0.17 8.1 6.83 1.3 13.0 13.9 8.1 91%TOHY1a HTO (NExBTL), tallow oil 0.44 0.38 0.03 0.03 7.0% 0.00 0.30 0.01 0.11 0.02 0.44 0.44 24.5 0.2 17.3 0.4 5.3 1.3 29.7 30.0 24.5 72%
Energy expended (MJ/MJ final fuel) WTT GHG emitted (g CO2eq/MJ final fuel) %saving
Note: “% saving” in this table is total GHG including combustion compared to conventional diesel (COD1)

Well-to-Wheels analysis of future automotive fuels and powertrains in the European context WELL-TO-TANK Report Version 4a, April 2014
WTT APPENDIX 2
WTT Appendix 2 v4a, April 2014 Page 16 of 32
0.00
0.20
0.40
0.60
0.80
1.00
1.20
1.40
ROFA1 ROFA2 ROFA3 ROFA4 ROFA5
Ex
pe
nd
ed
en
erg
y (
MJ/
Mj f
ue
l
Conditioning &
distribution
Transformation near
market
Transportation to
market
Transformation at
source
Production &
conditioning at
source
0.0
10.0
20.0
30.0
40.0
50.0
60.0
70.0
-30.0
-20.0
-10.0
0.0
10.0
20.0
30.0
40.0
50.0
60.0
70.0
ROFA1 ROFA2 ROFA3 ROFA4 ROFA5
To
tal
no
n-r
en
ew
ab
le G
HG
em
issi
on
s in
c.
com
bu
stio
n (
g C
O2
eq/
MJ f
ue
l)
GH
G e
mis
sio
ns
(g C
O2
eq/
Mj f
ue
l
0.00
0.50
1.00
1.50
2.00
2.50
3.00
Ex
pe
nd
ed
en
erg
y (
MJ/
Mj f
ue
l
Conditioning &
distribution
Transformation near
market
Transportation to
market
Transformation at
source
Production &
conditioning at
source
-40.0
-20.0
0.0
20.0
40.0
60.0
80.0
100.0
-40.0
-20.0
0.0
20.0
40.0
60.0
80.0
100.0
To
tal
no
n-r
en
ew
ab
le G
HG
em
issi
on
s in
c.
com
bu
stio
n (
g C
O2
eq/
MJ f
ue
l)
GH
G e
mis
sio
ns
(g C
O2
eq/
Mj f
ue
l

Well-to-Wheels analysis of future automotive fuels and powertrains in the European context WELL-TO-TANK Report Version 4a, April 2014
WTT APPENDIX 2
WTT Appendix 2 v4a, April 2014 Page 17 of 32
0.00
0.50
1.00
1.50
2.00
2.50
3.00
Ex
pe
nd
ed
en
erg
y (
MJ/
Mj f
ue
l
Conditioning &
distribution
Transformation near
market
Transportation to
market
Transformation at
source
Production &
conditioning at
source
-20.0
0.0
20.0
40.0
60.0
80.0
100.0
120.0
-40.0
-20.0
0.0
20.0
40.0
60.0
80.0
100.0
120.0
To
tal
no
n-r
en
ew
ab
le G
HG
em
issi
on
s in
c.
com
bu
stio
n (
g C
O2
eq/
MJ f
ue
l)
GH
G e
mis
sio
ns
(g C
O2
eq/
Mj f
ue
l

Well-to-Wheels analysis of future automotive fuels and powertrains in the European context WELL-TO-TANK Report Version 4a, April 2014
WTT APPENDIX 2
WTT Appendix 2 v4a, April 2014 Page 18 of 32
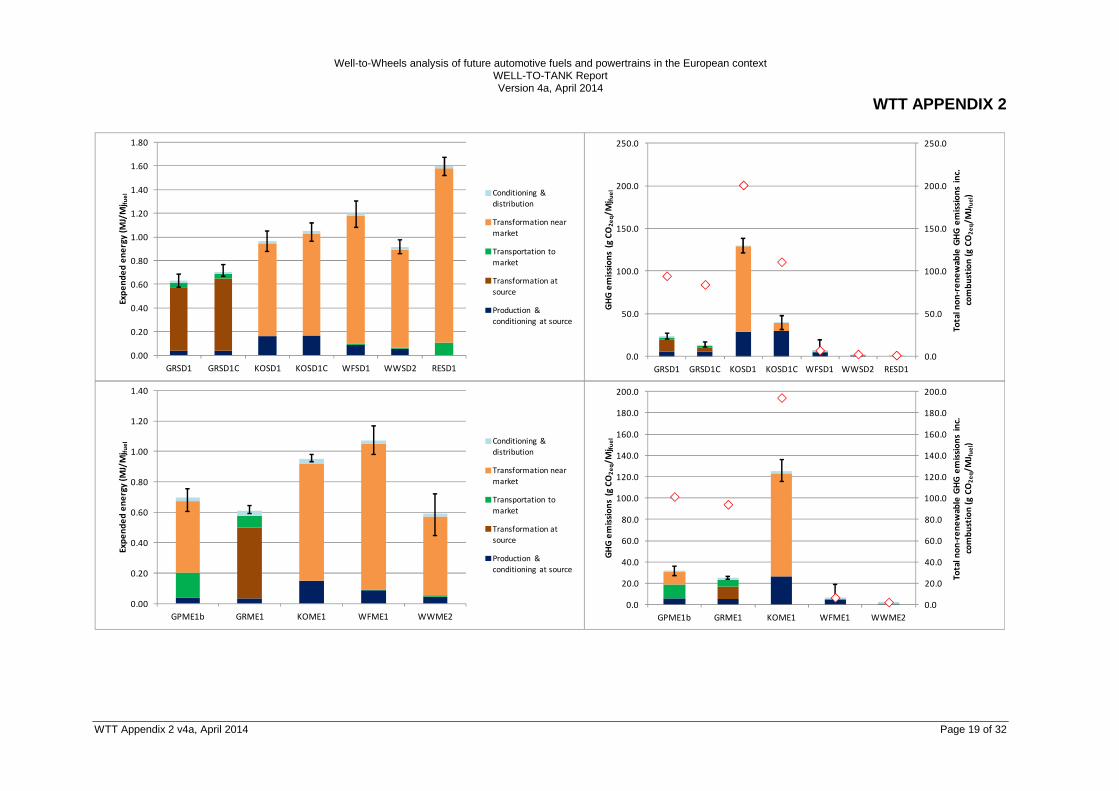
1.51.51.51.5 SynfueSynfueSynfueSynfuelslslsls PathwayCode Description
To
tal
Fos
sil
Nuc
lear
Ren
ewab
le
Fra
ct re
ne
w
Pro
duct
ion
&
cond
ition
ing
at
sour
ce
Tra
nsfo
rmat
ion
at s
ourc
e
Tra
nspo
rtat
ion
to m
arke
t
Tra
nsfo
rmat
ion
near
mar
ket
Con
ditio
ning
&
dist
ribut
ion Range
To
tal
Pro
duct
ion
&
cond
ition
ing
at
sour
ce
Tra
nsfo
rmat
ion
at s
ourc
e
Tra
nspo
rtat
ion
to m
arke
t
Tra
nsfo
rmat
ion
near
mar
ket
Con
ditio
ning
&
dist
ribut
ion Range
Tot
al G
HG
inc.
co
mbu
stio
n
Conventional fossil fuelsCOD1 Diesel 0.20 0.20 0.01 0.00 0.7% 0.07 0.01 0.10 0.02 0.18 0.23 15.4 4.7 1.0 8.6 1.1 13.8 17.0 88.6SynfuelsGRSD1 Syndiesel: Rem GTL, diesel pool 0.63 0.62 0.01 0.00 0.3% 0.04 0.54 0.04 0.02 0.58 0.69 23.4 5.74 13.90 2.69 1.10 20.2 26.7 94.3 -6%GRSD1C Syndiesel: Rem GTL+CCS, diesel pool 0.71 0.70 0.01 0.00 0.3% 0.04 0.61 0.04 0.02 0.67 0.77 13.4 6.02 3.58 2.69 1.10 11.1 16.9 84.2 5%KOSD1 Syndiesel: CTL, diesel pool 0.97 0.94 0.03 0.00 0.4% 0.16 0.78 0.02 0.88 1.05 130.1 28.49 100.39 1.19 121.2 138.7 200.9 -127%KOSD1C Syndiesel: CTL, CCS, diesel pool 1.05 1.02 0.03 0.00 0.3% 0.17 0.86 0.02 0.97 1.12 40.0 29.73 9.08 1.19 31.3 47.3 110.8 -25%WFSD1 Syndiesel: F wood, diesel pool 1.20 0.06 0.01 1.13 94.2% 0.09 0.01 1.08 0.02 1.08 1.30 7.0 5.01 0.68 0.06 1.25 5.3 19.6 7.0 92%WWSD2 Syndiesel: W Wood via black liquor, diesel pool 0.91 0.03 0.01 0.88 95.9% 0.05 0.01 0.83 0.02 0.86 0.97 2.5 0.66 0.60 0.00 1.24 2.5 2.5 2.5 97%RESD1 Syndiesel: Renewable electricity, diesel pool 1.60 0.02 0.01 1.58 98.7% 0.00 0.10 1.47 0.02 1.52 1.67 1.3 0.00 0.00 0.00 1.25 1.2 1.3 1.3 99%GPME1b MeOH: NG 4000 km, EU prod., rail/road 0.70 0.69 0.01 0.00 0.3% 0.04 0.16 0.47 0.03 0.61 0.77 32.2 6.07 12.60 11.86 1.64 27.1 35.9 101.3GRME1 MeOH: Rem prod., sea/ rail/road 0.61 0.60 0.01 0.00 0.4% 0.04 0.46 0.08 0.03 0.59 0.64 24.9 5.46 11.49 5.94 2.02 23.9 26.7 94.0KOME1 MeOH: Coal EU-mix, EU prod., rail/road 0.94 -0.99 0.06 0.01 1.4% 0.15 0.77 0.02 0.86 1.05 124.6 26.78 96.30 1.51 115.4 135.8 193.7WFME1 MeOH: F Wood, road 1.07 0.06 0.00 1.01 94.0% 0.09 0.01 0.96 0.02 0.95 1.21 6.6 4.73 0.64 0.00 1.19 5.1 18.8 6.6WWME2 MeOH: W Wood via black liquor, road 0.59 0.03 0.00 0.56 94.4% 0.05 0.01 0.52 0.02 0.55 0.64 2.2 0.54 0.50 0.00 1.19 2.2 2.3 2.2GPDE1b DME: NG 4000 km, EU prod., rail/road 0.64 0.63 0.01 0.00 0.3% 0.04 0.16 0.42 0.03 0.54 0.69 30.4 5.85 12.16 10.83 1.54 24.8 33.6 97.7 -10%GRDE1 DME: Rem prod., sea/ rail/road 0.53 0.52 0.01 0.00 0.4% 0.03 0.41 0.06 0.03 0.52 0.57 22.0 5.27 10.57 4.33 1.80 21.0 23.8 89.3 -1%GRDE1C DME: Rem prod. with CCS, Sea, Rail/Road 0.54 0.53 0.01 0.00 0.4% 0.03 0.42 0.06 0.03 0.53 0.57 12.0 5.30 0.55 4.33 1.80 11.0 13.6 79.3 11%KODE1 DME: Coal EU-mix, EU prod., rail/road 0.95 0.88 0.06 0.01 1.3% 0.15 0.77 0.03 0.85 1.04 126.7 26.78 98.11 1.78 117.3 136.1 194.0 -119%WFDE1 DME: F Wood, road 1.07 0.06 0.00 1.01 94.1% 0.09 0.01 0.96 0.02 0.93 1.20 6.5 4.73 0.64 0.00 1.13 5.1 18.9 6.5 93%WWDE2 DME: W Wood via black liquor, road 0.56 0.03 0.00 0.52 94.2% 0.04 0.01 0.49 0.02 0.51 0.60 2.1 0.53 0.49 0.00 1.13 2.1 2.2 2.1 98%
Energy expended (MJ/MJ final fuel) WTT GHG emitted (g CO2eq/MJ final fuel) %saving
Note: “% saving” in this table is total GHG including combustion compared to conventional diesel (COD1)
Well-to-Wheels analysis of future automotive fuels and powertrains in the European context WELL-TO-TANK Report Version 4a, April 2014
WTT APPENDIX 2
WTT Appendix 2 v4a, April 2014 Page 19 of 32
0.00
0.20
0.40
0.60
0.80
1.00
1.20
1.40
1.60
1.80
GRSD1 GRSD1C KOSD1 KOSD1C WFSD1 WWSD2 RESD1
Ex
pe
nd
ed
en
erg
y (
MJ/
Mj f
ue
l Conditioning &
distribution
Transformation near
market
Transportation to
market
Transformation at
source
Production &
conditioning at source
0.0
50.0
100.0
150.0
200.0
250.0
0.0
50.0
100.0
150.0
200.0
250.0
GRSD1 GRSD1C KOSD1 KOSD1C WFSD1 WWSD2 RESD1
To
tal
no
n-r
en
ew
ab
le G
HG
em
issi
on
s in
c.
com
bu
stio
n (
g C
O2
eq/
MJ f
ue
l)
GH
G e
mis
sio
ns
(g C
O2
eq/
Mj f
ue
l0.00
0.20
0.40
0.60
0.80
1.00
1.20
1.40
GPME1b GRME1 KOME1 WFME1 WWME2
Ex
pe
nd
ed
en
erg
y (
MJ/
Mj f
ue
l Conditioning &
distribution
Transformation near
market
Transportation to
market
Transformation at
source
Production &
conditioning at source
0.0
20.0
40.0
60.0
80.0
100.0
120.0
140.0
160.0
180.0
200.0
0.0
20.0
40.0
60.0
80.0
100.0
120.0
140.0
160.0
180.0
200.0
GPME1b GRME1 KOME1 WFME1 WWME2
To
tal
no
n-r
en
ew
ab
le G
HG
em
issi
on
s in
c.
com
bu
stio
n (
g C
O2
eq/
MJ f
ue
l)
GH
G e
mis
sio
ns
(g C
O2
eq/
Mj f
ue
l

Well-to-Wheels analysis of future automotive fuels and powertrains in the European context WELL-TO-TANK Report Version 4a, April 2014
WTT APPENDIX 2
WTT Appendix 2 v4a, April 2014 Page 20 of 32
0.0
20.0
40.0
60.0
80.0
100.0
120.0
140.0
160.0
180.0
200.0
0.0
20.0
40.0
60.0
80.0
100.0
120.0
140.0
160.0
180.0
200.0
GPDE1b GRDE1 GRDE1C KODE1 WFDE1 WWDE2
To
tal
no
n-r
en
ew
ab
le G
HG
em
issi
on
s in
c.
com
bu
stio
n (
g C
O2
eq/
MJ f
ue
l)
GH
G e
mis
sio
ns
(g C
O2
eq/
Mj f
ue
l
0.00
0.20
0.40
0.60
0.80
1.00
1.20
GPDE1b GRDE1 GRDE1C KODE1 WFDE1 WWDE2
Ex
pe
nd
ed
en
erg
y (
MJ/
Mj f
ue
l Conditioning &
distribution
Transformation near
market
Transportation to
market
Transformation at
source
Production &
conditioning at source
Well-to-Wheels analysis of future automotive fuels and powertrains in the European context WELL-TO-TANK Report Version 4a, April 2014
WTT APPENDIX 2
WTT Appendix 2 v4a, April 2014 Page 21 of 32
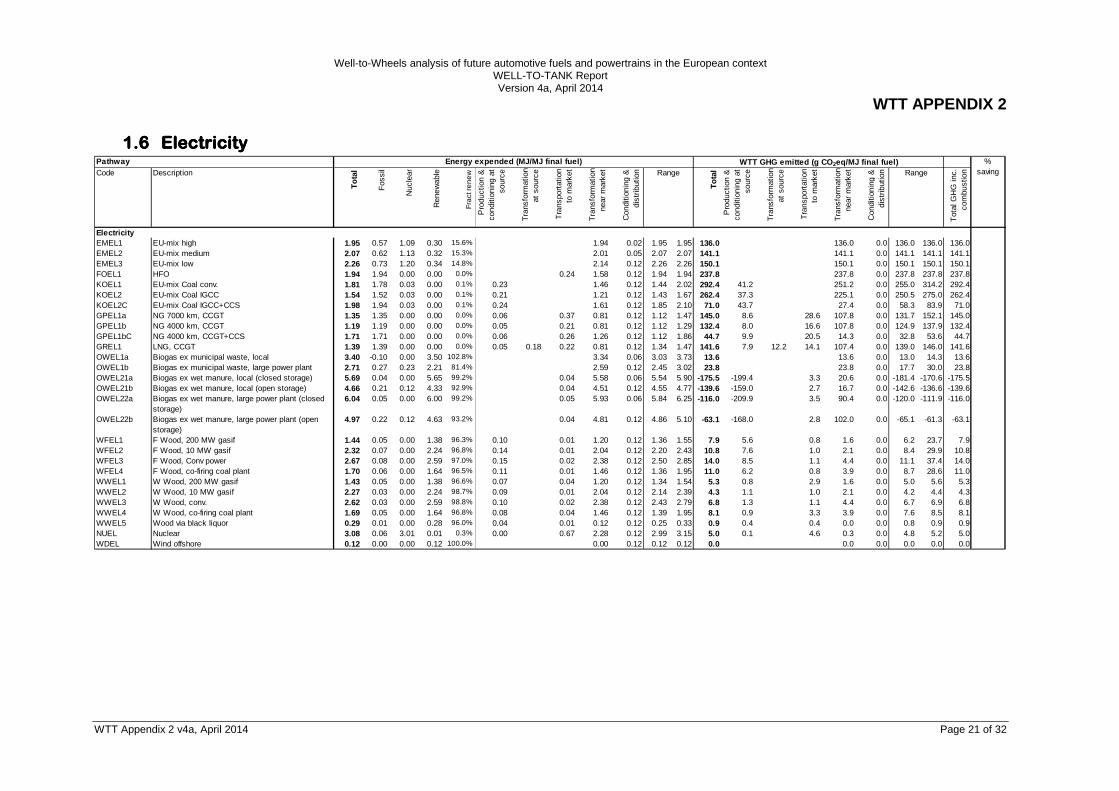
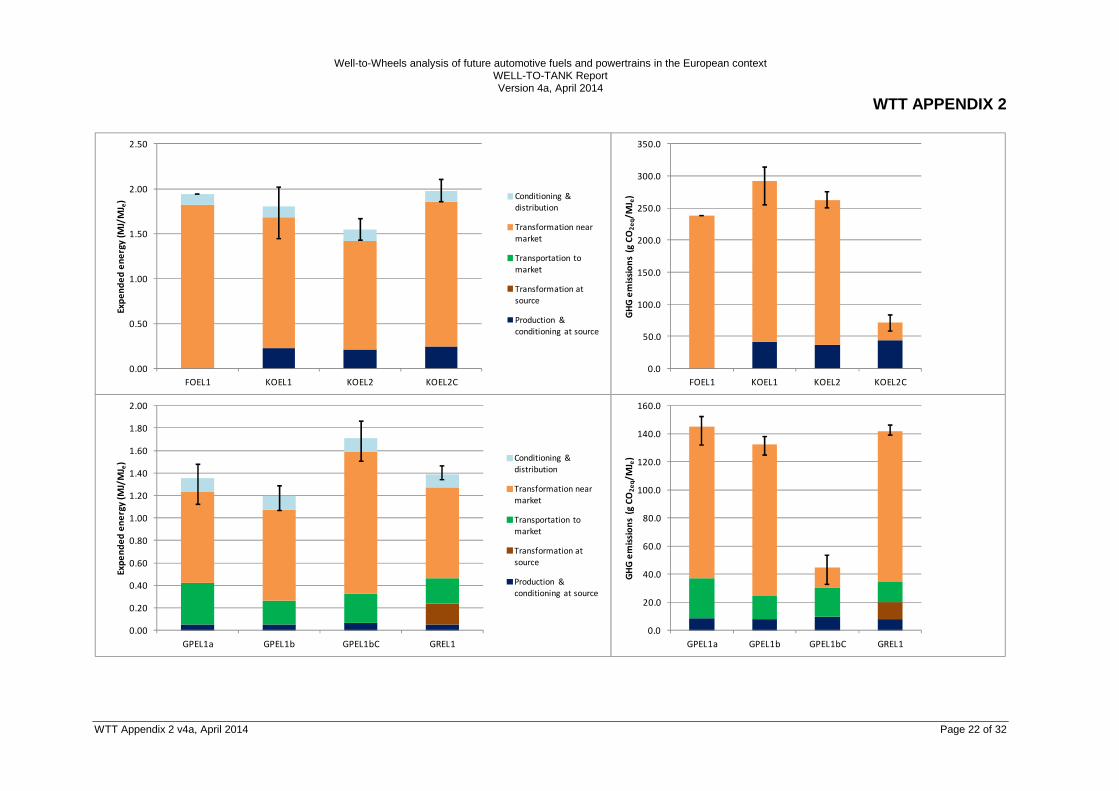
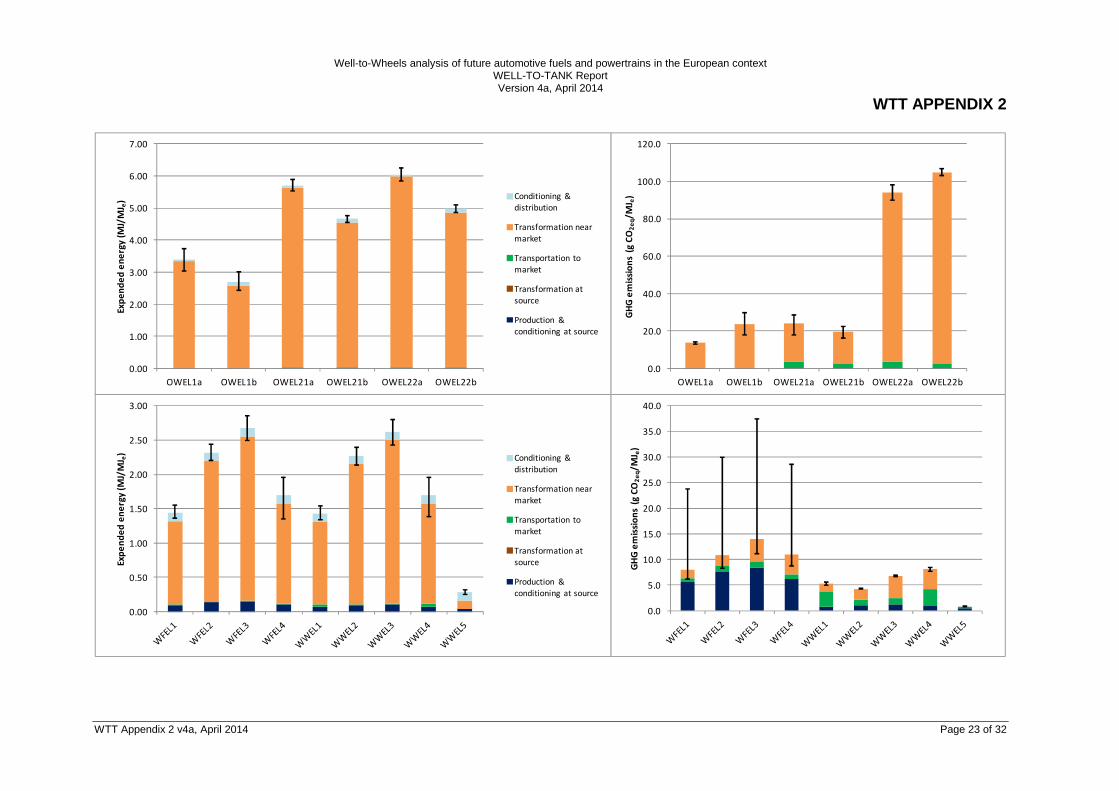
1.61.61.61.6 ElectricityElectricityElectricityElectricity PathwayCode Description
To
tal
Fos
sil
Nuc
lear
Ren
ewab
le
Fra
ct re
ne
w
Pro
duct
ion
&
cond
ition
ing
at
sour
ce
Tra
nsfo
rmat
ion
at s
ourc
e
Tra
nspo
rtat
ion
to m
arke
t
Tra
nsfo
rmat
ion
near
mar
ket
Con
ditio
ning
&
dist
ribut
ion Range
To
tal
Pro
duct
ion
&
cond
ition
ing
at
sour
ce
Tra
nsfo
rmat
ion
at s
ourc
e
Tra
nspo
rtat
ion
to m
arke
t
Tra
nsfo
rmat
ion
near
mar
ket
Con
ditio
ning
&
dist
ribut
ion Range
Tot
al G
HG
inc.
co
mbu
stio
n
ElectricityEMEL1 EU-mix high 1.95 0.57 1.09 0.30 15.6% 1.94 0.02 1.95 1.95 136.0 136.0 0.0 136.0 136.0 136.0EMEL2 EU-mix medium 2.07 0.62 1.13 0.32 15.3% 2.01 0.05 2.07 2.07 141.1 141.1 0.0 141.1 141.1 141.1EMEL3 EU-mix low 2.26 0.73 1.20 0.34 14.8% 2.14 0.12 2.26 2.26 150.1 150.1 0.0 150.1 150.1 150.1FOEL1 HFO 1.94 1.94 0.00 0.00 0.0% 0.24 1.58 0.12 1.94 1.94 237.8 237.8 0.0 237.8 237.8 237.8KOEL1 EU-mix Coal conv. 1.81 1.78 0.03 0.00 0.1% 0.23 1.46 0.12 1.44 2.02 292.4 41.2 251.2 0.0 255.0 314.2 292.4KOEL2 EU-mix Coal IGCC 1.54 1.52 0.03 0.00 0.1% 0.21 1.21 0.12 1.43 1.67 262.4 37.3 225.1 0.0 250.5 275.0 262.4KOEL2C EU-mix Coal IGCC+CCS 1.98 1.94 0.03 0.00 0.1% 0.24 1.61 0.12 1.85 2.10 71.0 43.7 27.4 0.0 58.3 83.9 71.0GPEL1a NG 7000 km, CCGT 1.35 1.35 0.00 0.00 0.0% 0.06 0.37 0.81 0.12 1.12 1.47 145.0 8.6 28.6 107.8 0.0 131.7 152.1 145.0GPEL1b NG 4000 km, CCGT 1.19 1.19 0.00 0.00 0.0% 0.05 0.21 0.81 0.12 1.12 1.29 132.4 8.0 16.6 107.8 0.0 124.9 137.9 132.4GPEL1bC NG 4000 km, CCGT+CCS 1.71 1.71 0.00 0.00 0.0% 0.06 0.26 1.26 0.12 1.12 1.86 44.7 9.9 20.5 14.3 0.0 32.8 53.6 44.7GREL1 LNG, CCGT 1.39 1.39 0.00 0.00 0.0% 0.05 0.18 0.22 0.81 0.12 1.34 1.47 141.6 7.9 12.2 14.1 107.4 0.0 139.0 146.0 141.6OWEL1a Biogas ex municipal waste, local 3.40 -0.10 0.00 3.50 102.8% 3.34 0.06 3.03 3.73 13.6 13.6 0.0 13.0 14.3 13.6OWEL1b Biogas ex municipal waste, large power plant 2.71 0.27 0.23 2.21 81.4% 2.59 0.12 2.45 3.02 23.8 23.8 0.0 17.7 30.0 23.8OWEL21a Biogas ex wet manure, local (closed storage) 5.69 0.04 0.00 5.65 99.2% 0.04 5.58 0.06 5.54 5.90 -175.5 -199.4 3.3 20.6 0.0 -181.4 -170.6 -175.5OWEL21b Biogas ex wet manure, local (open storage) 4.66 0.21 0.12 4.33 92.9% 0.04 4.51 0.12 4.55 4.77 -139.6 -159.0 2.7 16.7 0.0 -142.6 -136.6 -139.6OWEL22a Biogas ex wet manure, large power plant (closed
storage)6.04 0.05 0.00 6.00 99.2% 0.05 5.93 0.06 5.84 6.25 -116.0 -209.9 3.5 90.4 0.0 -120.0 -111.9 -116.0
OWEL22b Biogas ex wet manure, large power plant (open storage)
4.97 0.22 0.12 4.63 93.2% 0.04 4.81 0.12 4.86 5.10 -63.1 -168.0 2.8 102.0 0.0 -65.1 -61.3 -63.1
WFEL1 F Wood, 200 MW gasif 1.44 0.05 0.00 1.38 96.3% 0.10 0.01 1.20 0.12 1.36 1.55 7.9 5.6 0.8 1.6 0.0 6.2 23.7 7.9WFEL2 F Wood, 10 MW gasif 2.32 0.07 0.00 2.24 96.8% 0.14 0.01 2.04 0.12 2.20 2.43 10.8 7.6 1.0 2.1 0.0 8.4 29.9 10.8WFEL3 F Wood, Conv power 2.67 0.08 0.00 2.59 97.0% 0.15 0.02 2.38 0.12 2.50 2.85 14.0 8.5 1.1 4.4 0.0 11.1 37.4 14.0WFEL4 F Wood, co-firing coal plant 1.70 0.06 0.00 1.64 96.5% 0.11 0.01 1.46 0.12 1.36 1.95 11.0 6.2 0.8 3.9 0.0 8.7 28.6 11.0WWEL1 W Wood, 200 MW gasif 1.43 0.05 0.00 1.38 96.6% 0.07 0.04 1.20 0.12 1.34 1.54 5.3 0.8 2.9 1.6 0.0 5.0 5.6 5.3WWEL2 W Wood, 10 MW gasif 2.27 0.03 0.00 2.24 98.7% 0.09 0.01 2.04 0.12 2.14 2.39 4.3 1.1 1.0 2.1 0.0 4.2 4.4 4.3WWEL3 W Wood, conv. 2.62 0.03 0.00 2.59 98.8% 0.10 0.02 2.38 0.12 2.43 2.79 6.8 1.3 1.1 4.4 0.0 6.7 6.9 6.8WWEL4 W Wood, co-firing coal plant 1.69 0.05 0.00 1.64 96.8% 0.08 0.04 1.46 0.12 1.39 1.95 8.1 0.9 3.3 3.9 0.0 7.6 8.5 8.1WWEL5 Wood via black liquor 0.29 0.01 0.00 0.28 96.0% 0.04 0.01 0.12 0.12 0.25 0.33 0.9 0.4 0.4 0.0 0.0 0.8 0.9 0.9NUEL Nuclear 3.08 0.06 3.01 0.01 0.3% 0.00 0.67 2.28 0.12 2.99 3.15 5.0 0.1 4.6 0.3 0.0 4.8 5.2 5.0WDEL Wind offshore 0.12 0.00 0.00 0.12 100.0% 0.00 0.12 0.12 0.12 0.0 0.0 0.0 0.0 0.0 0.0
Energy expended (MJ/MJ final fuel) WTT GHG emitted (g CO2eq/MJ final fuel) %saving
Well-to-Wheels analysis of future automotive fuels and powertrains in the European context WELL-TO-TANK Report Version 4a, April 2014
WTT APPENDIX 2
WTT Appendix 2 v4a, April 2014 Page 22 of 32
0.00
0.50
1.00
1.50
2.00
2.50
FOEL1 KOEL1 KOEL2 KOEL2C
Ex
pe
nd
ed
en
erg
y (
MJ/
MJ e
) Conditioning &
distribution
Transformation near
market
Transportation to
market
Transformation at
source
Production &
conditioning at source
0.0
50.0
100.0
150.0
200.0
250.0
300.0
350.0
FOEL1 KOEL1 KOEL2 KOEL2C
GH
G e
mis
sio
ns
(g C
O2
eq/
MJ e
)0.00
0.20
0.40
0.60
0.80
1.00
1.20
1.40
1.60
1.80
2.00
GPEL1a GPEL1b GPEL1bC GREL1
Ex
pe
nd
ed
en
erg
y (
MJ/
MJ e
) Conditioning &
distribution
Transformation near
market
Transportation to
market
Transformation at
source
Production &
conditioning at source
0.0
20.0
40.0
60.0
80.0
100.0
120.0
140.0
160.0
GPEL1a GPEL1b GPEL1bC GREL1
GH
G e
mis
sio
ns
(g C
O2
eq/
MJ e
)
Well-to-Wheels analysis of future automotive fuels and powertrains in the European context WELL-TO-TANK Report Version 4a, April 2014
WTT APPENDIX 2
WTT Appendix 2 v4a, April 2014 Page 23 of 32
0.00
1.00
2.00
3.00
4.00
5.00
6.00
7.00
OWEL1a OWEL1b OWEL21a OWEL21b OWEL22a OWEL22b
Ex
pe
nd
ed
en
erg
y (
MJ/
MJ e
) Conditioning &
distribution
Transformation near
market
Transportation to
market
Transformation at
source
Production &
conditioning at source
0.0
20.0
40.0
60.0
80.0
100.0
120.0
OWEL1a OWEL1b OWEL21a OWEL21b OWEL22a OWEL22b
GH
G e
mis
sio
ns
(g C
O2
eq/
MJ e
)
0.00
0.50
1.00
1.50
2.00
2.50
3.00
Exp
en
de
d e
ne
rgy
(M
J/M
J e)
Conditioning &
distribution
Transformation near
market
Transportation to
market
Transformation at
source
Production &
conditioning at source
0.0
5.0
10.0
15.0
20.0
25.0
30.0
35.0
40.0
GH
G e
mis
sio
ns
(g C
O2
eq/
MJ e
)
Well-to-Wheels analysis of future automotive fuels and powertrains in the European context WELL-TO-TANK Report Version 4a, April 2014
WTT APPENDIX 2
WTT Appendix 2 v4a, April 2014 Page 24 of 32
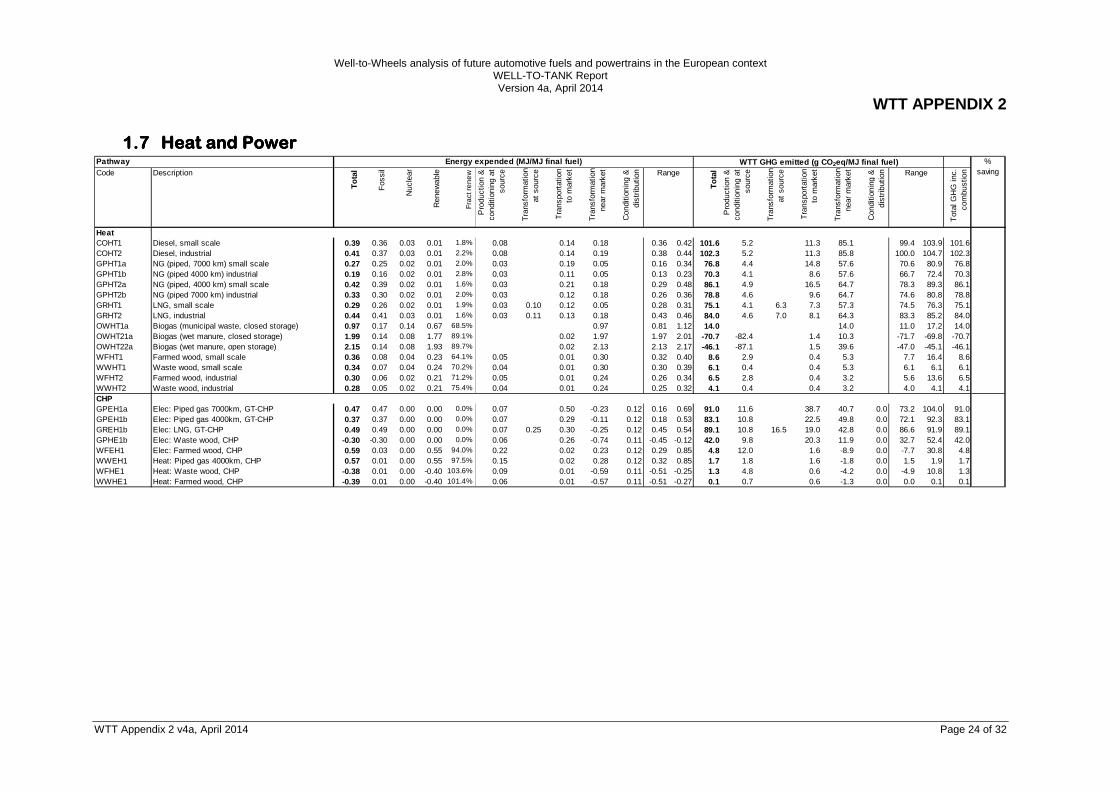
1.71.71.71.7 Heat and PowerHeat and PowerHeat and PowerHeat and Power PathwayCode Description
To
tal
Fos
sil
Nuc
lear
Ren
ewab
le
Fra
ct re
ne
w
Pro
duct
ion
&
cond
ition
ing
at
sour
ce
Tra
nsfo
rmat
ion
at s
ourc
e
Tra
nspo
rtat
ion
to m
arke
t
Tra
nsfo
rmat
ion
near
mar
ket
Con
ditio
ning
&
dist
ribut
ion Range
To
tal
Pro
duct
ion
&
cond
ition
ing
at
sour
ce
Tra
nsfo
rmat
ion
at s
ourc
e
Tra
nspo
rtat
ion
to m
arke
t
Tra
nsfo
rmat
ion
near
mar
ket
Con
ditio
ning
&
dist
ribut
ion Range
Tot
al G
HG
inc.
co
mbu
stio
n
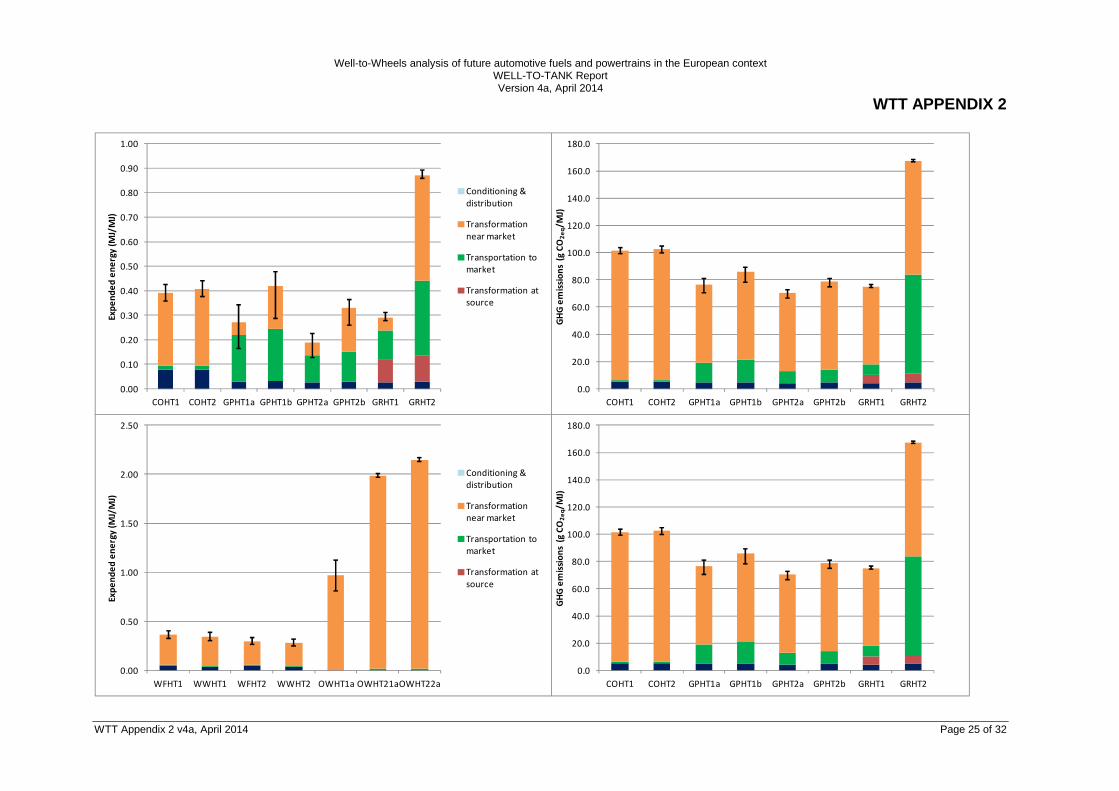
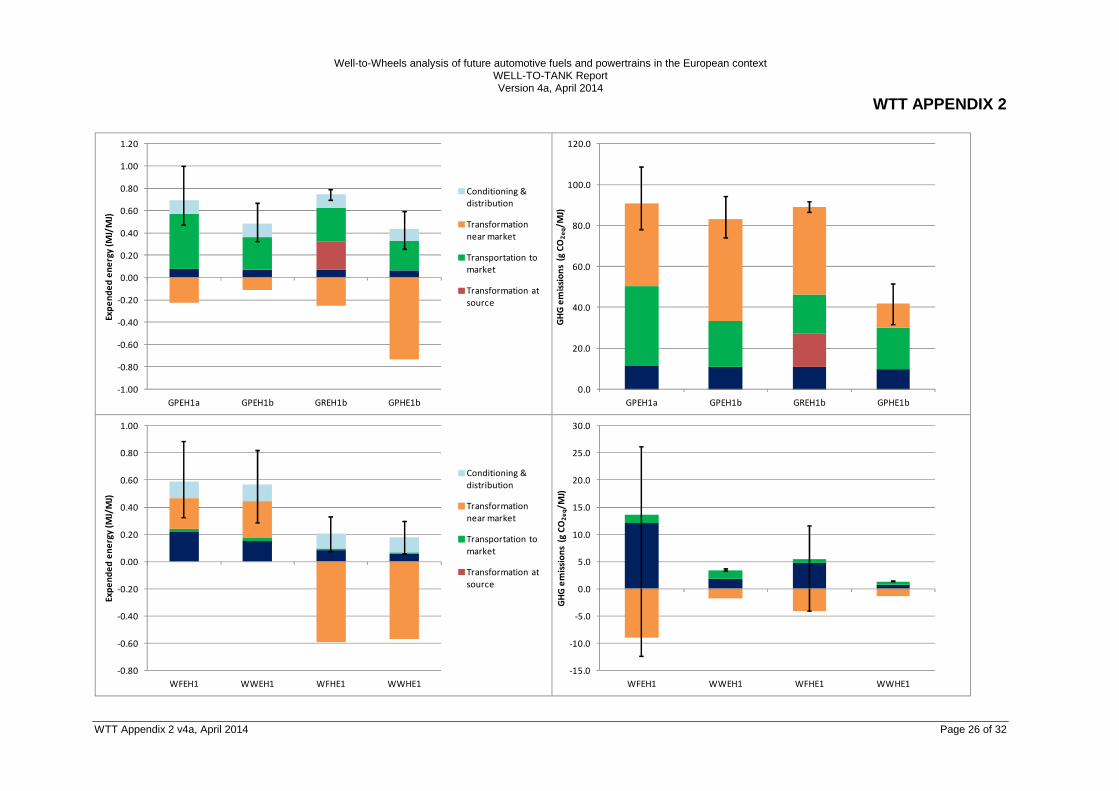
HeatCOHT1 Diesel, small scale 0.39 0.36 0.03 0.01 1.8% 0.08 0.14 0.18 0.36 0.42 101.6 5.2 11.3 85.1 99.4 103.9 101.6COHT2 Diesel, industrial 0.41 0.37 0.03 0.01 2.2% 0.08 0.14 0.19 0.38 0.44 102.3 5.2 11.3 85.8 100.0 104.7 102.3GPHT1a NG (piped, 7000 km) small scale 0.27 0.25 0.02 0.01 2.0% 0.03 0.19 0.05 0.16 0.34 76.8 4.4 14.8 57.6 70.6 80.9 76.8GPHT1b NG (piped 4000 km) industrial 0.19 0.16 0.02 0.01 2.8% 0.03 0.11 0.05 0.13 0.23 70.3 4.1 8.6 57.6 66.7 72.4 70.3GPHT2a NG (piped, 4000 km) small scale 0.42 0.39 0.02 0.01 1.6% 0.03 0.21 0.18 0.29 0.48 86.1 4.9 16.5 64.7 78.3 89.3 86.1GPHT2b NG (piped 7000 km) industrial 0.33 0.30 0.02 0.01 2.0% 0.03 0.12 0.18 0.26 0.36 78.8 4.6 9.6 64.7 74.6 80.8 78.8GRHT1 LNG, small scale 0.29 0.26 0.02 0.01 1.9% 0.03 0.10 0.12 0.05 0.28 0.31 75.1 4.1 6.3 7.3 57.3 74.5 76.3 75.1GRHT2 LNG, industrial 0.44 0.41 0.03 0.01 1.6% 0.03 0.11 0.13 0.18 0.43 0.46 84.0 4.6 7.0 8.1 64.3 83.3 85.2 84.0OWHT1a Biogas (municipal waste, closed storage) 0.97 0.17 0.14 0.67 68.5% 0.97 0.81 1.12 14.0 14.0 11.0 17.2 14.0OWHT21a Biogas (wet manure, closed storage) 1.99 0.14 0.08 1.77 89.1% 0.02 1.97 1.97 2.01 -70.7 -82.4 1.4 10.3 -71.7 -69.8 -70.7OWHT22a Biogas (wet manure, open storage) 2.15 0.14 0.08 1.93 89.7% 0.02 2.13 2.13 2.17 -46.1 -87.1 1.5 39.6 -47.0 -45.1 -46.1WFHT1 Farmed wood, small scale 0.36 0.08 0.04 0.23 64.1% 0.05 0.01 0.30 0.32 0.40 8.6 2.9 0.4 5.3 7.7 16.4 8.6WWHT1 Waste wood, small scale 0.34 0.07 0.04 0.24 70.2% 0.04 0.01 0.30 0.30 0.39 6.1 0.4 0.4 5.3 6.1 6.1 6.1WFHT2 Farmed wood, industrial 0.30 0.06 0.02 0.21 71.2% 0.05 0.01 0.24 0.26 0.34 6.5 2.8 0.4 3.2 5.6 13.6 6.5WWHT2 Waste wood, industrial 0.28 0.05 0.02 0.21 75.4% 0.04 0.01 0.24 0.25 0.32 4.1 0.4 0.4 3.2 4.0 4.1 4.1CHPGPEH1a Elec: Piped gas 7000km, GT-CHP 0.47 0.47 0.00 0.00 0.0% 0.07 0.50 -0.23 0.12 0.16 0.69 91.0 11.6 38.7 40.7 0.0 73.2 104.0 91.0GPEH1b Elec: Piped gas 4000km, GT-CHP 0.37 0.37 0.00 0.00 0.0% 0.07 0.29 -0.11 0.12 0.18 0.53 83.1 10.8 22.5 49.8 0.0 72.1 92.3 83.1GREH1b Elec: LNG, GT-CHP 0.49 0.49 0.00 0.00 0.0% 0.07 0.25 0.30 -0.25 0.12 0.45 0.54 89.1 10.8 16.5 19.0 42.8 0.0 86.6 91.9 89.1GPHE1b Elec: Waste wood, CHP -0.30 -0.30 0.00 0.00 0.0% 0.06 0.26 -0.74 0.11 -0.45 -0.12 42.0 9.8 20.3 11.9 0.0 32.7 52.4 42.0WFEH1 Elec: Farmed wood, CHP 0.59 0.03 0.00 0.55 94.0% 0.22 0.02 0.23 0.12 0.29 0.85 4.8 12.0 1.6 -8.9 0.0 -7.7 30.8 4.8WWEH1 Heat: Piped gas 4000km, CHP 0.57 0.01 0.00 0.55 97.5% 0.15 0.02 0.28 0.12 0.32 0.85 1.7 1.8 1.6 -1.8 0.0 1.5 1.9 1.7WFHE1 Heat: Waste wood, CHP -0.38 0.01 0.00 -0.40 103.6% 0.09 0.01 -0.59 0.11 -0.51 -0.25 1.3 4.8 0.6 -4.2 0.0 -4.9 10.8 1.3WWHE1 Heat: Farmed wood, CHP -0.39 0.01 0.00 -0.40 101.4% 0.06 0.01 -0.57 0.11 -0.51 -0.27 0.1 0.7 0.6 -1.3 0.0 0.0 0.1 0.1
Energy expended (MJ/MJ final fuel) WTT GHG emitted (g CO2eq/MJ final fuel) %saving
Well-to-Wheels analysis of future automotive fuels and powertrains in the European context WELL-TO-TANK Report Version 4a, April 2014
WTT APPENDIX 2
WTT Appendix 2 v4a, April 2014 Page 25 of 32
0.00
0.10
0.20
0.30
0.40
0.50
0.60
0.70
0.80
0.90
1.00
COHT1 COHT2 GPHT1a GPHT1b GPHT2a GPHT2b GRHT1 GRHT2
Ex
pe
nd
ed
en
erg
y (
MJ/
MJ)
Conditioning &
distribution
Transformation
near market
Transportation to
market
Transformation at
source
0.0
20.0
40.0
60.0
80.0
100.0
120.0
140.0
160.0
180.0
COHT1 COHT2 GPHT1a GPHT1b GPHT2a GPHT2b GRHT1 GRHT2
GH
G e
mis
sio
ns
(g C
O2
eq/
MJ)
0.00
0.50
1.00
1.50
2.00
2.50
WFHT1 WWHT1 WFHT2 WWHT2 OWHT1a OWHT21aOWHT22a
Ex
pe
nd
ed
en
erg
y (
MJ/
MJ)
Conditioning &
distribution
Transformation
near market
Transportation to
market
Transformation at
source
0.0
20.0
40.0
60.0
80.0
100.0
120.0
140.0
160.0
180.0
COHT1 COHT2 GPHT1a GPHT1b GPHT2a GPHT2b GRHT1 GRHT2
GH
G e
mis
sio
ns
(g C
O2
eq/
MJ)
Well-to-Wheels analysis of future automotive fuels and powertrains in the European context WELL-TO-TANK Report Version 4a, April 2014
WTT APPENDIX 2
WTT Appendix 2 v4a, April 2014 Page 26 of 32
-1.00
-0.80
-0.60
-0.40
-0.20
0.00
0.20
0.40
0.60
0.80
1.00
1.20
GPEH1a GPEH1b GREH1b GPHE1b
Ex
pe
nd
ed
en
erg
y (
MJ/
MJ)
Conditioning &
distribution
Transformation
near market
Transportation to
market
Transformation at
source
0.0
20.0
40.0
60.0
80.0
100.0
120.0
GPEH1a GPEH1b GREH1b GPHE1b
GH
G e
mis
sio
ns
(g C
O2
eq/
MJ)
-0.80
-0.60
-0.40
-0.20
0.00
0.20
0.40
0.60
0.80
1.00
WFEH1 WWEH1 WFHE1 WWHE1
Ex
pe
nd
ed
en
erg
y (
MJ/
MJ)
Conditioning &
distribution
Transformation
near market
Transportation to
market
Transformation at
source
-15.0
-10.0
-5.0
0.0
5.0
10.0
15.0
20.0
25.0
30.0
WFEH1 WWEH1 WFHE1 WWHE1
GH
G e
mis
sio
ns
(g C
O2
eq/
MJ)
Well-to-Wheels analysis of future automotive fuels and powertrains in the European context WELL-TO-TANK Report Version 4a, April 2014
WTT APPENDIX 2
WTT Appendix 2 v4a, April 2014 Page 27 of 32
1.81.81.81.8 Hydrogen (thermal)Hydrogen (thermal)Hydrogen (thermal)Hydrogen (thermal) PathwayCode Description
To
tal
Fos
sil
Nuc
lear
Ren
ewab
le
Fra
ct re
ne
w
Pro
duct
ion
&
cond
ition
ing
at
sour
ce
Tra
nsfo
rmat
ion
at s
ourc
e
Tra
nspo
rtat
ion
to m
arke
t
Tra
nsfo
rmat
ion
near
mar
ket
Con
ditio
ning
&
dist
ribut
ion Range
To
tal
Pro
duct
ion
&
cond
ition
ing
at
sour
ce
Tra
nsfo
rmat
ion
at s
ourc
e
Tra
nspo
rtat
ion
to m
arke
t
Tra
nsfo
rmat
ion
near
mar
ket
Con
ditio
ning
&
dist
ribut
ion Range
Tot
al G
HG
inc.
co
mbu
stio
n
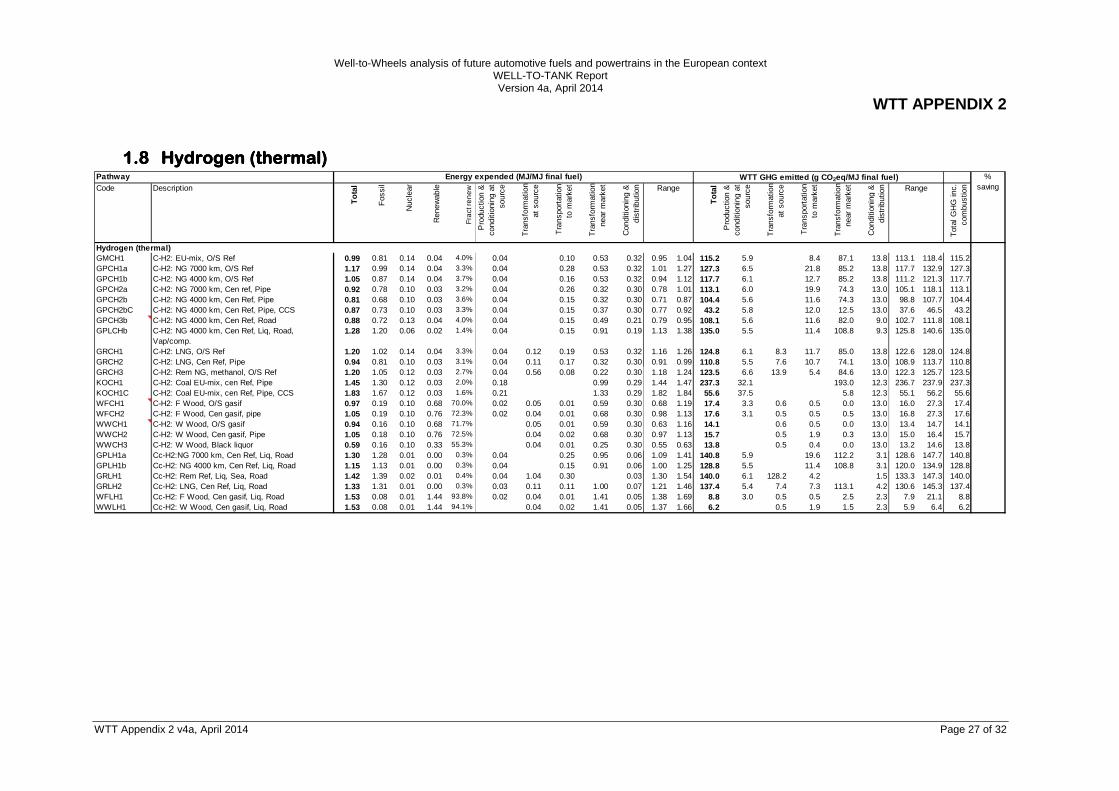
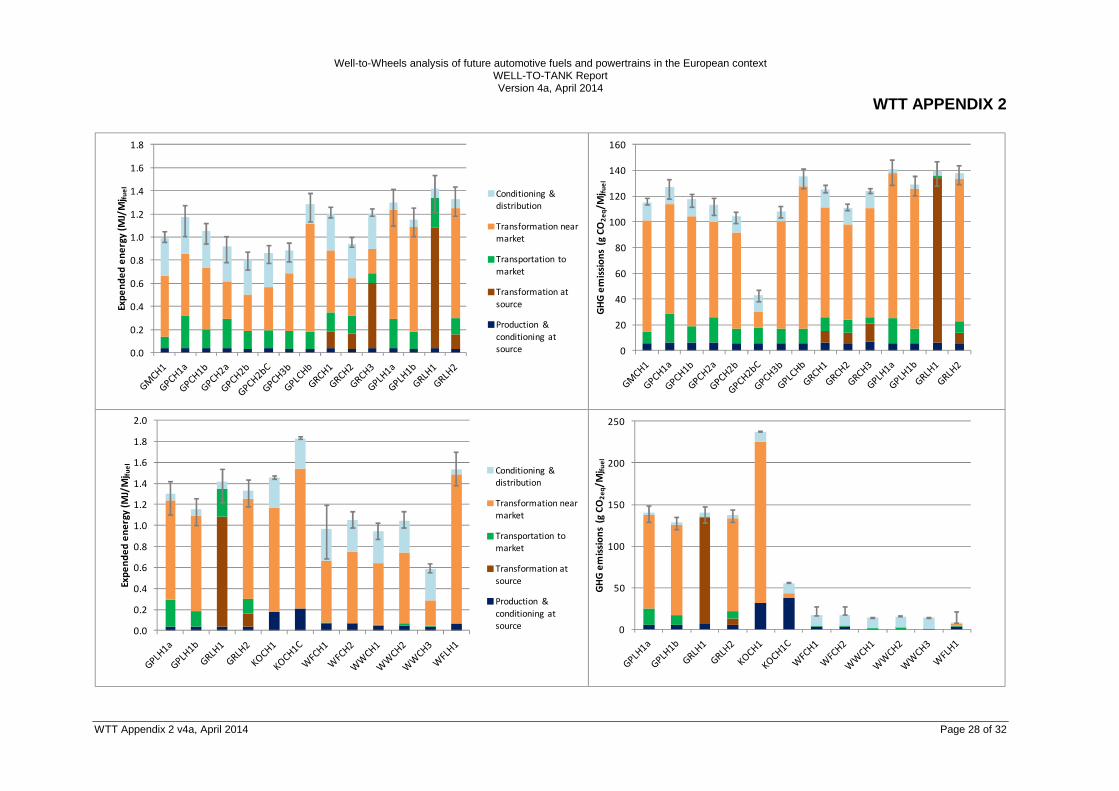
Hydrogen (thermal)GMCH1 C-H2: EU-mix, O/S Ref 0.99 0.81 0.14 0.04 4.0% 0.04 0.10 0.53 0.32 0.95 1.04 115.2 5.9 8.4 87.1 13.8 113.1 118.4 115.2GPCH1a C-H2: NG 7000 km, O/S Ref 1.17 0.99 0.14 0.04 3.3% 0.04 0.28 0.53 0.32 1.01 1.27 127.3 6.5 21.8 85.2 13.8 117.7 132.9 127.3GPCH1b C-H2: NG 4000 km, O/S Ref 1.05 0.87 0.14 0.04 3.7% 0.04 0.16 0.53 0.32 0.94 1.12 117.7 6.1 12.7 85.2 13.8 111.2 121.3 117.7GPCH2a C-H2: NG 7000 km, Cen ref, Pipe 0.92 0.78 0.10 0.03 3.2% 0.04 0.26 0.32 0.30 0.78 1.01 113.1 6.0 19.9 74.3 13.0 105.1 118.1 113.1GPCH2b C-H2: NG 4000 km, Cen Ref, Pipe 0.81 0.68 0.10 0.03 3.6% 0.04 0.15 0.32 0.30 0.71 0.87 104.4 5.6 11.6 74.3 13.0 98.8 107.7 104.4GPCH2bC C-H2: NG 4000 km, Cen Ref, Pipe, CCS 0.87 0.73 0.10 0.03 3.3% 0.04 0.15 0.37 0.30 0.77 0.92 43.2 5.8 12.0 12.5 13.0 37.6 46.5 43.2GPCH3b C-H2: NG 4000 km, Cen Ref, Road 0.88 0.72 0.13 0.04 4.0% 0.04 0.15 0.49 0.21 0.79 0.95 108.1 5.6 11.6 82.0 9.0 102.7 111.8 108.1GPLCHb C-H2: NG 4000 km, Cen Ref, Liq, Road,
Vap/comp.1.28 1.20 0.06 0.02 1.4% 0.04 0.15 0.91 0.19 1.13 1.38 135.0 5.5 11.4 108.8 9.3 125.8 140.6 135.0
GRCH1 C-H2: LNG, O/S Ref 1.20 1.02 0.14 0.04 3.3% 0.04 0.12 0.19 0.53 0.32 1.16 1.26 124.8 6.1 8.3 11.7 85.0 13.8 122.6 128.0 124.8GRCH2 C-H2: LNG, Cen Ref, Pipe 0.94 0.81 0.10 0.03 3.1% 0.04 0.11 0.17 0.32 0.30 0.91 0.99 110.8 5.5 7.6 10.7 74.1 13.0 108.9 113.7 110.8GRCH3 C-H2: Rem NG, methanol, O/S Ref 1.20 1.05 0.12 0.03 2.7% 0.04 0.56 0.08 0.22 0.30 1.18 1.24 123.5 6.6 13.9 5.4 84.6 13.0 122.3 125.7 123.5KOCH1 C-H2: Coal EU-mix, cen Ref, Pipe 1.45 1.30 0.12 0.03 2.0% 0.18 0.99 0.29 1.44 1.47 237.3 32.1 193.0 12.3 236.7 237.9 237.3KOCH1C C-H2: Coal EU-mix, cen Ref, Pipe, CCS 1.83 1.67 0.12 0.03 1.6% 0.21 1.33 0.29 1.82 1.84 55.6 37.5 5.8 12.3 55.1 56.2 55.6WFCH1 C-H2: F Wood, O/S gasif 0.97 0.19 0.10 0.68 70.0% 0.02 0.05 0.01 0.59 0.30 0.68 1.19 17.4 3.3 0.6 0.5 0.0 13.0 16.0 27.3 17.4WFCH2 C-H2: F Wood, Cen gasif, pipe 1.05 0.19 0.10 0.76 72.3% 0.02 0.04 0.01 0.68 0.30 0.98 1.13 17.6 3.1 0.5 0.5 0.5 13.0 16.8 27.3 17.6WWCH1 C-H2: W Wood, O/S gasif 0.94 0.16 0.10 0.68 71.7% 0.05 0.01 0.59 0.30 0.63 1.16 14.1 0.6 0.5 0.0 13.0 13.4 14.7 14.1WWCH2 C-H2: W Wood, Cen gasif, Pipe 1.05 0.18 0.10 0.76 72.5% 0.04 0.02 0.68 0.30 0.97 1.13 15.7 0.5 1.9 0.3 13.0 15.0 16.4 15.7WWCH3 C-H2: W Wood, Black liquor 0.59 0.16 0.10 0.33 55.3% 0.04 0.01 0.25 0.30 0.55 0.63 13.8 0.5 0.4 0.0 13.0 13.2 14.6 13.8GPLH1a Cc-H2:NG 7000 km, Cen Ref, Liq, Road 1.30 1.28 0.01 0.00 0.3% 0.04 0.25 0.95 0.06 1.09 1.41 140.8 5.9 19.6 112.2 3.1 128.6 147.7 140.8GPLH1b Cc-H2: NG 4000 km, Cen Ref, Liq, Road 1.15 1.13 0.01 0.00 0.3% 0.04 0.15 0.91 0.06 1.00 1.25 128.8 5.5 11.4 108.8 3.1 120.0 134.9 128.8GRLH1 Cc-H2: Rem Ref, Liq, Sea, Road 1.42 1.39 0.02 0.01 0.4% 0.04 1.04 0.30 0.03 1.30 1.54 140.0 6.1 128.2 4.2 1.5 133.3 147.3 140.0GRLH2 Cc-H2: LNG, Cen Ref, Liq, Road 1.33 1.31 0.01 0.00 0.3% 0.03 0.11 0.11 1.00 0.07 1.21 1.46 137.4 5.4 7.4 7.3 113.1 4.2 130.6 145.3 137.4WFLH1 Cc-H2: F Wood, Cen gasif, Liq, Road 1.53 0.08 0.01 1.44 93.8% 0.02 0.04 0.01 1.41 0.05 1.38 1.69 8.8 3.0 0.5 0.5 2.5 2.3 7.9 21.1 8.8WWLH1 Cc-H2: W Wood, Cen gasif, Liq, Road 1.53 0.08 0.01 1.44 94.1% 0.04 0.02 1.41 0.05 1.37 1.66 6.2 0.5 1.9 1.5 2.3 5.9 6.4 6.2
Energy expended (MJ/MJ final fuel) WTT GHG emitted (g CO2eq/MJ final fuel) %saving
Well-to-Wheels analysis of future automotive fuels and powertrains in the European context WELL-TO-TANK Report Version 4a, April 2014
WTT APPENDIX 2
WTT Appendix 2 v4a, April 2014 Page 28 of 32
0.0
0.2
0.4
0.6
0.8
1.0
1.2
1.4
1.6
1.8
Ex
pe
nd
ed
en
erg
y (
MJ/
Mj f
ue
l
Conditioning &
distribution
Transformation near
market
Transportation to
market
Transformation at
source
Production &
conditioning at
source 0
20
40
60
80
100
120
140
160
GH
G e
mis
sio
ns
(g C
O2
eq/
Mj f
ue
l
0.0
0.2
0.4
0.6
0.8
1.0
1.2
1.4
1.6
1.8
2.0
Ex
pe
nd
ed
en
erg
y (
MJ/
Mj f
ue
l
Conditioning &
distribution
Transformation near
market
Transportation to
market
Transformation at
source
Production &
conditioning at
source 0
50
100
150
200
250
GH
G e
mis
sio
ns
(g C
O2
eq/
Mj f
ue
l
Well-to-Wheels analysis of future automotive fuels and powertrains in the European context WELL-TO-TANK Report Version 4a, April 2014
WTT APPENDIX 2
WTT Appendix 2 v4a, April 2014 Page 29 of 32
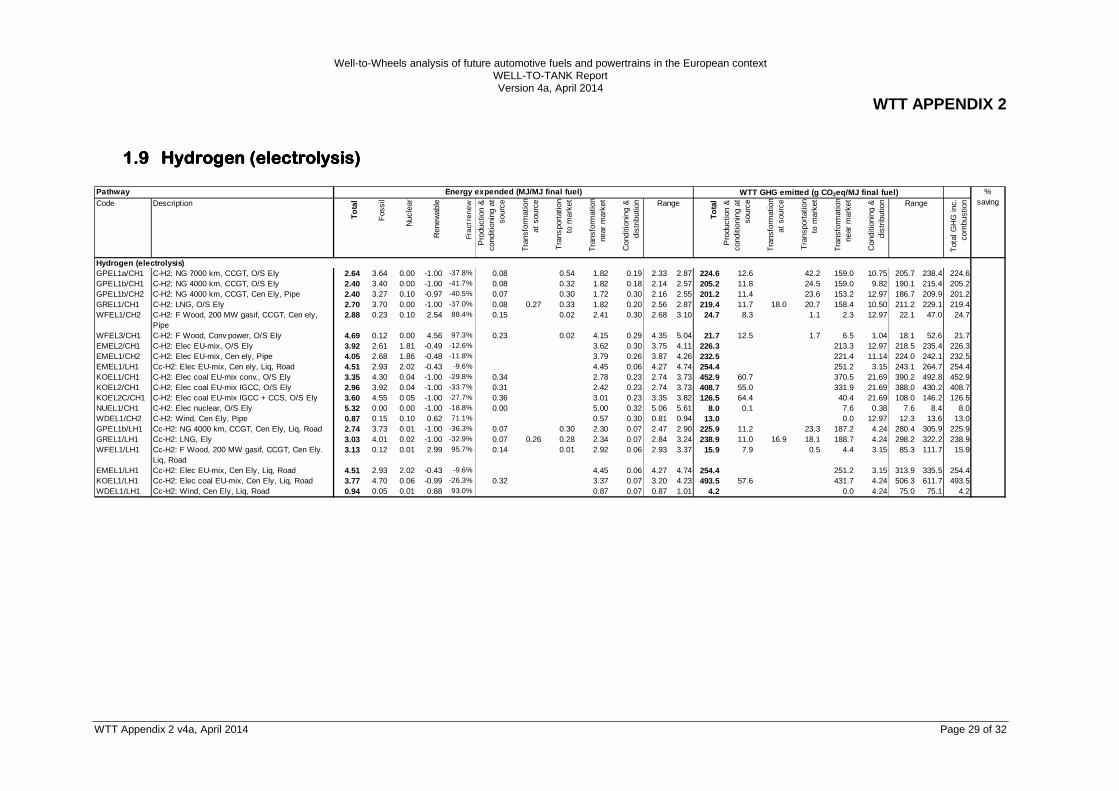
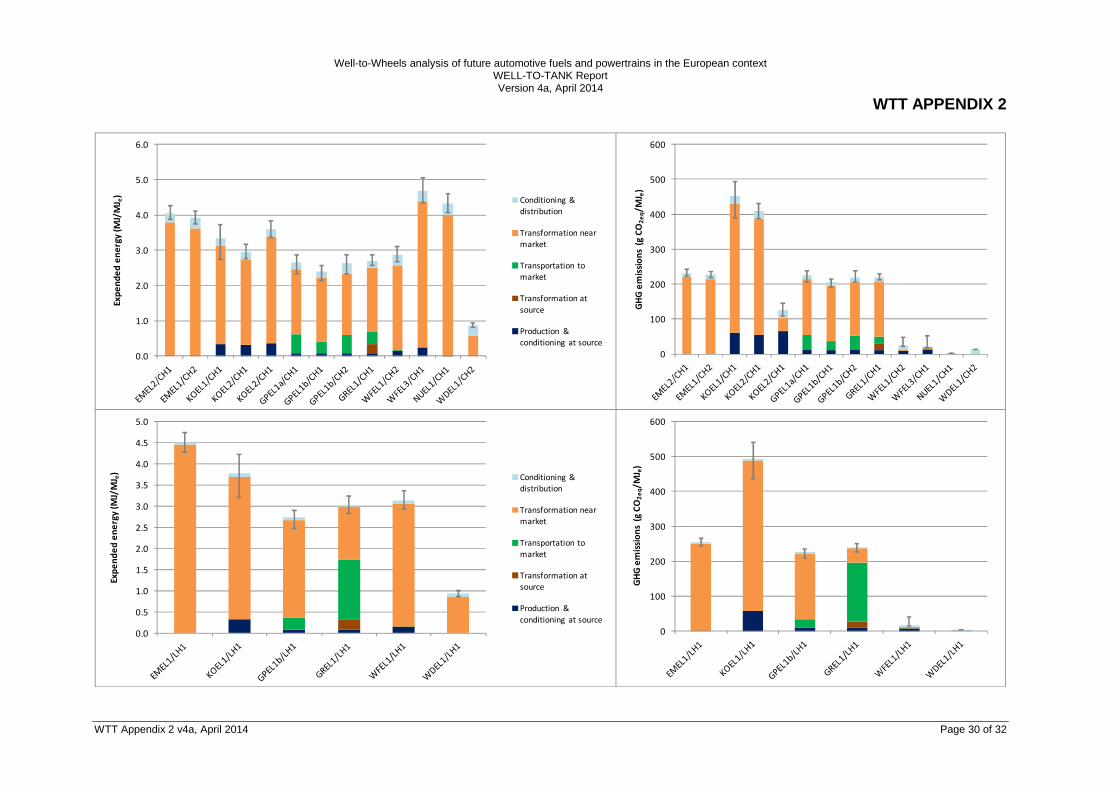
1.91.91.91.9 Hydrogen (electrolysis)Hydrogen (electrolysis)Hydrogen (electrolysis)Hydrogen (electrolysis) PathwayCode Description
To
tal
Fos
sil
Nuc
lear
Ren
ewab
le
Fra
ct re
ne
w
Pro
duct
ion
&
cond
ition
ing
at
sour
ce
Tra
nsfo
rmat
ion
at s
ourc
e
Tra
nspo
rtat
ion
to m
arke
t
Tra
nsfo
rmat
ion
near
mar
ket
Con
ditio
ning
&
dist
ribut
ion Range
To
tal
Pro
duct
ion
&
cond
ition
ing
at
sour
ce
Tra
nsfo
rmat
ion
at s
ourc
e
Tra
nspo
rtat
ion
to m
arke
t
Tra
nsfo
rmat
ion
near
mar
ket
Con
ditio
ning
&
dist
ribut
ion Range
Tot
al G
HG
inc.
co
mbu
stio
n
Hydrogen (electrolysis)GPEL1a/CH1 C-H2: NG 7000 km, CCGT, O/S Ely 2.64 3.64 0.00 -1.00 -37.8% 0.08 0.54 1.82 0.19 2.33 2.87 224.6 12.6 42.2 159.0 10.75 205.7 238.4 224.6GPEL1b/CH1 C-H2: NG 4000 km, CCGT, O/S Ely 2.40 3.40 0.00 -1.00 -41.7% 0.08 0.32 1.82 0.18 2.14 2.57 205.2 11.8 24.5 159.0 9.82 190.1 215.4 205.2GPEL1b/CH2 C-H2: NG 4000 km, CCGT, Cen Ely, Pipe 2.40 3.27 0.10 -0.97 -40.5% 0.07 0.30 1.72 0.30 2.16 2.55 201.2 11.4 23.6 153.2 12.97 186.7 209.9 201.2GREL1/CH1 C-H2: LNG, O/S Ely 2.70 3.70 0.00 -1.00 -37.0% 0.08 0.27 0.33 1.82 0.20 2.56 2.87 219.4 11.7 18.0 20.7 158.4 10.50 211.2 229.1 219.4WFEL1/CH2 C-H2: F Wood, 200 MW gasif, CCGT, Cen ely,
Pipe2.88 0.23 0.10 2.54 88.4% 0.15 0.02 2.41 0.30 2.68 3.10 24.7 8.3 1.1 2.3 12.97 22.1 47.0 24.7
WFEL3/CH1 C-H2: F Wood, Conv power, O/S Ely 4.69 0.12 0.00 4.56 97.3% 0.23 0.02 4.15 0.29 4.35 5.04 21.7 12.5 1.7 6.5 1.04 18.1 52.6 21.7EMEL2/CH1 C-H2: Elec EU-mix, O/S Ely 3.92 2.61 1.81 -0.49 -12.6% 3.62 0.30 3.75 4.11 226.3 213.3 12.97 218.5 235.4 226.3EMEL1/CH2 C-H2: Elec EU-mix, Cen ely, Pipe 4.05 2.68 1.86 -0.48 -11.8% 3.79 0.26 3.87 4.26 232.5 221.4 11.14 224.0 242.1 232.5EMEL1/LH1 Cc-H2: Elec EU-mix, Cen ely, Liq, Road 4.51 2.93 2.02 -0.43 -9.6% 4.45 0.06 4.27 4.74 254.4 251.2 3.15 243.1 264.7 254.4KOEL1/CH1 C-H2: Elec coal EU-mix conv., O/S Ely 3.35 4.30 0.04 -1.00 -29.8% 0.34 2.78 0.23 2.74 3.73 452.9 60.7 370.5 21.69 390.2 492.8 452.9KOEL2/CH1 C-H2: Elec coal EU-mix IGCC, O/S Ely 2.96 3.92 0.04 -1.00 -33.7% 0.31 2.42 0.23 2.74 3.73 408.7 55.0 331.9 21.69 388.0 430.2 408.7KOEL2C/CH1 C-H2: Elec coal EU-mix IGCC + CCS, O/S Ely 3.60 4.55 0.05 -1.00 -27.7% 0.36 3.01 0.23 3.35 3.82 126.5 64.4 40.4 21.69 108.0 146.2 126.5NUEL1/CH1 C-H2: Elec nuclear, O/S Ely 5.32 0.00 0.00 -1.00 -18.8% 0.00 5.00 0.32 5.06 5.61 8.0 0.1 7.6 0.38 7.6 8.4 8.0WDEL1/CH2 C-H2: Wind, Cen Ely, Pipe 0.87 0.15 0.10 0.62 71.1% 0.57 0.30 0.81 0.94 13.0 0.0 12.97 12.3 13.6 13.0GPEL1b/LH1 Cc-H2: NG 4000 km, CCGT, Cen Ely, Liq, Road 2.74 3.73 0.01 -1.00 -36.3% 0.07 0.30 2.30 0.07 2.47 2.90 225.9 11.2 23.3 187.2 4.24 280.4 305.9 225.9GREL1/LH1 Cc-H2: LNG, Ely 3.03 4.01 0.02 -1.00 -32.9% 0.07 0.26 0.28 2.34 0.07 2.84 3.24 238.9 11.0 16.9 18.1 188.7 4.24 298.2 322.2 238.9WFEL1/LH1 Cc-H2: F Wood, 200 MW gasif, CCGT, Cen Ely.
Liq, Road3.13 0.12 0.01 2.99 95.7% 0.14 0.01 2.92 0.06 2.93 3.37 15.9 7.9 0.5 4.4 3.15 85.3 111.7 15.9
EMEL1/LH1 Cc-H2: Elec EU-mix, Cen Ely, Liq, Road 4.51 2.93 2.02 -0.43 -9.6% 4.45 0.06 4.27 4.74 254.4 251.2 3.15 313.9 335.5 254.4KOEL1/LH1 Cc-H2: Elec coal EU-mix, Cen Ely, Liq, Road 3.77 4.70 0.06 -0.99 -26.3% 0.32 3.37 0.07 3.20 4.23 493.5 57.6 431.7 4.24 506.3 611.7 493.5WDEL1/LH1 Cc-H2: Wind, Cen Ely, Liq, Road 0.94 0.05 0.01 0.88 93.0% 0.87 0.07 0.87 1.01 4.2 0.0 4.24 75.0 75.1 4.2
Energy expended (MJ/MJ final fuel) WTT GHG emitted (g CO2eq/MJ final fuel) %saving
Well-to-Wheels analysis of future automotive fuels and powertrains in the European context WELL-TO-TANK Report Version 4a, April 2014
WTT APPENDIX 2
WTT Appendix 2 v4a, April 2014 Page 30 of 32
0.0
1.0
2.0
3.0
4.0
5.0
6.0
Ex
pe
nd
ed
en
erg
y (
MJ/
MJ e
)
Conditioning &
distribution
Transformation near
market
Transportation to
market
Transformation at
source
Production &
conditioning at source
0
100
200
300
400
500
600
GH
G e
mis
sio
ns
(g C
O2
eq/
MJ e
)0.0
0.5
1.0
1.5
2.0
2.5
3.0
3.5
4.0
4.5
5.0
Ex
pe
nd
ed
en
erg
y (
MJ/
MJ e
)
Conditioning &
distribution
Transformation near
market
Transportation to
market
Transformation at
source
Production &
conditioning at source
0
100
200
300
400
500
600
GH
G e
mis
sio
ns
(g C
O2
eq/
MJ e
)
European Commission
EUR 26237 – Joint Research Centre – Institute for Energy and Transport
Title: WELL-TO-TANK Appendix 2 - Version 4.a. Summary of energy and GHG balance of individual pathways.
Author(s): Robert EDWARDS (JRC), Jean-François LARIVÉ (CONCAWE), David RICKEARD (CONCAWE), Werner
WEINDORF (LBST)
Luxembourg: Publications Office of the European Union
2014 – 30 pp. – 21.0 x 29.7 cm
EUR – Scientific and Technical Research series – ISSN 1831-9424 (online)
ISBN 978-92-79-33888-5 (pdf)
doi:10.2790/95629
Abstract
The Well-to-Tank study describes the process of producing, transporting, manufacturing and distributing a number of
fuels suitable for road transport powertrains. It covers all steps from extracting, capturing or growing the primary energy
carrier to refuelling the vehicles with the finished fuel.
This Appendix 2 summarises the results for individual pathways.
This Version 4.a replaces Version 4.0 [Report EUR 26028 EN] published in 2013
LD-N
A-26237-EN
-N
DOI 10.2790/95629
ISBN 978-92-79-33888-5