Embed Size (px)
Citation preview
March 10, 2016
INITIATION Vocus Communications Ltd. (VOC.AX)
Neutral Equity Research
Well positioned for growth, stock fairly valued; initiate at Neutral
Investment view
We initiate on Vocus Communications (VOC) at Neutral with a 12-month
price target of A$8.50. The transformative merger with M2 Group (MTU)
brings together infrastructure assets with a large customer base and
distribution network, to create Australia’s 4th largest fixed line telco (3rd in
NZ). We believe its improved competitive positioning and lower product
pricing vs. TLS/Optus (and lower risk of legacy revenue cannibalization),
will enable it to increase its c.7% share in the A$18bn AU fixed line
market. However, with VOC trading at 20X FY17E P/E (vs. domestic peers
11-21X), we believe the stock offers limited upside on a 12-month view.
Core drivers of growth
We forecast FY16E-FY19E revenue CAGR +36%, EBITDA +35%, EPS +21%.
Key drivers include: (1) incorporation of MTU earnings including cost
synergies; (2) organic growth in both Corporate and Consumer segments
with VOC exposed to positive industry themes – secular demand for data
is driving take-up of high bandwidth corporate products and the NBN is
driving a transition to a reseller market and new market opportunities in
Consumer: (3) revenue synergies including lower consumer churn and
greater product sales over VOC infrastructure; and (4) attractive
economics in VOC’s core corporate business with 3yr payback on capex
and strong incremental margins. In the medium term, we believe VOC
will explore M&A opportunities to increase scale and capabilities.
Risks to the investment case
(+) Higher than expected market share wins & synergies, M&A.
(-) Competition, integration risk, lower than expected synergies.
Valuation
Our 12m target price of A$8.50 is based on an average of our DCF and
EV/EBIT methodologies.
Industry context
We estimate VOC’s addressable markets as: (1) A$18bn AU fixed line
(A$7bn Consumer, A$11bn Corporate); and (2) NZ$3bn NZ fixed line.
INVESTMENT LIST MEMBERSHIP
Neutral
Coverage View: Neutral
Raymond Tong +61(3)9679-1359 [email protected] Goldman Sachs Australia Pty Ltd Goldman Sachs does and seeks to do business with companies
covered in its research reports. As a result, investors should be aware that the firm may have a conflict of interest that could affect the objectivity of this report. Investors should consider this report as only a single factor in making their investment decision. For Reg AC certification and other important disclosures, see the Disclosure Appendix, or go to www.gs.com/research/hedge.html. Analysts employed by non-US affiliates are not registered/qualified as research analysts with FINRA in the U.S.
Kane Hannan +61(3)9679-1862 [email protected] Goldman Sachs Australia Pty LtdAnita Dinshaw +61(3)9679-1217 [email protected] Goldman Sachs Australia Pty Ltd
The Goldman Sachs Group, Inc. Global Investment Research
Growth
Returns *
Multiple
Volatility Volatility
Multiple
Returns *
Growth
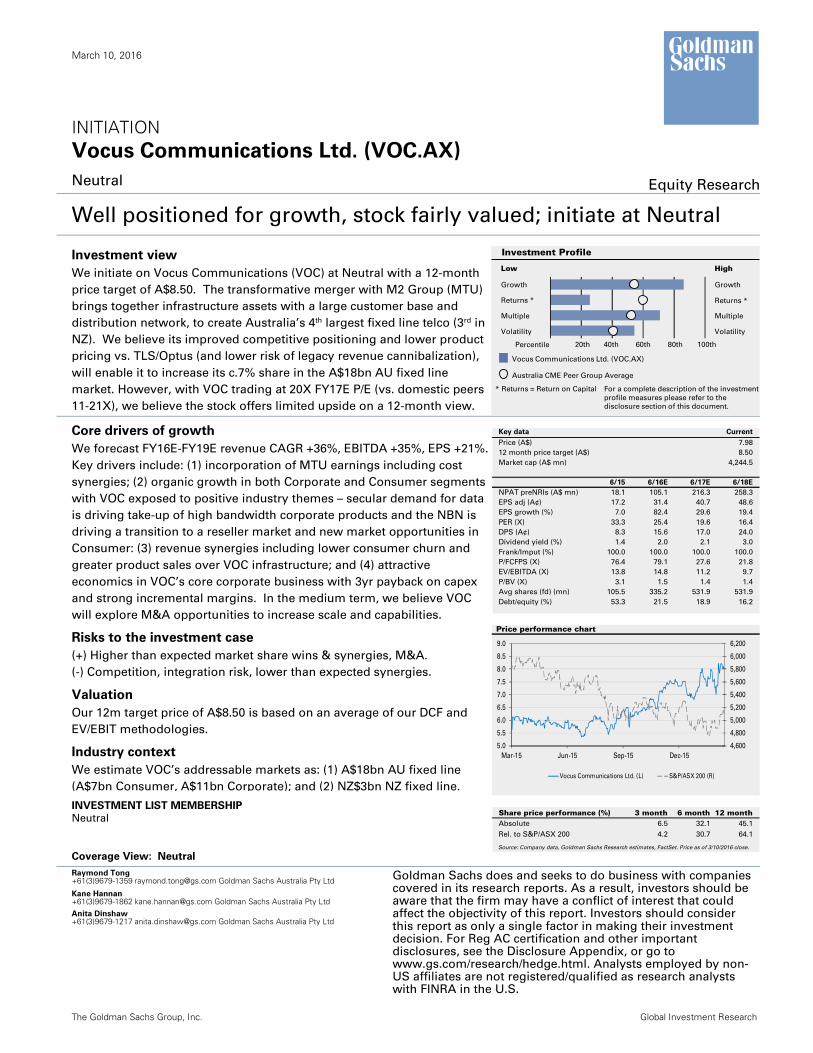
Investment Profile
Low High
Percentile 20th 40th 60th 80th 100th
* Returns = Return on Capital For a complete description of the investment
profile measures please refer to the
disclosure section of this document.
Vocus Communications Ltd. (VOC.AX)
Australia CME Peer Group Average
Key data Current
Price (A$) 7.98
12 month price target (A$) 8.50
Market cap (A$ mn) 4,244.5
6/15 6/16E 6/17E 6/18E
NPAT preNRIs (A$ mn) 18.1 105.1 216.3 258.3
EPS adj (A¢) 17.2 31.4 40.7 48.6
EPS growth (%) 7.0 82.4 29.6 19.4
PER (X) 33.3 25.4 19.6 16.4
DPS (A¢) 8.3 15.6 17.0 24.0
Dividend yield (%) 1.4 2.0 2.1 3.0
Frank/Imput (%) 100.0 100.0 100.0 100.0
P/FCFPS (X) 76.4 79.1 27.6 21.8
EV/EBITDA (X) 13.8 14.8 11.2 9.7
P/BV (X) 3.1 1.5 1.4 1.4
Avg shares (fd) (mn) 105.5 335.2 531.9 531.9
Debt/equity (%) 53.3 21.5 18.9 16.2
Price performance chart
4,600
4,800
5,000
5,200
5,400
5,600
5,800
6,000
6,200
5.0
5.5
6.0
6.5
7.0
7.5
8.0
8.5
9.0
Mar-15 Jun-15 Sep-15 Dec-15
Vocus Communications Ltd. (L) S&P/ASX 200 (R)
Share price performance (%) 3 month 6 month 12 monthAbsolute 6.5 32.1 45.1
Rel. to S&P/ASX 200 4.2 30.7 64.1
Source: Company data, Goldman Sachs Research estimates, FactSet. Price as of 3/10/2016 close.
March 10, 2016 Vocus Communications Ltd. (VOC.AX)
Goldman Sachs Global Investment Research 2
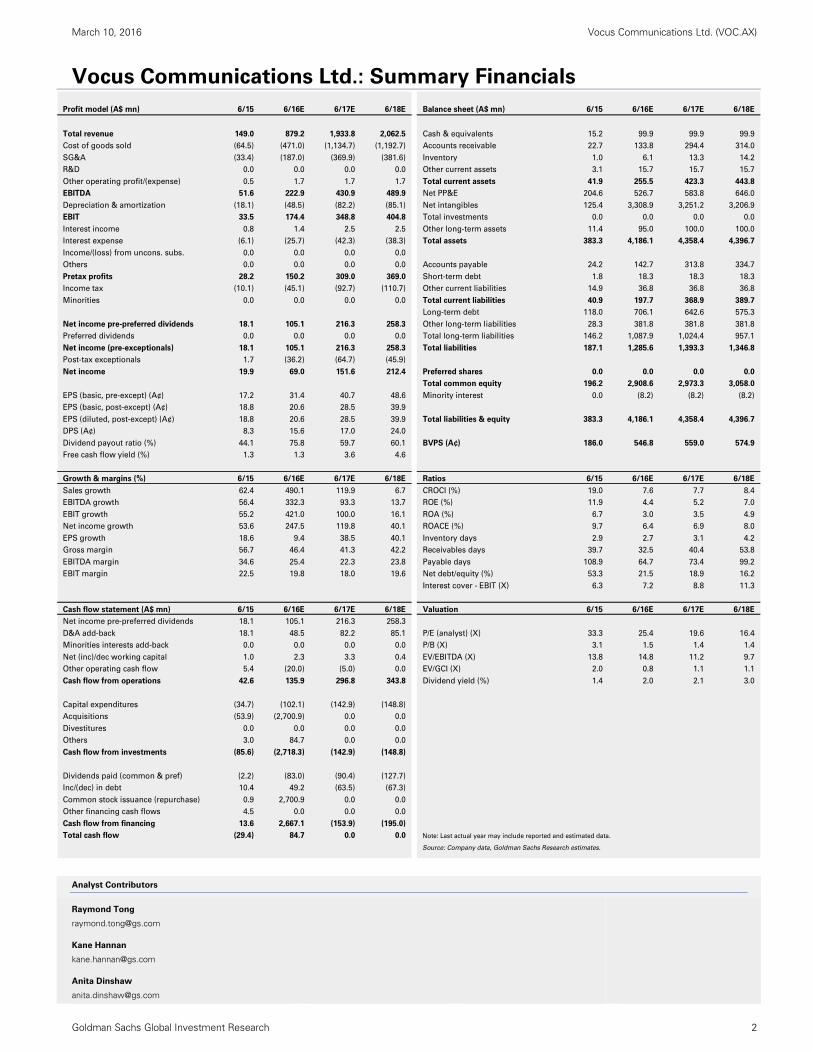
Vocus Communications Ltd.: Summary Financials
Analyst Contributors
Raymond Tong
Kane Hannan
Anita Dinshaw
Profit model (A$ mn) 6/15 6/16E 6/17E 6/18E Balance sheet (A$ mn) 6/15 6/16E 6/17E 6/18E
Total revenue 149.0 879.2 1,933.8 2,062.5 Cash & equivalents 15.2 99.9 99.9 99.9
Cost of goods sold (64.5) (471.0) (1,134.7) (1,192.7) Accounts receivable 22.7 133.8 294.4 314.0
SG&A (33.4) (187.0) (369.9) (381.6) Inventory 1.0 6.1 13.3 14.2
R&D 0.0 0.0 0.0 0.0 Other current assets 3.1 15.7 15.7 15.7
Other operating profit/(expense) 0.5 1.7 1.7 1.7 Total current assets 41.9 255.5 423.3 443.8
EBITDA 51.6 222.9 430.9 489.9 Net PP&E 204.6 526.7 583.8 646.0
Depreciation & amortization (18.1) (48.5) (82.2) (85.1) Net intangibles 125.4 3,308.9 3,251.2 3,206.9
EBIT 33.5 174.4 348.8 404.8 Total investments 0.0 0.0 0.0 0.0
Interest income 0.8 1.4 2.5 2.5 Other long-term assets 11.4 95.0 100.0 100.0
Interest expense (6.1) (25.7) (42.3) (38.3) Total assets 383.3 4,186.1 4,358.4 4,396.7
Income/(loss) from uncons. subs. 0.0 0.0 0.0 0.0
Others 0.0 0.0 0.0 0.0 Accounts payable 24.2 142.7 313.8 334.7
Pretax profits 28.2 150.2 309.0 369.0 Short-term debt 1.8 18.3 18.3 18.3
Income tax (10.1) (45.1) (92.7) (110.7) Other current liabilities 14.9 36.8 36.8 36.8
Minorities 0.0 0.0 0.0 0.0 Total current liabilities 40.9 197.7 368.9 389.7
Long-term debt 118.0 706.1 642.6 575.3
Net income pre-preferred dividends 18.1 105.1 216.3 258.3 Other long-term liabilities 28.3 381.8 381.8 381.8
Preferred dividends 0.0 0.0 0.0 0.0 Total long-term liabilities 146.2 1,087.9 1,024.4 957.1
Net income (pre-exceptionals) 18.1 105.1 216.3 258.3 Total liabilities 187.1 1,285.6 1,393.3 1,346.8
Post-tax exceptionals 1.7 (36.2) (64.7) (45.9)
Net income 19.9 69.0 151.6 212.4 Preferred shares 0.0 0.0 0.0 0.0
Total common equity 196.2 2,908.6 2,973.3 3,058.0
EPS (basic, pre-except) (A¢) 17.2 31.4 40.7 48.6 Minority interest 0.0 (8.2) (8.2) (8.2)
EPS (basic, post-except) (A¢) 18.8 20.6 28.5 39.9
EPS (diluted, post-except) (A¢) 18.8 20.6 28.5 39.9 Total liabilities & equity 383.3 4,186.1 4,358.4 4,396.7
DPS (A¢) 8.3 15.6 17.0 24.0
Dividend payout ratio (%) 44.1 75.8 59.7 60.1 BVPS (A¢) 186.0 546.8 559.0 574.9
Free cash flow yield (%) 1.3 1.3 3.6 4.6
Growth & margins (%) 6/15 6/16E 6/17E 6/18E Ratios 6/15 6/16E 6/17E 6/18E
Sales growth 62.4 490.1 119.9 6.7 CROCI (%) 19.0 7.6 7.7 8.4
EBITDA growth 56.4 332.3 93.3 13.7 ROE (%) 11.9 4.4 5.2 7.0
EBIT growth 55.2 421.0 100.0 16.1 ROA (%) 6.7 3.0 3.5 4.9
Net income growth 53.6 247.5 119.8 40.1 ROACE (%) 9.7 6.4 6.9 8.0
EPS growth 18.6 9.4 38.5 40.1 Inventory days 2.9 2.7 3.1 4.2
Gross margin 56.7 46.4 41.3 42.2 Receivables days 39.7 32.5 40.4 53.8
EBITDA margin 34.6 25.4 22.3 23.8 Payable days 108.9 64.7 73.4 99.2
EBIT margin 22.5 19.8 18.0 19.6 Net debt/equity (%) 53.3 21.5 18.9 16.2
Interest cover - EBIT (X) 6.3 7.2 8.8 11.3
Cash flow statement (A$ mn) 6/15 6/16E 6/17E 6/18E Valuation 6/15 6/16E 6/17E 6/18E
Net income pre-preferred dividends 18.1 105.1 216.3 258.3
D&A add-back 18.1 48.5 82.2 85.1 P/E (analyst) (X) 33.3 25.4 19.6 16.4
Minorities interests add-back 0.0 0.0 0.0 0.0 P/B (X) 3.1 1.5 1.4 1.4
Net (inc)/dec working capital 1.0 2.3 3.3 0.4 EV/EBITDA (X) 13.8 14.8 11.2 9.7
Other operating cash flow 5.4 (20.0) (5.0) 0.0 EV/GCI (X) 2.0 0.8 1.1 1.1
Cash flow from operations 42.6 135.9 296.8 343.8 Dividend yield (%) 1.4 2.0 2.1 3.0
Capital expenditures (34.7) (102.1) (142.9) (148.8)
Acquisitions (53.9) (2,700.9) 0.0 0.0
Divestitures 0.0 0.0 0.0 0.0
Others 3.0 84.7 0.0 0.0
Cash flow from investments (85.6) (2,718.3) (142.9) (148.8)
Dividends paid (common & pref) (2.2) (83.0) (90.4) (127.7)
Inc/(dec) in debt 10.4 49.2 (63.5) (67.3)
Common stock issuance (repurchase) 0.9 2,700.9 0.0 0.0
Other financing cash flows 4.5 0.0 0.0 0.0
Cash flow from financing 13.6 2,667.1 (153.9) (195.0)
Total cash flow (29.4) 84.7 0.0 0.0 Note: Last actual year may include reported and estimated data.
Source: Company data, Goldman Sachs Research estimates.
March 10, 2016 Vocus Communications Ltd. (VOC.AX)
Goldman Sachs Global Investment Research 3
Contents
Executive Summary 4
Company strategy and profile 6
Outlook and key stock drivers 12
Building blocks in place to win share across Consumer & Corporate 12
Corporate: Infrastructure ownership, secular demand for data, strong economics 12
Consumer: Strong industry growth, NBN opportunity 14
Synergies: We see upside from potential revenue synergies 16
We expect VOC will continue to pursue M&A opportunities 18
Industry overview 20
Financial forecasts 25
Valuation 27
Key risks 29
Board and Senior management 30
Appendix 1 – Economics of VOC/MTU migration to NBN 31
Economics of migration from TLS copper to NBN 31
Economics of migration from PSTN services to hosted voice 31
Appendix 2 – Consumer Broadband Plans 32
Appendix 3 – Telco Glossary 32
Disclosure Appendix 33
March 10, 2016 Vocus Communications Ltd. (VOC.AX)
Goldman Sachs Global Investment Research 4
Executive Summary
Well positioned for growth; stock fairly valued; initiate at Neutral
We initiate coverage on Vocus Communications (VOC) with a Neutral rating and 12-month
price target of A$8.50. The transformative merger with M2 Group (MTU) brings together
infrastructure assets with a large customer base and distribution network, to create
Australia’s 4th largest fixed line telco (and 3rd in NZ). We believe its improved competitive
positioning and lower product pricing vs. TLS/Optus (and lower risk of legacy revenue
cannibalization), will enable it to increase its c.7% share of the A$18bn AU fixed line market.
However, with the stock trading at 20X FY17E P/E (vs. domestic peers 11-21X) we believe
the stock offers limited upside on a 12-month view.
Key drivers of growth
We forecast FY16E-FY19E revenue CAGR +36%, EBITDA +35%, EPS +21%. Key drivers
include: (1) incorporation of MTU earnings including cost synergies; (2) organic growth in
both the Corporate and Consumer segments; (3) revenue synergies including lower
consumer churn and greater product sales over VOC infrastructure; and (4) attractive
economics in VOC’s core infrastructure based corporate business.
We believe VOC is well positioned to drive growth:
Positioned to increase market share:
Low market share in a large addressable market: We estimate VOC/MTU has low
market share: (1) 6% of the A$7bn Australian fixed line Consumer market; (2) 7% in
A$11bn fixed line Corporate market; and (3) c.9% share of NZ$3bn NZ fixed line market.
Improved competitive positioning following consolidation: We believe VOC has a
stronger competitive positioning following its transformative M&A with MTU,
combining: (1) national fibre network; (2) national distribution assets; and (3) increased
scale.
Lower pricing vs. incumbents: (1) in Corporate, VOC seeks to price its products
c.15% below TLS; (2) in Consumer, we estimate MTU through the Dodo brand prices
broadband products at c.20-40% discount to incumbents TLS/Optus, while at largely
similar levels to TPM.
Exposure to positive industry themes:
Corporate: We believe VOC will continue to benefit from secular demand for data that
is driving demand for high bandwidth products. We believe: (1) the economics are
positive in the Corporate segment with 3-year payback for capex investments and
strong incremental margins; and (2) VOC does not have significant exposure to the
risks of cannibalization of legacy products unlike its larger competitors TLS and Optus.
Consumer: We believe VOC, given its low market share, stands to benefit from the
rollout of the National Broadband Network (NBN) in Australia and Ultra-Fast
Broadband (UFB) in NZ. This could potentially be an opportunity for VOC to win
market share as customers migrate from copper to the NBN/UFB and the industry
transitions to a reseller model in Australia.
March 10, 2016 Vocus Communications Ltd. (VOC.AX)
Goldman Sachs Global Investment Research 5
Synergies from consolidation:
Costs: VOC is targeting c.A$40mn of cost synergies by FY18E. We note this
represents c.4% of VOC/MTU combined cost base, which looks conservative compared
with recent transactions.
Revenues: We believe the key areas of revenue synergies include: (1) lowering
Consumer broadband churn from high levels of c.2.8%/month by increasing use of
VOC infrastructure to improve bandwidth capacity; and (2) leveraging MTU’s sales
force and distribution assets to increase product sales to SMB segments in VOC on-net
buildings.
We expect VOC to continue to explore M&A opportunities
While the Australian telco market has consolidated, we expect VOC to continue to explore
M&A opportunities across Australia and New Zealand (ANZ) to increase its network
footprint, scale and capabilities, consistent with management’s stated strategy.
We assume VOC will deleverage from its proforma 1H16 Net Debt/EBITDA 2.0X to 1.0X by
FY18E. While its dividend policy is yet to be determined, we have assumed a dividend
payout ratio of 50-60% which is lower than MTU’s prior dividend payout ratio of 70% given
the higher capital intensity of the combined entity.
Key risks: Competition, integration, forecast
Competition: VOC faces competition from larger operators Telstra (TLS), Optus and TPG
Telecom (TPM) (and Spark New Zealand (SPK), Vodafone NZ in NZ) who we believe have
stronger competitive positions given greater scale and ability to leverage mobile
infrastructure ownership (apart from TPM). Over time, it will likely face increased
competition in the Consumer segment from new entrants as the NBN rollout reaches
greater scale. However we note that VOC: (1) has the lowest market share among its key
competitors; and (2) is not facing a material increase in wholesale input costs (vs.
competitors) with the migration to the NBN.
M&A integration/execution risk: While both have a strong track record of integrating
acquisitions, combining VOC/MTU soon after VOC’s acquisition of AMM will likely to be
challenging. There is a risk that synergies from the merger may not be achieved.
Valuation: 12-month target price of A$8.50
Our 12-month target price of A$8.50 is based on a blended average of:
DCF valuation: Our DCF of A$8.30 is based on: (1) WACC 9.0%; and (2) terminal growth
rate (TGR) 2.5%.
EV/EBIT valuation: Our EV/EBIT based valuation is A$8.65 is based on an EV/EBIT
multiple of 15X on FY17E earnings. Our multiple of 15X compares with the average of 13X
for domestic peers and 16X for high growth international challengers.
Our 12-month target price of A$8.50 implies a FY16E/FY17E/FY18E P/E of 27X/21X/18X and
dividend yield of 1.8%/2.0%/2.8%.
March 10, 2016 Vocus Communications Ltd. (VOC.AX)
Goldman Sachs Global Investment Research 6
Company strategy and profile
Company background
Vocus Communications
Vocus is a telecommunications company offering fibre, ethernet and internet services
across ANZ. Founded in Australia in 2008 by James Spenceley as a voice and internet
services provider, it has since expanded its range of products and acquired a number of
data centres and fibre assets in ANZ, now owning national intracity infrastructure in
Australia. Vocus has also invested in international submarine cable capacity that connects
ANZ with Asia and the USA. It listed on the ASX in December 2014.
M2 Group
The M2 Group (MTU) is a retail and wholesale provider of telco (broadband, voice, and
mobile), utility and insurance services to Consumer and SMB customers. MTU was
founded in 1999 by Vaughan Bowen and listed on the ASX in October 2004. Like VOC,
MTU has also grown its business acquisitively, investing in a range of challenger brands to
expand its services; notable acquisitions include Commander, Primus, Dodo and CallPlus.
MTU delivers its fixed line and mobile products through reseller agreements with TLS and
Optus. Both wholesale contracts are due for renewal in July 2016.
Merged group
The combination of Vocus Communications and M2 Group (VOC) creates a full-service,
vertically integrated ANZ telco provider. VOC offers full internet coverage across all Points
of Interconnect (POI) in Australia’s NBN and NZ’s UFB and owns 1,791km of metro fibre,
more than 3,647 on-net buildings in Australia, as well as 4,500km of NZ fibre.
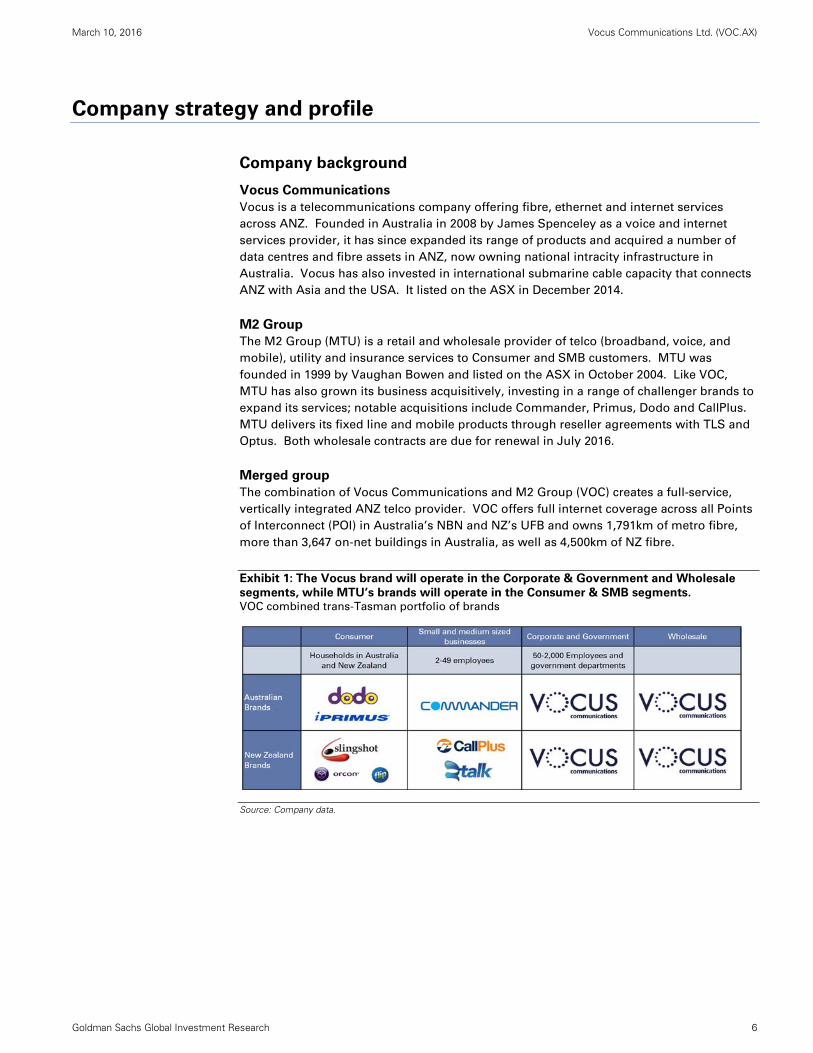
Exhibit 1: The Vocus brand will operate in the Corporate & Government and Wholesale
segments, while MTU’s brands will operate in the Consumer & SMB segments. VOC combined trans-Tasman portfolio of brands
Source: Company data.
March 10, 2016 Vocus Communications Ltd. (VOC.AX)
Goldman Sachs Global Investment Research 7
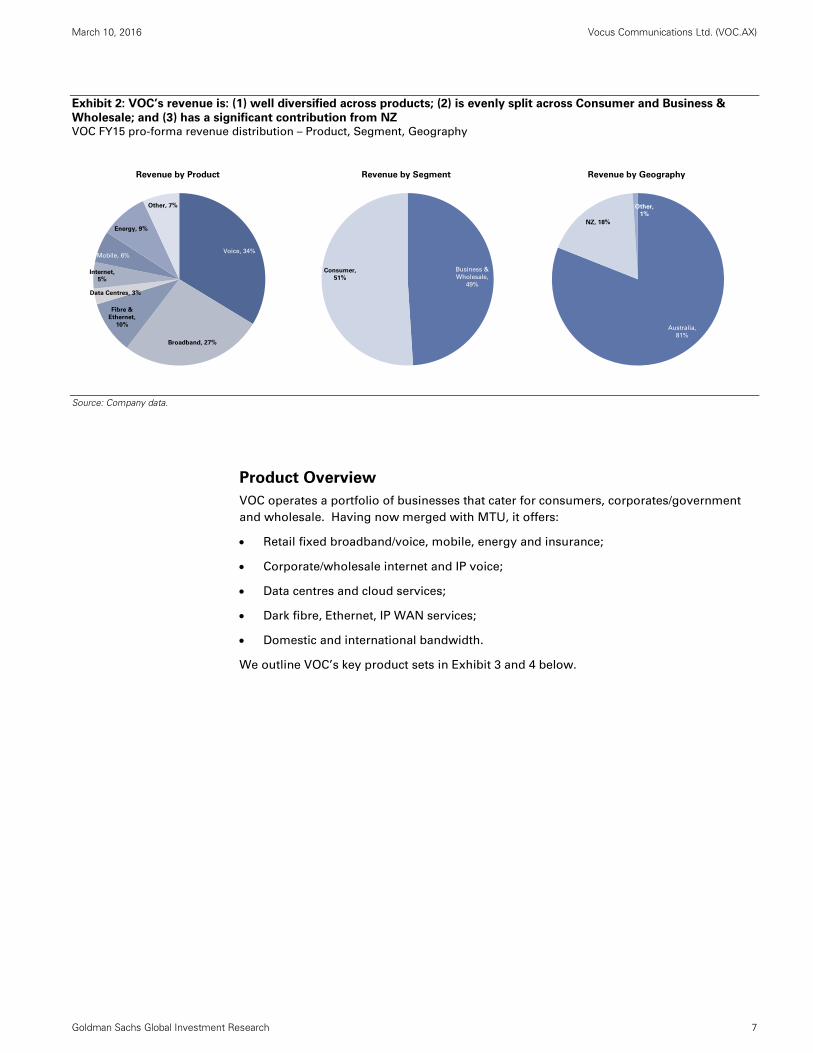
Exhibit 2: VOC’s revenue is: (1) well diversified across products; (2) is evenly split across Consumer and Business &
Wholesale; and (3) has a significant contribution from NZ VOC FY15 pro-forma revenue distribution – Product, Segment, Geography
Source: Company data.
Product Overview
VOC operates a portfolio of businesses that cater for consumers, corporates/government
and wholesale. Having now merged with MTU, it offers:
Retail fixed broadband/voice, mobile, energy and insurance;
Corporate/wholesale internet and IP voice;
Data centres and cloud services;
Dark fibre, Ethernet, IP WAN services;
Domestic and international bandwidth.
We outline VOC’s key product sets in Exhibit 3 and 4 below.
Voice, 34%
Fibre &
Ethernet,
10%
Internet,
5%
Mobile, 6%
Energy, 9%
Other, 7%
Data Centres, 3%
Broadband, 27%
Revenue by Product
Business &
Wholesale,
49%
Consumer,
51%
Revenue by Segment
Australia,
81%
NZ, 18%
Revenue by Geography
Other,
1%
March 10, 2016 Vocus Communications Ltd. (VOC.AX)
Goldman Sachs Global Investment Research 8
Exhibit 3: Vocus current products
Source: Company data, Goldman Sachs Global Investment Research.
Exhibit 4: M2 current products
Source: Company data, Goldman Sachs Global Investment Research.
Description
Dark Fibre A point-to-point connection, with virtually unlimited bandwidth. Raw fibre pairs
leased to customers, who then light the fibre using their network gear.
Ethernet &
Ethernet Multipoint
A point-to-point or multipoint network that connects domestic and international
locations. Offered on a shared or dedicated basis, at various speeds
IP WAN A full service network offering (Ethernet/ADSL/NBN, Data centres, Software)
Cloud Connect Dedicated bandwidth to Australias top public clouds (AWS, Microsoft Azure)
Internet Express Fibre internet offered to Vocus' on-net buildings
Business Internet High performance, carrier grade internet
IP Transit Delivers internet access and transit on Vocus IP network
DDOS Protection Protection against Distributed Denial of Services
IP TEL IP based voice services
SIP Trunks Unified Comms delivered to customers equipped with SIP based exchanges
Cloud Collaboration Telephony, Video Conferencing, Messaging, Presence and Mobility applications
Cloud Compute A private, shared cloud platform, available from multiple sites across Australia
Backup & Archive Secure, off-site server hosting backup and archiving
Disaster Recovery Secondary (separate) locations to allow business continuity
Data
Centres
Provides colocation services - space, power and cooling suitable to house and
power customers' storage and network infrastructure.
Data
Networks
Internet
Unified
Comms
Cloud
Product Suite
Description
Broadband Offers ADSL2+, NBN, UFB, dial-up and some fibre services
Voice Fixed line voice, NBN home phones, VoIP through Telstra/NBN (fixed)
Mobile SIM-only mobile plans through Optus (mobile) network
TV Subscription Television services via Fetch TV
Energy Retails electricity in VIC/NSW/SA/QLD and gas in VIC/NSW
Insurance Car, Home, Contents and Travel insurance
Broadband Offers ADSL2+, NBN, and EFM broadband through the Telstra/NBN networks
Voice Fixed line VoIP, SIP Trunking through Telstra/NBN (fixed)
Mobile SIM-only mobile plans through Optus (mobile) network
Energy Retails electricity in VIC/NSW/SA
Wholesale M2 resells fixed and mobile voice and internet services, VoIP services and cloud
communication services to junior reseller telecommunications providers
Product Suite
Business
Consumer
March 10, 2016
Vocus Com
munications Ltd. (VO
C.A
X)
Goldm
an Sachs Global Investm
ent Research
9
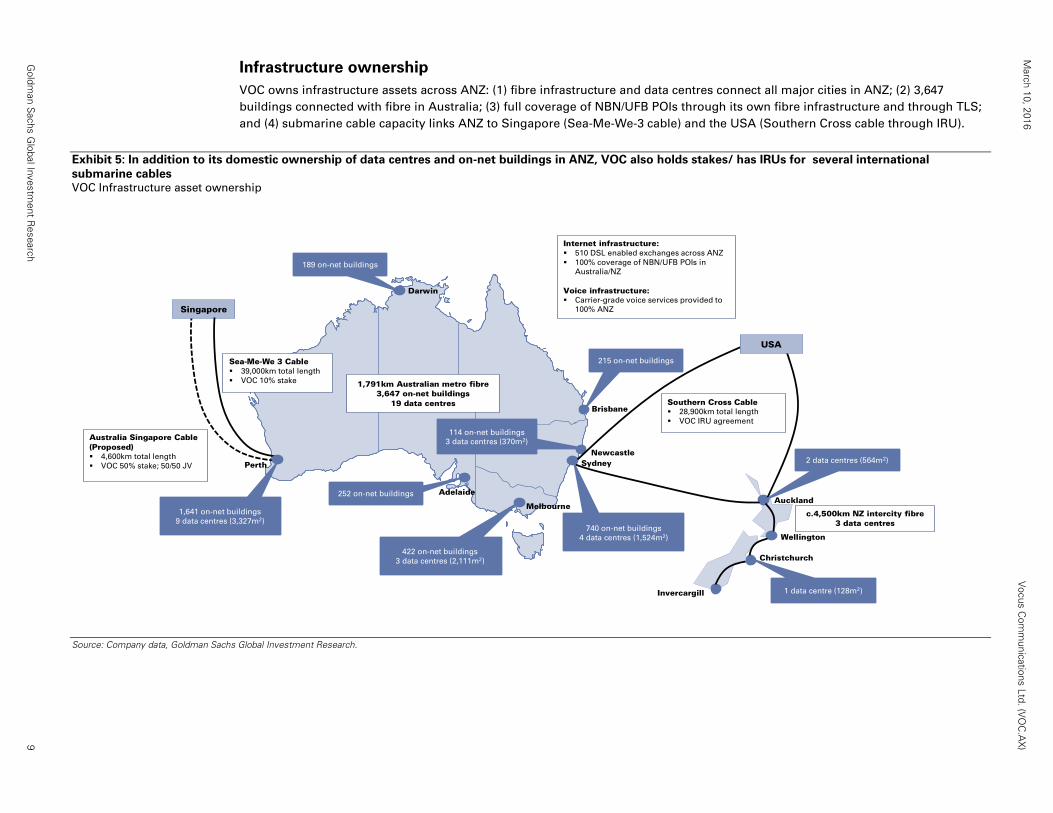
Infrastructure ownership
VOC owns infrastructure assets across ANZ: (1) fibre infrastructure and data centres connect all major cities in ANZ; (2) 3,647
buildings connected with fibre in Australia; (3) full coverage of NBN/UFB POIs through its own fibre infrastructure and through TLS;
and (4) submarine cable capacity links ANZ to Singapore (Sea-Me-We-3 cable) and the USA (Southern Cross cable through IRU).
Exhibit 5: In addition to its domestic ownership of data centres and on-net buildings in ANZ, VOC also holds stakes/ has IRUs for several international
submarine cables VOC Infrastructure asset ownership
Source: Company data, Goldman Sachs Global Investment Research.
Brisbane
NewcastleSydney
Melbourne
Adelaide
Darwin
Perth
Auckland
Wellington
Christchurch
Invercargill
USA
Singapore
c.4,500km NZ intercity fibre3 data centres
1,791km Australian metro fibre3,647 on-net buildings
19 data centres
189 on-net buildings
114 on-net buildings
3 data centres (370m2)
252 on-net buildings
2 data centres (564m2)
1 data centre (128m2)
Internet infrastructure: 510 DSL enabled exchanges across ANZ
100% coverage of NBN/UFB POIs in
Australia/NZ
Voice infrastructure: Carrier-grade voice services provided to
100% ANZ
Sea-Me-We 3 Cable 39,000km total length
VOC 10% stake
Australia Singapore Cable (Proposed) 4,600km total length
VOC 50% stake; 50/50 JV
Southern Cross Cable 28,900km total length
VOC IRU agreement
740 on-net buildings
4 data centres (1,524m2)
422 on-net buildings
3 data centres (2,111m2)
215 on-net buildings
1,641 on-net buildings
9 data centres (3,327m2)
March 10, 2016 Vocus Communications Ltd. (VOC.AX)
Goldman Sachs Global Investment Research 10
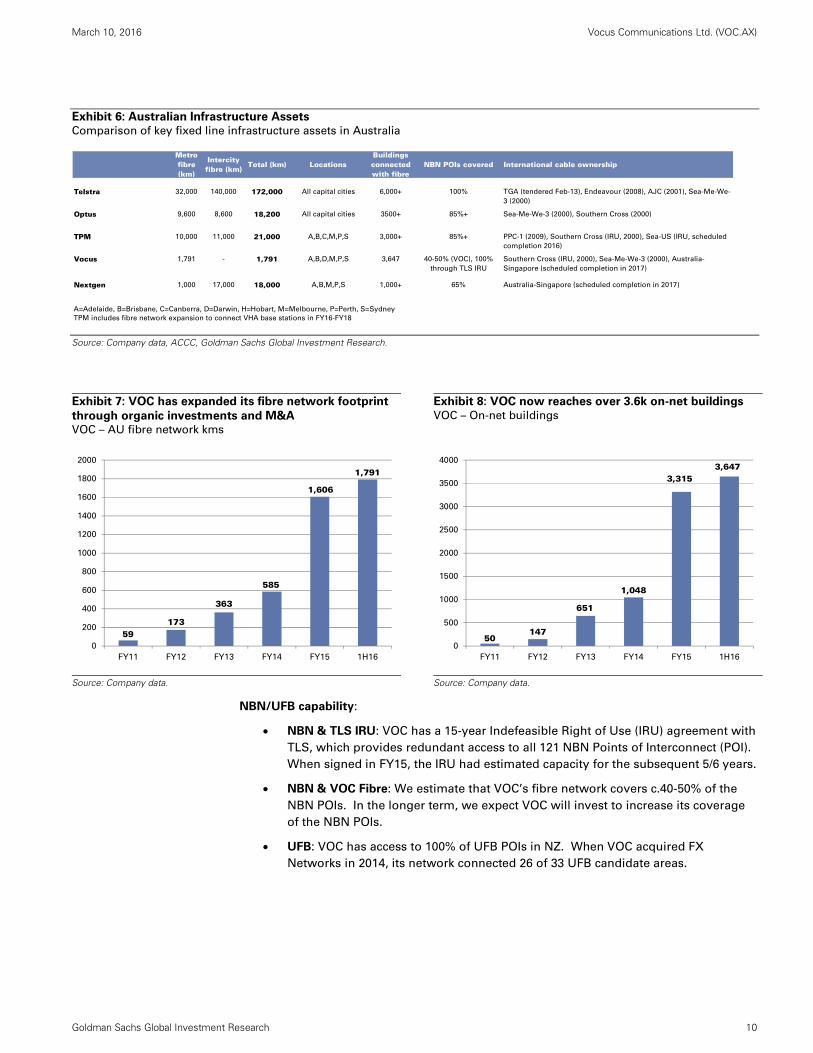
Exhibit 6: Australian Infrastructure Assets
Comparison of key fixed line infrastructure assets in Australia
Source: Company data, ACCC, Goldman Sachs Global Investment Research.
Exhibit 7: VOC has expanded its fibre network footprint
through organic investments and M&A VOC – AU fibre network kms
Exhibit 8: VOC now reaches over 3.6k on-net buildings
VOC – On-net buildings
Source: Company data.
Source: Company data.
NBN/UFB capability:
NBN & TLS IRU: VOC has a 15-year Indefeasible Right of Use (IRU) agreement with
TLS, which provides redundant access to all 121 NBN Points of Interconnect (POI).
When signed in FY15, the IRU had estimated capacity for the subsequent 5/6 years.
NBN & VOC Fibre: We estimate that VOC’s fibre network covers c.40-50% of the
NBN POIs. In the longer term, we expect VOC will invest to increase its coverage
of the NBN POIs.
UFB: VOC has access to 100% of UFB POIs in NZ. When VOC acquired FX
Networks in 2014, its network connected 26 of 33 UFB candidate areas.
Metro fibre (km)
Intercity fibre (km)
Total (km) LocationsBuildings connected with fibre
NBN POIs covered International cable ownership
Telstra 32,000 140,000 172,000 All capital cities 6,000+ 100% TGA (tendered Feb-13), Endeavour (2008), AJC (2001), Sea-Me-We-
3 (2000)
Optus 9,600 8,600 18,200 All capital cities 3500+ 85%+ Sea-Me-We-3 (2000), Southern Cross (2000)
TPM 10,000 11,000 21,000 A,B,C,M,P,S 3,000+ 85%+ PPC-1 (2009), Southern Cross (IRU, 2000), Sea-US (IRU, scheduled
completion 2016)
Vocus 1,791 - 1,791 A,B,D,M,P,S 3,647 40-50% (VOC), 100%
through TLS IRU
Southern Cross (IRU, 2000), Sea-Me-We-3 (2000), Australia-
Singapore (scheduled completion in 2017)
Nextgen 1,000 17,000 18,000 A,B,M,P,S 1,000+ 65% Australia-Singapore (scheduled completion in 2017)
A=Adelaide, B=Brisbane, C=Canberra, D=Darwin, H=Hobart, M=Melbourne, P=Perth, S=Sydney
TPM includes fibre network expansion to connect VHA base stations in FY16-FY18
59173
363
585
1,606
1,791
0
200
400
600
800
1000
1200
1400
1600
1800
2000
FY11 FY12 FY13 FY14 FY15 1H16
50147
651
1,048
3,3153,647
0
500
1000
1500
2000
2500
3000
3500
4000
FY11 FY12 FY13 FY14 FY15 1H16
March 10, 2016 Vocus Communications Ltd. (VOC.AX)
Goldman Sachs Global Investment Research 11
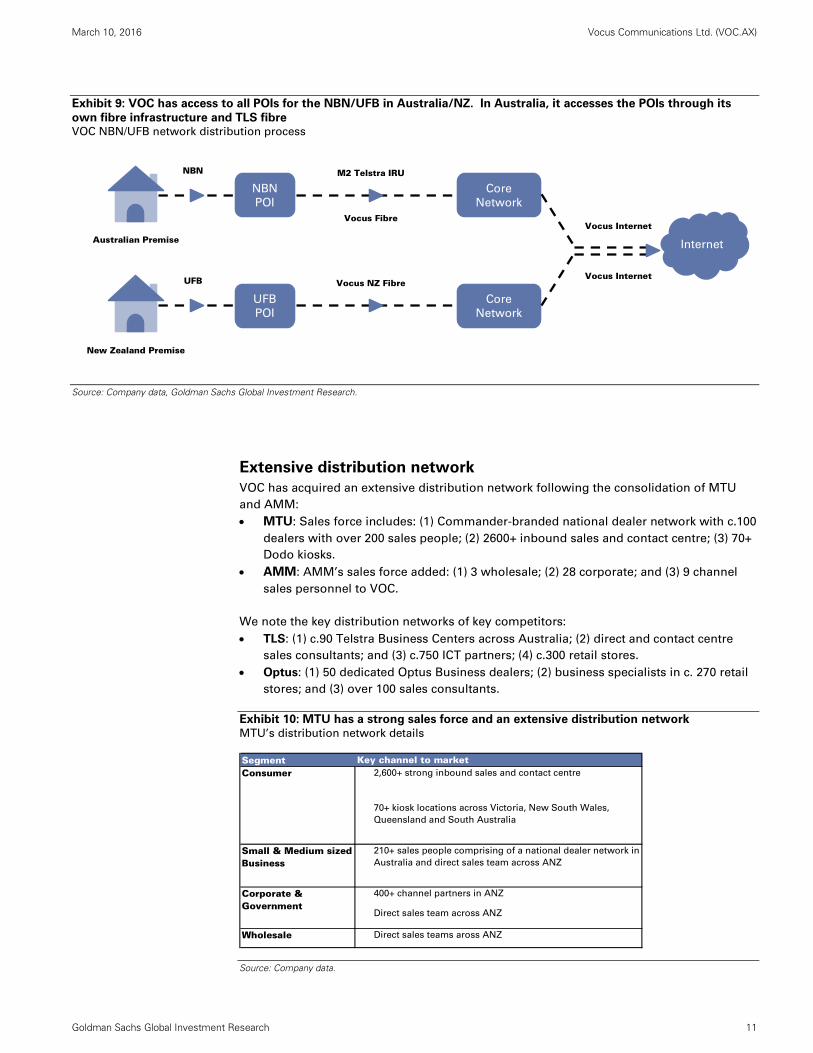
Exhibit 9: VOC has access to all POIs for the NBN/UFB in Australia/NZ. In Australia, it accesses the POIs through its
own fibre infrastructure and TLS fibre VOC NBN/UFB network distribution process
Source: Company data, Goldman Sachs Global Investment Research.
Extensive distribution network
VOC has acquired an extensive distribution network following the consolidation of MTU
and AMM:
MTU: Sales force includes: (1) Commander-branded national dealer network with c.100
dealers with over 200 sales people; (2) 2600+ inbound sales and contact centre; (3) 70+
Dodo kiosks.
AMM: AMM’s sales force added: (1) 3 wholesale; (2) 28 corporate; and (3) 9 channel
sales personnel to VOC.
We note the key distribution networks of key competitors:
TLS: (1) c.90 Telstra Business Centers across Australia; (2) direct and contact centre
sales consultants; and (3) c.750 ICT partners; (4) c.300 retail stores.
Optus: (1) 50 dedicated Optus Business dealers; (2) business specialists in c. 270 retail
stores; and (3) over 100 sales consultants.
Exhibit 10: MTU has a strong sales force and an extensive distribution network
MTU’s distribution network details
Source: Company data.
Internet
NBN
POI
UFB
POI
Core
Network
Core
Network
Australian Premise
New Zealand Premise
Vocus Internet
Vocus Internet
M2 Telstra IRU
Vocus Fibre
Vocus NZ Fibre
NBN
UFB
SegmentConsumer 2,600+ strong inbound sales and contact centre
70+ kiosk locations across Victoria, New South Wales,
Queensland and South Australia
Small & Medium sized Business
210+ sales people comprising of a national dealer network in
Australia and direct sales team across ANZ
400+ channel partners in ANZ
Direct sales team across ANZ
Wholesale Direct sales teams aross ANZ
Corporate & Government
Key channel to market
March 10, 2016 Vocus Communications Ltd. (VOC.AX)
Goldman Sachs Global Investment Research 12
Outlook and key stock drivers
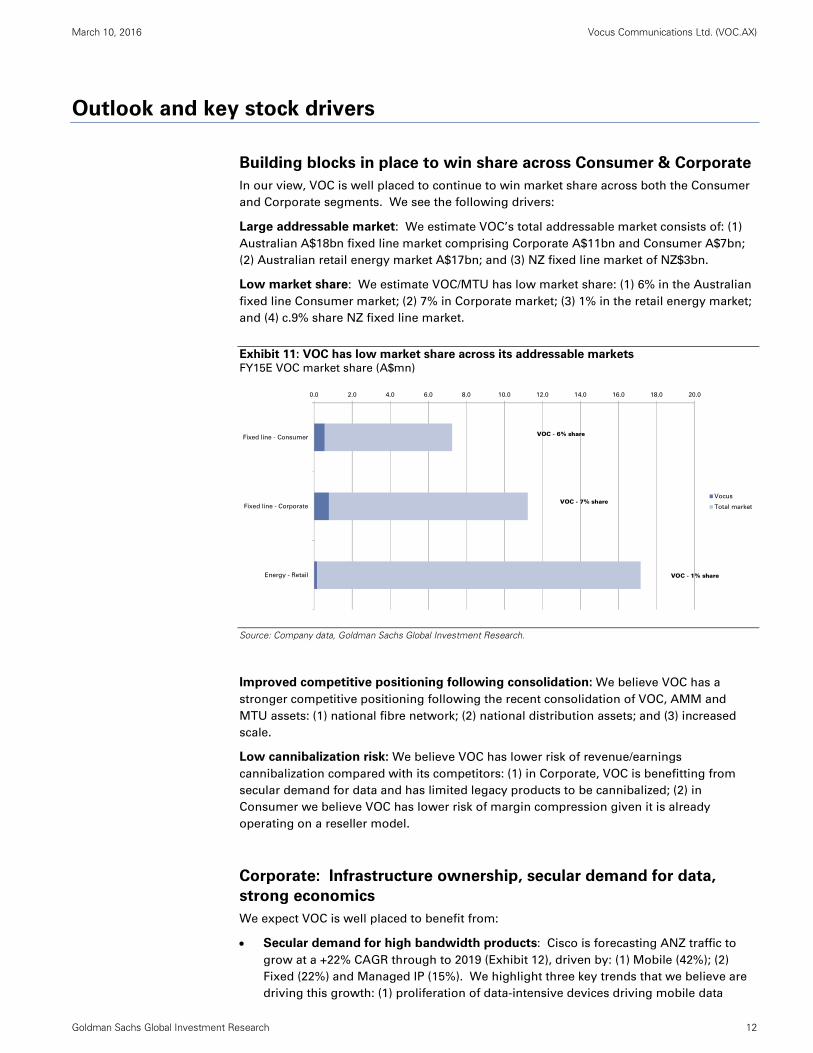
Building blocks in place to win share across Consumer & Corporate
In our view, VOC is well placed to continue to win market share across both the Consumer
and Corporate segments. We see the following drivers:
Large addressable market: We estimate VOC’s total addressable market consists of: (1)
Australian A$18bn fixed line market comprising Corporate A$11bn and Consumer A$7bn;
(2) Australian retail energy market A$17bn; and (3) NZ fixed line market of NZ$3bn.
Low market share: We estimate VOC/MTU has low market share: (1) 6% in the Australian
fixed line Consumer market; (2) 7% in Corporate market; (3) 1% in the retail energy market;
and (4) c.9% share NZ fixed line market.
Exhibit 11: VOC has low market share across its addressable markets FY15E VOC market share (A$mn)
Source: Company data, Goldman Sachs Global Investment Research.
Improved competitive positioning following consolidation: We believe VOC has a
stronger competitive positioning following the recent consolidation of VOC, AMM and
MTU assets: (1) national fibre network; (2) national distribution assets; and (3) increased
scale.
Low cannibalization risk: We believe VOC has lower risk of revenue/earnings
cannibalization compared with its competitors: (1) in Corporate, VOC is benefitting from
secular demand for data and has limited legacy products to be cannibalized; (2) in
Consumer we believe VOC has lower risk of margin compression given it is already
operating on a reseller model.
Corporate: Infrastructure ownership, secular demand for data,
strong economics
We expect VOC is well placed to benefit from:
Secular demand for high bandwidth products: Cisco is forecasting ANZ traffic to
grow at a +22% CAGR through to 2019 (Exhibit 12), driven by: (1) Mobile (42%); (2)
Fixed (22%) and Managed IP (15%). We highlight three key trends that we believe are
driving this growth: (1) proliferation of data-intensive devices driving mobile data
0.0 2.0 4.0 6.0 8.0 10.0 12.0 14.0 16.0 18.0 20.0
Fixed line - Consumer
Fixed line - Corporate
Energy - Retail
Vocus
Total market
VOC - 6% share
VOC - 7% share
VOC - 1% share
March 10, 2016 Vocus Communications Ltd. (VOC.AX)
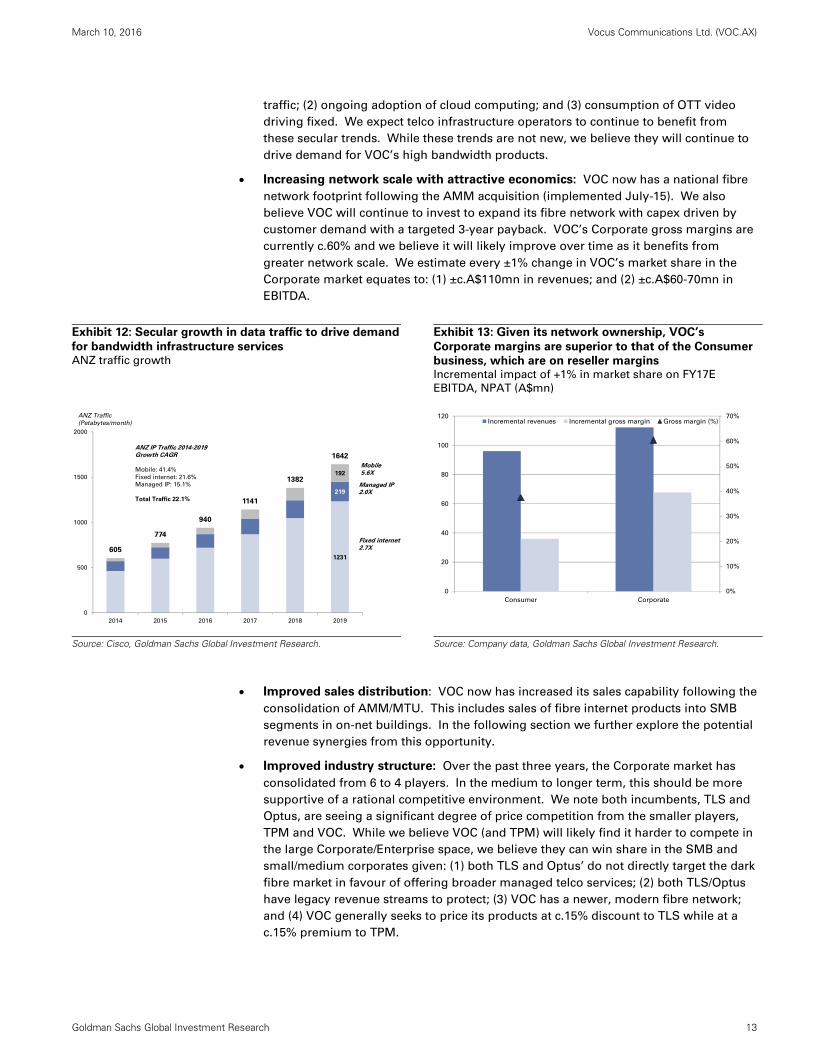
Goldman Sachs Global Investment Research 13
traffic; (2) ongoing adoption of cloud computing; and (3) consumption of OTT video
driving fixed. We expect telco infrastructure operators to continue to benefit from
these secular trends. While these trends are not new, we believe they will continue to
drive demand for VOC’s high bandwidth products.
Increasing network scale with attractive economics: VOC now has a national fibre
network footprint following the AMM acquisition (implemented July-15). We also
believe VOC will continue to invest to expand its fibre network with capex driven by
customer demand with a targeted 3-year payback. VOC’s Corporate gross margins are
currently c.60% and we believe it will likely improve over time as it benefits from
greater network scale. We estimate every ±1% change in VOC’s market share in the
Corporate market equates to: (1) ±c.A$110mn in revenues; and (2) ±c.A$60-70mn in
EBITDA.
Exhibit 12: Secular growth in data traffic to drive demand
for bandwidth infrastructure services ANZ traffic growth
Exhibit 13: Given its network ownership, VOC’s
Corporate margins are superior to that of the Consumer
business, which are on reseller margins Incremental impact of +1% in market share on FY17E
EBITDA, NPAT (A$mn)
Source: Cisco, Goldman Sachs Global Investment Research.
Source: Company data, Goldman Sachs Global Investment Research.
Improved sales distribution: VOC now has increased its sales capability following the
consolidation of AMM/MTU. This includes sales of fibre internet products into SMB
segments in on-net buildings. In the following section we further explore the potential
revenue synergies from this opportunity.
Improved industry structure: Over the past three years, the Corporate market has
consolidated from 6 to 4 players. In the medium to longer term, this should be more
supportive of a rational competitive environment. We note both incumbents, TLS and
Optus, are seeing a significant degree of price competition from the smaller players,
TPM and VOC. While we believe VOC (and TPM) will likely find it harder to compete in
the large Corporate/Enterprise space, we believe they can win share in the SMB and
small/medium corporates given: (1) both TLS and Optus’ do not directly target the dark
fibre market in favour of offering broader managed telco services; (2) both TLS/Optus
have legacy revenue streams to protect; (3) VOC has a newer, modern fibre network;
and (4) VOC generally seeks to price its products at c.15% discount to TLS while at a
c.15% premium to TPM.
1231
219
192
605
774
940
1141
1382
1642
0
500
1000
1500
2000
2014 2015 2016 2017 2018 2019
ANZ Traffic
(Petabytes/month)
Mobile5.6X
Fixed internet 2.7X
Managed IP 2.0X
ANZ IP Traffic 2014-2019 Growth CAGR
Mobile: 41.4%
Fixed internet: 21.6%
Managed IP: 15.1%
Total Traffic 22.1%
0%
10%
20%
30%
40%
50%
60%
70%
0
20
40
60
80
100
120
Consumer Corporate
Incremental revenues Incremental gross margin Gross margin (%)
March 10, 2016 Vocus Communications Ltd. (VOC.AX)
Goldman Sachs Global Investment Research 14
Exhibit 14: VOC, AMM, MTU have increased share in the
Corporate market in the past 10 years Combined VOC, AMM, MTU Corporate revenues
Exhibit 15: We expect VOC/TPM to continue to win
modest share away from TLS and Optus Australian Corporate market – Market share
Source: Company data, Goldman Sachs Global Investment Research.
Source: Company data, Goldman Sachs Global Investment Research.
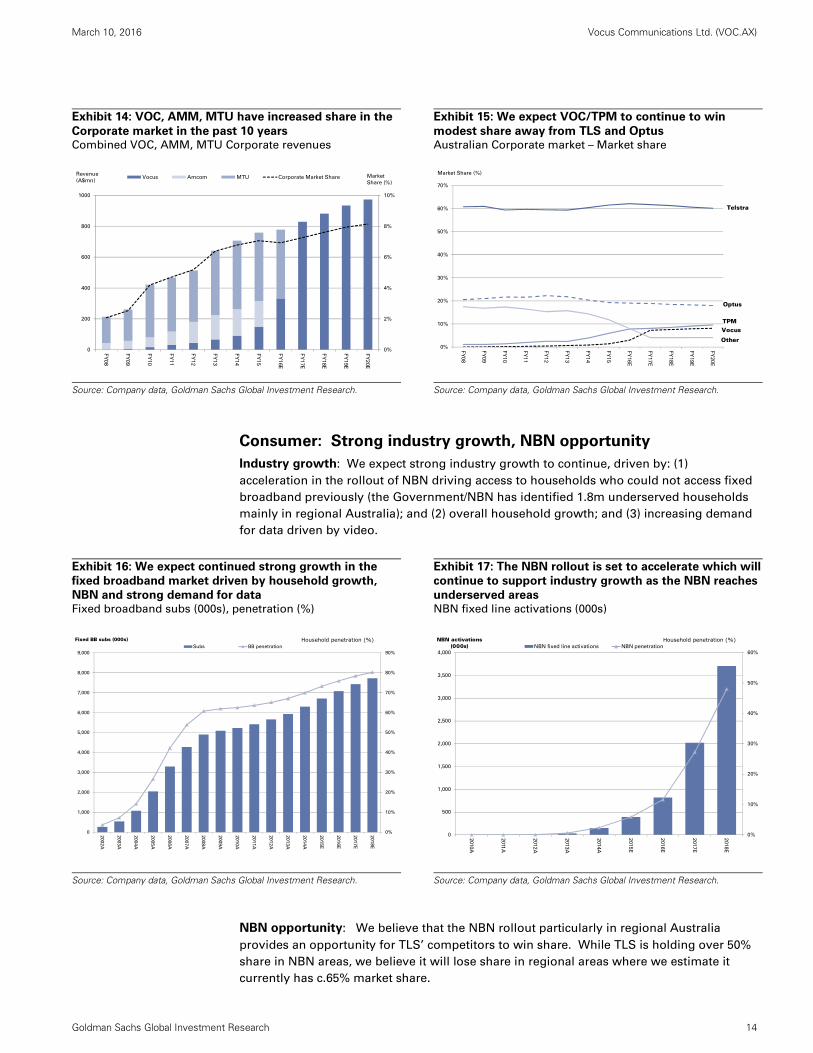
Consumer: Strong industry growth, NBN opportunity
Industry growth: We expect strong industry growth to continue, driven by: (1)
acceleration in the rollout of NBN driving access to households who could not access fixed
broadband previously (the Government/NBN has identified 1.8m underserved households
mainly in regional Australia); and (2) overall household growth; and (3) increasing demand
for data driven by video.
Exhibit 16: We expect continued strong growth in the
fixed broadband market driven by household growth,
NBN and strong demand for data Fixed broadband subs (000s), penetration (%)
Exhibit 17: The NBN rollout is set to accelerate which will
continue to support industry growth as the NBN reaches
underserved areas NBN fixed line activations (000s)
Source: Company data, Goldman Sachs Global Investment Research.
Source: Company data, Goldman Sachs Global Investment Research.
NBN opportunity: We believe that the NBN rollout particularly in regional Australia
provides an opportunity for TLS’ competitors to win share. While TLS is holding over 50%
share in NBN areas, we believe it will lose share in regional areas where we estimate it
currently has c.65% market share.
0%
2%
4%
6%
8%
10%
0
200
400
600
800
1000
FY
08
FY
09
FY
10
FY
11
FY
12
FY
13
FY
14
FY
15
FY
16E
FY
17E
FY
18E
FY
19E
FY
20E
Vocus Amcom MTU Corporate Market ShareRevenue
(A$mn)Market
Share (%)
0%
10%
20%
30%
40%
50%
60%
70%
FY
08
FY
09
FY
10
FY
11
FY
12
FY
13
FY
14
FY
15
FY
16
E
FY
17
E
FY
18
E
FY
19
E
FY
20
E
Market Share (%)
Telstra
Optus
Other
VocusTPM
0%
10%
20%
30%
40%
50%
60%
70%
80%
90%
0
1,000
2,000
3,000
4,000
5,000
6,000
7,000
8,000
9,000
200
2A
200
3A
200
4A
200
5A
200
6A
200
7A
200
8A
200
9A
201
0A
201
1A
201
2A
201
3A
201
4A
201
5E
201
6E
201
7E
201
8E
Fixed BB subs (000s)Subs BB penetration
Household penetration (%)
0%
10%
20%
30%
40%
50%
60%
0
500
1,000
1,500
2,000
2,500
3,000
3,500
4,000
2010A
2011
A
2012
A
2013
A
2014A
2015
E
2016
E
2017
E
2018
E
NBN activations (000s) NBN fixed line activations NBN penetration
Household penetration (%)
March 10, 2016 Vocus Communications Ltd. (VOC.AX)
Goldman Sachs Global Investment Research 15
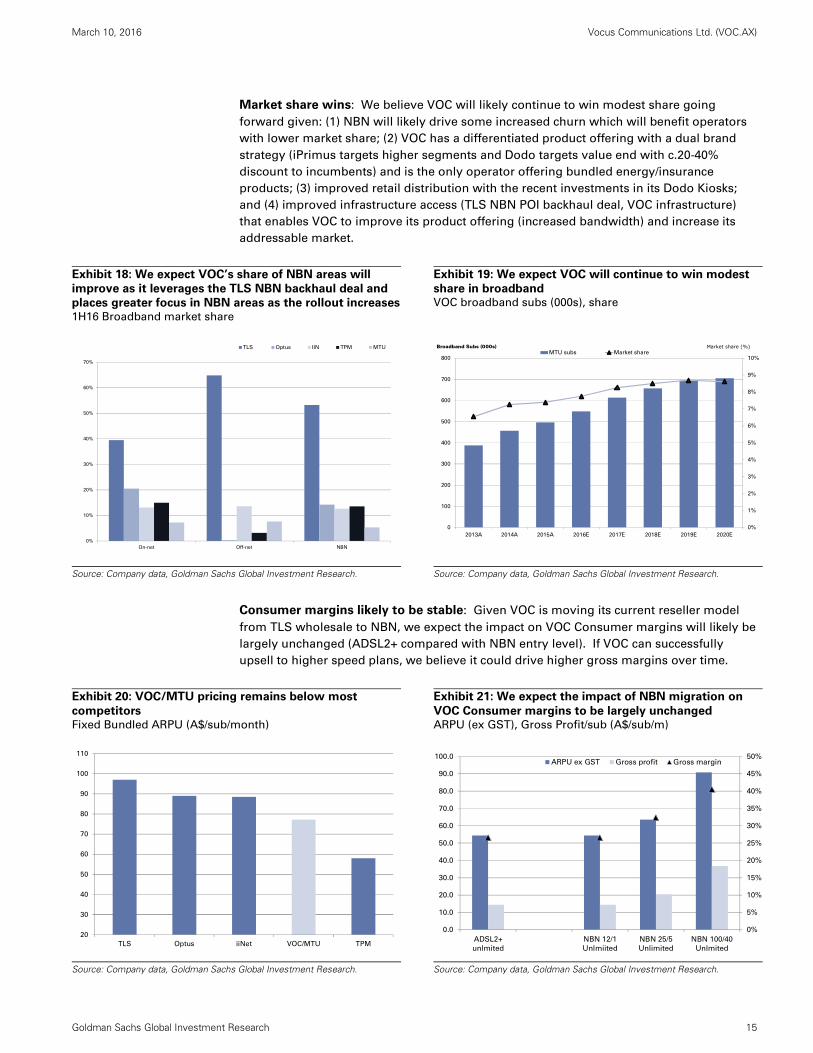
Market share wins: We believe VOC will likely continue to win modest share going
forward given: (1) NBN will likely drive some increased churn which will benefit operators
with lower market share; (2) VOC has a differentiated product offering with a dual brand
strategy (iPrimus targets higher segments and Dodo targets value end with c.20-40%
discount to incumbents) and is the only operator offering bundled energy/insurance
products; (3) improved retail distribution with the recent investments in its Dodo Kiosks;
and (4) improved infrastructure access (TLS NBN POI backhaul deal, VOC infrastructure)
that enables VOC to improve its product offering (increased bandwidth) and increase its
addressable market.
Exhibit 18: We expect VOC’s share of NBN areas will
improve as it leverages the TLS NBN backhaul deal and
places greater focus in NBN areas as the rollout increases 1H16 Broadband market share
Exhibit 19: We expect VOC will continue to win modest
share in broadband VOC broadband subs (000s), share
Source: Company data, Goldman Sachs Global Investment Research.
Source: Company data, Goldman Sachs Global Investment Research.
Consumer margins likely to be stable: Given VOC is moving its current reseller model
from TLS wholesale to NBN, we expect the impact on VOC Consumer margins will likely be
largely unchanged (ADSL2+ compared with NBN entry level). If VOC can successfully
upsell to higher speed plans, we believe it could drive higher gross margins over time.
Exhibit 20: VOC/MTU pricing remains below most
competitors Fixed Bundled ARPU (A$/sub/month)
Exhibit 21: We expect the impact of NBN migration on
VOC Consumer margins to be largely unchanged ARPU (ex GST), Gross Profit/sub (A$/sub/m)
Source: Company data, Goldman Sachs Global Investment Research.
Source: Company data, Goldman Sachs Global Investment Research.
0%
10%
20%
30%
40%
50%
60%
70%
On-net Off-net NBN
TLS Optus IIN TPM MTU
0%
1%
2%
3%
4%
5%
6%
7%
8%
9%
10%
0
100
200
300
400
500
600
700
800
2013A 2014A 2015A 2016E 2017E 2018E 2019E 2020E
Broadband Subs (000s)MTU subs Market share
Market share (%)
20
30
40
50
60
70
80
90
100
110
TLS Optus iiNet VOC/MTU TPM
0%
5%
10%
15%
20%
25%
30%
35%
40%
45%
50%
0.0
10.0
20.0
30.0
40.0
50.0
60.0
70.0
80.0
90.0
100.0
ADSL2+
unlmited
NBN 12/1
Unlmiited
NBN 25/5
Unlimited
NBN 100/40
Unlmited
ARPU ex GST Gross profit Gross margin
March 10, 2016 Vocus Communications Ltd. (VOC.AX)
Goldman Sachs Global Investment Research 16
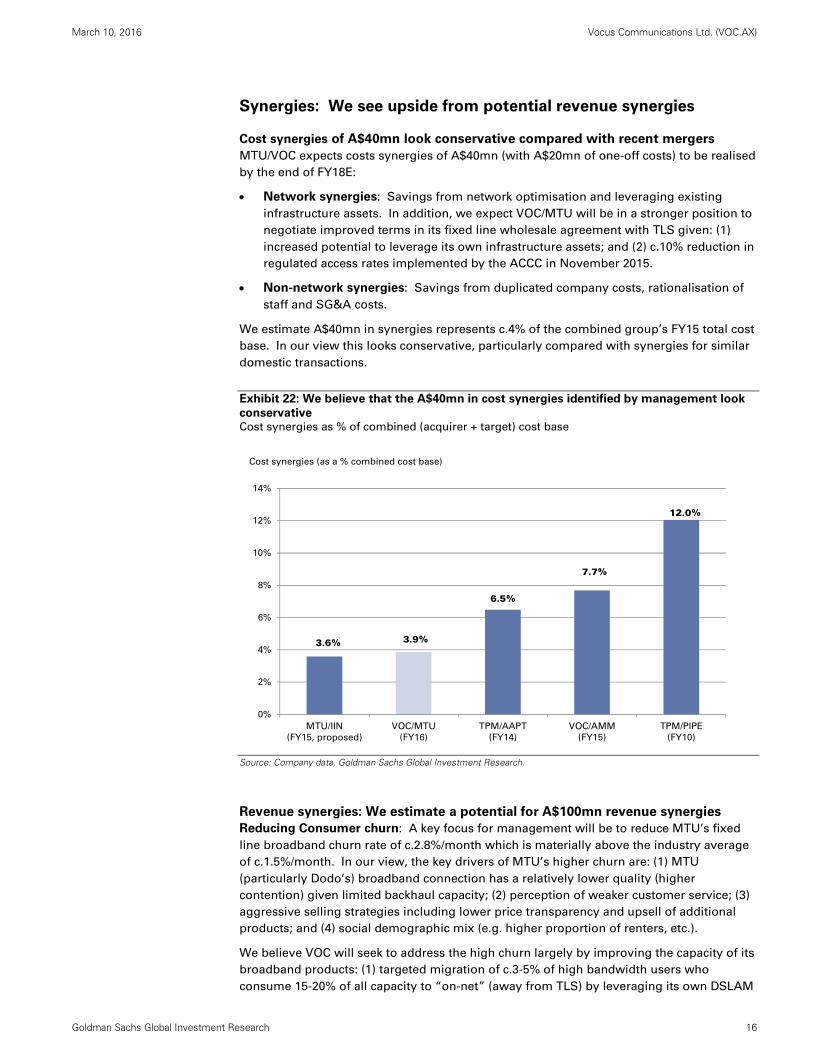
Synergies: We see upside from potential revenue synergies
Cost synergies of A$40mn look conservative compared with recent mergers
MTU/VOC expects costs synergies of A$40mn (with A$20mn of one-off costs) to be realised
by the end of FY18E:
Network synergies: Savings from network optimisation and leveraging existing
infrastructure assets. In addition, we expect VOC/MTU will be in a stronger position to
negotiate improved terms in its fixed line wholesale agreement with TLS given: (1)
increased potential to leverage its own infrastructure assets; and (2) c.10% reduction in
regulated access rates implemented by the ACCC in November 2015.
Non-network synergies: Savings from duplicated company costs, rationalisation of
staff and SG&A costs.
We estimate A$40mn in synergies represents c.4% of the combined group’s FY15 total cost
base. In our view this looks conservative, particularly compared with synergies for similar
domestic transactions.
Exhibit 22: We believe that the A$40mn in cost synergies identified by management look
conservative Cost synergies as % of combined (acquirer + target) cost base
Source: Company data, Goldman Sachs Global Investment Research.
Revenue synergies: We estimate a potential for A$100mn revenue synergies
Reducing Consumer churn: A key focus for management will be to reduce MTU’s fixed
line broadband churn rate of c.2.8%/month which is materially above the industry average
of c.1.5%/month. In our view, the key drivers of MTU’s higher churn are: (1) MTU
(particularly Dodo’s) broadband connection has a relatively lower quality (higher
contention) given limited backhaul capacity; (2) perception of weaker customer service; (3)
aggressive selling strategies including lower price transparency and upsell of additional
products; and (4) social demographic mix (e.g. higher proportion of renters, etc.).
We believe VOC will seek to address the high churn largely by improving the capacity of its
broadband products: (1) targeted migration of c.3-5% of high bandwidth users who
consume 15-20% of all capacity to “on-net” (away from TLS) by leveraging its own DSLAM
3.6% 3.9%
6.5%
7.7%
12.0%
0%
2%
4%
6%
8%
10%
12%
14%
MTU/IIN
(FY15, proposed)
VOC/MTU
(FY16)
TPM/AAPT
(FY14)
VOC/AMM
(FY15)
TPM/PIPE
(FY10)
Cost synergies (as a % combined cost base)
March 10, 2016 Vocus Communications Ltd. (VOC.AX)
Goldman Sachs Global Investment Research 17
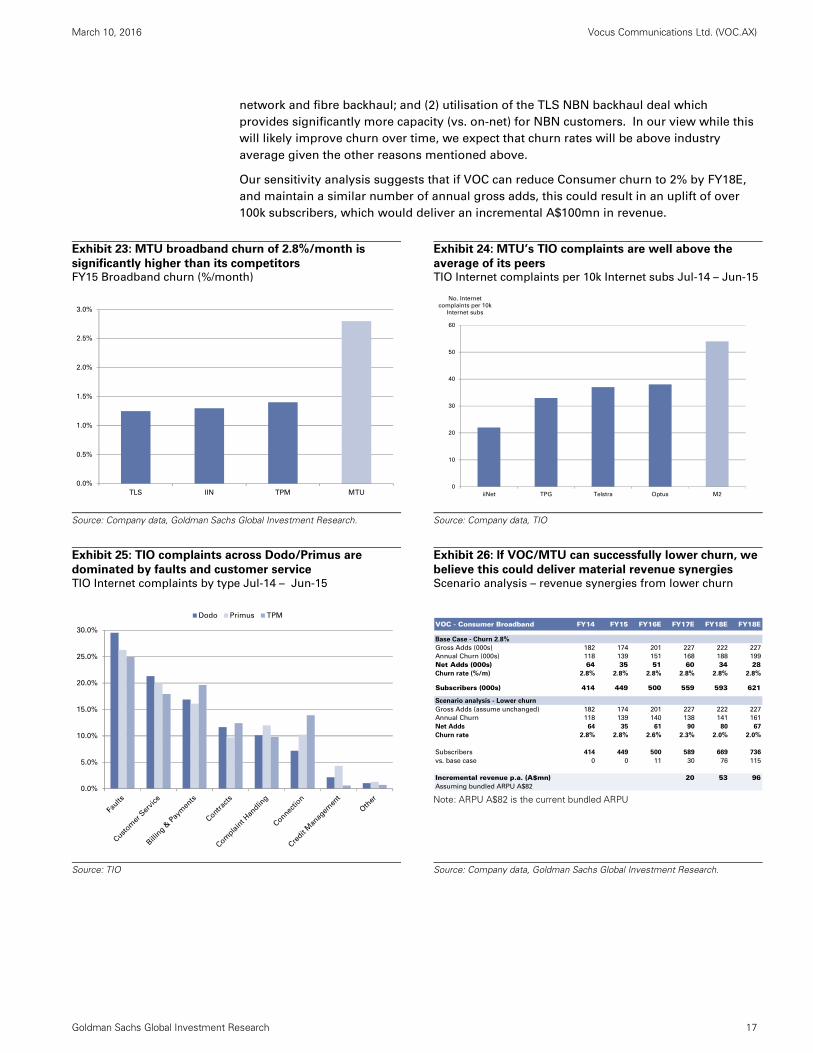
network and fibre backhaul; and (2) utilisation of the TLS NBN backhaul deal which
provides significantly more capacity (vs. on-net) for NBN customers. In our view while this
will likely improve churn over time, we expect that churn rates will be above industry
average given the other reasons mentioned above.
Our sensitivity analysis suggests that if VOC can reduce Consumer churn to 2% by FY18E,
and maintain a similar number of annual gross adds, this could result in an uplift of over
100k subscribers, which would deliver an incremental A$100mn in revenue.
Exhibit 23: MTU broadband churn of 2.8%/month is
significantly higher than its competitors FY15 Broadband churn (%/month)
Exhibit 24: MTU’s TIO complaints are well above the
average of its peers TIO Internet complaints per 10k Internet subs Jul-14 – Jun-15
Source: Company data, Goldman Sachs Global Investment Research.
Source: Company data, TIO
Exhibit 25: TIO complaints across Dodo/Primus are
dominated by faults and customer service TIO Internet complaints by type Jul-14 – Jun-15
Exhibit 26: If VOC/MTU can successfully lower churn, we
believe this could deliver material revenue synergies Scenario analysis – revenue synergies from lower churn
Note: ARPU A$82 is the current bundled ARPU
Source: TIO
Source: Company data, Goldman Sachs Global Investment Research.
0.0%
0.5%
1.0%
1.5%
2.0%
2.5%
3.0%
TLS IIN TPM MTU0
10
20
30
40
50
60
iiNet TPG Telstra Optus M2
No. Internet
complaints per 10k
Internet subs
0.0%
5.0%
10.0%
15.0%
20.0%
25.0%
30.0%
Dodo Primus TPM
VOC - Consumer Broadband FY14 FY15 FY16E FY17E FY18E FY18E
Base Case - Churn 2.8%
Gross Adds (000s) 182 174 201 227 222 227
Annual Churn (000s) 118 139 151 168 188 199
Net Adds (000s) 64 35 51 60 34 28Churn rate (%/m) 2.8% 2.8% 2.8% 2.8% 2.8% 2.8%
Subscribers (000s) 414 449 500 559 593 621
Scenario analysis - Lower churn
Gross Adds (assume unchanged) 182 174 201 227 222 227
Annual Churn 118 139 140 138 141 161
Net Adds 64 35 61 90 80 67
Churn rate 2.8% 2.8% 2.6% 2.3% 2.0% 2.0%
Subscribers 414 449 500 589 669 736
vs. base case 0 0 11 30 76 115
Incremental revenue p.a. (A$mn) 20 53 96Assuming bundled ARPU A$82
March 10, 2016 Vocus Communications Ltd. (VOC.AX)
Goldman Sachs Global Investment Research 18
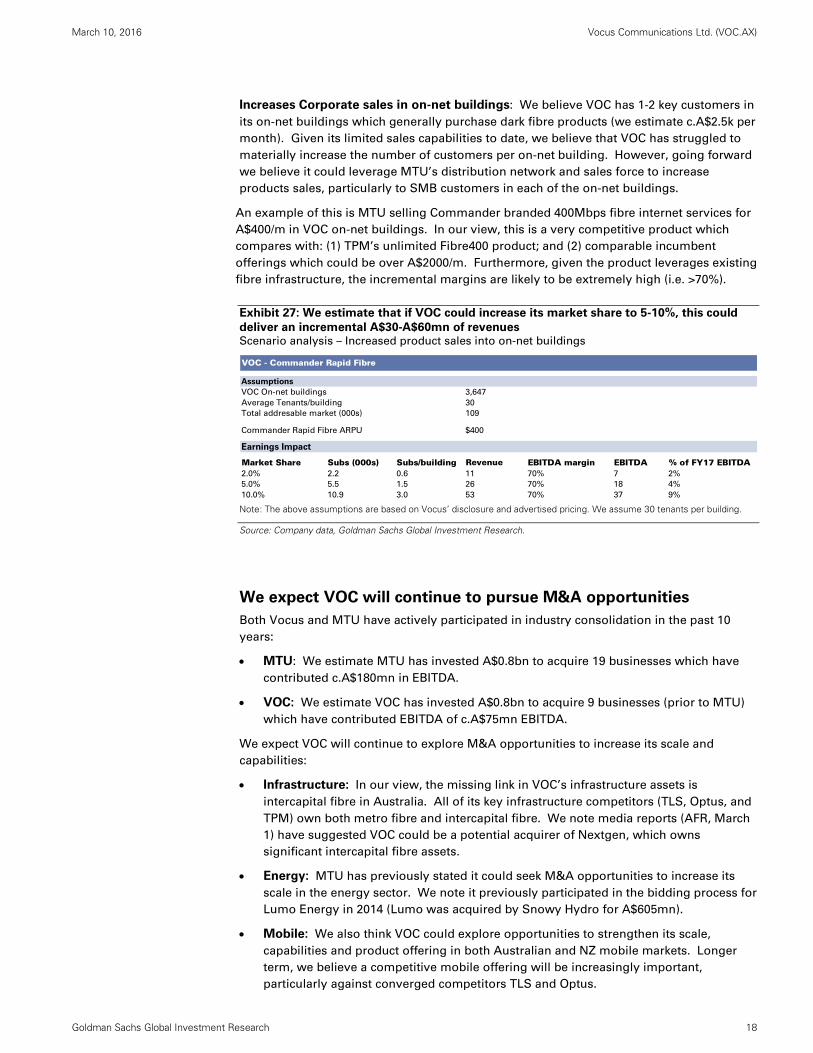
Increases Corporate sales in on-net buildings: We believe VOC has 1-2 key customers in
its on-net buildings which generally purchase dark fibre products (we estimate c.A$2.5k per
month). Given its limited sales capabilities to date, we believe that VOC has struggled to
materially increase the number of customers per on-net building. However, going forward
we believe it could leverage MTU’s distribution network and sales force to increase
products sales, particularly to SMB customers in each of the on-net buildings.
An example of this is MTU selling Commander branded 400Mbps fibre internet services for
A$400/m in VOC on-net buildings. In our view, this is a very competitive product which
compares with: (1) TPM’s unlimited Fibre400 product; and (2) comparable incumbent
offerings which could be over A$2000/m. Furthermore, given the product leverages existing
fibre infrastructure, the incremental margins are likely to be extremely high (i.e. >70%).
Exhibit 27: We estimate that if VOC could increase its market share to 5-10%, this could
deliver an incremental A$30-A$60mn of revenues Scenario analysis – Increased product sales into on-net buildings
Note: The above assumptions are based on Vocus’ disclosure and advertised pricing. We assume 30 tenants per building.
Source: Company data, Goldman Sachs Global Investment Research.
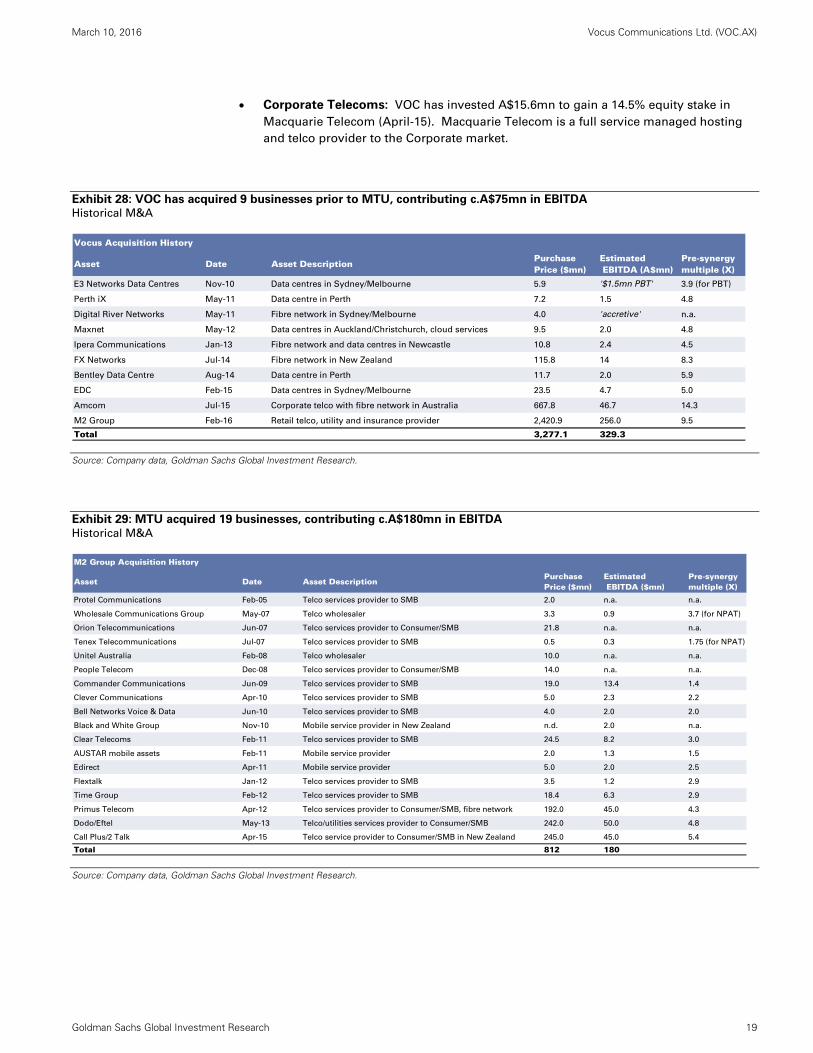
We expect VOC will continue to pursue M&A opportunities
Both Vocus and MTU have actively participated in industry consolidation in the past 10
years:
MTU: We estimate MTU has invested A$0.8bn to acquire 19 businesses which have
contributed c.A$180mn in EBITDA.
VOC: We estimate VOC has invested A$0.8bn to acquire 9 businesses (prior to MTU)
which have contributed EBITDA of c.A$75mn EBITDA.
We expect VOC will continue to explore M&A opportunities to increase its scale and
capabilities:
Infrastructure: In our view, the missing link in VOC’s infrastructure assets is
intercapital fibre in Australia. All of its key infrastructure competitors (TLS, Optus, and
TPM) own both metro fibre and intercapital fibre. We note media reports (AFR, March
1) have suggested VOC could be a potential acquirer of Nextgen, which owns
significant intercapital fibre assets.
Energy: MTU has previously stated it could seek M&A opportunities to increase its
scale in the energy sector. We note it previously participated in the bidding process for
Lumo Energy in 2014 (Lumo was acquired by Snowy Hydro for A$605mn).
Mobile: We also think VOC could explore opportunities to strengthen its scale,
capabilities and product offering in both Australian and NZ mobile markets. Longer
term, we believe a competitive mobile offering will be increasingly important,
particularly against converged competitors TLS and Optus.
VOC - Commander Rapid Fibre
Assumptions
VOC On-net buildings 3,647
Average Tenants/building 30
Total addresable market (000s) 109
Commander Rapid Fibre ARPU $400
Earnings Impact
Market Share Subs (000s) Subs/building Revenue EBITDA margin EBITDA % of FY17 EBITDA2.0% 2.2 0.6 11 70% 7 2%
5.0% 5.5 1.5 26 70% 18 4%
10.0% 10.9 3.0 53 70% 37 9%
March 10, 2016 Vocus Communications Ltd. (VOC.AX)
Goldman Sachs Global Investment Research 19
Corporate Telecoms: VOC has invested A$15.6mn to gain a 14.5% equity stake in
Macquarie Telecom (April-15). Macquarie Telecom is a full service managed hosting
and telco provider to the Corporate market.
Exhibit 28: VOC has acquired 9 businesses prior to MTU, contributing c.A$75mn in EBITDA Historical M&A
Source: Company data, Goldman Sachs Global Investment Research.
Exhibit 29: MTU acquired 19 businesses, contributing c.A$180mn in EBITDA
Historical M&A
Source: Company data, Goldman Sachs Global Investment Research.
Vocus Acquisition History
Asset Date Asset DescriptionPurchasePrice ($mn)
Estimated EBITDA (A$mn)
Pre-synergymultiple (X)
E3 Networks Data Centres Nov-10 Data centres in Sydney/Melbourne 5.9 '$1.5mn PBT' 3.9 (for PBT)
Perth iX May-11 Data centre in Perth 7.2 1.5 4.8
Digital River Networks May-11 Fibre network in Sydney/Melbourne 4.0 'accretive' n.a.
Maxnet May-12 Data centres in Auckland/Christchurch, cloud services 9.5 2.0 4.8
Ipera Communications Jan-13 Fibre network and data centres in Newcastle 10.8 2.4 4.5
FX Networks Jul-14 Fibre network in New Zealand 115.8 14 8.3
Bentley Data Centre Aug-14 Data centre in Perth 11.7 2.0 5.9
EDC Feb-15 Data centres in Sydney/Melbourne 23.5 4.7 5.0
Amcom Jul-15 Corporate telco with fibre network in Australia 667.8 46.7 14.3
M2 Group Feb-16 Retail telco, utility and insurance provider 2,420.9 256.0 9.5
Total 3,277.1 329.3
M2 Group Acquisition History
Asset Date Asset DescriptionPurchasePrice ($mn)
Estimated EBITDA ($mn)
Pre-synergymultiple (X)
Protel Communications Feb-05 Telco services provider to SMB 2.0 n.a. n.a.
Wholesale Communications Group May-07 Telco wholesaler 3.3 0.9 3.7 (for NPAT)
Orion Telecommunications Jun-07 Telco services provider to Consumer/SMB 21.8 n.a. n.a.
Tenex Telecommunications Jul-07 Telco services provider to SMB 0.5 0.3 1.75 (for NPAT)
Unitel Australia Feb-08 Telco wholesaler 10.0 n.a. n.a.
People Telecom Dec-08 Telco services provider to Consumer/SMB 14.0 n.a. n.a.
Commander Communications Jun-09 Telco services provider to SMB 19.0 13.4 1.4
Clever Communications Apr-10 Telco services provider to SMB 5.0 2.3 2.2
Bell Networks Voice & Data Jun-10 Telco services provider to SMB 4.0 2.0 2.0
Black and White Group Nov-10 Mobile service provider in New Zealand n.d. 2.0 n.a.
Clear Telecoms Feb-11 Telco services provider to SMB 24.5 8.2 3.0
AUSTAR mobile assets Feb-11 Mobile service provider 2.0 1.3 1.5
Edirect Apr-11 Mobile service provider 5.0 2.0 2.5
Flextalk Jan-12 Telco services provider to SMB 3.5 1.2 2.9
Time Group Feb-12 Telco services provider to SMB 18.4 6.3 2.9
Primus Telecom Apr-12 Telco services provider to Consumer/SMB, fibre network 192.0 45.0 4.3
Dodo/Eftel May-13 Telco/utilities services provider to Consumer/SMB 242.0 50.0 4.8
Call Plus/2 Talk Apr-15 Telco service provider to Consumer/SMB in New Zealand 245.0 45.0 5.4
Total 812 180
March 10, 2016 Vocus Communications Ltd. (VOC.AX)
Goldman Sachs Global Investment Research 20
Industry overview
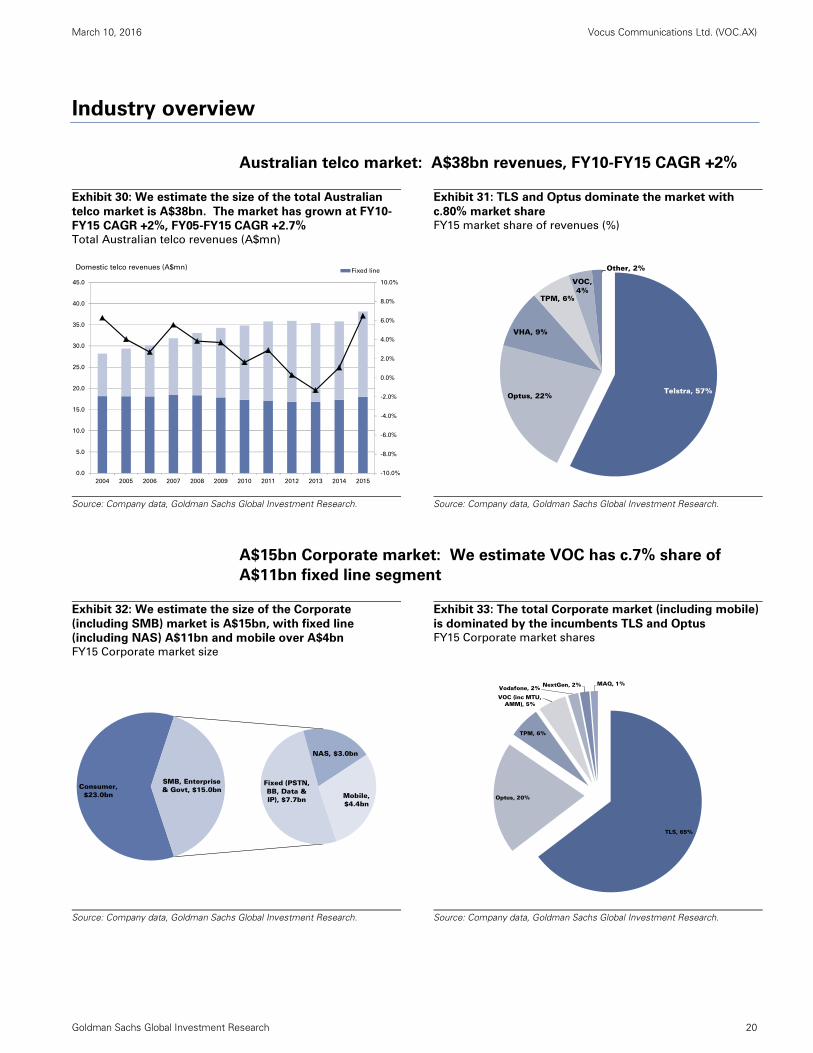
Australian telco market: A$38bn revenues, FY10-FY15 CAGR +2%
Exhibit 30: We estimate the size of the total Australian
telco market is A$38bn. The market has grown at FY10-
FY15 CAGR +2%, FY05-FY15 CAGR +2.7% Total Australian telco revenues (A$mn)
Exhibit 31: TLS and Optus dominate the market with
c.80% market share FY15 market share of revenues (%)
Source: Company data, Goldman Sachs Global Investment Research.
Source: Company data, Goldman Sachs Global Investment Research.
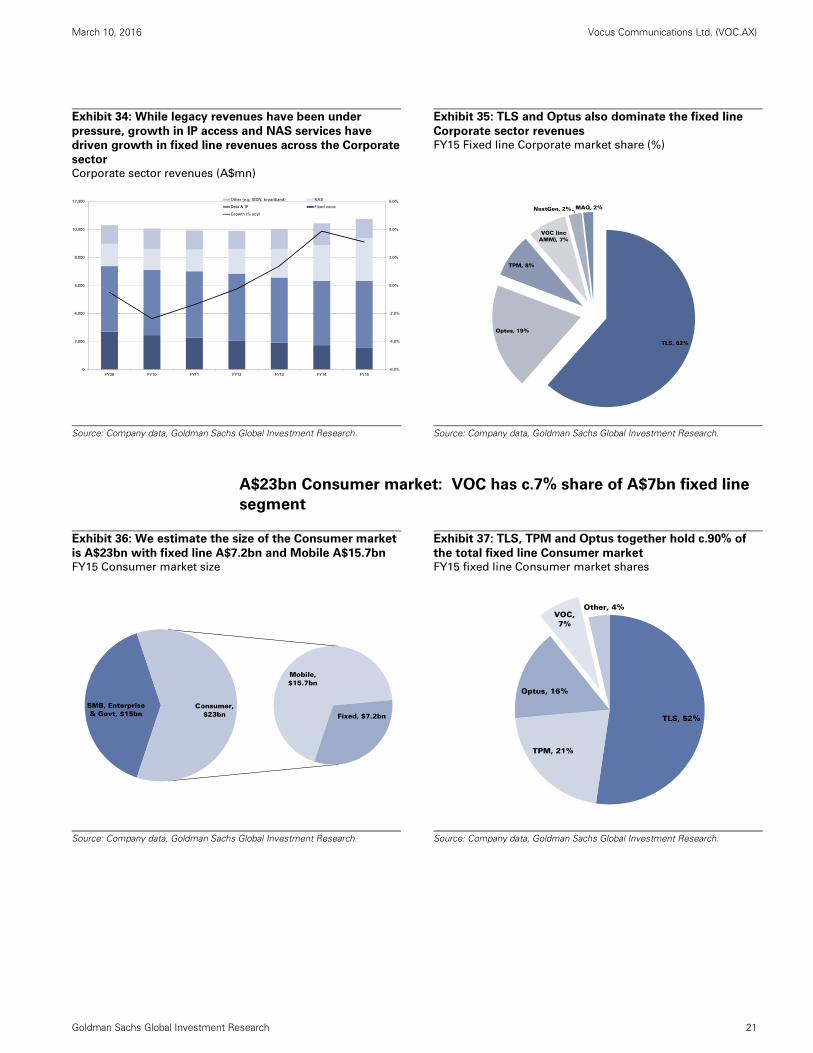
A$15bn Corporate market: We estimate VOC has c.7% share of
A$11bn fixed line segment
Exhibit 32: We estimate the size of the Corporate
(including SMB) market is A$15bn, with fixed line
(including NAS) A$11bn and mobile over A$4bn FY15 Corporate market size
Exhibit 33: The total Corporate market (including mobile)
is dominated by the incumbents TLS and Optus FY15 Corporate market shares
Source: Company data, Goldman Sachs Global Investment Research.
Source: Company data, Goldman Sachs Global Investment Research.
-10.0%
-8.0%
-6.0%
-4.0%
-2.0%
0.0%
2.0%
4.0%
6.0%
8.0%
10.0%
0.0
5.0
10.0
15.0
20.0
25.0
30.0
35.0
40.0
45.0
2004 2005 2006 2007 2008 2009 2010 2011 2012 2013 2014 2015
Fixed lineDomestic telco revenues (A$mn)
Telstra, 57%Optus, 22%
VHA, 9%
TPM, 6%
VOC, 4%
Other, 2%
Consumer, $23.0bn
Fixed (PSTN, BB, Data & IP), $7.7bn
NAS, $3.0bn
Mobile, $4.4bn
SMB, Enterprise & Govt, $15.0bn
TLS, 65%
Optus, 20%
TPM, 6%
VOC (inc MTU, AMM), 5%
Vodafone, 2% NextGen, 2% MAQ, 1%
March 10, 2016 Vocus Communications Ltd. (VOC.AX)
Goldman Sachs Global Investment Research 21
Exhibit 34: While legacy revenues have been under
pressure, growth in IP access and NAS services have
driven growth in fixed line revenues across the Corporate
sector Corporate sector revenues (A$mn)
Exhibit 35: TLS and Optus also dominate the fixed line
Corporate sector revenues FY15 Fixed line Corporate market share (%)
Source: Company data, Goldman Sachs Global Investment Research.
Source: Company data, Goldman Sachs Global Investment Research.
A$23bn Consumer market: VOC has c.7% share of A$7bn fixed line
segment
Exhibit 36: We estimate the size of the Consumer market
is A$23bn with fixed line A$7.2bn and Mobile A$15.7bn FY15 Consumer market size
Exhibit 37: TLS, TPM and Optus together hold c.90% of
the total fixed line Consumer market FY15 fixed line Consumer market shares
Source: Company data, Goldman Sachs Global Investment Research.
Source: Company data, Goldman Sachs Global Investment Research.
-6.0%
-4.0%
-2.0%
0.0%
2.0%
4.0%
6.0%
0
2,000
4,000
6,000
8,000
10,000
12,000
FY09 FY10 FY11 FY12 FY13 FY14 FY15
Other (e.g. ISDN, broadband) NAS
Data & IP Fixed voice
Growth (% yoy)
TLS, 62%
Optus, 19%
TPM, 8%
VOC (inc AMM), 7%
NextGen, 2% MAQ, 2%
SMB, Enterprise & Govt, $15bn
Mobile, $15.7bn
Fixed, $7.2bnConsumer,
$23bn TLS, 52%
TPM, 21%
Optus, 16%
VOC, 7%
Other, 4%
March 10, 2016 Vocus Communications Ltd. (VOC.AX)
Goldman Sachs Global Investment Research 22
Exhibit 38: Fixed broadband industry growth continues
to be strong, driven by the NBN, household growth and
demand for fixed line data drives Fixed line broadband industry net adds (000s), penetration
(%)
Exhibit 39: TLS has c.47% market share, TPM (and IIN)
27%, Optus 15%, VOC 7.5%. In recent periods, TLS and
TPM have captured the majority of growth Fixed line broadband net adds (000s)
Source: Company data, Goldman Sachs Global Investment Research.
Source: Company data, Goldman Sachs Global Investment Research.
Energy: A$17bn retail market, strategically important for MTU
Exhibit 40: The majority of VOC energy business is in the
deregulated Victorian market. However NSW looms as a
significant opportunity given the market size and stage
of deregulation FY15 Australian consumer energy markets
Exhibit 41: Victoria and South Australia are the only
states offering full retail contestability and deregulated
prices Retail energy market reform in Australia
Note: Green denotes deregulation while red the converse.
Source: Goldman Sachs Global Investment Research, Australian Energy Market Commission, Australian Energy Regulator
Source: Australian Energy Regulator
0%
10%
20%
30%
40%
50%
60%
70%
80%
90%
0
200
400
600
800
1,000
1,200
1,400
20
02A
20
03A
20
04A
20
05A
20
06A
20
07A
20
08A
20
09A
2010
A
2011
A
2012
A
2013
A
2014A
2015
A
201
6E
201
7E
201
8E
Net adds (000s)Industry net adds BB penetration
Household penetration (%)
-14
16
38
36
75
19
24
31
41
109
-1
25
27
38
87
37
14
12
47
101
4
7
24
54
121
-40 -20 0 20 40 60 80 100 120 140
Optus
IIN
MTU
TPM
TLS
1H16
2H15
1H15
2H14
1H14
1H16E for TPM, IIN
No gas market until 2007 Gas
Electricity
Gas
Electricity
Gas
Gas
Electricity
Gas
Electricity
Gas
Electricity
Electricity
Gas
Electricity
2001 2003 2005 2007 2009 2011 2013 2015
Tasmania
South Australia
ACT
New South Wales
Victoria
Regional Queensland
South East Queensland
Market not fully contestable, regulated prices Full retail contestability, regulated prices Full retail contestability, deregulated prices
March 10, 2016 Vocus Communications Ltd. (VOC.AX)
Goldman Sachs Global Investment Research 23
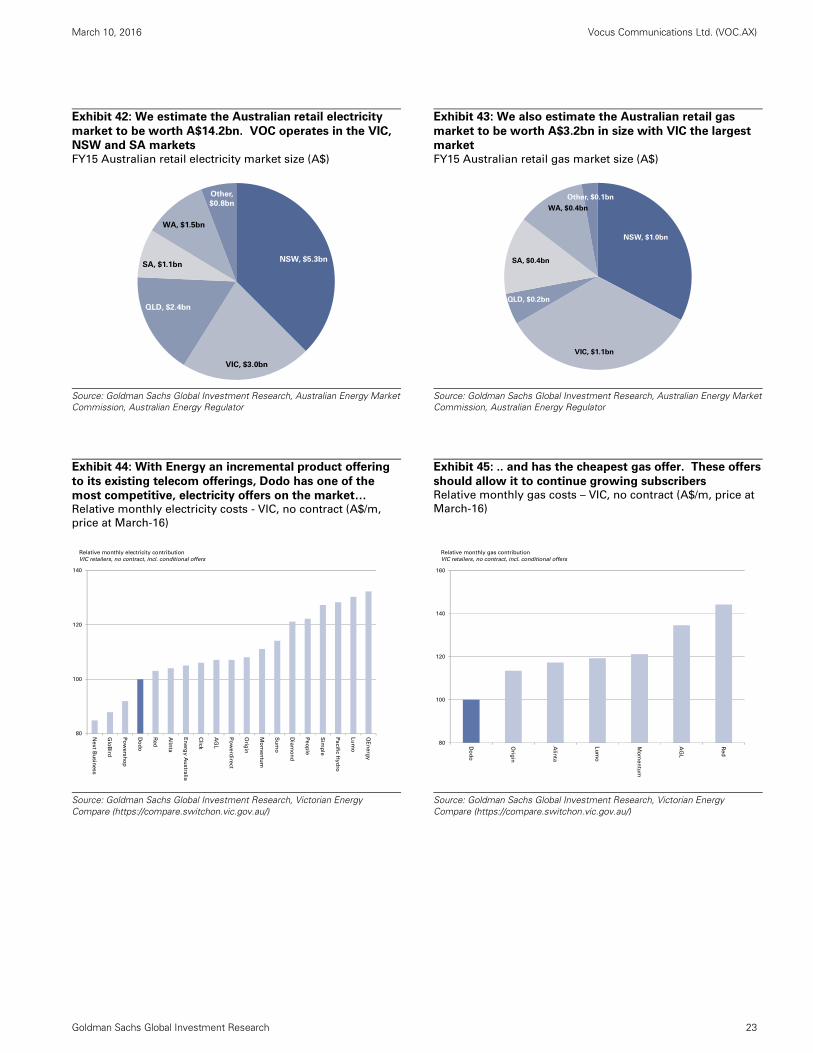
Exhibit 42: We estimate the Australian retail electricity
market to be worth A$14.2bn. VOC operates in the VIC,
NSW and SA markets FY15 Australian retail electricity market size (A$)
Exhibit 43: We also estimate the Australian retail gas
market to be worth A$3.2bn in size with VIC the largest
market FY15 Australian retail gas market size (A$)
Source: Goldman Sachs Global Investment Research, Australian Energy Market Commission, Australian Energy Regulator
Source: Goldman Sachs Global Investment Research, Australian Energy Market Commission, Australian Energy Regulator
Exhibit 44: With Energy an incremental product offering
to its existing telecom offerings, Dodo has one of the
most competitive, electricity offers on the market… Relative monthly electricity costs - VIC, no contract (A$/m,
price at March-16)
Exhibit 45: .. and has the cheapest gas offer. These offers
should allow it to continue growing subscribers Relative monthly gas costs – VIC, no contract (A$/m, price at
March-16)
Source: Goldman Sachs Global Investment Research, Victorian Energy Compare (https://compare.switchon.vic.gov.au/)
Source: Goldman Sachs Global Investment Research, Victorian Energy Compare (https://compare.switchon.vic.gov.au/)
NSW, $5.3bn
VIC, $3.0bn
QLD, $2.4bn
SA, $1.1bn
WA, $1.5bn
Other,
$0.8bn
NSW, $1.0bn
VIC, $1.1bn
QLD, $0.2bn
SA, $0.4bn
WA, $0.4bn
Other, $0.1bn
80
100
120
140
Nex
t Bu
sin
ess
Glo
Bird
Po
wers
ho
p
Do
do
Red
Alin
ta
En
erg
y A
ustra
lia
Clic
k
AG
L
Po
we
rdire
ct
Orig
in
Mo
men
tum
Su
mo
Dia
mo
nd
Pe
op
le
Sim
ple
Pa
cific
Hy
dro
Lu
mo
QE
nerg
y
Relative monthly electricity contribution
VIC retailers, no contract, incl. conditional offers
80
100
120
140
160
Do
do
Orig
in
Alin
ta
Lu
mo
Mo
men
tum
AG
L
Red
Relative monthly gas contribution
VIC retailers, no contract, incl. conditional offers
March 10, 2016 Vocus Communications Ltd. (VOC.AX)
Goldman Sachs Global Investment Research 24
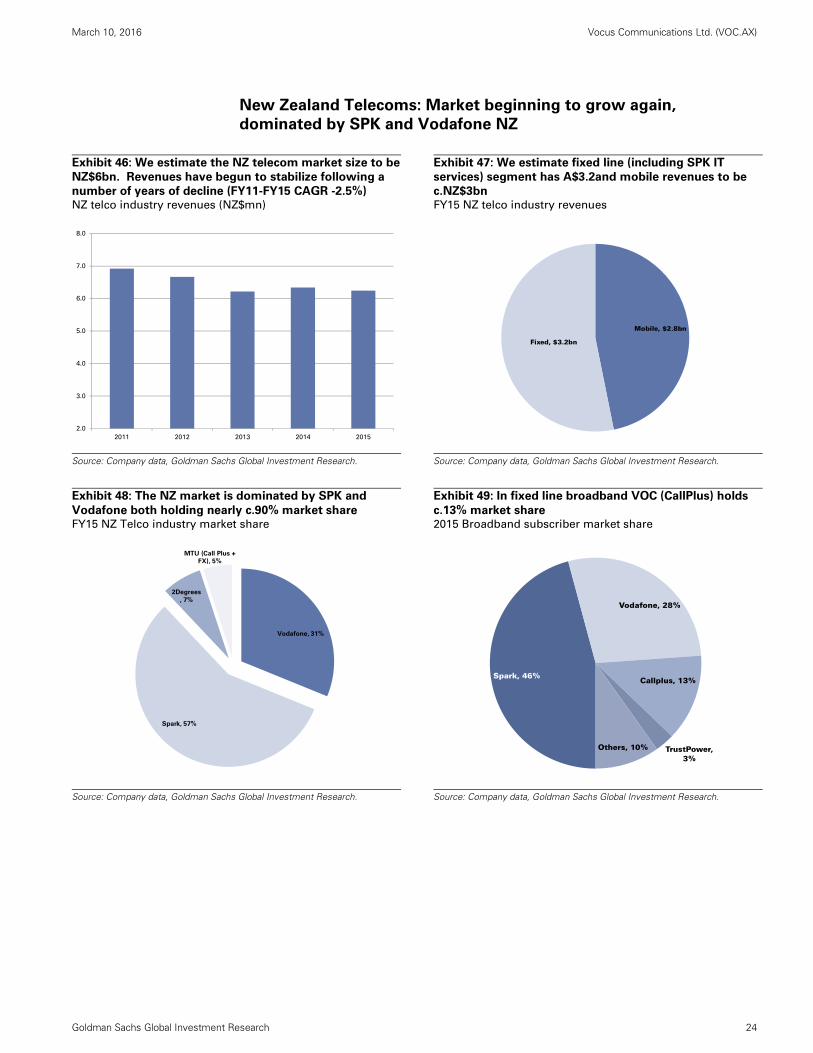
New Zealand Telecoms: Market beginning to grow again,
dominated by SPK and Vodafone NZ
Exhibit 46: We estimate the NZ telecom market size to be
NZ$6bn. Revenues have begun to stabilize following a
number of years of decline (FY11-FY15 CAGR -2.5%) NZ telco industry revenues (NZ$mn)
Exhibit 47: We estimate fixed line (including SPK IT
services) segment has A$3.2and mobile revenues to be
c.NZ$3bn FY15 NZ telco industry revenues
Source: Company data, Goldman Sachs Global Investment Research.
Source: Company data, Goldman Sachs Global Investment Research.
Exhibit 48: The NZ market is dominated by SPK and
Vodafone both holding nearly c.90% market share FY15 NZ Telco industry market share
Exhibit 49: In fixed line broadband VOC (CallPlus) holds
c.13% market share 2015 Broadband subscriber market share
Source: Company data, Goldman Sachs Global Investment Research.
Source: Company data, Goldman Sachs Global Investment Research.
2.0
3.0
4.0
5.0
6.0
7.0
8.0
2011 2012 2013 2014 2015
Mobile, $2.8bn
Fixed, $3.2bn
Vodafone, 31%
Spark, 57%
2Degrees
, 7%
MTU (Call Plus +
FX), 5%
Spark, 46%
Vodafone, 28%
Callplus, 13%
TrustPower, 3%
Others, 10%
March 10, 2016 Vocus Communications Ltd. (VOC.AX)
Goldman Sachs Global Investment Research 25
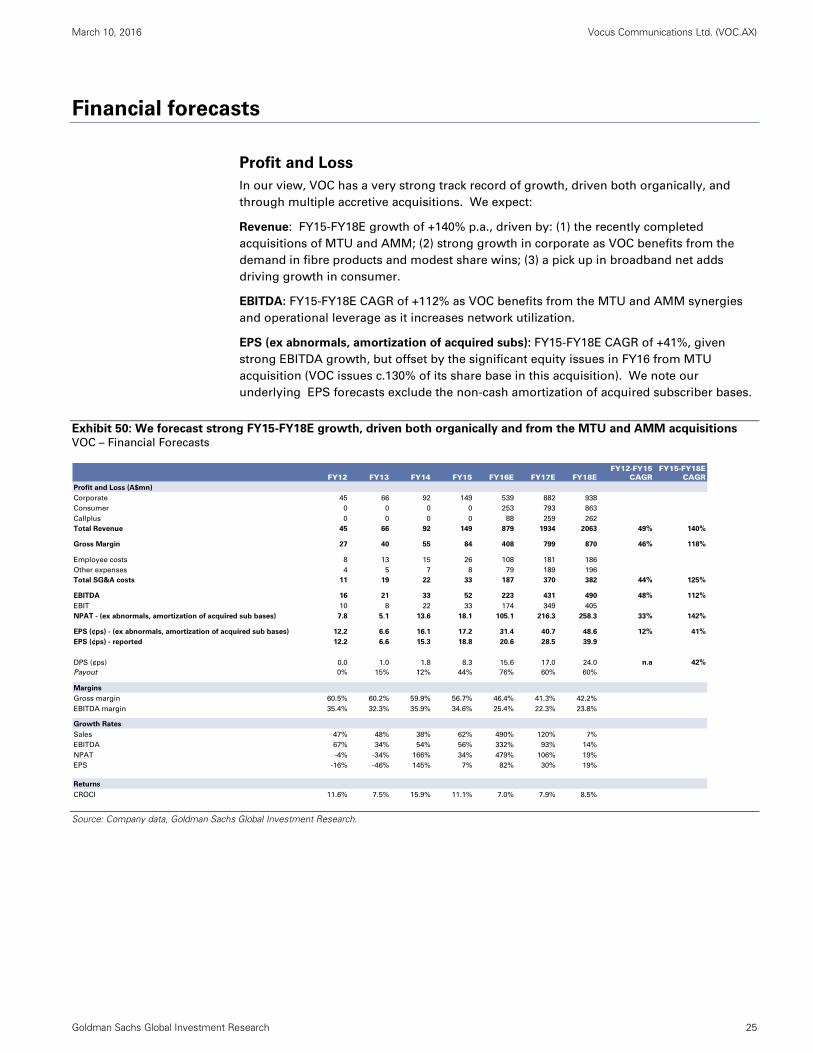
Financial forecasts
Profit and Loss
In our view, VOC has a very strong track record of growth, driven both organically, and
through multiple accretive acquisitions. We expect:
Revenue: FY15-FY18E growth of +140% p.a., driven by: (1) the recently completed
acquisitions of MTU and AMM; (2) strong growth in corporate as VOC benefits from the
demand in fibre products and modest share wins; (3) a pick up in broadband net adds
driving growth in consumer.
EBITDA: FY15-FY18E CAGR of +112% as VOC benefits from the MTU and AMM synergies
and operational leverage as it increases network utilization.
EPS (ex abnormals, amortization of acquired subs): FY15-FY18E CAGR of +41%, given
strong EBITDA growth, but offset by the significant equity issues in FY16 from MTU
acquisition (VOC issues c.130% of its share base in this acquisition). We note our
underlying EPS forecasts exclude the non-cash amortization of acquired subscriber bases.
Exhibit 50: We forecast strong FY15-FY18E growth, driven both organically and from the MTU and AMM acquisitions
VOC – Financial Forecasts
Source: Company data, Goldman Sachs Global Investment Research.
FY12-FY15 FY15-FY18EFY12 FY13 FY14 FY15 FY16E FY17E FY18E CAGR CAGR
Profit and Loss (A$mn)
Corporate 45 66 92 149 539 882 938
Consumer 0 0 0 0 253 793 863
Callplus 0 0 0 0 88 259 262
Total Revenue 45 66 92 149 879 1934 2063 49% 140%
Gross Margin 27 40 55 84 408 799 870 46% 118%
Employee costs 8 13 15 26 108 181 186
Other expenses 4 5 7 8 79 189 196
Total SG&A costs 11 19 22 33 187 370 382 44% 125%
EBITDA 16 21 33 52 223 431 490 48% 112%
EBIT 10 8 22 33 174 349 405
NPAT - (ex abnormals, amortization of acquired sub bases) 7.8 5.1 13.6 18.1 105.1 216.3 258.3 33% 142%
EPS (¢ps) - (ex abnormals, amortization of acquired sub bases) 12.2 6.6 16.1 17.2 31.4 40.7 48.6 12% 41%
EPS (¢ps) - reported 12.2 6.6 15.3 18.8 20.6 28.5 39.9
DPS (¢ps) 0.0 1.0 1.8 8.3 15.6 17.0 24.0 n.a 42%
Payout 0% 15% 12% 44% 76% 60% 60%
Margins
Gross margin 60.5% 60.2% 59.9% 56.7% 46.4% 41.3% 42.2%
EBITDA margin 35.4% 32.3% 35.9% 34.6% 25.4% 22.3% 23.8%
Growth Rates
Sales 47% 48% 38% 62% 490% 120% 7%
EBITDA 67% 34% 54% 56% 332% 93% 14%
NPAT -4% -34% 166% 34% 479% 106% 19%
EPS -16% -46% 145% 7% 82% 30% 19%
Returns
CROCI 11.6% 7.5% 15.9% 11.1% 7.0% 7.9% 8.5%
March 10, 2016 Vocus Communications Ltd. (VOC.AX)
Goldman Sachs Global Investment Research 26
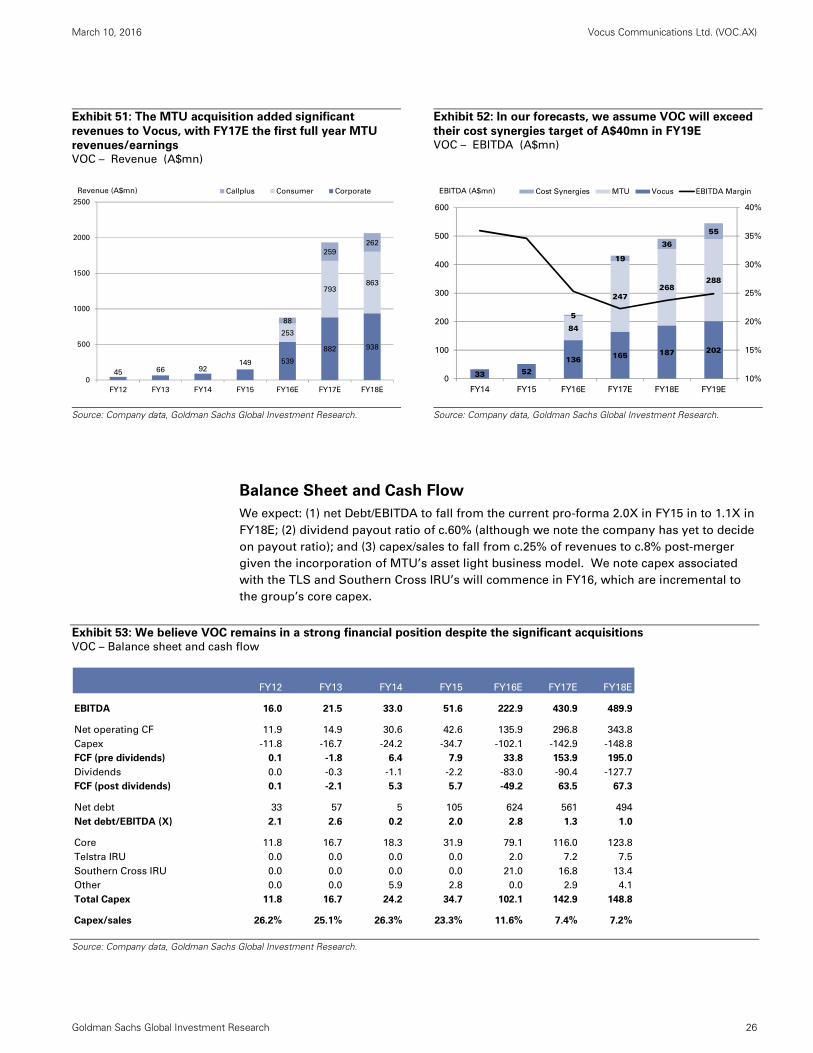
Exhibit 51: The MTU acquisition added significant
revenues to Vocus, with FY17E the first full year MTU
revenues/earnings VOC – Revenue (A$mn)
Exhibit 52: In our forecasts, we assume VOC will exceed
their cost synergies target of A$40mn in FY19E VOC – EBITDA (A$mn)
Source: Company data, Goldman Sachs Global Investment Research.
Source: Company data, Goldman Sachs Global Investment Research.
Balance Sheet and Cash Flow
We expect: (1) net Debt/EBITDA to fall from the current pro-forma 2.0X in FY15 in to 1.1X in
FY18E; (2) dividend payout ratio of c.60% (although we note the company has yet to decide
on payout ratio); and (3) capex/sales to fall from c.25% of revenues to c.8% post-merger
given the incorporation of MTU’s asset light business model. We note capex associated
with the TLS and Southern Cross IRU’s will commence in FY16, which are incremental to
the group’s core capex.
Exhibit 53: We believe VOC remains in a strong financial position despite the significant acquisitions
VOC – Balance sheet and cash flow
Source: Company data, Goldman Sachs Global Investment Research.
45 66 92149 539
882 938
253
793863
88
259
262
0
500
1000
1500
2000
2500
FY12 FY13 FY14 FY15 FY16E FY17E FY18E
Callplus Consumer CorporateRevenue (A$mn)
33 52
136 165 187 202
84
247268
288
5
19
36
55
10%
15%
20%
25%
30%
35%
40%
0
100
200
300
400
500
600
FY14 FY15 FY16E FY17E FY18E FY19E
Cost Synergies MTU Vocus EBITDA MarginEBITDA (A$mn)
FY12 FY13 FY14 FY15 FY16E FY17E FY18E
EBITDA 16.0 21.5 33.0 51.6 222.9 430.9 489.9
Net operating CF 11.9 14.9 30.6 42.6 135.9 296.8 343.8
Capex -11.8 -16.7 -24.2 -34.7 -102.1 -142.9 -148.8
FCF (pre dividends) 0.1 -1.8 6.4 7.9 33.8 153.9 195.0
Dividends 0.0 -0.3 -1.1 -2.2 -83.0 -90.4 -127.7
FCF (post dividends) 0.1 -2.1 5.3 5.7 -49.2 63.5 67.3
Net debt 33 57 5 105 624 561 494
Net debt/EBITDA (X) 2.1 2.6 0.2 2.0 2.8 1.3 1.0
Core 11.8 16.7 18.3 31.9 79.1 116.0 123.8
Telstra IRU 0.0 0.0 0.0 0.0 2.0 7.2 7.5
Southern Cross IRU 0.0 0.0 0.0 0.0 21.0 16.8 13.4
Other 0.0 0.0 5.9 2.8 0.0 2.9 4.1
Total Capex 11.8 16.7 24.2 34.7 102.1 142.9 148.8
Capex/sales 26.2% 25.1% 26.3% 23.3% 11.6% 7.4% 7.2%
March 10, 2016 Vocus Communications Ltd. (VOC.AX)
Goldman Sachs Global Investment Research 27
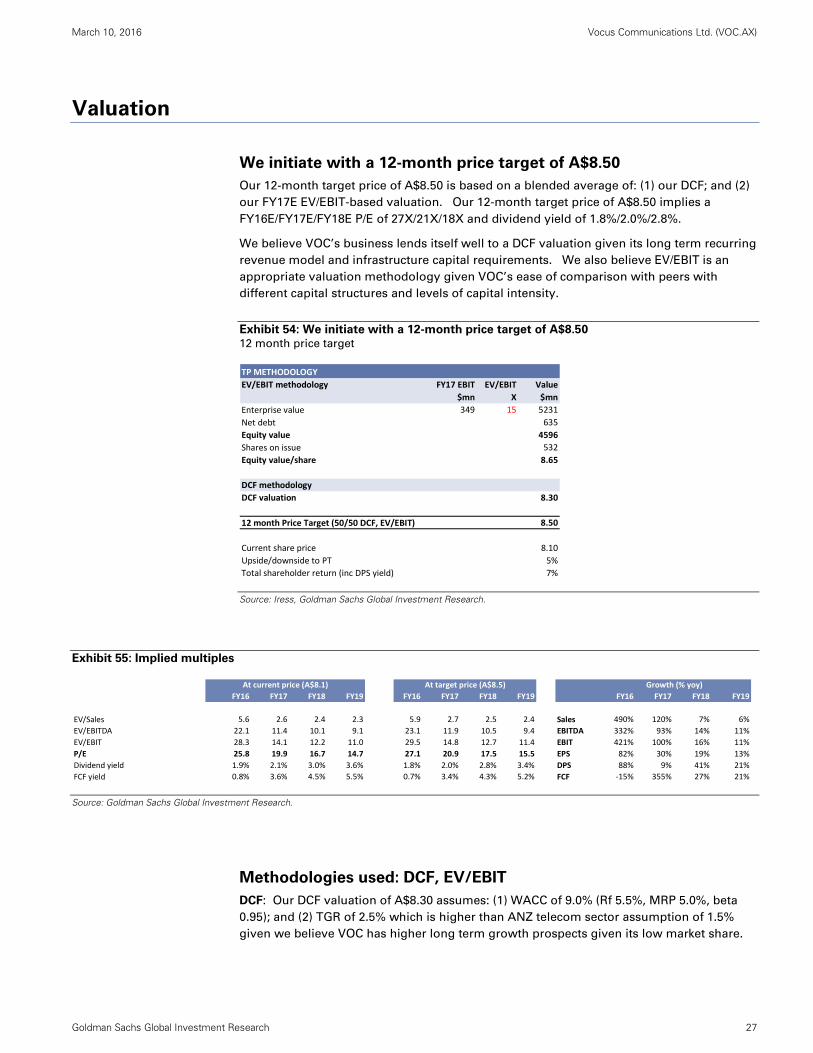
Valuation
We initiate with a 12-month price target of A$8.50
Our 12-month target price of A$8.50 is based on a blended average of: (1) our DCF; and (2)
our FY17E EV/EBIT-based valuation. Our 12-month target price of A$8.50 implies a
FY16E/FY17E/FY18E P/E of 27X/21X/18X and dividend yield of 1.8%/2.0%/2.8%.
We believe VOC’s business lends itself well to a DCF valuation given its long term recurring
revenue model and infrastructure capital requirements. We also believe EV/EBIT is an
appropriate valuation methodology given VOC’s ease of comparison with peers with
different capital structures and levels of capital intensity.
Exhibit 54: We initiate with a 12-month price target of A$8.50
12 month price target
Source: Iress, Goldman Sachs Global Investment Research.
Exhibit 55: Implied multiples
Source: Goldman Sachs Global Investment Research.
Methodologies used: DCF, EV/EBIT
DCF: Our DCF valuation of A$8.30 assumes: (1) WACC of 9.0% (Rf 5.5%, MRP 5.0%, beta
0.95); and (2) TGR of 2.5% which is higher than ANZ telecom sector assumption of 1.5%
given we believe VOC has higher long term growth prospects given its low market share.
TP METHODOLOGY
EV/EBIT methodology FY17 EBIT EV/EBIT Value
$mn X $mn
Enterprise value 349 15 5231
Net debt 635
Equity value 4596
Shares on issue 532
Equity value/share 8.65
DCF methodology
DCF valuation 8.30
12 month Price Target (50/50 DCF, EV/EBIT) 8.50
Current share price 8.10
Upside/downside to PT 5%
Total shareholder return (inc DPS yield) 7%
FY16 FY17 FY18 FY19 FY16 FY17 FY18 FY19 FY16 FY17 FY18 FY19
EV/Sales 5.6 2.6 2.4 2.3 5.9 2.7 2.5 2.4 Sales 490% 120% 7% 6%
EV/EBITDA 22.1 11.4 10.1 9.1 23.1 11.9 10.5 9.4 EBITDA 332% 93% 14% 11%
EV/EBIT 28.3 14.1 12.2 11.0 29.5 14.8 12.7 11.4 EBIT 421% 100% 16% 11%
P/E 25.8 19.9 16.7 14.7 27.1 20.9 17.5 15.5 EPS 82% 30% 19% 13%
Dividend yield 1.9% 2.1% 3.0% 3.6% 1.8% 2.0% 2.8% 3.4% DPS 88% 9% 41% 21%
FCF yield 0.8% 3.6% 4.5% 5.5% 0.7% 3.4% 4.3% 5.2% FCF ‐15% 355% 27% 21%
At current price (A$8.1) At target price (A$8.5) Growth (% yoy)
March 10, 2016 Vocus Communications Ltd. (VOC.AX)
Goldman Sachs Global Investment Research 28
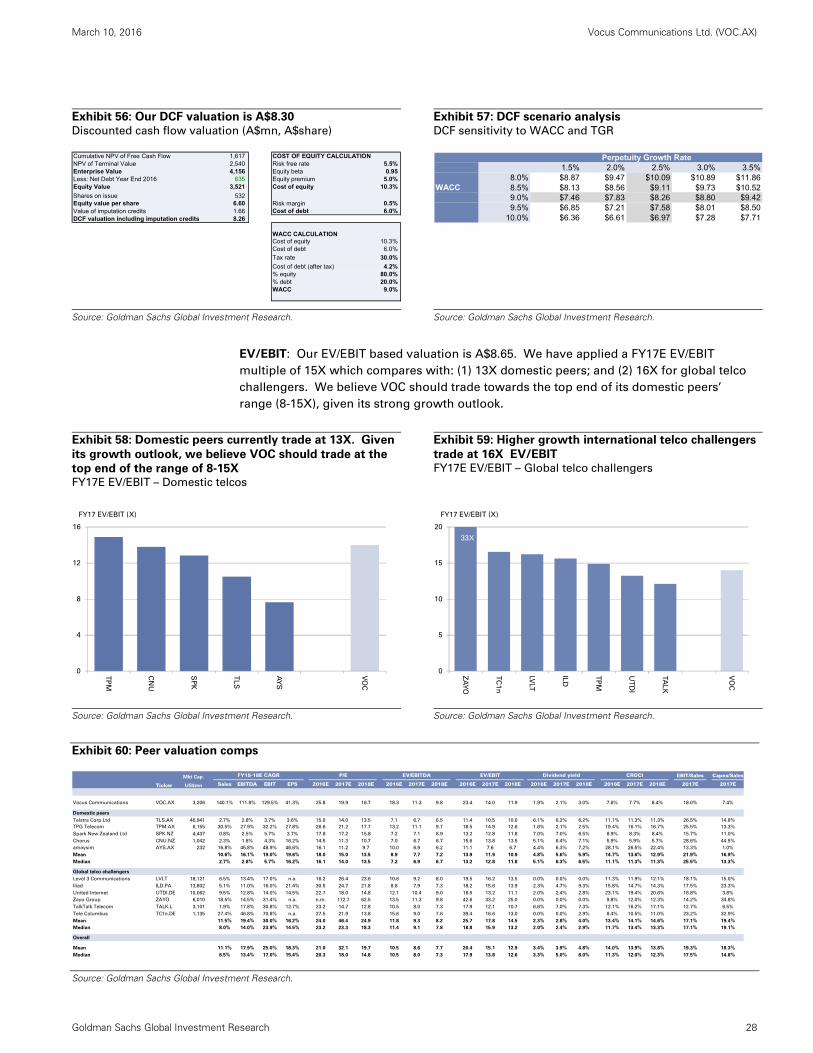
Exhibit 56: Our DCF valuation is A$8.30
Discounted cash flow valuation (A$mn, A$share)
Exhibit 57: DCF scenario analysis
DCF sensitivity to WACC and TGR
Source: Goldman Sachs Global Investment Research.
Source: Goldman Sachs Global Investment Research.
EV/EBIT: Our EV/EBIT based valuation is A$8.65. We have applied a FY17E EV/EBIT
multiple of 15X which compares with: (1) 13X domestic peers; and (2) 16X for global telco
challengers. We believe VOC should trade towards the top end of its domestic peers’
range (8-15X), given its strong growth outlook.
Exhibit 58: Domestic peers currently trade at 13X. Given
its growth outlook, we believe VOC should trade at the
top end of the range of 8-15X FY17E EV/EBIT – Domestic telcos
Exhibit 59: Higher growth international telco challengers
trade at 16X EV/EBIT FY17E EV/EBIT – Global telco challengers
Source: Goldman Sachs Global Investment Research.
Source: Goldman Sachs Global Investment Research.
Exhibit 60: Peer valuation comps
Source: Goldman Sachs Global Investment Research.
Cumulative NPV of Free Cash Flow 1,617 COST OF EQUITY CALCULATIONNPV of Terminal Value 2,540 Risk free rate 5.5% Enterprise Value 4,156 Equity beta 0.95 Less: Net Debt Year End 2016 635 Equity premium 5.0% Equity Value 3,521 Cost of equity 10.3%
Shares on issue 532 Equity value per share 6.60 Risk margin 0.5% Value of imputation credits 1.66 Cost of debt 6.0% DCF valuation including imputation credits 8.26
WACC CALCULATIONCost of equity 10.3% Cost of debt 6.0%
Tax rate 30.0%
Cost of debt (after tax) 4.2% % equity 80.0% % debt 20.0% WACC 9.0%
Perpetuity Growth Rate8 1.5% 2.0% 2.5% 3.0% 3.5%
8.0% $8.87 $9.47 $10.09 $10.89 $11.86WACC 8.5% $8.13 $8.56 $9.11 $9.73 $10.52
9.0% $7.46 $7.83 $8.26 $8.80 $9.429.5% $6.85 $7.21 $7.58 $8.01 $8.50
10.0% $6.36 $6.61 $6.97 $7.28 $7.71
0
4
8
12
16
TP
M
CN
U
SP
K
TL
S
AY
S
VO
C
FY17 EV/EBIT (X)
0
5
10
15
20
ZA
YO
TC
1n
LVLT
ILD
TP
M
UT
DI
TA
LK
VO
C
FY17 EV/EBIT (X)
33X
Mkt Cap. EBIT/Sales Capex/Sales
Ticker US$mn Sales EBITDA EBIT EPS 2016E 2017E 2018E 2016E 2017E 2018E 2016E 2017E 2018E 2016E 2017E 2018E 2016E 2017E 2018E 2017E 2017E
Vocus Communications VOC.AX 3,206 140.1% 111.8% 129.5% 41.3% 25.8 19.9 16.7 18.3 11.3 9.8 23.4 14.0 11.9 1.9% 2.1% 3.0% 7.6% 7.7% 8.4% 18.0% 7.4%
Domestic peers
Telstra Corp Ltd TLS.AX 46,941 2.7% 2.8% 3.7% 3.6% 15.0 14.0 13.5 7.1 6.7 6.5 11.4 10.5 10.0 6.1% 6.2% 6.2% 11.1% 11.3% 11.3% 26.5% 14.8%
TPG Telecom TPM.AX 6,155 30.5% 27.9% 32.2% 27.8% 26.6 21.2 17.7 13.2 11.1 9.7 18.5 14.9 12.6 1.6% 2.1% 2.5% 19.4% 16.1% 16.7% 25.5% 13.3%
Spark New Zealand Ltd SPK.NZ 4,437 0.8% 2.5% 5.7% 3.7% 17.8 17.2 15.8 7.2 7.1 6.9 13.2 12.8 11.8 7.0% 7.0% 6.5% 8.9% 8.3% 8.4% 15.7% 11.0%
Chorus CNU.NZ 1,042 2.3% 1.8% 4.3% 16.2% 14.5 11.3 10.7 7.0 6.7 6.7 15.6 13.8 13.5 5.1% 6.4% 7.1% 5.9% 5.9% 5.7% 28.6% 44.5%
amaysim AYS.AX 232 16.8% 45.8% 48.9% 46.6% 16.1 11.2 9.7 10.0 6.9 6.2 11.1 7.6 6.7 4.4% 6.3% 7.2% 28.1% 26.5% 22.4% 13.3% 1.0%
Mean 10.6% 16.1% 19.0% 19.6% 18.0 15.0 13.5 8.9 7.7 7.2 13.9 11.9 10.9 4.8% 5.6% 5.9% 14.7% 13.6% 12.9% 21.9% 16.9%
Median 2.7% 2.8% 5.7% 16.2% 16.1 14.0 13.5 7.2 6.9 6.7 13.2 12.8 11.8 5.1% 6.3% 6.5% 11.1% 11.3% 11.3% 25.5% 13.3%
Global telco challengers
Level 3 Communications LVLT 18,121 6.5% 13.4% 17.0% n.a. 16.2 26.4 23.6 10.6 9.2 8.0 19.5 16.2 13.5 0.0% 0.0% 0.0% 11.3% 11.9% 12.1% 18.1% 15.0%
Iliad ILD.PA 13,802 5.1% 11.0% 16.0% 21.4% 30.5 24.7 21.8 8.8 7.9 7.3 18.2 15.6 13.9 2.3% 4.7% 9.3% 15.8% 14.7% 14.3% 17.5% 23.3%
United Internet UTDI.DE 10,062 9.5% 12.8% 14.0% 14.5% 22.7 18.0 14.8 12.1 10.4 9.0 16.5 13.2 11.1 2.0% 2.4% 2.8% 23.1% 19.4% 20.6% 16.8% 3.8%
Zayo Group ZAYO 6,010 18.5% 14.5% 31.4% n.a. n.m. 172.7 62.5 13.5 11.3 9.8 42.6 33.2 25.0 0.0% 0.0% 0.0% 9.8% 12.0% 12.3% 14.2% 34.8%
TalkTalk Telecom TALK.L 3,101 1.9% 17.8% 30.8% 12.7% 23.2 14.7 12.8 10.5 8.0 7.3 17.9 12.1 10.7 6.6% 7.0% 7.3% 12.1% 16.2% 17.1% 12.7% 6.5%
Tele Columbus TC1n.DE 1,135 27.4% 46.8% 70.8% n.a. 27.5 21.9 13.8 15.6 9.0 7.6 39.4 16.6 13.0 0.0% 0.0% 2.9% 8.4% 10.5% 11.0% 23.2% 32.9%
Mean 11.5% 19.4% 30.0% 16.2% 24.0 46.4 24.9 11.8 9.3 8.2 25.7 17.8 14.5 2.3% 2.8% 4.0% 13.4% 14.1% 14.6% 17.1% 19.4%
Median 8.0% 14.0% 23.9% 14.5% 23.2 23.3 18.3 11.4 9.1 7.8 18.8 15.9 13.2 2.0% 2.4% 2.9% 11.7% 13.4% 13.3% 17.1% 19.1%
Overall
Mean 11.1% 17.9% 25.0% 18.3% 21.0 32.1 19.7 10.5 8.6 7.7 20.4 15.1 12.9 3.4% 3.9% 4.8% 14.0% 13.9% 13.8% 19.3% 18.3%
Median 6.5% 13.4% 17.0% 15.4% 20.3 18.0 14.8 10.5 8.0 7.3 17.9 13.8 12.6 3.3% 5.0% 6.0% 11.3% 12.0% 12.3% 17.5% 14.8%
CROCIFY15-18E CAGR P/E EV/EBITDA EV/EBIT Dividend yield
March 10, 2016 Vocus Communications Ltd. (VOC.AX)
Goldman Sachs Global Investment Research 29
Key risks
Competition: VOC faces competition from larger operators TLS, Optus and TPM (and SPK,
Vodafone in NZ) with stronger competitive positioning (e.g. greater ability to bundle,
infrastructure ownership) and greater scale. Over time it will likely face increased
competition in the Consumer segment from new entrants as the NBN rollout reaches
greater scale. However we note that VOC: (1) has the lowest market share among its key
competitors; and (2) is not facing a material increase in wholesale input costs (vs.
competitors) with the migration to the NBN.
M&A integration/execution risk: While both have a strong track record of integrating
acquisitions, combining VOC/MTU soon after VOC’s acquisition of AMM, will likely to be
challenging. There is a risk that cost and revenue synergies from the merger could be
lower/higher than our expectations.
Technology risk: We expect the NBN to accelerate the decline in legacy products such as
PSTN. The key issue for MTU is that an average SMB customer (3 PSTN lines, 1 broadband
line) spends 65%-75% of its monthly bill on PSTN products. One of the key challenges
facing MTU will be growing other revenue streams to replace these legacy products.
Supplier risk: VOC’s two main suppliers of telecom services are TLS and Optus. As a
reseller, MTU is exposed to risks such as: (1) price increases; (2) change in non-price terms
and conditions; and (3) shut-off of supply of a certain product set. However, we believe
these risks are mitigated given VOC’s stronger negotiating positioning following the
merger: (1) VOC delivers significant wholesale revenues to TLS; (2) VOC can now leverage
its own infrastructure as an alternative; and (3) TLS wholesale revenues are under
significant pressure is the NBN rollout accelerates.
Accretive M&A: Both VOC and M2 have created significant shareholder value through
accretive M&A. We expect this will continue as Vocus looks to increase its scale and
capabilities.
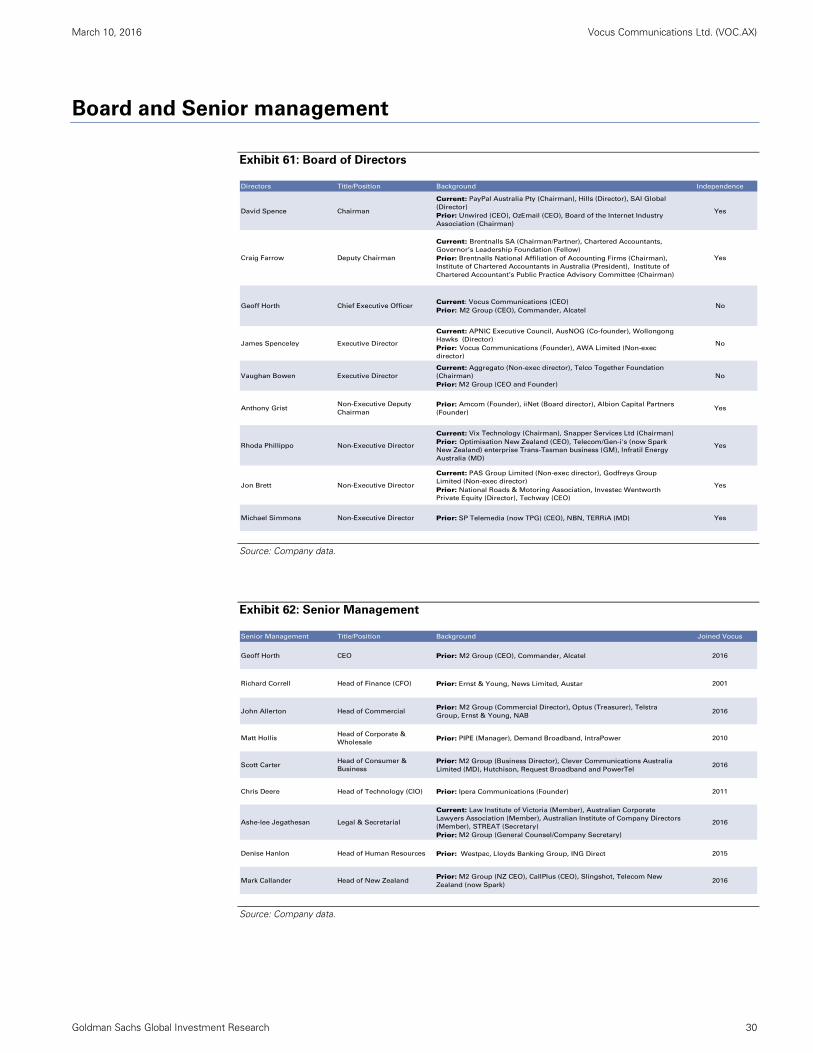
March 10, 2016 Vocus Communications Ltd. (VOC.AX)
Goldman Sachs Global Investment Research 30
Board and Senior management
Exhibit 61: Board of Directors
Source: Company data.
Exhibit 62: Senior Management
Source: Company data.
Directors Title/Position Background Independence
David Spence Chairman
Current: PayPal Australia Pty (Chairman), Hills (Director), SAI Global
(Director)
Prior: Unwired (CEO), OzEmail (CEO), Board of the Internet Industry
Association (Chairman)
Yes
Craig Farrow Deputy Chairman
Current: Brentnalls SA (Chairman/Partner), Chartered Accountants,
Governor’s Leadership Foundation (Fellow)
Prior: Brentnalls National Affiliation of Accounting Firms (Chairman),
Institute of Chartered Accountants in Australia (President), Institute of
Chartered Accountant’s Public Practice Advisory Committee (Chairman)
Yes
Geoff Horth Chief Executive OfficerCurrent: Vocus Communications (CEO)
Prior: M2 Group (CEO), Commander, AlcatelNo
James Spenceley Executive Director
Current: APNIC Executive Council, AusNOG (Co-founder), Wollongong
Hawks (Director)
Prior: Vocus Communications (Founder), AWA Limited (Non-exec
director)
No
Vaughan Bowen Executive Director
Current: Aggregato (Non-exec director), Telco Together Foundation
(Chairman)
Prior: M2 Group (CEO and Founder)
No
Anthony GristNon-Executive Deputy
Chairman
Prior: Amcom (Founder), iiNet (Board director), Albion Capital Partners
(Founder)Yes
Rhoda Phillippo Non-Executive Director
Current: Vix Technology (Chairman), Snapper Services Ltd (Chairman)
Prior: Optimisation New Zealand (CEO), Telecom/Gen-i's (now Spark
New Zealand) enterprise Trans-Tasman business (GM), Infratil Energy
Australia (MD)
Yes
Jon Brett Non-Executive Director
Current: PAS Group Limited (Non-exec director), Godfreys Group
Limited (Non-exec director)
Prior: National Roads & Motoring Association, Investec Wentworth
Private Equity (Director), Techway (CEO)
Yes
Michael Simmons Non-Executive Director Prior: SP Telemedia (now TPG) (CEO), NBN, TERRiA (MD) Yes
Senior Management Title/Position Background Joined Vocus
Geoff Horth CEO Prior: M2 Group (CEO), Commander, Alcatel 2016
Richard Correll Head of Finance (CFO) Prior: Ernst & Young, News Limited, Austar 2001
John Allerton Head of CommercialPrior: M2 Group (Commercial Director), Optus (Treasurer), Telstra
Group, Ernst & Young, NAB2016
Matt HollisHead of Corporate &
WholesalePrior: PIPE (Manager), Demand Broadband, IntraPower 2010
Scott CarterHead of Consumer &
Business
Prior: M2 Group (Business Director), Clever Communications Australia
Limited (MD), Hutchison, Request Broadband and PowerTel2016
Chris Deere Head of Technology (CIO) Prior: Ipera Communications (Founder) 2011
Ashe-lee Jegathesan Legal & Secretarial
Current: Law Institute of Victoria (Member), Australian Corporate
Lawyers Association (Member), Australian Institute of Company Directors
(Member), STREAT (Secretary)
Prior: M2 Group (General Counsel/Company Secretary)
2016
Denise Hanlon Head of Human Resources Prior: Westpac, Lloyds Banking Group, ING Direct 2015
Mark Callander Head of New ZealandPrior: M2 Group (NZ CEO), CallPlus (CEO), Slingshot, Telecom New
Zealand (now Spark)2016
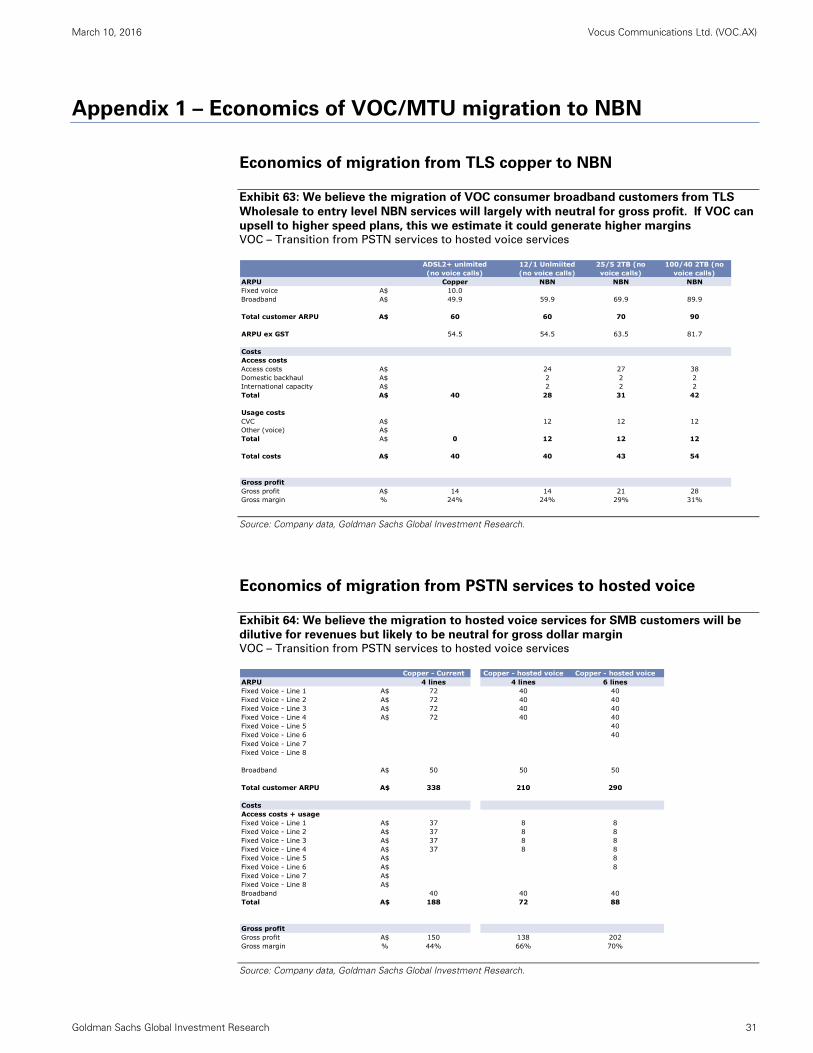
March 10, 2016 Vocus Communications Ltd. (VOC.AX)
Goldman Sachs Global Investment Research 31
Appendix 1 – Economics of VOC/MTU migration to NBN
Economics of migration from TLS copper to NBN
Exhibit 63: We believe the migration of VOC consumer broadband customers from TLS
Wholesale to entry level NBN services will largely with neutral for gross profit. If VOC can
upsell to higher speed plans, this we estimate it could generate higher margins VOC – Transition from PSTN services to hosted voice services
Source: Company data, Goldman Sachs Global Investment Research.
Economics of migration from PSTN services to hosted voice
Exhibit 64: We believe the migration to hosted voice services for SMB customers will be
dilutive for revenues but likely to be neutral for gross dollar margin VOC – Transition from PSTN services to hosted voice services
Source: Company data, Goldman Sachs Global Investment Research.
ADSL2+ unlmited (no voice calls)
12/1 Unlmiited (no voice calls)
25/5 2TB (no voice calls)
100/40 2TB (no voice calls)
ARPU Copper NBN NBN NBNFixed voice A$ 10.0Broadband A$ 49.9 59.9 69.9 89.9
Total customer ARPU A$ 60 60 70 90
ARPU ex GST 54.5 54.5 63.5 81.7
CostsAccess costsAccess costs A$ 24 27 38Domestic backhaul A$ 2 2 2International capacity A$ 2 2 2Total A$ 40 28 31 42
Usage costsCVC A$ 12 12 12Other (voice) A$Total A$ 0 12 12 12
Total costs A$ 40 40 43 54
Gross profitGross profit A$ 14 14 21 28Gross margin % 24% 24% 29% 31%
Copper - Current Copper - hosted voice Copper - hosted voiceARPU 4 lines 4 lines 6 linesFixed Voice - Line 1 A$ 72 40 40Fixed Voice - Line 2 A$ 72 40 40Fixed Voice - Line 3 A$ 72 40 40Fixed Voice - Line 4 A$ 72 40 40Fixed Voice - Line 5 40Fixed Voice - Line 6 40Fixed Voice - Line 7Fixed Voice - Line 8
Broadband A$ 50 50 50
Total customer ARPU A$ 338 210 290
CostsAccess costs + usageFixed Voice - Line 1 A$ 37 8 8Fixed Voice - Line 2 A$ 37 8 8Fixed Voice - Line 3 A$ 37 8 8Fixed Voice - Line 4 A$ 37 8 8Fixed Voice - Line 5 A$ 8Fixed Voice - Line 6 A$ 8Fixed Voice - Line 7 A$Fixed Voice - Line 8 A$Broadband 40 40 40Total A$ 188 72 88
Gross profitGross profit A$ 150 138 202Gross margin % 44% 66% 70%
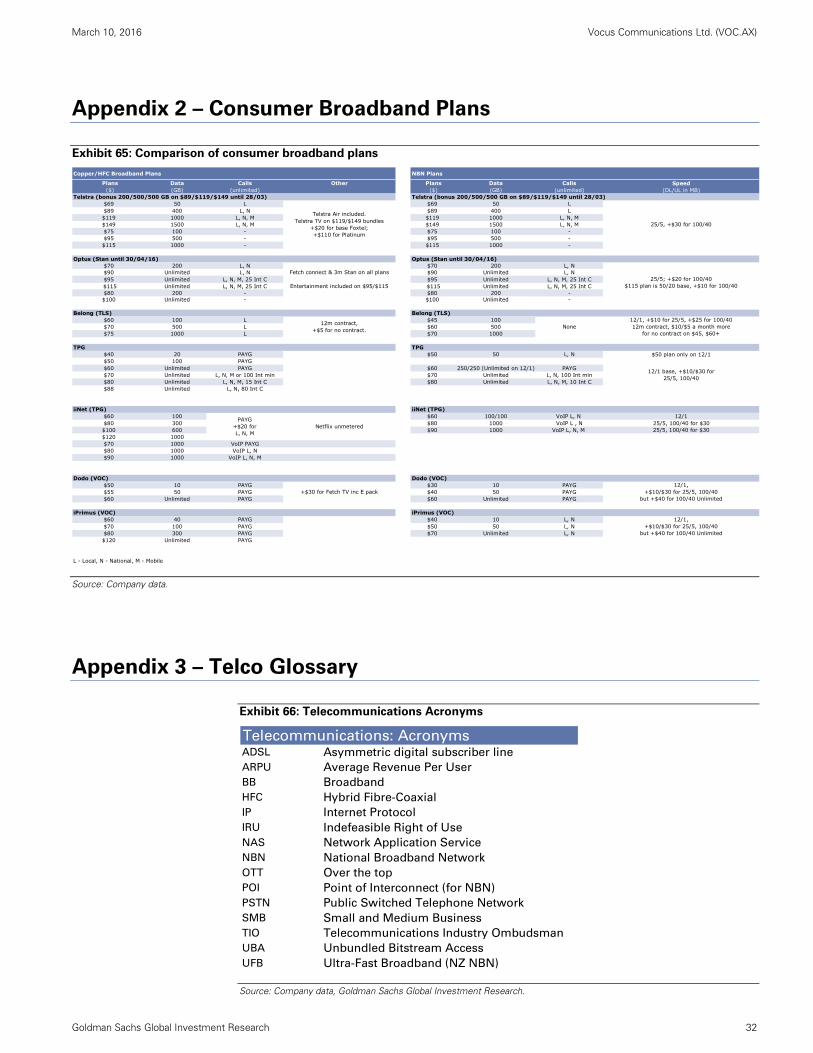
March 10, 2016 Vocus Communications Ltd. (VOC.AX)
Goldman Sachs Global Investment Research 32
Appendix 2 – Consumer Broadband Plans
Exhibit 65: Comparison of consumer broadband plans
Source: Company data.
Appendix 3 – Telco Glossary
Exhibit 66: Telecommunications Acronyms
Source: Company data, Goldman Sachs Global Investment Research.
Copper/HFC Broadband Plans NBN Plans
Plans Data Calls Other Plans Data Calls Speed($) (GB) (unlimited) ($) (GB) (unlimited) (DL/UL in MB)
Telstra (bonus 200/500/500 GB on $89/$119/$149 until 28/03) Telstra (bonus 200/500/500 GB on $89/$119/$149 until 28/03)$69 50 L $69 50 L$89 400 L, N $89 400 L$119 1000 L, N, M $119 1000 L, N, M$149 1500 L, N, M $149 1500 L, N, M$75 100 - $75 100 -$95 500 - $95 500 -$115 1000 - $115 1000 -
Optus (Stan until 30/04/16) Optus (Stan until 30/04/16)$70 200 L, N $70 200 L, N$90 Unlimited L, N $90 Unlimited L, N$95 Unlimited L, N, M, 25 Int C $95 Unlimited L, N, M, 25 Int C$115 Unlimited L, N, M, 25 Int C $115 Unlimited L, N, M, 25 Int C$80 200 - $80 200 -$100 Unlimited - $100 Unlimited -
Belong (TLS)$60 100 L $45 100$70 500 L $60 500$75 1000 L $70 1000
TPG$40 20 PAYG $50 50 L, N $50 plan only on 12/1$50 100 PAYG$60 Unlimited PAYG $60 250/250 (Unlimited on 12/1) PAYG$70 Unlimited L, N, M or 100 Int min $70 Unlimited L, N, 100 Int min$80 Unlimited L, N, M, 15 Int C $80 Unlimited L, N, M, 10 Int C$88 Unlimited L, N, 80 Int C
iiNet (TPG) iiNet (TPG)$60 100 $60 100/100 VoIP L, N 12/1$80 300 $80 1000 VoIP L , N 25/5, 100/40 for $30$100 600 $90 1000 VoIP L, N, M 25/5, 100/40 for $30$120 1000$70 1000 VoIP PAYG$80 1000 VoIP L, N$90 1000 VoIP L, N, M
$50 10 PAYG $30 10 PAYG$55 50 PAYG $40 50 PAYG$60 Unlimited PAYG $60 Unlimited PAYG
$60 40 PAYG $40 10 L, N$70 100 PAYG $50 50 L, N$80 300 PAYG $70 Unlimited L, N$120 Unlimited PAYG
L - Local, N - National, M - Mobile
PAYG+$20 for L, N, M
Telstra Air included.Telstra TV on $119/$149 bundles
+$20 for base Foxtel; +$110 for Platinum
iPrimus (VOC)12/1,
+$10/$30 for 25/5, 100/40but +$40 for 100/40 Unlimited
iPrimus (VOC)
TPG
Dodo (VOC)12/1,
+$10/$30 for 25/5, 100/40but +$40 for 100/40 Unlimited
+$30 for Fetch TV inc E pack
Dodo (VOC)
Netflix unmetered
25/5; +$20 for 100/40$115 plan is 50/20 base, +$10 for 100/40
Belong (TLS)
Fetch connect & 3m Stan on all plans
Entertainment included on $95/$115
12/1 base, +$10/$30 for 25/5, 100/40
25/5, +$30 for 100/40
12m contract,+$5 for no contract.
12/1, +$10 for 25/5, +$25 for 100/4012m contract, $10/$5 a month more
for no contract on $45, $60+None
Telecommunications: AcronymsADSL Asymmetric digital subscriber line
ARPU Average Revenue Per User
BB Broadband
HFC Hybrid Fibre-Coaxial
IP Internet Protocol
IRU Indefeasible Right of Use
NAS Network Application Service
NBN National Broadband Network
OTT Over the top
POI Point of Interconnect (for NBN)
PSTN Public Switched Telephone Network
SMB Small and Medium Business
TIO Telecommunications Industry Ombudsman
UBA Unbundled Bitstream Access
UFB Ultra-Fast Broadband (NZ NBN)
March 10, 2016 Vocus Communications Ltd. (VOC.AX)
Goldman Sachs Global Investment Research 33
Disclosure Appendix
Reg AC
We, Raymond Tong, Kane Hannan and Anita Dinshaw, hereby certify that all of the views expressed in this report accurately reflect our personal
views about the subject company or companies and its or their securities. We also certify that no part of our compensation was, is or will be, directly
or indirectly, related to the specific recommendations or views expressed in this report.
Unless otherwise stated, the individuals listed on the cover page of this report are analysts in Goldman Sachs' Global Investment Research division.
Investment Profile
The Goldman Sachs Investment Profile provides investment context for a security by comparing key attributes of that security to its peer group and
market. The four key attributes depicted are: growth, returns, multiple and volatility. Growth, returns and multiple are indexed based on composites
of several methodologies to determine the stocks percentile ranking within the region's coverage universe.
The precise calculation of each metric may vary depending on the fiscal year, industry and region but the standard approach is as follows:
Growth is a composite of next year's estimate over current year's estimate, e.g. EPS, EBITDA, Revenue. Return is a year one prospective aggregate
of various return on capital measures, e.g. CROCI, ROACE, and ROE. Multiple is a composite of one-year forward valuation ratios, e.g. P/E, dividend
yield, EV/FCF, EV/EBITDA, EV/DACF, Price/Book. Volatility is measured as trailing twelve-month volatility adjusted for dividends.
Quantum
Quantum is Goldman Sachs' proprietary database providing access to detailed financial statement histories, forecasts and ratios. It can be used for
in-depth analysis of a single company, or to make comparisons between companies in different sectors and markets.
GS SUSTAIN
GS SUSTAIN is a global investment strategy aimed at long-term, long-only performance with a low turnover of ideas. The GS SUSTAIN focus list
includes leaders our analysis shows to be well positioned to deliver long term outperformance through sustained competitive advantage and
superior returns on capital relative to their global industry peers. Leaders are identified based on quantifiable analysis of three aspects of corporate
performance: cash return on cash invested, industry positioning and management quality (the effectiveness of companies' management of the
environmental, social and governance issues facing their industry).
Disclosures
Coverage group(s) of stocks by primary analyst(s)
Raymond Tong: Australia/New Zealand-Telecom.
Australia/New Zealand-Telecom: amaysim Australia Ltd., Chorus Ltd., Hutchison Telecommunications Australia, M2 Group Ltd., Spark New Zealand,
Telstra Corp., TPG Telecom, Vocus Communications Ltd..
Company-specific regulatory disclosures
The following disclosures relate to relationships between The Goldman Sachs Group, Inc. (with its affiliates, "Goldman Sachs") and companies
covered by the Global Investment Research Division of Goldman Sachs and referred to in this research.
Goldman Sachs has received compensation for investment banking services in the past 12 months: Vocus Communications Ltd. (A$7.98)
Goldman Sachs expects to receive or intends to seek compensation for investment banking services in the next 3 months: Vocus Communications
Ltd. (A$7.98)
Goldman Sachs had an investment banking services client relationship during the past 12 months with: Vocus Communications Ltd. (A$7.98)
Goldman Sachs had a non-securities services client relationship during the past 12 months with: Vocus Communications Ltd. (A$7.98)
Distribution of ratings/investment banking relationships
Goldman Sachs Investment Research global coverage universe
Rating Distribution Investment Banking Relationships
Buy Hold Sell Buy Hold Sell
Global 31% 53% 16% 63% 58% 52%
As of January 1, 2016, Goldman Sachs Global Investment Research had investment ratings on 3,254 equity securities. Goldman Sachs assigns stocks
as Buys and Sells on various regional Investment Lists; stocks not so assigned are deemed Neutral. Such assignments equate to Buy, Hold and Sell
for the purposes of the above disclosure required by NASD/NYSE rules. See 'Ratings, Coverage groups and views and related definitions' below.
Regulatory disclosures
Disclosures required by United States laws and regulations
See company-specific regulatory disclosures above for any of the following disclosures required as to companies referred to in this report: manager
or co-manager in a pending transaction; 1% or other ownership; compensation for certain services; types of client relationships; managed/co-
managed public offerings in prior periods; directorships; for equity securities, market making and/or specialist role. Goldman Sachs trades or may
trade as a principal in debt securities (or in related derivatives) of issuers discussed in this report.
The following are additional required disclosures: Ownership and material conflicts of interest: Goldman Sachs policy prohibits its analysts,
professionals reporting to analysts and members of their households from owning securities of any company in the analyst's area of
coverage. Analyst compensation: Analysts are paid in part based on the profitability of Goldman Sachs, which includes investment banking
revenues. Analyst as officer or director: Goldman Sachs policy prohibits its analysts, persons reporting to analysts or members of their
households from serving as an officer, director, advisory board member or employee of any company in the analyst's area of coverage. Non-U.S.
March 10, 2016 Vocus Communications Ltd. (VOC.AX)
Goldman Sachs Global Investment Research 34
Analysts: Non-U.S. analysts may not be associated persons of Goldman, Sachs & Co. and therefore may not be subject to FINRA Rule 2241 or FINRA
Rule 2242 restrictions on communications with subject company, public appearances and trading securities held by the analysts.
Distribution of ratings: See the distribution of ratings disclosure above. Price chart: See the price chart, with changes of ratings and price targets in
prior periods, above, or, if electronic format or if with respect to multiple companies which are the subject of this report, on the Goldman Sachs
website at http://www.gs.com/research/hedge.html.
Additional disclosures required under the laws and regulations of jurisdictions other than the United States
The following disclosures are those required by the jurisdiction indicated, except to the extent already made above pursuant to United States laws
and regulations. Australia: Goldman Sachs Australia Pty Ltd and its affiliates are not authorised deposit-taking institutions (as that term is defined in
the Banking Act 1959 (Cth)) in Australia and do not provide banking services, nor carry on a banking business, in Australia. This research, and any
access to it, is intended only for "wholesale clients" within the meaning of the Australian Corporations Act, unless otherwise agreed by Goldman
Sachs. In producing research reports, members of the Global Investment Research Division of Goldman Sachs Australia may attend site visits and
other meetings hosted by the issuers the subject of its research reports. In some instances the costs of such site visits or meetings may be met in part
or in whole by the issuers concerned if Goldman Sachs Australia considers it is appropriate and reasonable in the specific circumstances relating to
the site visit or meeting. Brazil: Disclosure information in relation to CVM Instruction 483 is available at
http://www.gs.com/worldwide/brazil/area/gir/index.html. Where applicable, the Brazil-registered analyst primarily responsible for the content of this
research report, as defined in Article 16 of CVM Instruction 483, is the first author named at the beginning of this report, unless indicated otherwise at
the end of the text. Canada: Goldman Sachs Canada Inc. is an affiliate of The Goldman Sachs Group Inc. and therefore is included in the company
specific disclosures relating to Goldman Sachs (as defined above). Goldman Sachs Canada Inc. has approved of, and agreed to take responsibility for,
this research report in Canada if and to the extent that Goldman Sachs Canada Inc. disseminates this research report to its clients. Hong Kong: Further information on the securities of covered companies referred to in this research may be obtained on request from Goldman Sachs
(Asia) L.L.C. India: Further information on the subject company or companies referred to in this research may be obtained from Goldman Sachs
(India) Securities Private Limited. Goldman Sachs may beneficially own 1% or more of the securities (as such term is defined in clause 2 (h) the Indian
Securities Contracts (Regulation) Act, 1956) of the subject company or companies referred to in this research report. Japan: See
below. Korea: Further information on the subject company or companies referred to in this research may be obtained from Goldman Sachs (Asia)
L.L.C., Seoul Branch. New Zealand: Goldman Sachs New Zealand Limited and its affiliates are neither "registered banks" nor "deposit takers" (as
defined in the Reserve Bank of New Zealand Act 1989) in New Zealand. This research, and any access to it, is intended for "wholesale clients" (as
defined in the Financial Advisers Act 2008) unless otherwise agreed by Goldman Sachs. Russia: Research reports distributed in the Russian
Federation are not advertising as defined in the Russian legislation, but are information and analysis not having product promotion as their main
purpose and do not provide appraisal within the meaning of the Russian legislation on appraisal activity. Singapore: Further information on the
covered companies referred to in this research may be obtained from Goldman Sachs (Singapore) Pte. (Company Number:
198602165W). Taiwan: This material is for reference only and must not be reprinted without permission. Investors should carefully consider their
own investment risk. Investment results are the responsibility of the individual investor. United Kingdom: Persons who would be categorized as
retail clients in the United Kingdom, as such term is defined in the rules of the Financial Conduct Authority, should read this research in conjunction
with prior Goldman Sachs research on the covered companies referred to herein and should refer to the risk warnings that have been sent to them by
Goldman Sachs International. A copy of these risks warnings, and a glossary of certain financial terms used in this report, are available from
Goldman Sachs International on request.
European Union: Disclosure information in relation to Article 4 (1) (d) and Article 6 (2) of the European Commission Directive 2003/125/EC is available
at http://www.gs.com/disclosures/europeanpolicy.html which states the European Policy for Managing Conflicts of Interest in Connection with
Investment Research.
Japan: Goldman Sachs Japan Co., Ltd. is a Financial Instrument Dealer registered with the Kanto Financial Bureau under registration number Kinsho
69, and a member of Japan Securities Dealers Association, Financial Futures Association of Japan and Type II Financial Instruments Firms
Association. Sales and purchase of equities are subject to commission pre-determined with clients plus consumption tax. See company-specific
disclosures as to any applicable disclosures required by Japanese stock exchanges, the Japanese Securities Dealers Association or the Japanese
Securities Finance Company.
Ratings, coverage groups and views and related definitions
Buy (B), Neutral (N), Sell (S) -Analysts recommend stocks as Buys or Sells for inclusion on various regional Investment Lists. Being assigned a Buy
or Sell on an Investment List is determined by a stock's return potential relative to its coverage group as described below. Any stock not assigned as
a Buy or a Sell on an Investment List is deemed Neutral. Each regional Investment Review Committee manages various regional Investment Lists to a
global guideline of 25%-35% of stocks as Buy and 10%-15% of stocks as Sell; however, the distribution of Buys and Sells in any particular coverage
group may vary as determined by the regional Investment Review Committee. Regional Conviction Buy and Sell lists represent investment
recommendations focused on either the size of the potential return or the likelihood of the realization of the return.
Return potential represents the price differential between the current share price and the price target expected during the time horizon associated
with the price target. Price targets are required for all covered stocks. The return potential, price target and associated time horizon are stated in each
report adding or reiterating an Investment List membership.
Coverage groups and views: A list of all stocks in each coverage group is available by primary analyst, stock and coverage group at
http://www.gs.com/research/hedge.html. The analyst assigns one of the following coverage views which represents the analyst's investment outlook
on the coverage group relative to the group's historical fundamentals and/or valuation. Attractive (A). The investment outlook over the following 12
months is favorable relative to the coverage group's historical fundamentals and/or valuation. Neutral (N). The investment outlook over the
following 12 months is neutral relative to the coverage group's historical fundamentals and/or valuation. Cautious (C). The investment outlook over
the following 12 months is unfavorable relative to the coverage group's historical fundamentals and/or valuation.
Not Rated (NR). The investment rating and target price have been removed pursuant to Goldman Sachs policy when Goldman Sachs is acting in an
advisory capacity in a merger or strategic transaction involving this company and in certain other circumstances. Rating Suspended (RS). Goldman
Sachs Research has suspended the investment rating and price target for this stock, because there is not a sufficient fundamental basis for
determining, or there are legal, regulatory or policy constraints around publishing, an investment rating or target. The previous investment rating and
price target, if any, are no longer in effect for this stock and should not be relied upon. Coverage Suspended (CS). Goldman Sachs has suspended
coverage of this company. Not Covered (NC). Goldman Sachs does not cover this company. Not Available or Not Applicable (NA). The
information is not available for display or is not applicable. Not Meaningful (NM). The information is not meaningful and is therefore excluded.
Global product; distributing entities
The Global Investment Research Division of Goldman Sachs produces and distributes research products for clients of Goldman Sachs on a global
basis. Analysts based in Goldman Sachs offices around the world produce equity research on industries and companies, and research on
March 10, 2016 Vocus Communications Ltd. (VOC.AX)
Goldman Sachs Global Investment Research 35
macroeconomics, currencies, commodities and portfolio strategy. This research is disseminated in Australia by Goldman Sachs Australia Pty Ltd
(ABN 21 006 797 897); in Brazil by Goldman Sachs do Brasil Corretora de Títulos e Valores Mobiliários S.A.; in Canada by either Goldman Sachs
Canada Inc. or Goldman, Sachs & Co.; in Hong Kong by Goldman Sachs (Asia) L.L.C.; in India by Goldman Sachs (India) Securities Private Ltd.; in
Japan by Goldman Sachs Japan Co., Ltd.; in the Republic of Korea by Goldman Sachs (Asia) L.L.C., Seoul Branch; in New Zealand by Goldman Sachs
New Zealand Limited; in Russia by OOO Goldman Sachs; in Singapore by Goldman Sachs (Singapore) Pte. (Company Number: 198602165W); and in
the United States of America by Goldman, Sachs & Co. Goldman Sachs International has approved this research in connection with its distribution in
the United Kingdom and European Union.
European Union: Goldman Sachs International authorised by the Prudential Regulation Authority and regulated by the Financial Conduct Authority
and the Prudential Regulation Authority, has approved this research in connection with its distribution in the European Union and United Kingdom;
Goldman Sachs AG and Goldman Sachs International Zweigniederlassung Frankfurt, regulated by the Bundesanstalt für
Finanzdienstleistungsaufsicht, may also distribute research in Germany.
General disclosures
This research is for our clients only. Other than disclosures relating to Goldman Sachs, this research is based on current public information that we
consider reliable, but we do not represent it is accurate or complete, and it should not be relied on as such. We seek to update our research as
appropriate, but various regulations may prevent us from doing so. Other than certain industry reports published on a periodic basis, the large
majority of reports are published at irregular intervals as appropriate in the analyst's judgment.
Goldman Sachs conducts a global full-service, integrated investment banking, investment management, and brokerage business. We have
investment banking and other business relationships with a substantial percentage of the companies covered by our Global Investment Research
Division. Goldman, Sachs & Co., the United States broker dealer, is a member of SIPC (http://www.sipc.org).
Our salespeople, traders, and other professionals may provide oral or written market commentary or trading strategies to our clients and principal
trading desks that reflect opinions that are contrary to the opinions expressed in this research. Our asset management area, principal trading desks
and investing businesses may make investment decisions that are inconsistent with the recommendations or views expressed in this research.
The analysts named in this report may have from time to time discussed with our clients, including Goldman Sachs salespersons and traders, or may
discuss in this report, trading strategies that reference catalysts or events that may have a near-term impact on the market price of the equity
securities discussed in this report, which impact may be directionally counter to the analyst's published price target expectations for such stocks. Any
such trading strategies are distinct from and do not affect the analyst's fundamental equity rating for such stocks, which rating reflects a stock's
return potential relative to its coverage group as described herein.
We and our affiliates, officers, directors, and employees, excluding equity and credit analysts, will from time to time have long or short positions in,
act as principal in, and buy or sell, the securities or derivatives, if any, referred to in this research.
The views attributed to third party presenters at Goldman Sachs arranged conferences, including individuals from other parts of Goldman Sachs, do
not necessarily reflect those of Global Investment Research and are not an official view of Goldman Sachs.
Any third party referenced herein, including any salespeople, traders and other professionals or members of their household, may have positions in
the products mentioned that are inconsistent with the views expressed by analysts named in this report.
This research is not an offer to sell or the solicitation of an offer to buy any security in any jurisdiction where such an offer or solicitation would be
illegal. It does not constitute a personal recommendation or take into account the particular investment objectives, financial situations, or needs of
individual clients. Clients should consider whether any advice or recommendation in this research is suitable for their particular circumstances and, if
appropriate, seek professional advice, including tax advice. The price and value of investments referred to in this research and the income from them
may fluctuate. Past performance is not a guide to future performance, future returns are not guaranteed, and a loss of original capital may occur.
Fluctuations in exchange rates could have adverse effects on the value or price of, or income derived from, certain investments.
Certain transactions, including those involving futures, options, and other derivatives, give rise to substantial risk and are not suitable for all investors.
Investors should review current options disclosure documents which are available from Goldman Sachs sales representatives or at
http://www.theocc.com/about/publications/character-risks.jsp. Transaction costs may be significant in option strategies calling for multiple purchase
and sales of options such as spreads. Supporting documentation will be supplied upon request.
All research reports are disseminated and available to all clients simultaneously through electronic publication to our internal client websites. Not all
research content is redistributed to our clients or available to third-party aggregators, nor is Goldman Sachs responsible for the redistribution of our
research by third party aggregators. For research, models or other data available on a particular security, please contact your sales representative or
go to http://360.gs.com.
Disclosure information is also available at http://www.gs.com/research/hedge.html or from Research Compliance, 200 West Street, New York, NY
10282.
© 2016 Goldman Sachs.
No part of this material may be (i) copied, photocopied or duplicated in any form by any means or (ii) redistributed without the prior written consent of The Goldman Sachs Group, Inc.