Embed Size (px)
Citation preview

W e l l - g o v e r n e d C i t i e s r e p o r t 2 0 0 9 | 1
Well Governed Cities 2009

| W e l l - g o v e r n e d C i t i e s r e p o r t 2 0 0 92

W e l l - g o v e r n e d C i t i e s r e p o r t 2 0 0 9 | 1
This report is published by South African Cities Network (SACN) Joburg Metro Building16th Floor, 158 Loveday Street, Braamfontein 2017PO Box 32160, Braamfontein 2017Tel: 011 407 6471 Fax: 011 403 5230www.sacities.net
Project Managers: Astrid Wood & Sharon Lewis
ISBN 978-0-9814382-5-2
Editor: Amanda de Lilly, Clarity [email protected]
Designer: Karien van der Westhuizen [email protected]
Photographs (unless otherwise credited): Omar Dresel, Arndt Husar, Anthony Maturin, Thom Khosa, Jonah Agus & Bruce Sutherland
Printed by: Hansa Print, Cape Town
This edition of the Well-governed Cities Report is dedicated to the memory of Godfrey Mudau (1983-2009). Godfrey was an intern with the SACN in 2002/3, and remained a loyal friend to the network when he worked at the City of Johannesburg.
contents
2
4
12
16
24
30
36
40
48
Foreword
State of municipal finances in Southern Africa
Refugee management — the governance response
South African cities unprepared for disaster
Planning for infrastructure investment
Property asset management in cities
City development partnerships
Assessing the impact of the 2010 Fifatm World Cup on the development of South African cities
Acknowledgements and references

| W e l l - g o v e r n e d C i t i e s r e p o r t 2 0 0 92
foreword
A well-governed city is one that takes into account all the issues that impact on city development and the well-being of its citizens. Some of South Africa’s municipalities are plagued with poor governance and service delivery is a huge challenge due to a lack of funding and capacity.
This is the first edition of the Well-governed Cities Annual Report. It is a collection of articles and analysis on issues of governance in South African cities, designed to provoke dialogue and discussion, and inspire cities towards good governance.
SACN’s well-governed city programme develops tools and frameworks for the measurement of city performance. In South Africa, measurement of performance involves key outputs in cities’ Integrated Development Plans (IDP). Through a series of IDP hearings at provincial level, SACN continually reviews the effectiveness of the IDP as a plan-ning tool. Additionally, SACN will continue with its work on the refinement of urban indicators, thereby strengthen-ing the definitions and data sources used to measure city performance.
The SACN secretariat would like to thank those indi-viduals who contributed articles, information, and photo-graphs for this publication. We are grateful for the original articles Refugee management – the governance response, written by Loren Landau, Tara Polzer and Aurelia Wa Kabwe Segatti, and South African cities unprepared for disaster, written by Astrid Wood.
The articles, State of municipal finances in Southern Africa and Planning for infrastructure investment highlight a greater need for capital investment and asset manage-ment to support infrastructure service provision. City improvement districts are playing an increasingly impor-tant role within the context of limited municipal budgets, and we are pleased to profile the work of city develop-ment partnerships in this publication.

W e l l - g o v e r n e d C i t i e s r e p o r t 2 0 0 9 | 3
The last article features a critical SACN project - assessing the impact of the 2010 FIFA World Cup on city development. The article includes details on the indicators that SACN will use to measure the long term impact of the World Cup on South African cities. Please refer to SACN’s website (www.sacities.net) for the full reports.
SACN member cities are poised to play a signifi-cant role in achieving more responsible governance. Improved coordination, communication, and planning is critical to ensure good governance in South Africa’s cities. This will benefit the lives of over seventy per cent of South Africa’s citizens.
Sithole Mbanga, CEO

| W e l l - g o v e r n e d C i t i e s r e p o r t 2 0 0 94
state of municipal finances in Southern AfricaOne of the key strategic challenges facing South African cities today is a lack of capital investment to support infrastructure service provision. This problem is not limited to the cities, nor is it limited to South Africa. Cities in the SADC region also face substantial challenges in financing the infrastructure required to provide services to their residents. While there are strong arguments that national governments should increase the capital and operating grants that they provide to city governments, municipalities should themselves be able to access capital markets to finance their infrastructure requirements.
South African Cities Network (SACN) has launched a project, supported by the Public-Private Infrastructure Advisory Facility (PPIAF), to assess and enhance the abil-ity of cities in the SADC region to access capital mar-kets to finance their infrastructure needs. To facilitate more responsible sub-national government borrowing to finance capital investment in Southern Africa, SACN – with the support of the World Bank Institute (WBI), and the PPIAF – will create a small demand-driven advisory facility that will provide technical assistance to improve the creditworthiness and borrowing capability of these cities.
The general objective of the project is to support the emergence of a sustainable municipal finance market in Southern Africa by promoting effective planning and man-agement of financial activities, better credit ratings, and the ability to access capital for investment purposes from banks or capital markets. This will be achieved by providing knowl-edge, technical assistance and credit advice to sub-national government entities in southern Africa to build their capacity to better manage their financial affairs; facilitate the entry of creditworthy cities and sub-national entities into the regional municipal finance market, and assist other sub-national enti-ties and local governments to achieve creditworthiness.
Gau
trai
n co
nstr
uctio
n at
O.R
. Tam
bo
Inte
rnat
iona
l A
irpor
t, J
ohan
nesb
urg
. Im
age:
ww
w.s
outh
afric
a.to

W e l l - g o v e r n e d C i t i e s r e p o r t 2 0 0 9 | 5
To provide a better understanding of the current state of city finances in the region, SACN commissioned an ana-lytical report that assesses the state of finances, credit-worthiness and borrowing of selected city municipalities in the SADC region. The report contains key findings and provides strategic analysis flowing from these findings. The cities covered in the report are Blantyre and Lilongwe in Malawi; Manzini and Mbabane in Swaziland; Maputo and Nampula in Mozambique; Lusaka, Zambia; Maseru, Lesotho; and Windhoek, Namibia. They were assessed on the following criteria:
financial and credit management•general management•operational performance•strategic planning and internal transformation•human resources and the use of the private sector•customer relations•support from government•governance•external risks•economic base•
Overview of the cities
The cities under examination in the report are a diverse group. They constitute about half of the larger cities in Southern Africa, generally of the southern mainland. They are located in seven separate SADC countries, where national per capita GDP figures range from R5 962 up to eight times higher at R47 370 per annum in 2007. Their municipal populations vary from as little as 60 000 up to about 2.6 million. Four of the ten cities have populations exceeding 1 million, while another two reportedly have populations significantly lower than 100 000.
The municipal governments of these towns and cities spent anything from R31 million up to nearly R1.1 billion in 2007, as per Table 1 below. Per capita expenditure was also variable, but these figures are not wholly reliable as per capita data for Mbabane and Manzini are distorted by unduly low official population data, and the data for Lilongwe is anomalous and incomplete. Several of the cit-ies where estimates are more reliable appeared to spend between R100 and R200 per person per year on municipal services in 2006/7.
Municipalities should themselves be able to access capital markets to finance infrastructure requirements

| W e l l - g o v e r n e d C i t i e s r e p o r t 2 0 0 96
Table 1: Municipal expenditure 2006/7 (R m)
Municipal government Operating expenditure (R m)
Capital expenditure (R m)
Total expenditure (R m)
Total expenditure per capita (R)
Blantyre 44 2 46 48
lilongwe 37 1 38 54
lusaka 121 10 131 101
Manzini 44 18 62 778
Maputo 83 35 118 107
Maseru 29 2 31 135
Mbabane 47 10 58 965
nampula 21 19 40 81
Windhoek (2006) 1 085 199 1 284 4 279
Table 2: Comparison of 2007 operating and capital expenditures (R m)
Nelson Mandela
Bay
Buffalo City
Msunduzi Mangaung Windhoek Polokwane Sol PlaatjeKing
Sabata Dalindyebo
Mafikeng
Opex 4 291 1 626 1 381 1 099 1 085 588 529 275 170
Capex 888 719 146 293 199 150 44 65 50
Lusaka Lephalale Maputo Mbabane Manzini Blantyre Lilongwe Maseru Nampula
Opex 121 109 83 47 44 44 37 29 21
Capex 10 20 35 10 18 2 1 2 19
Source: National Treasury local government database (2008) and project research.
In financial terms it is clear that the South African municipalities spend far more per person. Many of the sample cities appear to operate at a per capita spending level closer to that of Port St Johns than any of the other reference points in Table 3. The only exception to the pattern is Windhoek, which in per capita spending terms would not look out of place among South Africa’s metropolitan city governments.
Windhoek is unique in the sample, as its annual budget is ten times larger than either of the next two cities, namely Lusaka and Maputo, with total annual expenditures of R131 million and R118 million respectively. The next group, which includes Manzini, Mbabane, Lilongwe and Blantyre have budgets from R84 million down to around R50 million. Finally, Nampula and Maseru each spend less than R40 million per year.
It is useful to compare such high-level data with reference points among South African municipalities. While the report does not aim to provide a detailed comparison with South African cities, the following tables provide comparable information for selected South African municipalities. In Table 2, the 2007 expenditures of the SADC sample cities are compared with South African municipalities; and in Table 3 a more detailed comparison is provided, in particular with South Africa’s largest municipalities.

W e l l - g o v e r n e d C i t i e s r e p o r t 2 0 0 9 | 7
Table 3: Comparable data for South African municipalities
Municipality PopulationTotal 2004GVA (R m)
Operating expenditure
(2006/7) (R’000)
Capital expenditure
(2006/7) (R’000)
GVA per person
(R)
Total expenditure
per person (R)
ethekwini 3 244 381 123 146 10 499 839 2 551 414 37 957 4 023
City of Johannesburg 3 083 896 194 334 14 569 015 3 284 392 63 016 5 789
City of Cape town 3 012 370 147 390 9 434 901 1 969 407 48 928 3 786
ekurhuleni 2 431 360 110 250 8 827 058 1 191 132 45 345 4 120
City of tshwane 1 775 583 114 252 8 547 157 2 315 840 64 346 6 118
nelson Mandela 1 122 455 36 168 4 290 642 887 971 32 223 4 614
emfuleni 830 416 16 231 1 766 842 127 367 19 545 2 281
Buffalo City 803 448 15 443 1 625 602 719 216 19 221 2 918
Mangaung 703 203 18 311 1 098 592 292 726 26 040 1 979
Msunduzi 631 121 12 687 1 380 761 145 881 20 102 2 419
Mbombela 523 685 10 337 835 994 335 050 19 739 2 236
polokwane 517 398 7 149 587 923 150 000 13 818 1 426
King sabata dalindyebo 444 310 4 884 275 410 64 844 10 993 766
emalahleni 289 303 18 375 741 763 60 411 63 513 2 773
Mogale City 244 013 8 359 607 604 44 478 34 256 2 672
sol plaatje 235 722 6 751 529 189 43 523 28 639 2 430
Mafikeng 208 441 4 910 170 000 50 000 23 554 1 055
port st Johns 154 342 261 42 145 652 1 693 277
Westonaria 104 072 2 029 138 021 31 189 19 498 1 626
lephalale 93 864 2 535 109 486 20 304 27 007 1 383
Source: National Treasury Local Government Database (2008)

| W e l l - g o v e r n e d C i t i e s r e p o r t 2 0 0 98
Municipal functions
There is perhaps less variety in the functions assigned to municipal authorities for this diverse group of cities. There is of course a spectrum, from Windhoek on the one end with the most comprehensive range of built environment functions, to Maseru on the other end, with an apparently very limited range of functions. Generally speaking, the major expenditure responsibilities of city governments in Southern Africa relate to:
roads and storm-water drainage•refuse collection and disposal•cemeteries, markets, and parks•traffic lights and street lights (but not traffic police)•bus and taxi ranks•
Municipal revenues
The municipalities all levy some form of property tax. Lusaka, Maputo and Nampula also impose a personal levy on working age adults. Service charges are significant only for Windhoek. All the cities except Windhoek receive operating grants in some form. Table 4 indicates the major revenue sources of the municipalities, as reported by the interviewees.
Table 4: Major sources of operating revenues
City Major revenue sources
Blantyre property taxes•government operating grants•Business taxes (license fees, commercial rentals, market fees) •taxes on goods produced, sold or exported•sewer charges•
lilongwe property taxes•government operating grants•Business taxes (market fees, development charges, scrutiny fees for plans, etc)•
lusaka property taxes•government operating grants•Business license fees •personal levy•
Manzini property taxes•government operating grants•refuse removal fees•Abattoir, advertising, market, burial, toilet, inspection and other fees•
Maputo property tax•Business tax (taxi licenses etc)•government operating grants•Waste collection charges•Citizens personal tax•share of vehicle license fees (to be devolved at some stage) •
Maseru property tax•government operating grants (grant in-lieu-of-rates) •refuse collection charges•
Mbabane property taxes•government operating grants•refuse removal fees•Abattoir, market, bus station, burial, toilet, inspection and other fees•
nampula property tax•Business taxes (market fees, licences to build, billboard taxes etc)•government operating grants•Waste collection charges•Citizens personal tax•share of vehicle license fees (to be devolved)•
Windhoek property tax•Water, electricity and refuse service charges•Business registration fees•

W e l l - g o v e r n e d C i t i e s r e p o r t 2 0 0 9 | 9
The financial statements and management information supplied by the various cities indicates the following overall revenue collection data (i.e. including capital funds) for 2007:
Table 5: Municipal revenues 2007 (R m)
City Personal tax Property tax
Business taxes, service
charges & license fees
Operating grants
Capital grants
Other Total
Blantyre 38.5 5.7 1.4 1.7 7.3 54.7
lilongwe 39.8 0.0 1.1 0.7 10.0 51.6
lusaka 4.0 33.9 61.8 4.7 0.0 30.2 134.6
Manzini 0.0 35.4 1.6 4.5 0.0 1.6 43.1
Maputo 2.1 9.3 23.0 21.2 38.5 27.4 121.3
Maseru 8.9 2.1 16.4 17.5 1.6 46.5
Mbabane 36.3 3.1 3.3 11.6 2.3 56.7
nampula 0.1 0.1 3.0 6.9 16.5 10.0 36.6
Windhoek 104.1 710.0 0.0 0.0 99.0 913.1
Municipal infrastructure finance
Most of the cities indicate that capital grants comprise a significant portion of their infrastructure financing. Table 6 indicates that all the cities, except for Windhoek, generally received capital grants for infrastructure finance.
Table 6: Major sources of infrastructure finance
City Major revenue sources
Blantyre government capital grants•government loans•operating revenues•
lilongwe government capital grants•
lusaka government capital grants•donor capital grants•Commercial bank loans•operating revenues•
Manzini government capital grants•donor capital grants (indirectly via government)•Commercial bank loans•
Maputo government capital grants•donor capital grants (indirectly via government)•operating revenues•
Maseru government capital grants•donor capital grants (specific projects only)•Commercial bank loans•operating revenues•
Mbabane government capital grants•donor capital grants (indirectly via government)•Commercial bank loans•
nampula government capital grants•donor capital grants•operating revenues•
Windhoek Commercial bank loans•government/development bank loans•operating revenues (internal funds)•

| W e l l - g o v e r n e d C i t i e s r e p o r t 2 0 0 91 0
It is clear that borrowing is not foreign to these municipalities. In fact only Maseru, Nampula and Maputo hold no long term liabilities at all. Municipal debt in Swaziland and Malawi tends to be higher than in other countries, hovering around 5 per cent. Windhoek’s stock of debt dwarfs the debt held by other municipalities, but it is not high when compared to its annual operating expenditure.
Table 7: Long-term debt 2007 (R m)
Non-current liabilities
Interest and redemption
Debt servicing as % of cash
operating income
Blantyre 6.2 2.2 4.8%
lilongwe 3.8 0.0 0.0%
lusaka 0.8 2.3 1.9%
Manzini 11.1 2.0 2.5%
Maputo 0.0 0.0 0.0%
Maseru 0.0 0.0 0.0%
Mbabane 7.1 2.5 5.3%
nampula 0.0 0.0 0.0%
Windhoek 451.5 21.2 1.9%
Finally, it is worth comparing the accumulated cash reserves of the various municipalities. Table 8 provides the accumulated cash balances at the end of the financial years concerned. Evidently, most municipalities succeed in maintaining positive balances most of the time, although Windhoek’s 2007 figure is a dramatic exception, and Mbabane has been continuously in overdraft for the period in question.
Table 8: Accumulated cash reserves (R m)
2004 2005 2006 2007
Blantyre 3.6 0.9 -0.3 4.7
lilongwe 9.0 11.7 12.9
lusaka 5.1 15.1 18.7 20.4
Maputo 2.5 3.1 6.3
Maseru -1.3 17.7 31.7
Mbabane -6.6 -1.9 -1.8 -2.0
nampula 2.0 3.2 1.1
Windhoek 43.2 38.2 95.1 -102.1
While there is considerable diversity in the financial profiles of the municipalities, the following generalisations do apply:They serve areas with weak economic bases and populations with low average incomes.•Their local tax bases are weak, and also poorly administered, so that local revenue flows are poor. •Central government grants would appear essential to sustain a reasonable level of service delivery, but such support is •not universally provided.They have institutionally weak city administrations that are responsible for a limited range of built environment functions, •and expenditure per resident is exceptionally low.They are subject to substantial government regulation and informal pressure, and cannot be said to exhibit `local auton-•omy’ to any significant degree.Windhoek is an exception to many of these points, with a much better tax base, higher average incomes, and no reliance •upon central government grants.
This overview is an edited extract from a report commissioned by the SACN, entitled State of Finances, Creditworthiness and Borrowing of Municipalities in Southern Africa, written by Hunter van Ryneveld and Afcap Consulting. The draft report can be obtained from the SACN. Please e-mail your request to Sadhna Bhana on [email protected]. i

W e l l - g o v e r n e d C i t i e s r e p o r t 2 0 0 9 | 1 1

| W e l l - g o v e r n e d C i t i e s r e p o r t 2 0 0 91 2
refugee management — the governance responseSouth African cities are transformed by human mobility. As migration is a distinctly spatial process, city planning must be addressed by local authorities in response to local dynamics, resources and aspirations. For example, towns like Musina and Nelspruit are being reshaped by the movements of trans-national traders, refugees, and domestic migrants, while the cities and towns of the Eastern Cape are growing primarily through domestic migration. Other cities are losing their workforce to larger cities elsewhere. Each of these requires a different and pragmatic response.
Overlapping processes of urbanisation, intercity moves, transit migration, and international migration raise the spectre of marginalisation and conflict. If managed properly, they could lead to the creation of dynamic and prosperous urban centres. Despite the important role that migration plays in urban development, municipalities are only beginning to acknowledge these important popula-tion dynamics and to incorporate them into planning exer-cises and participatory forums.
Some of the challenges of planning for mobility are the absence of reliable demographic data, and budgeting processes unsuited for long-term investment in expanding
populations. Despite these obstacles, a number of cities have made significant efforts to improve data collection on population dynamics on mobility, as well as on broader patterns of socio-economic and political marginalisation, land use, and transport. Gauteng has embarked on an ambitious planning exercise – Gauteng 2055 – that con-siders how human mobility may exaggerate or prevent poverty, conflict, and pressure on existing physical and social infrastructure. The exercise has already challenged many planning presumptions by highlighting the degree to which people move through and not only to cities; the relatively small number of international migrants; and the
Soet
wat
er r
efug
ee c
amp
for
vict
ims
of x
enop
hob
ic v
iole
nce,
Wes
tern
Cap
e, 2
008.
Pic
ture
: ww
w.s
tree
tnew
sser
vice
.rog

W e l l - g o v e r n e d C i t i e s r e p o r t 2 0 0 9 | 1 3
acute vulnerabilities domestic migrants face when first arriving in urban areas. The data and the challenges they raise provide a basis for more effective and multi-sectoral planning that can promote municipalities’ economic and physical security.
Understanding a city population is only meaningful if these ideas can be translated into programmes that foster economic, social, and political inclusion. In many instances this has meant making small changes to integrated devel-opment planning processes in order to elicit the participa-tion of citizens and non-South Africans. Some cities have also begun engaging directly with migrant associations or have opened offices explicitly designed to serve the needs of new arrivals – Johannesburg’s migrant help desk is one example of this. Gauteng’s work to develop an ‘integrated shelter’ programme is also valuable in meeting the short-term, emergency housing demands of both international and (primarily) domestic migrants. This kind of unified programming is a positive step, not only in addressing an immediate need but also in treating citizens and non-South Africans equally. The progressive moves made in some cities are an important step, but are far from universal. Certain policies and practices continue to discriminate against new arrivals. Policies that restrict informal trading and police harassment of informal traders effectively shut down some of the only options available for newly urbanised populations.
The Musina municipality attempted to dissuade new arrivals by actively preventing civil society from providing housing assistance to vulnerable Zimbabwean migrants and refugees, and it led to a public health crisis. While Johannesburg is now seeking housing options for refu-gees living in the Central Methodist Church, it too has long dodged the politically tricky issue of assisting for-eigners. It has taken five years and a series of highly public court actions and protests by civil society for change to happen.
The xenophobic violence in 2008 taught municipalities a number of critical lessons. Many city officials realised that they can no longer ignore tensions that develop due to social and political diversity, particularly during an eco-nomic recession. The attacks also illustrate that many of the mechanisms intended to promote security and inte-gration can be equally used for other purposes. It has now been extensively documented that street committees and community policing forums – critical components of
Certain policies and practices continue to discriminate against new arrivals

| W e l l - g o v e r n e d C i t i e s r e p o r t 2 0 0 91 4
successful municipal governance – were hijacked by local authorities and groups and turned against unpopular resi-dents.1 The gangsters, councillors, business owners or oth-ers responsible for organising the attacks have not been held accountable. In Diepsloot, Gugulethu and communi-ties around the country, non-South Africans continue to be attacked and killed. Elsewhere, local leaders and police continue to deflect responsibility for their shortcomings by blaming non-South Africans. Unless such practices are outlawed and conflict resolution mechanisms are put in place to manage these tensions, the threat of violence will become a major stumbling block, preventing municipal authorities from implementing more progressive policies.
The displacement of more than 100 000 people follow-ing the xenophobic attacks illustrated the challenges cities face in managing humanitarian crises in ways that diminish rather than heighten the possibility of future conflict. While local government is legally mandated to manage crises, few municipalities or provinces have the skills, knowledge, or structures to do so. Those that have human capacity, often lack financial resources for a sustained relief and resettlement effort. In Gauteng, the Development Bank of Southern Africa provided much needed support. Cape Town fronted millions of Rand to assist people displaced by the xenophobic attacks, but was not repaid by national - government. Such poor support makes it all the less likely that they will provide emergency services and reintegra-tion programmes for people displaced by violence or natural disasters in the future. In Tshwane, the city refused to accept responsibility for one of the camps due to poor coordination and communication.
Cities can do little to prevent migration and urbanisa-tion as these trends are driven by national economic poli-cies and market vagaries, and it is generally not in their economic interests to do so. Global evidence suggests that investments in poor rural communities do not keep people out of cities. On the contrary, the additional resources and education feeds aspirations that will only be met in urban centres. Municipal authorities should therefore develop progressive and inclusive ways to govern dynamic and mobile urban populations. Domestic and international experiences offer some starting points. The first step is to
develop a better understanding of the composition and aspiration of the existing population. Another step would be to predict who is likely to be arriving in cities in the near and distant future, even if it reveals contradictory and conflicting aspirations. Municipalities must become advo-cates for their whole population, both present and future. This may mean challenging political superiors and becom-ing more actively involved in migration policy-making at national level. Cities should also consider international organisations, NGOs, and neighbouring municipalities as potential allies in planning for human mobility. Closer collaboration with Statistics South Africa and research organisations can help provide the empirical basis to moti-vate for additional funds or resources for a growing and diversifying population.
More immediately, cities can begin investigating the real governance patterns in townships and informal set-tlements, and find ways to eradicate gangsterism and replace exclusive organisations with institutions that can bridge differences and resolve conflicts. Community policing forums, chambers of commerce, or any other bodies that practice exclusion of new arrivals, should be reformed. Cities could consider introducing housing tri-bunals and other ombudsman-like entities that work on behalf of all residents, regardless of origin or legal status. Cities may also benefit from following eThekwini’s lead in issuing trading licenses or other forms of documentation to foreign and local residents. This opens another income stream, and it also means that Metro police can undertake by-law enforcement without their needing to ask for immi-gration documents.
At a minimum, authorities need to build in early warn-ing systems so that conflicts over land or jobs are resolved non-violently. Some of this may be accomplished by incor-porating foreign language speakers or naturalised citizens into government bureaucracy or the police. This may not be politically popular in the short term, but it has worked well in Europe and North America by helping to build trust, improve services, and promote security.
This report was written by Loren Landau, Tara Polzer, and Aurelia Wa Kabwe Segatti for SACN, June 2009.
Municipalities must become advocates for their whole population, both present and future
1. See Pierre Misago, Loren B. Landau, and Tamlyn Monson, ‘Towards Tolerance, Law, and Dignity: Addressing Violence against Foreign Nationals in South Africa.’ Report for the International Organisation of Migration (February 2008). Pretoria: International Organisation of Migration.

W e l l - g o v e r n e d C i t i e s r e p o r t 2 0 0 9 | 1 5
| W e l l - g o v e r n e d C i t i e s r e p o r t 2 0 0 91 6
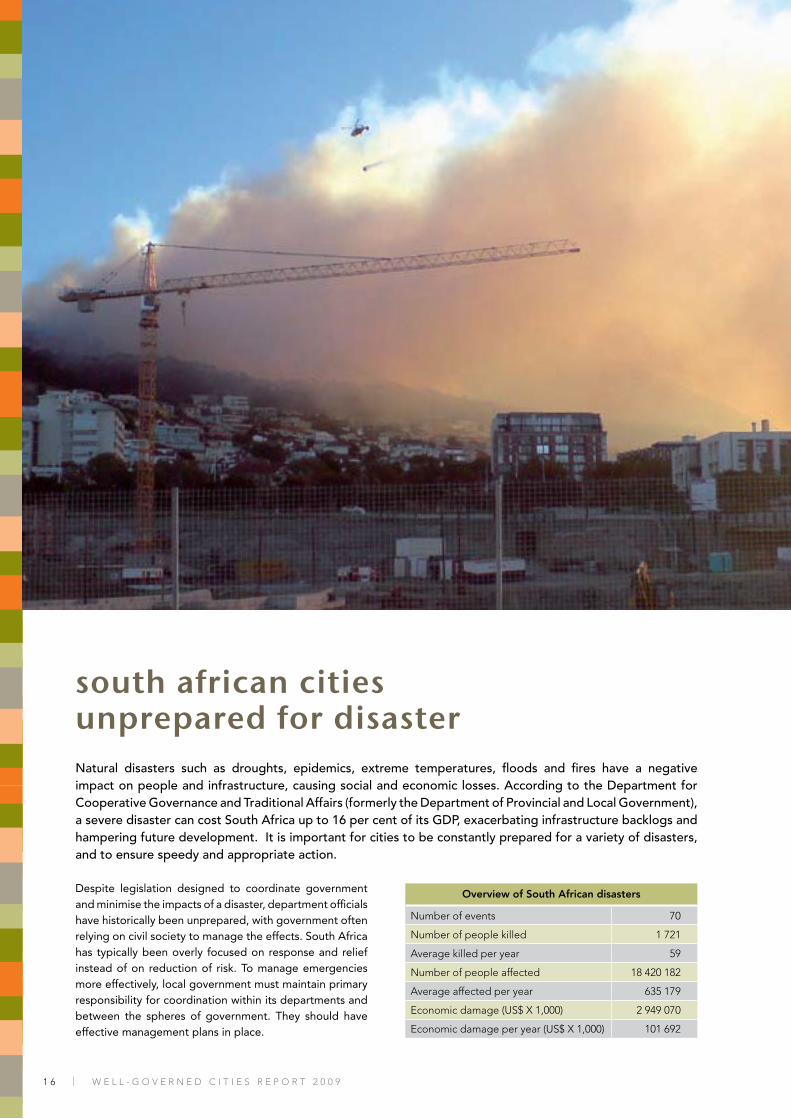
south african cities unprepared for disasterNatural disasters such as droughts, epidemics, extreme temperatures, floods and fires have a negative impact on people and infrastructure, causing social and economic losses. According to the Department for Cooperative Governance and Traditional Affairs (formerly the Department of Provincial and Local Government), a severe disaster can cost South Africa up to 16 per cent of its GDP, exacerbating infrastructure backlogs and hampering future development. It is important for cities to be constantly prepared for a variety of disasters, and to ensure speedy and appropriate action.
Despite legislation designed to coordinate government and minimise the impacts of a disaster, department officials have historically been unprepared, with government often relying on civil society to manage the effects. South Africa has typically been overly focused on response and relief instead of on reduction of risk. To manage emergencies more effectively, local government must maintain primary responsibility for coordination within its departments and between the spheres of government. They should have effective management plans in place.
Overview of South African disasters
number of events 70
number of people killed 1 721
Average killed per year 59
number of people affected 18 420 182
Average affected per year 635 179
economic damage (Us$ X 1,000) 2 949 070
economic damage per year (Us$ X 1,000) 101 692

W e l l - g o v e r n e d C i t i e s r e p o r t 2 0 0 9 | 1 7
Average disaster per year
drought 0.24
earthquake 0.21
epidemic 0.21
extreme temp 0.07
Flood 0.79
insect infestation n/A
Mass mov. dry n/A
Mass mov. wet 0.03
volcano n/A
storm 0.59
Wildfire 0.28
Disaster management legislation
The aim of the Disaster Management Act (2002) was to provide an integrated disaster management policy that focuses on preventing or reducing the risk of disasters, mitigating the severity of disasters, emergency prepar-edness, rapid and effective response to disasters and post-disaster recovery, and the establishment of national, provincial and municipal disaster management centres. The legislation put forward a holistic disaster manage-ment system featuring the Expand-Contract Model, in which disaster management is seen as a continuous proc-ess. The model identified four sets of actions to be taken simultaneously and constantly:
Prevention and Mitigation 1. Preparedness 2. Relief and Response 3. Recovery and Rehabilitation.4.
In this model, activities in one category can expand while efforts in another can contract.1 This legislation marks a “paradigm shift from the old order of a reactive approach in dealing with disasters in South Africa to a proactive dis-aster management system.”2
Poverty – the greatest contributor to disasters
Although disasters are indiscriminate, the ability of an individual to manage a disaster is strongly linked to their vulnerability. The NDMC cites poverty as the greatest contributor to dis-asters in urban and rural areas. “In city areas, other causes of disasters may include rapid growth and inadequate planning, population density, ecological imbalances, and inappropri-ate construction. Informal settlement areas are thus particularly vulnerable to disaster events. In rural areas, the causes of disasters may be associated with poor land use management, erosion, deforestation, lack of employment and development.” People who live in precari-ous sites such as steep hillsides or flood prone areas are especially vulnerable during periods of intense rainfall. More vulnerable communities face greater physical, economic, and emotional impacts of a disaster, and municipalities should therefore identify the key vulnerable areas of the city, and ensure that those communities are properly prepared for a disaster.
1. South Africa. (2002). Disaster Management Act. Pretoria.2. Botha (2003)

| W e l l - g o v e r n e d C i t i e s r e p o r t 2 0 0 91 8
©Pa
ul B
otes
/Mai
l & G
uard
ian

W e l l - g o v e r n e d C i t i e s r e p o r t 2 0 0 9 | 1 9
The National Disaster Management Centre (NDMC) was established to provide information and awareness, and to coordinate and support comprehensive, integrated dis-aster management, with special emphasis on prevention and mitigation. The NDMC is responsible for coordinating the establishment of local disaster management centres, to promote prevention as a key risk management strategy, and to coordinate regional cooperation.3
Effective disaster management includes administrative decisions and operational activities that cover prevention, preparedness, response, recovery and rehabilitation. All levels of government, especially local government, as well as non-governmental organisations and community-based organisations must play a vital role in these actions. The NDMC recommends the following actions be taken simul-taneously:
Development must be well-planned, including control-•ling growth, so that residences are well-built and not located in flood-prone areasConduct risk assessment of vulnerable areas•Organise a strategy to manage disasters•Delegate responsibilities amongst agencies to ensure •that appropriate and timely action is taken during an emergencyTrain personnel and volunteers•Check emergency management equipment.•
According to the Expand-Contract Model, when a disas-ter occurs, ‘normal’ activities are expanded to deal with the emergency. After the event these activities contract, but never cease, so that agencies are always prepared for future disasters.
Despite the principles outlined in the Disaster Manage-ment Act, and despite the frequency of disasters, South Africa is usually unprepared. Disasters are often managed in a crisis management way, and government action is typ-ically reactive and uncoordinated. Disaster management tends to focus on emergency response instead of disaster mitigation. Dr. Krisno Nimpuno, Head of the Office of Dis-aster Preparedness in Africa based at Wits University, says that the emergency response has no time perspective. Officials react to the immediacy of the situation by simply
3. National Disaster Management Centre. (2002). Disaster Management Guidelines for Municipalities. South Africa.
Disaster management tends to focus on emergency response instead of disaster mitigation
Municipal failures exacerbate xenophobic violence
South Africa was embarrassingly unprepared for the xenophobic violence that began on 22 May 2008 in Johannesburg. Government was disorganised and therefore unable to provide an adequate response. In this instance, civil society acted, providing food, blankets, sanitation and safety to the thousands of displaced refugees.
In his article, Shattered Myths: The Xeno-phobic Violence in South Africa, Nathan Geffen describes how government failed to respond appropriately to the xenophobic violence:
“For the first few days, there was hardly any response by the provincial and national govern-ment …
… An enormous, urgent, and co-operative civil society effort ensured that thousands of people, who have turned Cape Town into a fledgling cosmopolitan city, were reasonably fed and warm after the worst pogrom in our coun-try’s post-freedom history …
… [Various civil society agency offices] were nearly instantly converted from an activist centre into a disaster relief one …
…None of us had experience in what had to be done. Dozens of people were doing hundreds of tasks, some answered the endlessly ringing phones and recorded details of new refugee centers springing up all over the city, some put out calls anywhere and everywhere to get food, blankets, and other donations delivered to our offices, others raised money. I have a vague rec-ollection of barking orders, shouting, ranting, and losing my temper non-stop for 19 hours. Despite the mess, we managed to fulfill nearly every critical demand that came our way. The city’s Disaster Management provided a little help but was clearly not prepared for such a disaster …” (Geffen, 2008)

| W e l l - g o v e r n e d C i t i e s r e p o r t 2 0 0 92 0
pouring water on the fire without considering prevention and mitigation strategies. Emergency response officials are trained to immediate reaction instead of risk abatement, and they take shortcuts that often exacerbate the disaster. Dr. Nimpuno also says that there is often total confusion because nobody knows what the legislation says or what they should be doing.4 All too often, it is the disaster itself that highlights the lack of information on resources and actions. For example, the need for a database in drought periods when government is unable to identify and target those in need of relief, especially in rural and informal areas. The disaster usually also highlights the need to maintain basic infrastructure such as water supply systems, but only after it is too late to mitigate the crisis. Without a coordinated early-warning system, it is difficult to ensure a timely, responsible response.
Disaster management failures at the 2009 FIFA Confederations Cup
Nowhere were the failings of South Africa’s ability to respond effectively to emergencies more apparent than at the 2009 FIFA Confederations Cup (FCC). A debrief-ing workshop was held recently to reflect on the lessons learned during the 2009 FCC tournament and to develop an inclusive action plan for the 2010 FIFA World Cup (FWC). National, provincial, and local disaster management cen-tres and agencies present at the workshop admitted that they are unprepared for 2010.5 .
Ineffective communication and planning was high-
4. Niumpuno, D. K. (2009). Head of the Office of Disaster Preparedness in Africa at Wits University. (A. Wood, Interviewer)5. National Disaster Management Centre. (2009).

W e l l - g o v e r n e d C i t i e s r e p o r t 2 0 0 9 | 2 1
Chaos upon departure at Ellis Park
The game had just ended. Egypt beat Italy 2-0 at Ellis Park. Fans were excited at the outcome. As we pushed and were pushed to exit the stadium, I began to worry how we would ever find the shuttle back to the Wits Campus. It was so hectic inside the stadium; I could not have imagined the chaos outside the venue.
It was complete pandemonium outside the stadium. Everyone was confused and tired, and wanted to go home. There was nobody to direct the 50,000 spectators who had almost all come by shuttle bus from the various Park-and-Ride sites around Johannesburg. We were pushed by fellow fans to walk around the stadium. We were hopeful until we reached the place where we originally exited. In the meantime, minibus taxis were driving past us empty. As time passed, peo-ple began to get annoyed with the empty mini-bus taxis and started demanding to be let into the vacant vehicles. There were no metro police or stadium volunteers to direct us to the appro-priate place to wait for minibuses and buses. It was madness around the stadium.
The crowd was frustrated and became violent. People started jumping on the bonnets of the taxis and forcing windows open. People were screaming and pushing; there was not enough space to stand on the sidewalk and the streets were packed with spectators. Minibus driv-ers tried to drive through the crowd but were blocked by angry crowds. Frightened, some drivers opened the doors, only to be bombarded with too many passengers and forced to push people out in order to close the door. There were so many people on one bus that it physi-cally could not move. The crowd was scared; the drivers were scared, and nobody knew what to do. Where were metro police? Where were the event organisers?
After almost two hours of anarchy, we crammed into a bus like sardines in a can and after a fairly painful ride, arrived back at the Wits Campus. The 2010 Organising Committee had promised that everything would run smoothly and Johannesburg Metro had assured spectators that safe, reliable transport would be provided. But without proper crowd control, it was chaos. It was nearly a disaster. My friend asked me if I would like to come to the finals with him. I said, “After that experience, no way! I’m never going to another game!”
Astrid Wood
lighted as one of the critical failures of disaster manage-ment at the 2009 FCC. Fragmentation between the various departments made it difficult for those on the ground level to communicate effectively with local government. Agencies did not properly brief and debrief security offi-cials and likewise, top officials did not share information before, during, or after the FCC tournament.
Overall, the event was not properly planned. For exam-ple, the Organising Committee (OC) had not set aside enough rooms for the international teams, so players were staying on the same floor as regular hotel guests without adequate security guarding their rooms. There were “problems with private security at drop-off and pick-up points” as well as “VIPs attending parallel events” without informing the South African Police Service (SAPS).
A lack of human and material resources also presented major challenges. Jurisdictional disputes and lack of coop-eration between agencies and spheres of government led to considerable problems. For example, disputes between the SAPS and the Fire Department resulted in several security breaches, such as spectators entering the sta-dium without being searched, and red-flagged individuals being hired as volunteers at the stadium. These disputes are exacerbated during an emergency and limit the effec-tiveness of the response.
General problems with security were also discussed at the workshop. Security personnel were cited as “not reli-able”, leaving their post or sleeping on duty; some were not conversant in English; and they were poorly trained and supervised.
While more than a quarter of the country’s entire police strength was based at the event, incidents of crime increased in vulnerable areas. (It must be noted that no strategies to mitigate such a crime spree during the 2010 FWC were discussed at the workshop.)
One of the critical challenges with hosting a mega event is managing the crowds after the match. Near chaos ensued after several matches in the 2009 FCC. No strat-egies were put forward for how to alleviate congested passages in the stadium or to ensure rapid and safe distri-bution of spectators after the games.
Given the repeatedly poor performance of the dis-aster management units throughout the country, how should South Africa prepare for the 2010 FIFA World Cup? Problems with communication, planning, funding, capacity, jurisdiction and cooperation must be resolved immediately. Communication and planning problems can be resolved by procuring the necessary capital to ensure adequate security and emergency training. In terms of limited capacity, it can be possible to do more with less. Effective disaster management requires the effective
| W e l l - g o v e r n e d C i t i e s r e p o r t 2 0 0 92 2
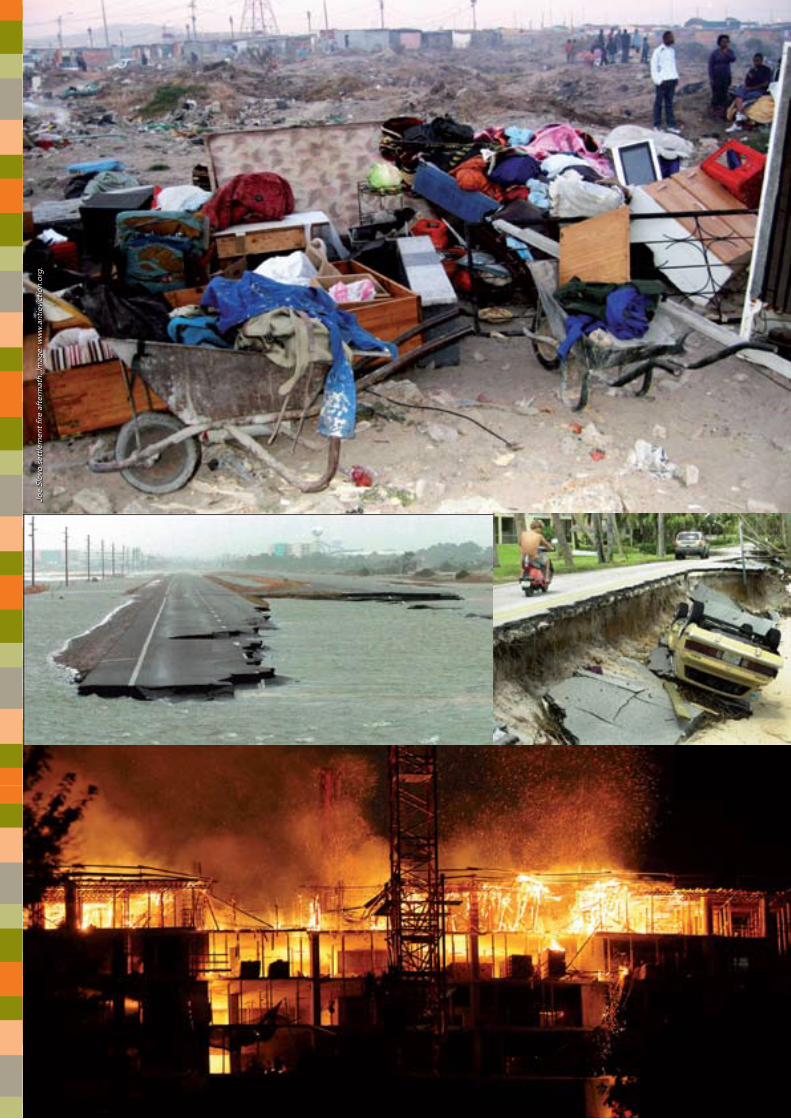
Joe
Slov
o se
ttle
men
t fir
e af
term
ath.
Imag
e: w
ww
.ant
ievi
ctio
n.or
g.

W e l l - g o v e r n e d C i t i e s r e p o r t 2 0 0 9 | 2 3
allocation of human and financial resources, and does not necessarily require a large budget.
Disaster management can be successful if jurisdiction and coordination are properly managed. Jurisdiction problems will most certainly obstruct management during the 2010 FIFA World Cup. To remedy this, responsibility for appropriate disaster mitigation should sit with the local disaster management centre. The National Disas-ter Management Centre (NDMC) is currently the agency responsible for managing emergency procedures, send-ing directives to the provincial agency, and finally to the local centre. This chain of command should be reversed since emergencies begin at the local level and escalate to national. Disaster management activities must be man-aged by a disaster manager who is trained to provide instructions to mitigate a crisis. The SAPS and Fire Depart-ment are not the appropriate agents to manage the situa-tion, and such inefficiencies exacerbate disasters.
Not all disasters have to be tragedies
South Africa is overly focused on response and relief instead of risk reduction. Although it is impossible to pre-vent disasters, municipalities can take certain precautions to prevent the outbreak of a disaster.
Local government must be the primary agency respon-sible for supervising disaster management strategies. It must be responsible for activating crisis procedures and providing immediate emergency response, as well as miti-gating the disaster and reducing vulnerability.
Government needs to differentiate between emer-gency response and mitigation. Emergency response is action taken at the event in reaction to an urgent situa-tion. These actions include preventing an escalation of the emergency, saving lives, fulfilling critical needs for food, shelter and medical care, protecting infrastructure, and assisting with subsequent recovery efforts. By contrast, mitigation involves risk reduction, which include struc-tural and institutional policies to reduce vulnerability. Risk reduction initiatives include proper management of veld fires to minimise the destruction of property through controlled-burning programmes; building effective water management systems that control floods; and restricting housing developments in flood-prone areas or too close to the coast. Mitigating the impact of a disaster is critical to effective disaster management.
Disaster management must be managed by a single
agency at local government level to ensure an appropri-ate response. Officials must be trained to manage crisis situations and to properly anticipate and avoid disasters. Emergency personnel are therefore not the best disaster management agents. An effective disaster manager is able to anticipate disasters, reduce vulnerability, mitigate emergencies, develop an effective emergency response, and be held responsible for their staff. The NDMC believes that a well-managed team of local government players should be prepared. ..“If the situation is man-aged as a crisis, people rush off in all directions, waste valuable time, and make serious mistakes as a result of their actions.”6 Effective disaster management involves both emergency response and mitigation in order to anticipate, manage, and assuage a potential disaster.
Disaster management is a daily process. The Expand-Contract Model whereby local governments conduct disaster management efforts within their daily activities, and then expand those actions when necessary, is the best way to prevent a disaster.
Community involvement is critical for effective disas-ter management. Local knowledge is essential in difficult situations. The disaster management department will need help to effectively address the crisis and reduce vulnerability. These departments are often understaffed and undertrained, relying on police and fire personnel to provide support during crisis. Limited capacity constrains the effectiveness of life-saving programmes such as food distribution and shelter construction. During the xeno-phobic violence in 2008, disaster management centres were immediately overwhelmed, and municipal disaster management departments were unable to disseminate additional personnel or resources. Community mobilisa-tion was needed to distribute critical resources. Working together with the community is crucial.
Although disasters cannot always be avoided, gov-ernment can take steps to minimise the impacts of an emergency. Dr Nimpuno says, “To survive, we need to be proactive rather than reactive. We know that South Africa is vulnerable to tsunamis and cyclones, but the government has no plan in place to advise on how the country should be protected. We also know that South Africa is susceptible to floods, droughts, landslides, population displacements and technological disasters. The key question is whether we are in denial that this will not ever happen to us or whether we are prepared to deal with it?”7
This article was written by Astrid Wood, Programmes Manager at the SACN.
6. National Disaster Management Centre (2002).7. Hassim, S. (2008). South Africa’s Vulnerability to Disasters. Wits Arena.

| W e l l - g o v e r n e d C i t i e s r e p o r t 2 0 0 92 4
planning for infrastructure investmentGovernment has committed itself to ensuring that all backlogs in the provision of infrastructure are removed by 2014 at the latest. This is to be done in a way that ensures municipalities, which are at the forefront of infrastructure delivery, remain financially viable and have the capacity to operate and maintain the infrastructure. The Department of Cooperative Governance and Traditional Affairs (DCGTA) and the Development Bank of Southern Africa (DBSA) have taken the lead in developing the Municipal Infrastructure Investment Framework (MIIF).
The MIIF aims to establish:The extent of infrastructure to be provided. •The capital expenditure required to provide this infra-•structure.The extent to which financing is available for this capital •expenditure. The operating expenditure required to ensure that the •infrastructure provided is properly operated and main-tained.
The extent to which revenue can be raised to cover •this operating expenditure, within the provisions of the Municipal Fiscal Framework.
The MIIF also considers the monitoring systems required to assess progress on infrastructure delivery, as well as proc-esses to ensure that systems and management capacity are in place to manage the infrastructure, with emphasis on a municipal infrastructure asset management strategy.

W e l l - g o v e r n e d C i t i e s r e p o r t 2 0 0 9 | 2 5
It is intended to serve all of government: national government departments responsible for infrastructure-intensive sectors that align with local government func-tions, National Treasury, provincial departments of local government, and municipalities themselves, including the South African Local Government Association (SALGA).
The MIIF is also of significance to the private sector, which has an interest in providing infrastructure through partnerships with local government. Private-sector capital finance is central to the success of the national municipal infrastructure programme.
The MIIF has been developed progressively since 1994. The rapidly changing municipal environment, the availabil-ity of improved information, and new government objec-tives has necessitated regular updates to the MIIF. In 2007, the fifth update of the MIIF (MIIF 5) produced a full analysis of national infrastructure investment requirements. A sixth update (MIIF 6) was completed in early 2009, with a focus on rolling out infrastructure investment planning tools to municipalities themselves. The municipal environment will continue to evolve and the MIIF will therefore continue to be updated on a regular basis.
Key features of the MIIF
The MIIF focuses on a long-term capital expenditure enve-lope for infrastructure delivery, and it therefore considers the total investment required over a period of ten years. It is currently in the first stage of infrastructure invest-ment planning. Once the long term envelope has been established, master planning will be carried out for indi-vidual services, to determine more accurately the techni-cal specifications for infrastructure, as well as the timing of investment. Individual projects will then be identified within these master plans. The overall capital expenditure envelope provides a guide to the approximate level of capital expenditure that can be sustainably incurred in each year, taking available capital financing and operating expenditure implications into account.
Although the MIIF is a municipal framework it does not only consider expenditure incurred by municipalities. For a particular municipal area, it includes expenditure incurred by local and district municipalities, as well as by non-municipal service providers. Most notable among the
Private-sector capital finance is central to the success of the national municipal infrastructure programme

| W e l l - g o v e r n e d C i t i e s r e p o r t 2 0 0 92 6

W e l l - g o v e r n e d C i t i e s r e p o r t 2 0 0 9 | 2 7
latter is Eskom, which has a significant role in delivering electricity distribution infrastructure in rural areas, and water boards. It also considers private agents such as farmers who provide infrastructure services.
The framework also takes the wide variety of circum-stances in municipalities into account. South African municipalities vary from large cities to small rural munici-palities. In the MIIF analysis, municipalities are divided into sub-categories, characterised largely by their urban form, and analysis is conducted per sub-category.
The sub-categories used for local municipalities are as follows:
A: metros (six in total)•B1: secondary cities (21 in total)•B2: municipalities with a large town as core (29 in total)•B3: municipalities with relatively small population, a sig-•nificant proportion of which is urban, but with no large town as core (111 in total)B4: municipalities which are mainly rural with, at most, •one or two small towns in their area (70 in total).
The six metros are all members of South African Cities Network (SACN; the other three members of SACN fall into category B1 at present.
MIIF 5 findings
MIIF 5 focused on the 2007/08 financial year and was the last round of MIIF that produced a full analysis of national infrastructure investment requirements. Its key findings are summarised below.
Capital accountNationally, capital expenditure in the region of R473 billion is required over the next ten years to eliminate backlogs, provide for growth, and provide for the rehabilitation of infrastructure.
The curve above has a ‘humped’ shape because it is assumed that expenditures will be increased in order to meet backlog eradication targets, and will then decline. If expenditure is instead incurred steadily, the model-ling implies annual expenditures of about R47 billion per
annum over the next ten years. When compared to the combined municipal and parastatal budget of R34 bil-lion in 2006/07, this indicates that a significant step up in capital expenditure is required from current budgeted expenditures.
The bulk of this capital expenditure is in the cities - the six metropolitan municipalities alone account for about 40 per cent of this capital expenditure, with the twenty-one secondary cities making up a further 20 per cent.
MIIF 4, conducted in 2004/05, predicted that capital expenditure in the region of R28 billion would be required in 2007/8. This was significantly less than the R47 bil-lion per annum suggested by MIIF 5. This is mainly due to the fact that input costs to the construction industry have increased by more than 30 per cent in real terms. In addition, there has been much greater profit-taking by contractors, which could account for as much as a further 20 per cent real increase. The increases in infrastructure grants have been significantly lower than the increases in costs, and as a result there is an increasing inability to meet infrastructure targets.
The MIIF 5 analysis found that capital grants and sub-sidies will be sufficient to meet only 30 per cent of the capital expenditure requirements over the next ten years.
Some funding will be available from service providers (Eskom and water boards) and municipalities do have reserves (internal funds) available for financing capital expenditure. However, about 50 per cent of the required capital expenditure will have to be funded out of borrow-ing. The consequence of this high level of borrowing will be a steady increase in interest payments as a share of operating revenue. This measure will reach 10 per cent by 2014, which is not considered viable.
On the capital account, MIIF 5 drew three key conclu-sions.
Backlog eradication targets can only be met if more •moderate service levels are provided. The scenario presented above assumes the provision of a mix of serv-ice levels which are considered close to those that are currently being provided by municipalities. A second scenario assumes lower service level provision. Under this second scenario total capital expenditure required over ten years is R339 billion, 28 per cent lower than that required under the mixed service level scenario.
The framework takes the wide variety of circumstances in municipalities into account

| W e l l - g o v e r n e d C i t i e s r e p o r t 2 0 0 92 8
Forty-two per cent of required capital expenditure can be met out of capital grants and subsidies and therefore less reliance on borrowing. Interest payments as a share of operating revenue reach only 6.4 per cent; this is con-sidered to be a more manageable figure. There has to be a rapid increase in infrastructure grants •to economically weak municipalities. MIIF 5 found that increases in levels of the Municipal Infrastructure Grant (MIG) have not kept pace with capital cost increases over the past three years. If the MIG is to have a sub-stantial impact on infrastructure delivery it will need to increase rapidly over future years. In addition, the MIIF 5 modelling assumed that housing subsidies were avail-able for the financing of internal infrastructure costs associated with housing developments. If this is not the case in future, MIG allocations will need to increase to fill this gap.Finally, a step change is required in willingness to bor-•row (and to lend). Even if municipalities start to provide lower service levels and if infrastructure grants increase rapidly, a large proportion of the capital expenditure that must be incurred over the next ten years will have to be funded out of borrowing. Some municipalities have no capacity to borrow. However, many municipalities, particularly cities, do have some borrowing capacity and they should be encouraged to take advantage of this. Increasing willingness to borrow by municipalities is only half of the picture. This must be met by an increased willingness to lend by lending institutions.
Operating accountAs on previous rounds of the MIIF, it was found that the operating account differs significantly for different cat-egories of municipality. Largely urban municipalities, such as metropolitan municipalities, and secondary cities are currently able to operate in a financially sustainable man-ner, and are likely to continue to do so in future. This will depend to some extent on whether the recent trend of rapid increases in equitable share allocations continues into the future.
The provision of high levels of service has significant implications for operational costs, as higher levels of serv-ice typically cost far more to operate and maintain. The modelling found that provision of high levels of service will place increasing pressure on the operating accounts of municipalities, including cities, over the next ten years. The concern is that, since municipalities must present

W e l l - g o v e r n e d C i t i e s r e p o r t 2 0 0 9 | 2 9
balanced budgets, maintenance expenditure will be cut back in order to accommodate rising operating costs, which will have negative implications in terms of deterio-ration and ultimately breakdown of infrastructure assets.
MIIF 6
MIIF 6 included an update of the national scale assessment of capital investment requirements, and their implications for capital financing and for the operating account. How-ever, the emphasis of this round was on rolling out support for infrastructure investment planning to municipalities. This included:
Conducting case studies of 18 municipalities to dem-•onstrate the techniques for undertaking the analysis required for infrastructure investment planning.The development of training materials, including train-•ing on the use of the financial model.Piloting the training for municipalities in five districts •and for a grouping of cities. The latter training session was conducted under the auspices of SACN.
Way forward
The DCGTA and the DBSA have now recognised the importance of moving the MIIF into a large scale initia-tive to support municipalities. Conceptualised as MIIF 7, it will be aimed at getting all municipalities to apply infrastructure investment planning techniques to improve their understanding of their capital requirements; how to finance these and how to ensure that the municipality remains viable as infrastructure provision is expanded. This is closely associated with the Comprehensive Infrastruc-ture Programme (CIP) currently being rolled out by the DCGTA. There is not yet full agreement on the approach to be applied for MIIF 7 but the intention is that the infra-structure investment planning concept and a model should be set up for every municipality in the country. It is likely that a consulting team will be appointed to run training courses and support municipalities with the modelling.
This overview of the MIIF was prepared for the SACN by Kim Walsh of PDG (2009).

| W e l l - g o v e r n e d C i t i e s r e p o r t 2 0 0 93 0
property asset management in citiesMunicipalities typically own or control substantial amounts of real estate such as public buildings, clinics, housing etc. Although municipal governments generally attend to the day-to-day operational needs of their real estate holdings, few think of their holdings as a ‘portfolio’ that can be modified to better serve public and economic purposes. SACN’s member cities identified property asset management as a priority learning topic in 2009. SACN intends to promote shared learning on how to balance municipal service delivery objectives against compliance with the asset management prescriptions in the Municipal Finance Management Act (2003).
Internationally, over the last twenty to twenty-five years, there has been a shift towards the increased recognition of public real estate as a productive asset, and the adop-tion of private sector practices (specifically property asset management) within many governments.
In South Africa, there is currently a very limited focus on property asset management. Although the introduc-tion of the Local Government Municipal Property Rates Act (2004) has to some extent compelled municipalities to introduce more comprehensive property management systems, the current focus appears to be on the creation of property valuation rolls rather than the development of strategic property asset management approaches.
It is widely recognised that property can be a vehicle for managed capital appreciation, particularly when gov-ernments themselves are the primary source of allocating development rights and construction of public infrastruc-ture, such as:
When government opens up new lands by building •roads, providing infrastructure services, or reallocating public offices, they create incremental land values. When government owns the land in question, a sound •infrastructure investment strategy coupled with changes in the land use designation, can capture large portions of the costs of capital investment for the land value appreciation and subsequent land sales.

W e l l - g o v e r n e d C i t i e s r e p o r t 2 0 0 9 | 3 1
Significant income or cost-savings can be obtained from public sector assets by changing management practices. Reforming property asset management approaches is therefore a necessity. The debate on property asset man-agement must also consider the strategic and practical issues involved in establishing and managing a property asset register; and take into account different property asset classes and the key trade-offs that must be con-sidered (for instance between social and economic and financial returns).
Legislative and regulatory considerations
Although the MFMA, the Municipal Asset Transfer Regu-lations (MATR, 2008), and the Property Rates Act (2004) all refer to components of property management, there is currently no specific legislation regulating property management as a whole. The existing legislation is pri-marily aimed at ensuring uniformity, transparency, fairness and good financial management. Its ability to introduce property asset management is limited. It does however introduce the concepts of different social, financial and economic values. It also allows for processes to be deter-mined largely by the municipality, based on the required procedures outlined in the MFMA and MATR.
In most cases the ability to begin managing properties as part of an asset base will be limited to the requirements as stipulated in the legislation. It is therefore critical to begin defining asset management as a form of property management in policy terms, as opposed to legislation.
Developing a property asset management approach
Public property management has historically been a com-bination of maintaining properties used for core services and disposing of surplus properties, as either a public-sec-
There is currently no specific legislation regulating property management as a whole

| W e l l - g o v e r n e d C i t i e s r e p o r t 2 0 0 93 2
W e l l - g o v e r n e d C i t i e s r e p o r t 2 0 0 9 | 3 3
tor service, or as part of social development. Property has also been used to address housing needs. It has not been viewed as an asset that can be used to leverage develop-ment, raise finance or address poverty. As such, property transactions have been limited to adhering to procedures and systems.
Municipalities usually locate property management within their legal or planning departments; the awarding and granting of rights is seen as a legal process. In the past, most of these departments operated with delegated authorities in respect of low value properties, and certain property rights such as servitudes. The introduction of the MFMA has introduced stricter and uniform procedural requirements in respect of land types and transactions. The MATR has also introduced numerous considerations that do allow for a more strategic viewing of the property portfolio.
Towards an asset orientated vision
Public property portfolios are only one part of the overall function, role and responsibilities of municipalities. As such there will always be a limitation on how to manage public portfolios, specifically in relation to asset manage-ment. These portfolios cannot be viewed outside of serv-ice delivery objectives. However, there are two important aspects that allow for a shift in perspective.
The first is the perspective that service delivery needs to be sustainable and viable. This has led to a review of revenue collection, and the viability of each service deliv-ery in relation to the specific revenue collected for that service. This has been largely in the metropolitan areas, but signifies an important perspective on the business of each service. The second is the recognition of asset value and the importance of retaining this value. Both have arisen through the MFMA and Municipal Systems Act - in part a response to the financial crisis in munici-palities.
Viewing public property as an asset, and translating this into effective asset management are two different things. Public properties require valuation and need to be considered as part of the overall assets held by a
council. Retaining this value is important as it differs from most other assets that depreciate in value.
Asset management requires a substantial shift in perspec-tive and operations. The restrictive procedures required for property transactions means that decision-making on where and how to derive revenues and returns will be less efficient than in commercial asset management businesses. Holding costs or opportunity costs are not clearly defined in public financial accounting systems and are therefore not factors in asset management. However, this has a real bearing when the current financial status of most municipalities has been severely weakened by losses of national grants and revenue sources, and a reduction in growth (and therefore rates revenues). Revenues from alternative sources would provide a useful form of security.
An ‘asset orientated vision’ is dependent on the abil-ity of municipalities to operate strategically. Such an approach would allow for each portion of the portfolio to be evaluated and used to achieve the required objectives of the council.
Public properties are important as levers towards social and economic goals and objectives. Determining the value of social and economic returns, referred to in the MATR, is an important part of public property asset management. The categorisation of property assets should include:
Core service provision: The property management for •these have to be efficient and effective, allowing for improved service delivery and an increase in the `value’ of the service. Commercial assets: These are primarily non-core prop-•erties (although there are instances where core proper-ties can be used for commercial purposes). The prime aim of this asset is to provide financial returns to the municipality.Economic assets: This refers to property being used •to lever economic returns (job creation, private invest-ment, economic opportunities and activity). Although the actual financial return on the property can be com-promised it should be against the achievement of eco-nomic indicators.Social assets: It is important to determine the social •returns as these functions are usually conducted by a third party and the effects are often a subjective matter. Indicators to determine value should include the use of facilities, the number of beneficiaries, and alignment to the municipality’s social priorities.
Public properties are important as levers towards social and economic goals and objectives

| W e l l - g o v e r n e d C i t i e s r e p o r t 2 0 0 93 4
Establishing and managing a property asset registerEstablishing a property register is the most important aspect of developing an asset management approach. Several inputs are required to constitute a property asset register:
A list of all existing municipality-owned properties. •These will include property registers, properties trans-ferred with the establishment of a single municipality, a valuations roll to identify all council properties, and the Deeds Register.Verification process: This involves the verification of •each property registered with the valuation roll and the Deeds Register. This is a complex process which requires dedicated data capture processes. Property register maintenance: Once established, •the property register has to be maintained and regu-larly updated. This function needs to have dedicated capacity.
Creating a valuable portfolio requires a strategic approach and an understanding of the significance of property in generating financial, economic and social values. The starting point is establishing the financial
value of the portfolio and requires a direct link to the valuations roll. The next step is to establish potential or future value. This is far more complex and will require dedicated capacity and resources. It may need to be driven through a multi-disciplinary task team. The proc-ess will involve:
Mapping the portfolio onto the GIS.•Identifying property portions that are above a defined •size (e.g. 10ha).Superimposing the Spatial Development Framework, •Regional Spatial Frameworks and Precinct Plans onto the mapped GIS.Reviewing each property portion in relation to the •spatial frameworks and policies, and identifying the most appropriate land uses for each of the significant property portions.Establishing the potential value in relation to social, •economic or financial outputs.
A property asset register is a tool for municipalities to identify portions of property that can be converted to assets. In many instances, property management involves receiving applications from the public to lease or purchase properties. A management system is needed to receive the applications, to review them against a set procedure and policy, and to determine
Dur
ban
Tow
n H
all.
Imag
e: w
ww
.flic
kr.c
om/p
hoto
s/m
iste
r-e

W e l l - g o v e r n e d C i t i e s r e p o r t 2 0 0 9 | 3 5
the release- mechanism. The opportunities for adding value to the portfolio is located in this process, and the management system needs to be able to identify these opportunities.
A property asset management policy is critical to providing an overall framework that can be applied to property management, and can assist in defining the most appropriate uses and mechanisms for property development and management. It also provides the link between the strategic assessment of property value and property management. A policy should include properties for sale and for lease, forms of lease most appropriate for social, economic or financial returns, and applicability of land availability agreements.
There are diverse approaches to managing public property, but the following core set of features have been identified as an integral part of any efficient and accountable government asset management system:
Classification of property based on functional pur-•poses and financial goals, and specification of a long-term strategy for each property class.Systematic inventories and records of property.•
Justification of real property demands of government •agencies.Property management and accounting tracking for rev-•enues and expenses for each propertyOccupancy monitoring.•Recording of property values and liens.•Periodic evaluation of the financial performance of each •property and the whole portfolios in each class, based on strategic criteria (such as cost efficiency, sufficient returns on investment, or accountable and controllable subsidies).Rational criteria and written rules for decision-making •regarding public property acquisition, holding and dis-position.
Efficient real property asset management at the local level is not possible without an enabling legal and institutional framework set up by national government. In particular, for transitional and developing economies, the implemen-tation of asset management should be preceded by clari-fication of local governments’ property rights and fiscal autonomy.
This article is extracted from a report entitled Property Asset Management in the Cities, prepared for the SACN by Leila McKenna, Tanya van Schalkwyk, Andreas Bertoldi and Katherine Cox. A copy of the full report can be downloaded from the SACN’s website, www.sacities.neti

| W e l l - g o v e r n e d C i t i e s r e p o r t 2 0 0 93 6
city development partnershipsPartnerships are expected to play an increasingly important role within the context of limited municipal budgets. SACN member cities will find it necessary to enter into urban management partnerships in order to maintain service and infrastructure standards in some neighbourhoods. Cities will also benefit by considering urban regeneration partnerships that involve shared risk in large scale capital projects. This article explores partnership structure and objectives, highlights lessons from leading partnerships in Cape Town and Barcelona, and outlines lessons identified by urban regeneration partnership practitioners.
In 2008, Ralph Hamann and Fleur Boulogne, of the Univer-sity of Cape Town, wrote a paper titled Towards a Typol-ogy for More Effective Evaluation and Implementation of Cross-sector Partnerships. In it they defined two broad categories of partnerships: implementation partnerships and innovation (or rule-setting) partnerships.
Implementation partnerships are focused on achieving relatively clearly defined, measurable objectives and have formal institutional arrangements. Innovation partnerships are comparatively informal collaborations that seek to address more open-ended social problems. Some part-nerships are a combination of these types.
Many urban development or renewal projects involve complex, multi-stakeholder partnerships that are usually a hybrid of these types of partnerships. Project planning partnerships (PPP) that define project priorities and out-comes can be classified as rule-setting partnerships. On the other hand, project implementation partnerships, like city improvement district partnerships or infrastructure PPPs, need to be managed in a formal way with binding agreements, a clear definition of roles and responsibilities, assignment of risk, outputs with timeframes, and expected impacts.1
Rule-setting and innovation partnerships are often
1. Extracted from Hamann, R. and Boulogne, F. (2008) Towards a Typology for More Effective Evaluation and Implementation of Cross-sector Partnerships, presented at 4th ISBEE World Congress

W e l l - g o v e r n e d C i t i e s r e p o r t 2 0 0 9 | 3 7
started in response to a crisis, while implementation part-nerships are often about defining a common development vision. Crisis is a good galvanising force for partnerships, even reluctant partnerships. In the absence of crisis, part-nerships can become dysfunctional. They may require either a lot of facilitation, administration and secretariat support, or have rules that require participation (PPPs or section 22 of the property act or property owners associa-tion or city improvement district).
According to Andrew Boraine, CEO of Cape Town Part-nership (CTP), partnerships should create dynamic ten-sions that result in better solutions and more innovation. The key to holding partnerships together is the effective management of these tensions.
The urban decline and mismanagement crisis in the inner city of Cape Town was the driving force behind the formation of CTP. In August 2009, CTP celebrated its tenth anniversary with a conference and the publication of a review of lessons learnt during this time.
These lessons include the following:Partnerships should evolve over time: The CTP evolu-•tion can be categorised into an establishment phase (1996-1999), followed by an implementation phase (1999-2002) which was about improving the perform-ance of the city centre and changing perceptions to restore confidence, stem the flight of capital, and rescue dwindling municipal revenues. Then there was an urban regeneration phase (2003-2005), which was about attracting private investment for building regen-eration and upgrading public spaces. CTP broadened the partnership from 2005-2007 in order to establish a longer-term vision. Partnership managers must provide a translation serv-•ice: Building and maintaining trust includes developing common perceptions, giving critical cooperative inputs, playing match-maker, and managing both cooperation and conflict. There are many roles for partnership managers to play: •Rowing, steering, coaching and cheering are the meta-phors used to describe CTP’s activities. The quality of people supporting the partnership can make or break the partnership. All players must be partnership ori-ented, and not driven by profit.
Schematic illustration of the ideal partnership types.
Pur
po
se
Op
en-e
nded
Wel
l-defi
ned
Level of institutionalisation
Formal Informal
Rule-setting and innovation
Implementation
Download a copy of the report: Review of the CTP from http://capetownpartnership.wwc.co.za/wp-content/uploads/2009/08/Lessons-FINAL-8-Sep-09.pdf ]i
What is a City Improvement District?
A City Improvement District (CID) is a precisely defined geographical area, approved by the city council in terms of the Municipal Property Rates Act, Section 22 (Special Rates Area) and the CID bylaw – to provide complementary services in that area.

| W e l l - g o v e r n e d C i t i e s r e p o r t 2 0 0 93 8
Cape Town Partnership
The exact roles and programmes of CTP can be usefully discussed using rowing, cheering, steering and coaching metaphors.
Rowing: CTP’s direct delivery and implementation roles•Cheering: CTP’s role encouraging and supporting the •efforts of othersSteering: CTP’s role shaping and facilitating city develop-•ment with partnersCoaching: CTP’s role in building capacity elsewhere in •the city.
It is this core business of proactive urban management and strategic partnership/leadership facilitation which has pre-vented central city decay in Cape Town, and supported its revitalisation.
Rowing: CTP’s direct delivery and implementation rolesCTP’s main activities are associated with the Central City Improvement District (CCID) daily top-up activities or urban management services, which include keeping the city safe, secure and clean. In addition, the CCID also actively markets the central city and its large-scale events that attract visitors and locals alike. Other examples of projects and programmes that the CTP ‘rows’ include:
Development projects such as the City Hall upgrade•Creative Cape Town which recognises cultures’ intrinsic •role in promoting an active, vibrant and diverse central cityCity public space interventions with the City of Cape •TownKerb-side parking management•Ensuring that street children have access to care and •support, and the homeless have access to shelter and employmentUpgrading of informal traders storage and trading facili-•ties.
Cheering: CTP’s role in building capacity elsewhere in the cityWhen involved in the enor-mous task of revitalising a challenged city core, it is important to recognise and praise the work of other organisations and individuals who support the end goal of making the city work for all. To this end, CTP often publicly acknowledges the good work of its partners.
CTP is increasingly involved in knowledge and informa-tion gathering activities. Recognition of exemplary work and the sharing of best practice help to facilitate key rela-tionships in the central city, which are needed to maintain the momentum of the area’s development.
The newsletter Siyahluma is published on a regular basis and captures all the activities that CTP and others are involved in, from high profile infrastructure projects such as the impending BRTS to promoting non-motorised transport and walkability in the central city. Regular walking tours are an important tool to communicate how, why and where the central city is evolving and improving.
Steering: CTP’s role in shaping and facilitating city development with partnersThe role of CTP as coordinator, mediator and facilitator has been fundamental in steering public-private, public-public and intra-public and private-sector relations related to the revitalisation of the central city.
Visioning and thought leadership represent important steering functions of CTP. They presently find expression mainly in the Central City Development Strategy (CCDS) which can be seen as the content driver for the work in the central city for the next ten years. The CTP has been involved in the development of the CCDS.
CTP also uses the local press and media to stimulate public debate and engagement in discourses relevant to promoting the ongoing well-being of Cape Town and its central city. For example, during the first half of 2008, CTP was party to a series of weekly media releases that covered Cape Town’s urban challenges at various levels. This stimulated public debate, among other things, around Cape Town’s ambition of achieving urban democracy, and how the socio-economic, cultural and other disparities in the city can be challenged effectively. Some high profile contributors such as the Minister of Finance participated in this series.
Coaching: The CTP’s role in building capacity elsewhere in the cityThe coaching role played by CTP is evident in its training and mentor-ing activities.
Although direct skills training and development in programmes such as kerb-side parking attending and management only represent a small amount of CTP’s work, it has nevertheless been successful.
The main coaching role involves the mentoring of other City Improvement Districts (CIDS), of which there are 15 in Cape Town. A Business Areas Network (BAN) convenes at least four times a year to engage the CIDS and CTP in mutual information sharing, with a view to resolving urban management issues across Cape Town. Invitations to CTP to advise other CIDS extend into the region as far as Worces-ter and Knysna, where knowledge is consistently shared. Other organisations in the country such as Johannesburg Development Agency (JDA) also engage CTP in a mutually beneficial manner.
Extracted from the Review of the Cape Town Partnership, October 2009

W e l l - g o v e r n e d C i t i e s r e p o r t 2 0 0 9 | 3 9
At the CTP conference in August 2009, Mr Jordi Sac-ristan, Marketing and Communications Director for 22@Barcelona delivered a presentation on lessons from Bar-celona’s innovative 22@ urban regeneration partnership project.
The project started when the Barcelona city council identified a zone of almost 200 ha in the central city for regeneration from degraded industrial land uses to mixed-use knowledge economy uses. The key incentive was the trade of increased densities and development rights for the cession of 30 per cent of the privately owned properties for public amenities and services. Private land-owners thus gained value and the city coun-cil gained land for social and public land uses. 22@ also focused on developing business clusters in Barcelona’s priority sectors (energy, media, IT, medical technology, and design). As a result of these new industrial and com-mercial clusters there are now 2 000 new companies located in the urban regeneration zone, 44 per cent of which did not exist previously. It is estimated that 12 million jobs now exist in the regeneration zone; 44 000 of these are new jobs. The 22@ project team also played a role in the networking of venture capital and facilitat-
ing public financing. In particular, a society of business schools and other specialist academic fields was estab-lished.
Participants at the conference identified the following key lessons for urban regeneration partnerships:
Get the basics right by focusing on core urban manage-•ment functions to achieve an appropriate standard for services and spaces.Social development is a core principle of urban regen-•eration, and partnerships should not be limited to clean and safe outcomes.Urban regeneration is about people, not just buildings •and infrastructure. Culture and creativity can be used to promote social cohesion and local investment.Public space is very important for public life.•Communications, marketing and branding should also •be an objective for urban regeneration partnerships.Individual champions are critical to the success of part-•nerships.It is important for partnerships to mature and evolve.•Cities should build facilitation capacity and resources in •order to play a role as equal partners with the private-sector in driving urban regeneration.
SACN’s Urban Development Partnerships theme has been running since 2007/08. In March 2007, SACN convened a seminar on urban development partnerships, to provide municipal leaders and officials and urban development practitioners with an opportunity to discuss the incentives and grants that support urban development partnerships. As a conclusion to this seminar, the participants asked SACN to do further research on the relative effectiveness of the urban development incentives. A report on urban development incentives was prepared by Silimela Development Services - a copy of this report can be obtained from SACN by e-mailing your request to Sadhna Bhana on [email protected]. Since 2008, SACN has also been a partner in the Training for Township Renewal Initiative (TTRI) that promotes township development partnerships. Download the Township Renewal Sourcebook and case studies on successful township development projects from SACN’s website: www.sacities.net.
i

| W e l l - g o v e r n e d C i t i e s r e p o r t 2 0 0 94 0
assessing the impact of the 2010 fifatm world cup on the development of south african citiesAs part of its mandate to promote multi-faceted city development, South African Cities Network (SACN) recently embarked on a City Development Strategies project to develop and implement a framework to assess the long-term impact of the 2010 FIFA World Cup (FWC) on the development of South African cities. The resultant report outlines steps that must be taken to develop and refine the legacy assessment framework, and provides key performance indicators to measure the impact of the 2010 FWC on city development strategies.
Given the prominence and scale of mega-events and the increased levels of investment they attract, there has been much debate and research on the nature and content of their legacy. However, there is no clear definition of the legacy, nor is there consensus on which aspects to priori-tise in impact appraisals. For the purposes of this review, legacy refers to both planned and unplanned, positive and negative, tangible and intangible structures or societal relations that are developed in the context of an event, and which persist for a significant period of time after the event has ended.
Many governments host mega-events to catalyse new forms of economic development, to regenerate dilapi-dated urban regions, to spur on tourism growth, and to help re-brand cities. Urban regeneration is a common objective for the majority of host cities in the developed world. Although many of the emergent aspiring hosts of
the developing world also have urban regeneration as a goal, they tend to use mega-events to boost national and local development, and to serve political objectives.
Although contexts may differ, it is possible to identify a number of common urban legacies from mega-events. Five types of legacy can be differentiated: sporting legacy, urban legacy, infrastructural legacy, economic legacy, and social legacy. These include tangible and intangible impacts. They may be grouped into primary and second-ary legacies in terms of the short-, medium-, and long-term impacts of aspects such as urban infrastructure, design, image and tourism, as well as governance structures in the city.
Sport is an important ideological instrument in post-apartheid South Africa. Like many other developing countries, South Africa has embraced the ideology of the sport-media-tourism complex, and is seeking to promote

W e l l - g o v e r n e d C i t i e s r e p o r t 2 0 0 9 | 4 1
an event-driven economy. The hosting of mega-events in developing countries is often contested and highly debated, especially in the political arena, given the high economic costs and infrastructural requirements associ-ated with large-scale sports events like the FWC.
Hosting the FWC in South Africa will not only showcase the nine host cities as world-class tourist destinations, but there is also potential for non-host cities to benefit. Non-host locations are likely to benefit directly from being base camps for competing teams as well as benefiting from tourist travel during their stay in South Africa.
Since the initial bid process for the FWC, broad esti-mates of the potential impacts on the South African econ-omy have been adjusted from R30 billion to R51 billion. National government undertook to spend more than R400 billion over a five year period between 2006 and 2010, in line with fashioning macro-economic policies around the 2010 event. A large portion of the spending has been des-ignated for stadium construction or upgrading. Stadium development is a critical part of the legacy benefits associ-ated with hosting mega-events.
The analyses on previous World Cups provide a context for estimating the potential risks and benefits for the FWC in South Africa. Government is investing heavily in stadium development and this public expenditure stands in strong contrast to the moderate possibilities of post-2010 use. Despite considerable local interest in football, attendance at premier league football matches (an average of 5 000 people per match) are considerably lower than in Ger-many (about 40 000 people per match) or France (about 20 000 people per match). If sustainable regeneration is to be achieved, it is important to plan for the effective use of facilities after the event, with an emphasis on developing multi-purpose venues.
Developing the assessment framework
To establish the framework, SACN embarked on a con-sultative process that links with the core themes of the 2010 State of the Cities Report. The framework adheres to the four quadrants of the SACN’s analytical framework to promote productive, inclusive, sustainable, and well-governed, cities. The framework also includes national government’s 2010 objectives and key performance areas in the five-year Local Government Strategic Agenda, which are municipal transformation and organisational development, basic service delivery and infrastructure,
Stadium development is a critical part of the legacy benefits associated with hosting mega-events
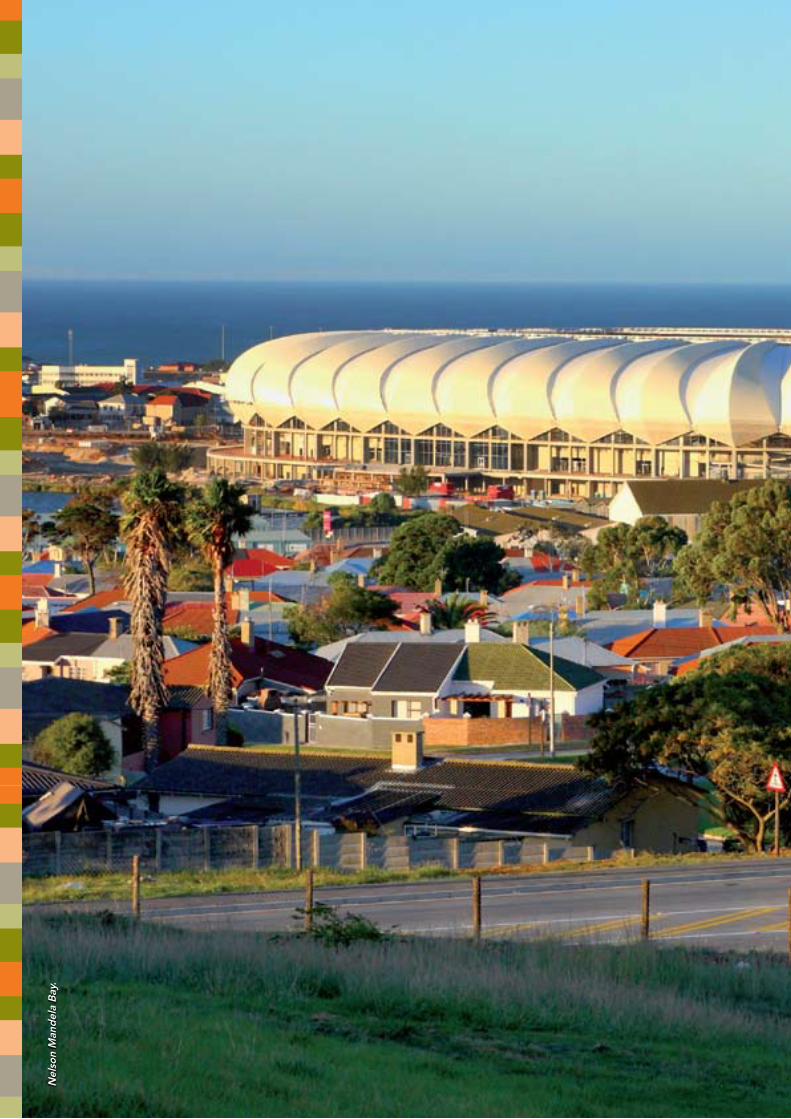
| W e l l - g o v e r n e d C i t i e s r e p o r t 2 0 0 94 2 Nel
son
Man
del
a B
ay.

W e l l - g o v e r n e d C i t i e s r e p o r t 2 0 0 9 | 4 3
local economic development, municipal financial viability and management, social development, good governance and public participation, safety and security and disaster management, and African legacy.
The framework does not duplicate what other institutions are producing. As such, the focus is not on tracking progress towards 2010, but rather on understanding the legacy that the FWC will leave for the cities. The framework does not attempt to evaluate the impact that all integrated develop-ment plan (IDP) initiatives and projects will have on the cit-
ies, and so it is important to decide on the logic for including or excluding specific initiatives and projects.
Great care was taken to keep the number of objectives to a minimum. A number of key performance indicators (KPIs) were developed for each objective, and only objectives with a high likelihood of being realised through implementation of 2010 projects were included. Generic KPIs were devel-oped for each objective in the score card. Common 2010 initiatives likely to impact on the objectives are outlined in the table below.
Table 1: Potential objectives for the 2010 scorecard
Focus area Productivity Inclusivity Sustainability Good governance
Municipal transformation
and organisational development
improve the ability to •retain and attract skills improve project •management capabilities
Measure new long-•term employment created for women and foreign nationals
Assess efficiency of •technical support deployed to cities to support 2010 FWC initiatives
improve land •use planning and managementreview legislative •requirementsreview litigation and •dispute settlement
Basic service delivery and infrastructure improvement
Accelerate existing •transport plansAccelerate •infrastructure plans and maximise their useMaximise the use of •iCt
promote access to safe, •efficient, convenient and affordable public transportimprove access to •housing, and better service delivery
ensure effective waste •management and other environmental sustainability factors during and beyond the 2010 FWC
Coordinate housing •and transport subsidiesimprove contracting •management capabilities, including service delivery arrangements
Economic development
Harness tourism as •a springboard for economic developmentdecrease the costs of •participation and of doing business in the economyreduce transport costs•
ensure participation •and access to economic assets by all south Africansgrow and support •existing and new businesses to increase employment and income opportunities through 2010 programmesensure promotion of •economic policies that enhance investment and economic development to stimulate job creation and income opportunities beyond 2010
preserve selected land •for conservationAchieve higher land •utilisation without damaging natural resources
ensure efficiency of •land releaseFacilitate incentive •packages to stimulate economic growthdevelop frameworks •and improve policies for doing business with cities (quicker and more efficient supply chain management systems and procurement frameworks)
Municipal financial viability
increase the value of •land and propertiesexpand the revenue •base
ensure long-term •sustainability of projectsManage municipal •resources in a financially sustainable manner through sound strategic budgeting, revenue maximisation, diversification and creating value for money
demonstrate fiscal •disciplinereview of clean/•unqualified audits received

| W e l l - g o v e r n e d C i t i e s r e p o r t 2 0 0 94 4
Focus area Productivity Inclusivity Sustainability Good governance
Socio-political, good governance
and public participation
strengthen •transparency and accountability of financial affairs and local government Maximise use of ports •of entry
improve mechanisms •for public participation in the development of 2010 programmes through the provision of political, technical and other support to host citiesAddress social •exclusion and spatial segregation in land markets
develop support •programmes to scale up the mobilisation of community resources as well as strengthen political championship, support and oversight
strengthen political •championship, support and oversight by demonstrating strong intergovernmental and interdepartmental relationshipsreduce unlawful land •use
Safety and security
improve access to •and response time of police and emergency services
ensure access to •security, safety, health and justice for all
Achieve cooperation •between different law enforcement emergency agencies
African legacy encourage the •involvement of African countries in 2010 programmesensure participation by •private sector, public sector and civil society in the 2010 national Communications partnership
Cross-cutting interventions
optimise outputs from •land
profile and brand •popular cities so as to project a strong image of each city and the country
In the next stage of the project, SACN will collect baseline data from 2006, when South Africa’s preparations for the 2010 FWC started. Projects completed before 2006 will be used as the benchmark for measuring city development in 2010 and in 2016. This ten-year timeframe will provide comprehensive comparable data to measure projects completed before, during, and after the 2010 FWC.

W e l l - g o v e r n e d C i t i e s r e p o r t 2 0 0 9 | 4 5
Understanding the key performance indicators
The KPIs are divided into the four SACN themes – productive, inclusive, sustainable, and well-governed cities. The table below is an excerpt of the productivity objectives, detailing the KPIs, common initiatives, and the source of data for 2006, 2010 and 2016. Indicators like ‘number of new jobs created annually in the municipality’ and ‘amount of salary billed in Rand’ will provide insight into the number of new jobs created annually versus the additional jobs created through 2010, as well as the number of jobs retained in 2010.
Table 2: Productivity objectives, potential KPIs, baselines, targets and 2010 initiatives (excerpt)
Productivity
Focus area Objectives KPIs Common initiativesMethodology/source of
information
Municipal transformation
and organisational development
improve the ability to retain and attract skills, and improve project management capabilities
number of training initiatives (workshops, seminars, etc.) undertaken to improve skills, including number of joint initiatives (i.e. international projects)
sACn workshops•Host City Forum•infrastructure •programmes
Host cities•local organising •committees2010 government unit•economic development •agencies within local and provincial structures
number of new jobs •created annually in the municipality in relation to 2010 initiativesAmount of salary billed •in rand at the municipal level
Host cities•local organising •committees
To further refine the KPIs, SACN extracted those that measure the impact of the FWC on the built environment. They were also selected for their impact on cities and city governance. In the excerpt in table 3, indicators like ‘hectares of new land developed’ and ‘amount of the city covered by bus service’ will provide insight into the changes the FWC had on city development patterns and public transportation options.

| W e l l - g o v e r n e d C i t i e s r e p o r t 2 0 0 94 6

W e l l - g o v e r n e d C i t i e s r e p o r t 2 0 0 9 | 4 7
Table 3: Indicators assessing the built environment (excerpt)
Built environment
Focus area Productivity Inclusivity Well-governed Sustainability
Basic service delivery and infrastructure
improvement (accelerated
implementation of infrastructure
projects)
Hectares of new land developed
Amount of the city •covered by bus service and distance between stations
number of 2010 •greening initiatives (i.e. number of trees planted for 2010 greening projects)
number and value of •new subsidised housing units built per year
Amount of conservation •land per municipality
public expenditure on 2010 infrastructure per city per year, compared to total capital budget per city per year
number of community facilities built because of 2010
number of projects completed by deadline and public perception of project success
number of 2010 •infrastructure projects with energy-saving technologiesnumber of 2010 •infrastructure projects utilising renewable/alternate energy sources
Kilometres of new •roads, rail, and bus routesnumber of people •accessing and using new infrastructure
number of transport •infrastructure projectsnumber of users of •public transport and their demographic profilenumber of criminal •incidents reported when using public transport
number of environmentally-linked conflicts
The 2010 FWC represents a unique opportunity for South African cities to accelerate the pace of building and service delivery against their long-term develop-ment goals. The country is already buzzing with prepara-tions for the event, and government is investing billions on new capital works projects and upgrades of existing infrastructure. The focus to date has been on ensuring that preparation for the event is successful, with little articulation of the legacy that will remain after 2010. Failure to identify and measure the long-term impact of the event could prevent the country from reaping the full benefits of hosting.
It is imperative that institutions mandated to foster sus-tainable development focus their attention on ensuring that the country is able to use the 2010 FWC as a spring-board for future growth. Taking stock of the situation, SACN launched an initiative to ensure that the long-term objectives linked to the event are not swamped by the frenetic activity leading up to the event.
SACN has started the next stage of the project by collecting the baseline data for 2006. Data collection will continue after the 2010 FWC and into 2010. Once data has been collected, SACN will be able to assess the long-term legacy of the 2010 FWC on South African cities.
The full draft report and framework can be obtained from the SACN. E-mail your request to Astrid Wood: [email protected] i

| W e l l - g o v e r n e d C i t i e s r e p o r t 2 0 0 94 8
acknowledgements and referencesThe following organisations and individuals are acknowl-edged for their assistance and/or contributions to this report:State of municipal finances in Southern AfricaHunter van Ryneveld and Afcap Consulting. (2009). State of Finances, Creditworthiness and Borrowing of Munici-palities in Southern Africa. Report to South African Cities NetworkRefugee management – the governance responseLandau, L. Polzer, T. Wa Kabwe Segatti, A. (2009). What Are Cities Doing About Human Mobility?Report prepared for South African Cities Network.Misago, M. Landau, LB, Monson, T. (2008). Towards Toler-ance, Law, and Dignity: Addressing Violence against For-eign Nationals in South Africa. Report for the International Organisation of Migration. Pretoria: International Organi-sation of Migration.South African cities unprepared for disasterBotha, N. (2003). Welcome Address by Deputy Minister for Provincial and Local Government. The Inter-Governmental Conference on Disaster Management, (p. 2). Kempton Park, Gauteng.EM-DAT: The OFDA/CRED International Disaster Data-base, Université Catholique de Louvain, Brussels, Belgium. (1980-2008). PreventionWeb. Retrieved July 20, 2009, from South Africa - Disaster Statistics: http://www.preven-tionweb.net/english/countries/statistics/?cid=160
Geffen, N. (2008). Shared Myths: The Xenophobic Vio-lence in South Africa. Pambazuka News, p. 7.Hassim, S. (2008). South Africa’s Vulnerability to Disas-ters.National Disaster Management Centre. (2002). Disaster Management Guidelines for Municipalities. South Africa.National Disaster Management Centre. (3-4 August 2009). Disaster Management FIFA Confederations Cup SA 2009 Debriefing Workshop Presentations. Disaster Management FIFA Confederations Cup SA 2009 Debriefing Workshop (p. 20). Tshwane: Department of Cooperative Governance and Traditional Affairs.Niumpuno, D. K. (2009, August 13). Head of the Office of Disaster Preparedness in Africa at Wits University. (A. Wood, Interviewer)South Africa. (2002). Disaster Management Act. Pretoria.Planning for infrastructure investmentWalsh, K. (2009). MIIF overvie. Prepared for SACN annual report on well-governed cities.Property asset management in the citiesMcKenna, L. Van Schalkwyk, T. Bertoldi, A. Cox, K. (2009). Property Asset Management in the Cities. Report pre-pared for South African Cities Network.City development partnershipsHamman, R. Boulogne, F. (2008). Towards a Typology for more Effective Evaluation and Implementation of Cross-sector Partnerships. Boraine, A. Cape Town Partnership.
Information published in this report is drawn from a wide range of sources. While every effort is made to verify accuracy and currency, SACN makes no guarantee, assurance, representa-tion or warranty as to the accuracy of the information contained in this report and will not be held liable for any reliance placed on the information contained in this report.

W e l l - g o v e r n e d C i t i e s r e p o r t 2 0 0 9 | 1

| W e l l - g o v e r n e d C i t i e s r e p o r t 2 0 0 92