Embed Size (px)
Citation preview

Marit van Hout, Özge Özdemir, Paul Koutstaal (PBL)
27-9-2019
16th IAEE European Conference, Ljubljana
Welfare Distribution Effects of Introducing a Multi-country Carbon Price FloorAssessment of the 2030 EU Power System

› Problem statement & analysis:
– Main drivers and thresholds regarding CPF debates in EU
- Research questions & methodology
- Welfare distribution analysis
- Concluding remarks & discussion
Content
2

› EU aims at reducing emissions by 80-95% in 2050 w.r.t. 1990 levels, and 40% by 2030
- Power sector plays important role
› Main purpose EU ETS: stimulate low carbon investments (‘polluter pays’ principle)
› Main concerns effectiveness EU ETS:
- Too low EU ETS price (low incentive)
- high volatility (increased risk perception)
- EU ETS Reforms (i.a. MSR) increased price but still not ensures stable and sufficiently high CO2 price
› Setting a minimum price for CO2 could help overcome these concerns
(Main) drivers for CPF discussions
3
Economic crisis
Market Stability Reserve established
Source: Sandbag (2019), Carbon price viewer

› UK first country to introduce a CPF, though price is capped and continuation after2021 is uncertain
› In dec 2018, 9 EU countries signed a declaration for strengthening CO2 pricing in EU where they commit to cooperate
• DE, did not sign declaration i.a. because it is expected that CPF would mostly benefit FR NUC
› As pointed out by Matthes et al., 2017: “..dealing with political narratives around winners and losers of a floor price is a key prerequisite for its successful implementation..”
› Also: concerns for carbon leakage in case of non-unilateral implementation
(Main) thresholds for introduction of CPF
4

1) what is the impact on social welfare and CO2 emissions when a regional CPF is introduced, and the impact of Germany deciding to cooperate or not?
2) what is the impact on social welfare and CO2 emissions in case the EU ETS price is considered sufficiently high?
Analysis year: 2030
Addressed research questions
5

EU Electricity market model COMPETES:
› Network constrained (NTC) optimization model (cost minimalization)
› Wide range of RES and conventional technologies
› Hourly resolution: demand, wind, solar, and hydro profiles
General scenario assumptions:
› ENTSO-E sustainable transition scenario
› Transmission: ENTSO-E TYNDP2018
› Fuel prices: WEO 2016
› Climate year: 2015
Two-stage modelling (unit commitment):
1. (Dis)investments (sample)
2. Day-ahead market (all hours)
Methodology – Analysis tool
6
Indicators welfare assessment of main stakeholders:
Producers’ surplus (PS): short-run producers’ profits (gen. rev. – var. gen. costs) - (annualized) investments in new thermal capacity - fixed O&M costs for installed capacity
Consumers’ payments (CP): (hourly sum of) product of demand and e-prices (wholesale)
(theoretical) congestion rents (CR): (hourly sum of) product of hourly price differences between two connected nodes and power flows
Carbon emission income government (CEI): Product of nodal CO2 emissions and EU ETS price + top-up tax CPF (if any)
ΔSocial welfare ALT: (PS ALT – PS REF) + (CP REF – CP ALT) + (CR ALT – CR REF) + (CEI ALT – CEI REF)
Methodology – scenarios and calculations
7
2030 Scenario EU ETS price CPF Countries introducing a CPF
Reference 15 €/tonne - -
Alternative 1 15 €/tonne 30 €/tonne NL, UK, IT, FR, IE, SE, FI, DK, PT
Alternative 2 15 €/tonne 30 €/tonne NL, UK, IT, FR, IE, SE, FI, DK, PT & DE
Alternative 3 30 €/tonne - -
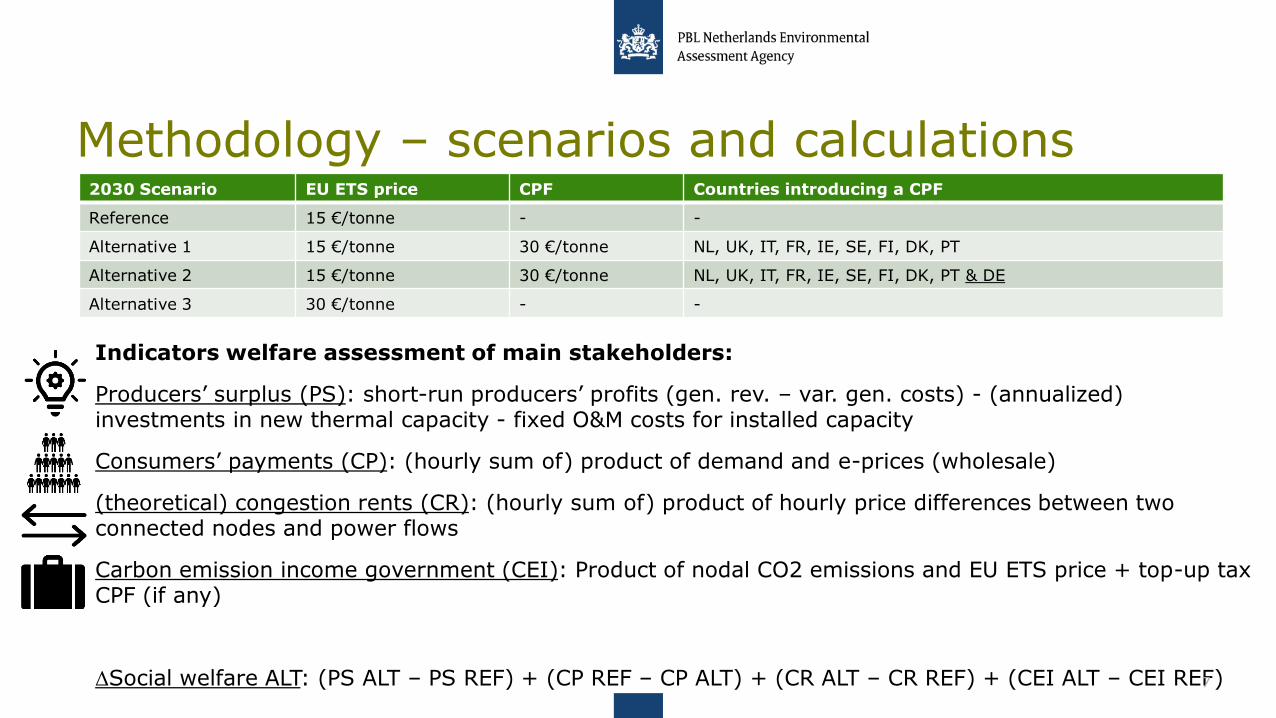
Avg. Yearly E-prices(€/MWh)
8
+0,7
+4,0 +6,6
EU Avg: 45,6 EU Avg: 47,2
EU Avg: 48,9 EU Avg: 52,6

Consumers’ surplus (€Mln)
9
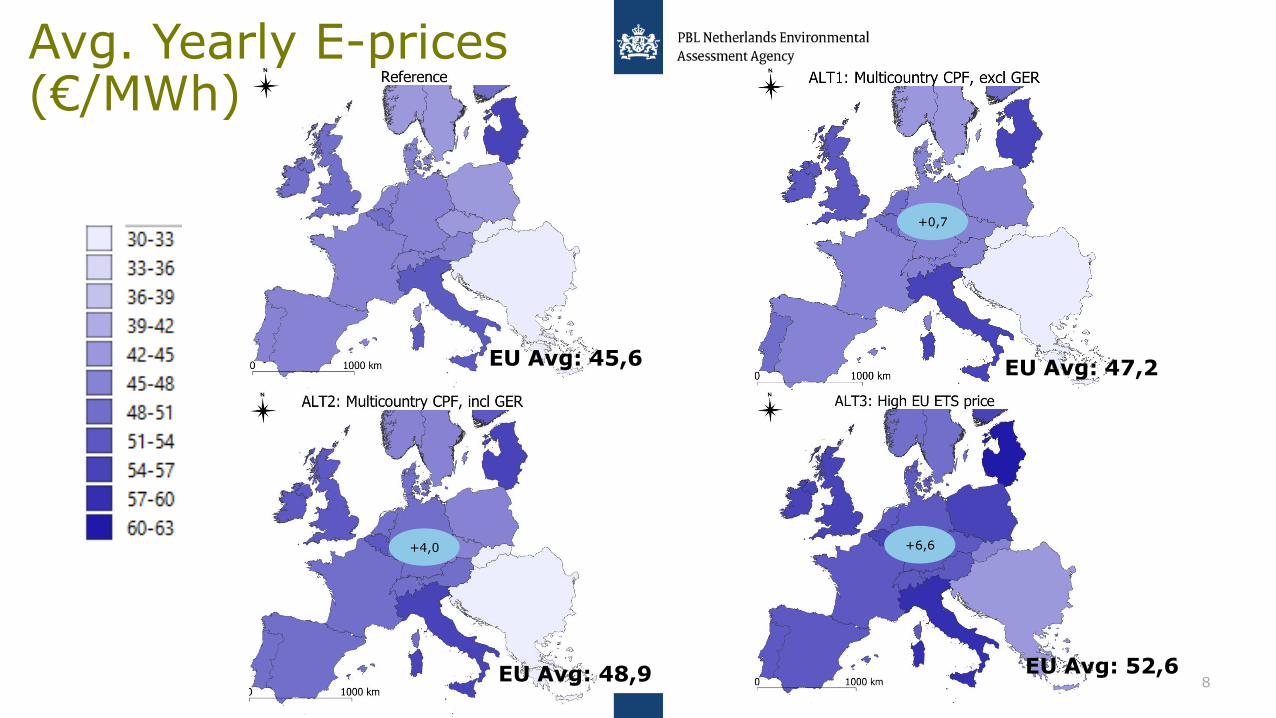
ΔProducers’ surplus (€Mln)
10

ΔCongestion rents (€Mln)
11

Additional income governmentcarbon payments (€Mln)
12

ΔSocial welfare (€Mln)
13
ΔSocial welfare ALT: (PS ALT – PS REF) + (CP REF – CP ALT) + (CR ALT – CR REF) + (CEI ALT – CEI REF)

ΔCO2 emissions (Mton)
14
Change in EU emissions: +0,2 Mton
Change in EU emissions: -1,2 Mton
Change in EU Emissions: -23,2 Mton

› Insights from analysis underline concerns by various stakeholders and countries
› A nonunilateral implementation of carbon floorprice will lead to carbon leakage(under model assumption of fixed EU ETS price)
› If the 9 countries that signed the declaration introduce a sufficiently high CPF, mostly gas units will be replaced by other (less efficient) gas units to meet demand (even slightly positive impact on CO2 emissions)
Hence, regarding emissions in the power sector only, introducing a CPF in mostly gas-basedcountries would be counterbeneficial
› Consumers’ can generally be considered as ‘losers’ but might change in case governments decide to relocate (part of) additional tax income for compensation
› In case DE cooperates, there is a total CO2 reduction, but it is relatively small and DE can be considered a ‘loser’
• Considering this assessment, it would be highly unlikely that DE would sign the declaration as well
Conclusions & discussion (1/2)
15

› Social welfare of countries with a high share of low-carbon technologies (FR, NO etc) are benefitting from strengthened CO2 pricing
› Germany is highly important in reducing EU CO2 emissions, but only whenemissions in other countries with high coal share are not increasing (e.g. PL)
– Unilateral implementation of CPF would account for this; however PL probablynot eager to cooperate since social welfare is expected to reduce
– Further reforming the EU ETS to make sure that released EU ETS allowanceswill not surpress prices, might also account for this (potential impact on country’s willingness to cooperate in introducing CPF)
Conclusions & discussion (2/2)
16

Appendices
18

Fuel & CO2 prices
Year 2020 2025 2025 2030 2030 2030 2040 2040 2040
ScenarioExpected
Progress
Coal Before
Gas
Gas Before
Coal
Sustainable
TransitionEUCO
Distributed
Generation
Sustainable
Transition
Global
Climate
Action
Distributed
Generation
€/net GJ
Nuclear 0.47 0.47 0.47 0.47 0.47 0.47 0.47 0.47 0.47
Lignite 1.1 1.1 1.1 1.1 2.3 1.1 1.1 1.1 1.1
Hard coal 2.3 2.5 2.1 2.7 4.3 2.7 2.5 1.8 2.8
Gas 6.1 7.4 7 8.8 6.9 8.8 5.5 8.4 9.8
Light oil 15.5 18.7 15.5 21.8 20.5 21.8 17.1 15.3 24.4
Heavy oil 12.7 15.3 12.7 17.9 14.6 17.9 14 12.6 20
Oil shale 2.3 2.3 2.3 2.3 2.3 2.3 2.3 2.3 2.3
€/ton CO2 price 18 25.7 54 84.3 27 50 45 126 80
Main Fuel Price WEO 2016 WEO2016 WEO 2016 WEO 2016
Fuel Prices Provided by DG
Energy
WEO 2016 WEO 2016 WEO 2016 WEO 2016
Source New Policies New Policies 450New Policies with Higher Carbon Price
New Policies with higher CO2
New Policies 450New Policies
with higher CO2
(Rows shaded Grey)
Fuel Prices adjusted to
create a "Low Oil Price
Scenario"
ENTSO-E Fuel & CO2 prices
19
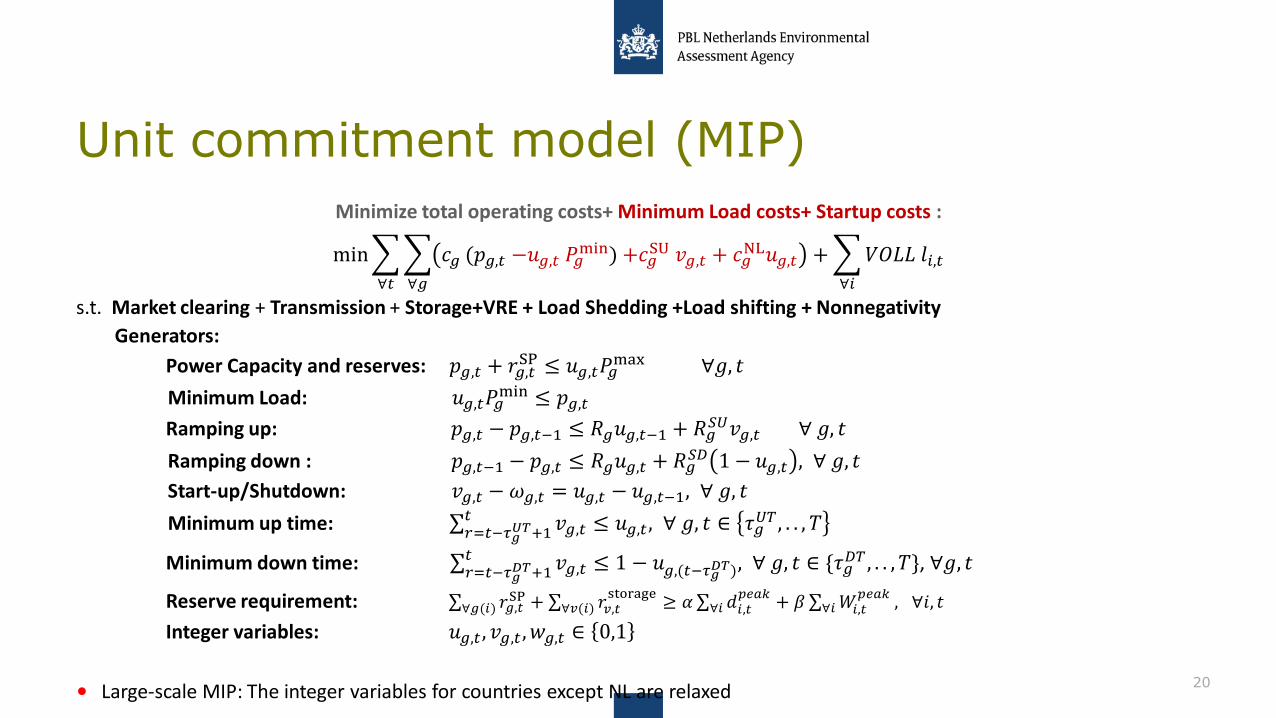
Minimize total operating costs+ Minimum Load costs+ Startup costs :
min
∀𝑡
∀𝑔
𝑐𝑔 (𝑝𝑔,𝑡 −𝑢𝑔,𝑡 𝑃𝑔min) +𝑐𝑔
SU 𝑣𝑔,𝑡 + 𝑐𝑔NL𝑢𝑔,𝑡 +
∀𝑖
𝑉𝑂𝐿𝐿 𝑙𝑖,𝑡
s.t. Market clearing + Transmission + Storage+VRE + Load Shedding +Load shifting + Nonnegativity
Generators:
Power Capacity and reserves: 𝑝𝑔,𝑡 + 𝑟𝑔,𝑡SP ≤ 𝑢𝑔,𝑡𝑃𝑔
max ∀𝑔, 𝑡
Minimum Load: 𝑢𝑔,𝑡𝑃𝑔min ≤ 𝑝𝑔,𝑡
Ramping up: 𝑝𝑔,𝑡 − 𝑝𝑔,𝑡−1 ≤ 𝑅𝑔𝑢𝑔,𝑡−1 + 𝑅𝑔𝑆𝑈𝑣𝑔,𝑡 ∀ 𝑔, 𝑡
Ramping down : 𝑝𝑔,𝑡−1 − 𝑝𝑔,𝑡 ≤ 𝑅𝑔𝑢𝑔,𝑡 + 𝑅𝑔𝑆𝐷 1 − 𝑢𝑔,𝑡 , ∀ 𝑔, 𝑡
Start-up/Shutdown: 𝑣𝑔,𝑡 − 𝜔𝑔,𝑡 = 𝑢𝑔,𝑡 − 𝑢𝑔,𝑡−1, ∀ 𝑔, 𝑡
Minimum up time: σ𝑟=𝑡−𝜏𝑔
𝑈𝑇+1𝑡 𝑣𝑔,𝑡 ≤ 𝑢𝑔,𝑡 , ∀ 𝑔, 𝑡 ∈ 𝜏𝑔
𝑈𝑇, . . , 𝑇
Minimum down time: σ𝑟=𝑡−𝜏𝑔
𝐷𝑇+1𝑡 𝑣𝑔,𝑡 ≤ 1 − 𝑢𝑔,(𝑡−𝜏𝑔𝐷𝑇), ∀ 𝑔, 𝑡 ∈ {𝜏𝑔
𝐷𝑇 , . . , 𝑇}, ∀𝑔, 𝑡
Reserve requirement: σ∀𝑔(𝑖) 𝑟𝑔,𝑡SP + σ∀𝑣(𝑖) 𝑟𝑣,𝑡
storage≥ 𝛼σ∀𝑖 𝑑𝑖,𝑡
𝑝𝑒𝑎𝑘+ 𝛽σ∀𝑖𝑊𝑖,𝑡
𝑝𝑒𝑎𝑘, ∀𝑖, 𝑡
Integer variables: 𝑢𝑔,𝑡 , 𝑣𝑔,𝑡 , 𝑤𝑔,𝑡 ∈ 0,1
• Large-scale MIP: The integer variables for countries except NL are relaxed
Unit commitment model (MIP)
20

Generation Mix 2030
21

Trade flows (TWh)
22
Total net imports (+) andnet exports (-) REF ALT1 ALT2 ALT3
BEL 44 38 36 44
CZE -9 -11 -18 -7
DK-east 5 5 5 5
DK-west -2 -1 -1 -2
FIN 3 3 1 2
FRA -42 -39 -41 -43
GER -17 -29 13 -23
IRE 3 3 3 3
ITA 104 113 108 103
NED 23 26 25 22
POL -3 -4 -9 10
POR 15 16 16 14
SKO -2 -2 -2 -2
SPA -2 -8 -11 -1
SWE -41 -41 -42 -43
UKI 8 19 14 6
SWI -23 -23 -24 -23
NOR -8 -8 -8 -8
BLK -53 -53 -57 -51
BLT 11 10 9 10
AUS -13 -14 -16 -14

Installed Capacities
23

Short-run producers’ surplus per technology
24

(short-run) producers’ profits, Meuro
25
Short run producers profits, Meuro Reference Alt1 Alt2 Alt3 Alt1 Alt2 Alt3
BEL 1303 1389 1463 1500 86 160 196
CZE 2182 2230 2342 2363 48 160 181
DEN 314 309 345 378 -4 31 65
DEW 920 895 978 1058 -26 58 138
FIN 2923 2965 3149 3414 42 226 491
FRA 18341 19088 19869 21009 747 1528 2668
GER 15436 15819 15621 17099 382 185 1663
IRE 992 1448 2039 1066 456 1047 74
ITA 7689 7950 8013 8244 261 324 555
NED 2464 2481 2644 2872 17 179 408
POL 3909 3946 4025 3457 37 116 -452
POR 1529 1573 1595 1731 43 66 202
SKO 744 742 749 1182 -2 5 437
SPA 10062 10418 10605 11115 356 542 1053
SWE 6622 6710 7162 7750 88 540 1128
UKI 9296 9694 10086 10607 398 791 1311
SWI 3326 3398 3635 3763 72 309 437
NOR 6324 6448 6829 7250 124 505 926
BLK 6173 6160 6201 9192 -13 28 3019
BLT 766 774 811 867 8 45 101
AUS 3758 3823 4100 4328 66 342 571
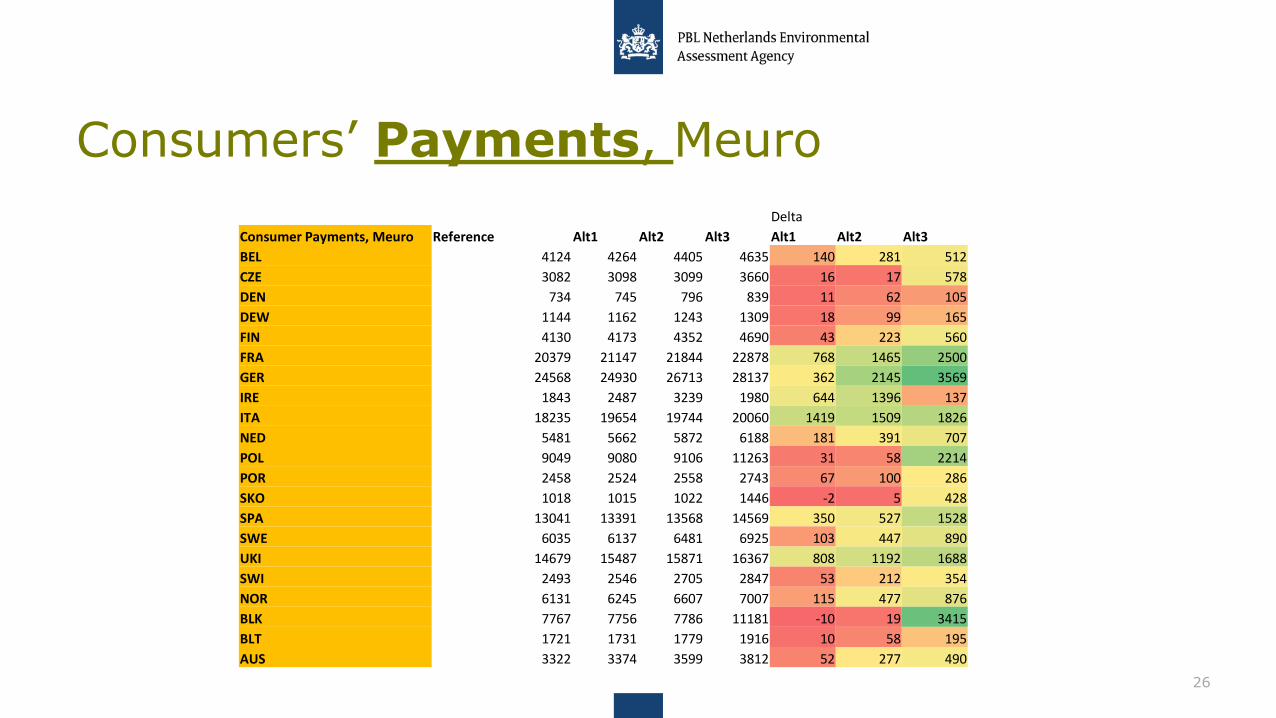
Consumers’ Payments, Meuro
26
Delta
Consumer Payments, Meuro Reference Alt1 Alt2 Alt3 Alt1 Alt2 Alt3
BEL 4124 4264 4405 4635 140 281 512
CZE 3082 3098 3099 3660 16 17 578
DEN 734 745 796 839 11 62 105
DEW 1144 1162 1243 1309 18 99 165
FIN 4130 4173 4352 4690 43 223 560
FRA 20379 21147 21844 22878 768 1465 2500
GER 24568 24930 26713 28137 362 2145 3569
IRE 1843 2487 3239 1980 644 1396 137
ITA 18235 19654 19744 20060 1419 1509 1826
NED 5481 5662 5872 6188 181 391 707
POL 9049 9080 9106 11263 31 58 2214
POR 2458 2524 2558 2743 67 100 286
SKO 1018 1015 1022 1446 -2 5 428
SPA 13041 13391 13568 14569 350 527 1528
SWE 6035 6137 6481 6925 103 447 890
UKI 14679 15487 15871 16367 808 1192 1688
SWI 2493 2546 2705 2847 53 212 354
NOR 6131 6245 6607 7007 115 477 876
BLK 7767 7756 7786 11181 -10 19 3415
BLT 1721 1731 1779 1916 10 58 195
AUS 3322 3374 3599 3812 52 277 490

Totals Congestion Rents, Meuro
27
Delta
Congestion Rent, Meuro Reference Alt1 Alt2 Alt3 Alt1 Alt2 Alt3
BEL 82 94 84 86 11 1 3
CZE 96 104 154 69 8 58 -26
DEN 13 13 16 14 0 3 1
DEW 54 68 59 53 14 4 -1
FIN 67 64 58 66 -3 -8 -1
FRA 418 483 447 438 66 30 21
GER 235 292 307 212 57 72 -23
IRE 51 102 171 52 51 120 1
ITA 645 843 743 479 198 98 -166
NED 89 121 78 77 32 -11 -12
POL 128 135 162 111 7 34 -16
POR 5 6 6 5 0 0 0
SKO 125 127 124 93 2 0 -32
SPA 142 146 142 146 4 0 4
SWE 124 123 130 125 -1 6 0
UKI 220 327 362 223 107 142 3
SWI 222 312 240 195 90 18 -27
NOR 120 144 136 116 24 16 -4
BLK 443 509 533 282 67 90 -161
BLT 53 51 46 50 -2 -7 -3
AUS 165 189 216 121 24 51 -44