Embed Size (px)
Citation preview

Buck Consultants International
The Netherlands
Phone : +31 24 379 02 22
Mobile: +31 6 24661688
Welcome to MENASA Middle East, North East Africa, South West Asia
Eelco Dijkstra
Senior Strategy Consultant
June, 2014

Buck Consultants International, 2014 1
Linking Strategy to Execution
Strategy Go to market strategy
Business Process
Design Network
Optimisation Network(re)design
Impact key drivers Procurement &
Tender
Management
Supply Chain Data, Modelling and Analysis
Management Consulting in Supply Chain
Implementation
Change mngt
support
Coaching

Volume Development Europe
Buck Consultants International, 2014 2
-
2.000
4.000
6.000
8.000
10.000
12.000
14.000
2009 2010 2011 2012 2013
Development N. European Ports in TEU
Rotterdam Hamburg Antwerpen Bremen
Where is the business going?

What’s going on?
Buck Consultants International, 2014 3
Changes to trade flows into
Europe. North European Ports
no longer only option into EMEA
Lower growth consumer
demand Northern Europe

Economic Shift from EMEA to MENASA
Economic growth within the
EMEA and Central Asia (CA)
has shifted from West to East
Buck Consultants International, 2014 4
Source: IMF 2014
Dubai’s natural catchment area
extending from UAE to
MENASA and even to being
part of a global logistics hub Growing Middle Class and
Rising Prosperity
Economic opportunities will
increase towards the
MENASA
MENASA
Population: 2,272 million (1,030 million excl.
India)
Economic growth 2013 : 5.4% (avg.)
Economic growth 2019 : 7.1% (avg.)
Russia, Belarus, Ukraine, Moldova
Population: 201 million
Economic growth 2013: 2.7% (avg.)
Economic growth 2019: 2.2% (avg.)
Europe
Population: 489 million
Economic growth 2013: 1.9% (avg.)
Economic growth 2019: 3.8% (avg.)

Trade Flow and Distribution Changes
The Middle East, Eastern Africa and the Indian region will grow naturally into its own
distribution cluster for logistics services and distribution.
Distribution for this region will gradually change from being serviced as part of the EMEA
region - typically from EDC’s in Western Europe - to having its own stand alone distribution
model in which Dubai is well positioned as logistics and distribution gateway.
Buck Consultants International, 2014 5
Future trade flows where the EMEA distribution model
will split up into new regions including the MENASA.
Traditional trade flow where goods into
the EMEA region first travel to a DC in
the EU and from there are distributed
into the region.

Replenishment will shift away from NL
Buck Consultants International, 2014 6
Western Europe
Africa
Russia & CIS
Middle East
Netherlands past 20 years distribution hub into Europe
Future direction: Inventory volumes for Russia, Eastern
Europe, Middle East, Africa will move closer to markets
Buck Consultants International, 2014 7
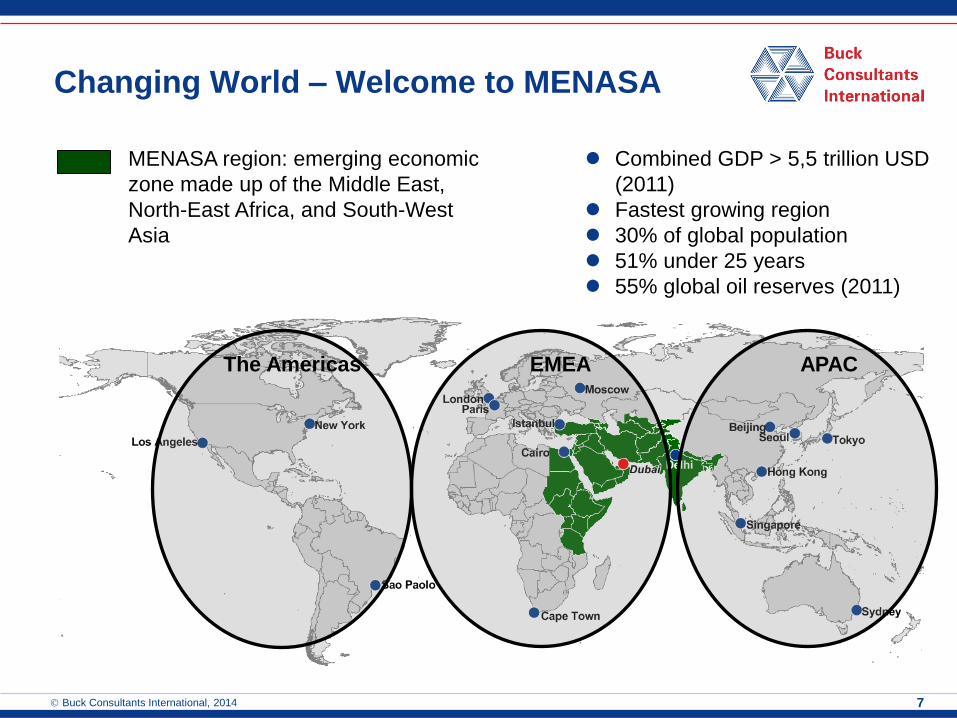
Changing World – Welcome to MENASA
Combined GDP > 5,5 trillion USD
(2011)
Fastest growing region
30% of global population
51% under 25 years
55% global oil reserves (2011)
MENASA region: emerging economic
zone made up of the Middle East,
North-East Africa, and South-West
Asia
The Americas EMEA APAC
MENASA FACTS
Buck Consultants International, 2014 8
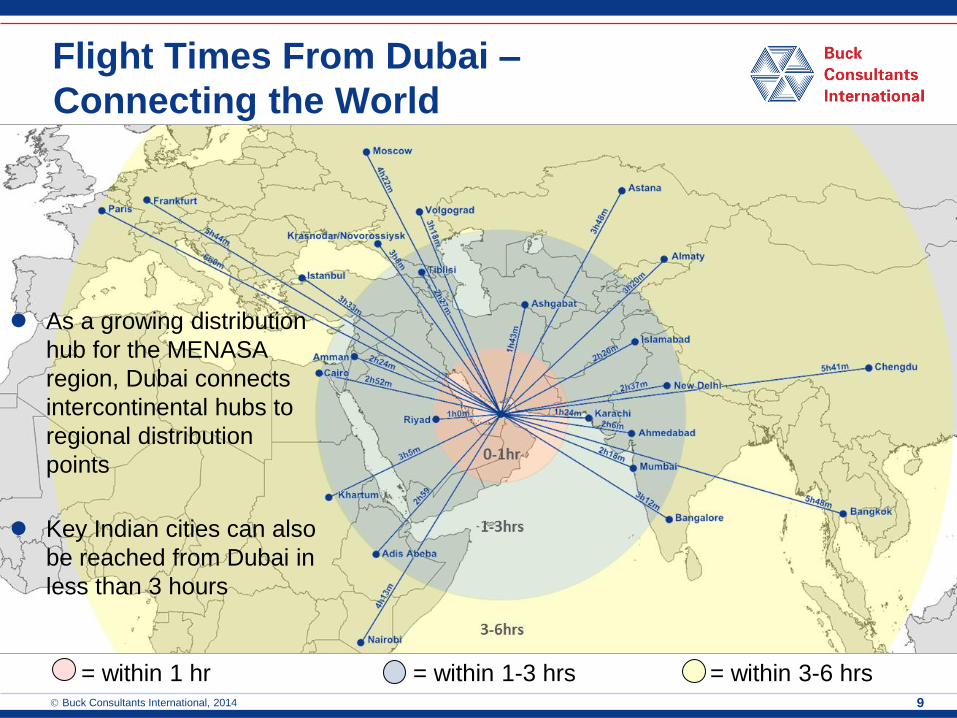
Flight Times From Dubai –
Connecting the World
As a growing distribution
hub for the MENASA
region, Dubai connects
intercontinental hubs to
regional distribution
points
Key Indian cities can also
be reached from Dubai in
less than 3 hours
Buck Consultants International, 2014 9
= within 1 hr = within 1-3 hrs = within 3-6 hrs

GDP Growth
Buck Consultants International, 2014 10
GDP growth to 2019
Source: Worldbank 2014
*
0%
1%
2%
3%
4%
5%
6%
7%
8%
MENA KSA UAE TR RU BR NL IN FR E-AFT
MENASA accounted for 9% of total world GDP in 2013
This will increase to 10% by 2019
MENASA economic growth outpaces developed economies and even “older”
emerging markets like Turkey, Brazil and Russia.

Top 10 Cargo Airports in the World
Buck Consultants International, 2014 11
Source: CAPA, 2013
0
500.000
1.000.000
1.500.000
2.000.000
2.500.000
3.000.000
3.500.000
4.000.000
4.500.000Millions tonnes

Dubai Largest Non Asian Sea-Port
Buck Consultants International, 2014 12
0
5
10
15
20
25
30
35
nu
mb
er
of
TE
U*
(x 1
,00
0)
* TEU = Twenty-foot Equivalent Units, 2013
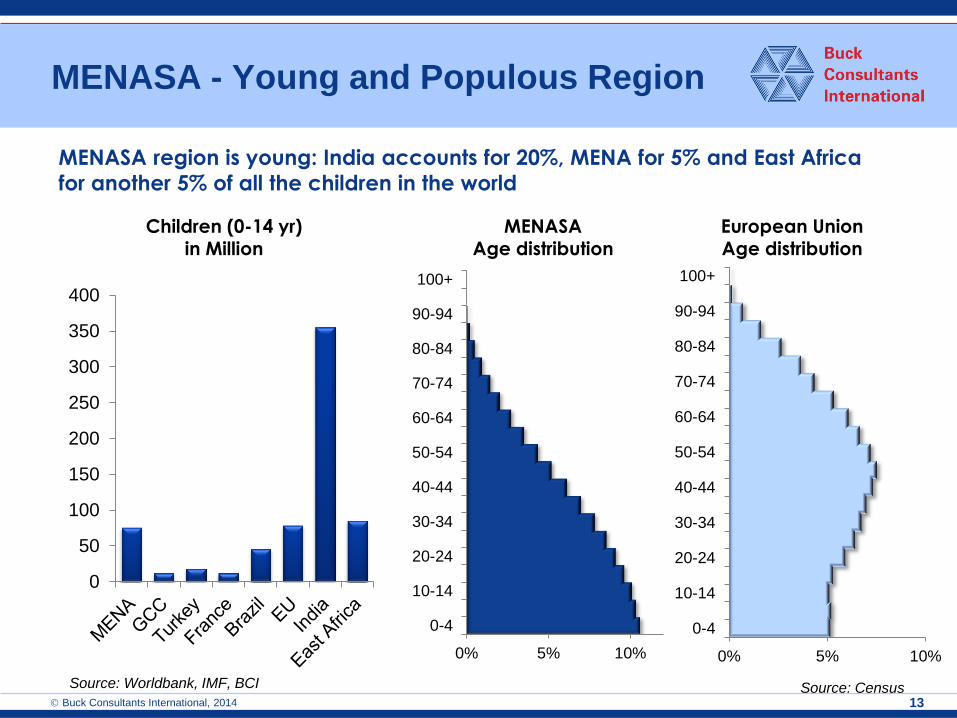
MENASA - Young and Populous Region
Buck Consultants International, 2014 13
MENASA region is young: India accounts for 20%, MENA for 5% and East Africa
for another 5% of all the children in the world
Children (0-14 yr) in Million
0
50
100
150
200
250
300
350
400
Source: Worldbank, IMF, BCI Source: Census
MENASA Age distribution
European Union Age distribution
0% 5% 10%
0-4
10-14
20-24
30-34
40-44
50-54
60-64
70-74
80-84
90-94
100+
0% 5% 10%
0-4
10-14
20-24
30-34
40-44
50-54
60-64
70-74
80-84
90-94
100+

Ease of Doing Business
Buck Consultants International, 2014 14
Doing business in United
Arabic Emirates and Saudi
Arabia is easier than in
Netherlands or France
India and East Africa has its
challenges
1
2
3
4
5
6
7
8
9
10
23
26
28
38
96
116
125
129
134
145
149
Singapore
Hong Kong
New Zealand
USA
Denmark
Malaysia
South Korea
Georgia
Norway
UK
UAE
KSA
Netherlands
France
Turkey
China
Brazil
Ethiopia
Kenya
India
Tanzania
Sudan
Ease of doing business ranking
Source: Doing business report/ World Bank 2014

Gulf Co-Operation Council GCC
Buck Consultants International, 2014 15
Our Main Focus cluster
High prosperity
Cultural similarity
Islamic sensitive
Strong international accounts
Big retail square meters
Excessive spending
Total population: 41M
Total children: 11M
Average GDP (PPP): 49K USD
Primary Focus Countries: United Arab Emirates
Kingdom of Saudi Arabia (KSA)
7,8
1,1 1,0 0,7 0,4 0,3 0,0
5,0
10,0
KSA UAE Oman Kuwait Qatar Bahrain
GCC Kids Population Mil.

PORTS AND CONNECTIVITY
Buck Consultants International, 2014 16
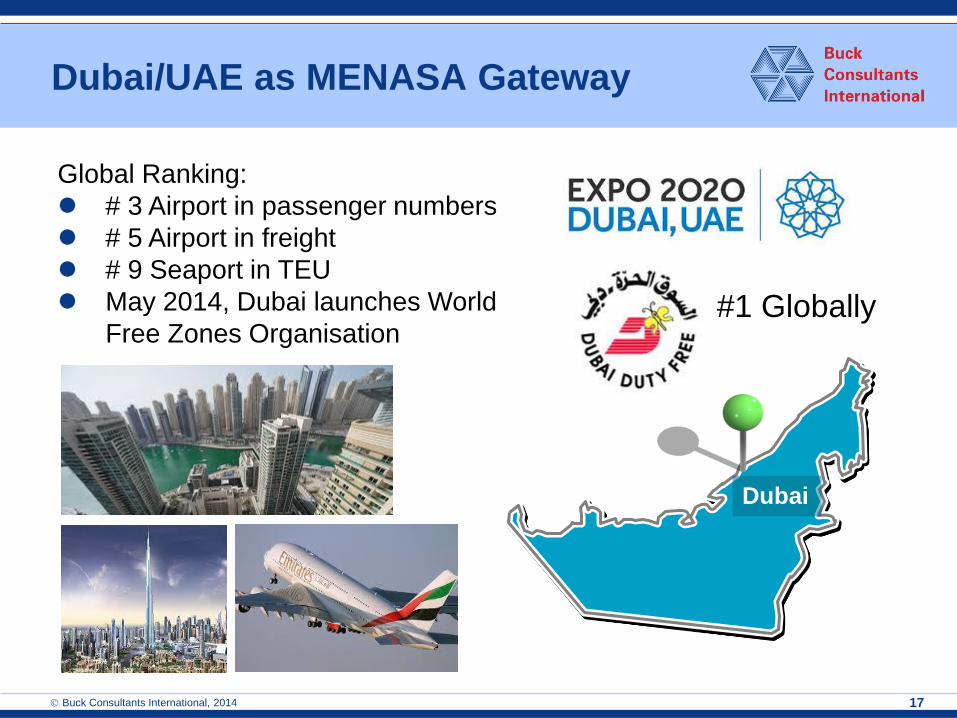
Dubai/UAE as MENASA Gateway
Buck Consultants International, 2014 17
Dubai
Global Ranking:
# 3 Airport in passenger numbers
# 5 Airport in freight
# 9 Seaport in TEU
May 2014, Dubai launches World
Free Zones Organisation #1 Globally

Strong Infrastructure Developments
Buck Consultants International, 2014 18
The countries of the Gulf
Cooperation Council (GCC)
plan to invest USD 968
billion in major projects
over the next ten years. This
investment includes 1,638
projects
Just for roads and railways,
the oil-rich countries plan to
direct $ 97 billion from 2011
to 2020, U.S. $ 79 billion for
rail, including trains,
subways and trams.
The most ambitious project,
valued at U.S. $ 30 billion, is
the railroad that will connect
all the countries of the GCC,
For roads construction,
investments are put at $ 18
billion.
Airport Seaport
Riyadh
Kuwait
Bahrai
n Doha
Jeddah
Amman Port Said
Istanbul
Bandar Abbas
Salalah
Dammam
Aden
Mersin
Alexandria Damietta
Haifa
Sohar

DISTRIBUTION
BUSINESS CASE
Buck Consultants International, 2014 19

Industry Characteristics and Trends
Buck Consultants International, 2014 20
Source: Euromonitor International
Shifts in demand
Higher GDP growth in
Middle East, South Asia
and Africa vs Europe and
US
New challenges and
opportunities in supply
set up
Demand Shift away from Matured Markets

Focus is on Accelerated Growth
Buck Consultants International, 2014 21
Business
Challenge is
how to facilitate
high growth
coming 10-20
years in
MENASA region
?
Distribution Model as
Enabler to growth: Re-assess
commercial model
region
Develop regional
inventory
replenishment point
Develop regional
distribution
capabilities with
partners

EMEA Multi Hub Distribution Concept
22 Buck Consultants International, 2014
Catchment area Central EMEA
distribution hub
Catchment area from Benelux hub
Catchment area Dubai Hub
Hubs replenished directly from
production sources

Buck Consultants International, 2014 23
Dubai as MENASA Gateway
Rotterdam
Shanghai
Dubai
Traditional route: Asia – Rotterdam/Amsterdam – EMEA DC – air or sea freight back to
Middle East for distribution
Alternative route: Asia – Dubai DC – distribution MENASA region
MENASA
Airfreight
Seafreight
Amsterdam
Dubai is located mid
way between Asia and
W. Europe.
Lead-times:
Traditional: 30-40 days
Alternative: 15-18 days
Goods via Northern
Europe travel twice
50% too far using
the traditional model

-
5
10
15
20
25
Dubai Amsterdam
Outbound
Pick DC Occupancy
Pick DC Labor
Inbound
Life Sciences: MENASA
24
Inte
gra
ted
Su
pp
ly C
ha
in C
ost in
M$
Catchment area Central
EMEA distribution hub
AMS
Hub W Europe
N America
MENASA
Region
MENASA Region
21% cost saving
DXB
Hub W Europe
N America
MENASA
Region
Buck Consultants International, 2014
Hubs replenished directly
from production sources

India from Dubai v Europe
25
ME
Hub W Europe
N America India
Weighted Ave Hub
to Market lead-time
Lead-times out of Dubai are much shorter due to the close proximity of Dubai to India. Due to cold chain
requirements much easier to manage frequent order patterns out of Dubai than out of Amsterdam (again
due to close proximity).
Holding inventory in Dubai allows companies to route orders directly to key Indian cities/states due to the
excellent connectivity between Dubai and Indian cities. Using Dubai v in-country storage allows
companies to bypass local Indian bureaucracy and infrastructure bottlenecks.
Inte
gra
ted
Su
pp
ly C
ha
in C
ost in
M$
Catchment area ME Hub
-
1
2
3
4
5
6
7
Dubai Amsterdam
Outbound cost
Pick DCOccupancy
Pick DC Labor
Inbound cost
33%
lower
Buck Consultants International, 2014

Take Aways
• Dynamics of the EMEA region is changing due to upcoming Emerging
Regions and demographic changes.
• In the Healthcare sector the MENASA region will show HIGH growth
as more and more people get access to doctors, medicines and
hospital care.
• Accelerated growth model requires ability to fulfil orders quickly and
more frequently whilst managing distribution costs. Holding an
inventory point in the region in combination with postponement
concepts will support growth model.
Buck Consultants International, 2014 26

Contact details
Buck Consultants International
Eelco Dijkstra
Senior Strategy Consultant
T: +31 24 3790222
M: +31 624661688
E-mail: [email protected]
Buck Consultants International, 2014 27

ANNEX
Buck Consultants International, 2014 28

India
Buck Consultants International, 2014 29
Delhi
Mumbai Calcutta
Population: 1,242 million (74x Netherlands)
GDP: USD 1,871 B (2.3x Neth.)
Economic growth 2013 : 5.9% (in USD)
Economic growth 2019 : 8.4% (in USD)

India: middle class driver for
retail growth
Buck Consultants International, 2014 30
2nd largest population,
forecasted to be number 1 in
2028 overtaking China
Strong developing Middle class,
expected to grow to over 300
million in 2025
Resulting in increased retail
spending. 2015: India = 7 x Dutch retail spending
Carrefour, Metro, Tesco, and
Walmart have recently entered
the Indian Market
Population (in M)
Source: Deloitte 2013, UN, IEMS, BCI
518 869
1.748
2012 2015 2020
Retail sales (in B USD)
50 100 200
325
0
500
1.000
1.500
2012 2015 2020 2025
Poor Middle class

India: growth also translates
into healthcare spending
Buck Consultants International, 2014 31
Healthcare spending is low as a
percentage of GDP compared to
other countries
Healthcare is forecasted to show
strong growth – growing to
US$ 276 Billion in 2020
79
100
160
276
0
100
200
300
2012 2015 2017 2020
Healthcare spending (in B USD)
Source: Worldbank 2014, IBEF 2014, BCI
18%
10% 10% 9%
6% 4%
0%
5%
10%
15%
20%
US EU World Brazil Turkey India
Healthcare as percentage of GDP (2012)
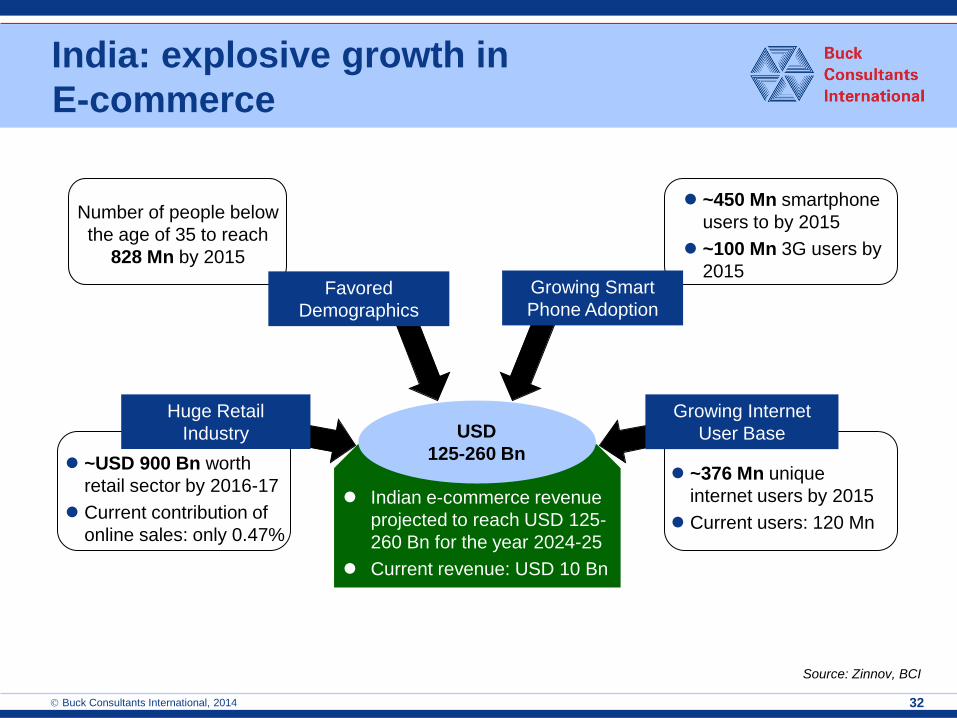
India: explosive growth in
E-commerce
Buck Consultants International, 2014 32
Indian e-commerce revenue
projected to reach USD 125-
260 Bn for the year 2024-25
Current revenue: USD 10 Bn
Number of people below
the age of 35 to reach
828 Mn by 2015
~450 Mn smartphone
users to by 2015
~100 Mn 3G users by
2015
~376 Mn unique
internet users by 2015
Current users: 120 Mn
~USD 900 Bn worth
retail sector by 2016-17
Current contribution of
online sales: only 0.47%
Huge Retail
Industry
Favored
Demographics
Growing Smart
Phone Adoption
Growing Internet
User Base USD
125-260 Bn
Source: Zinnov, BCI