Embed Size (px)
Citation preview

NOCET-2011
Welcome to Black Diamond PC
Presentation
NOCET-2011
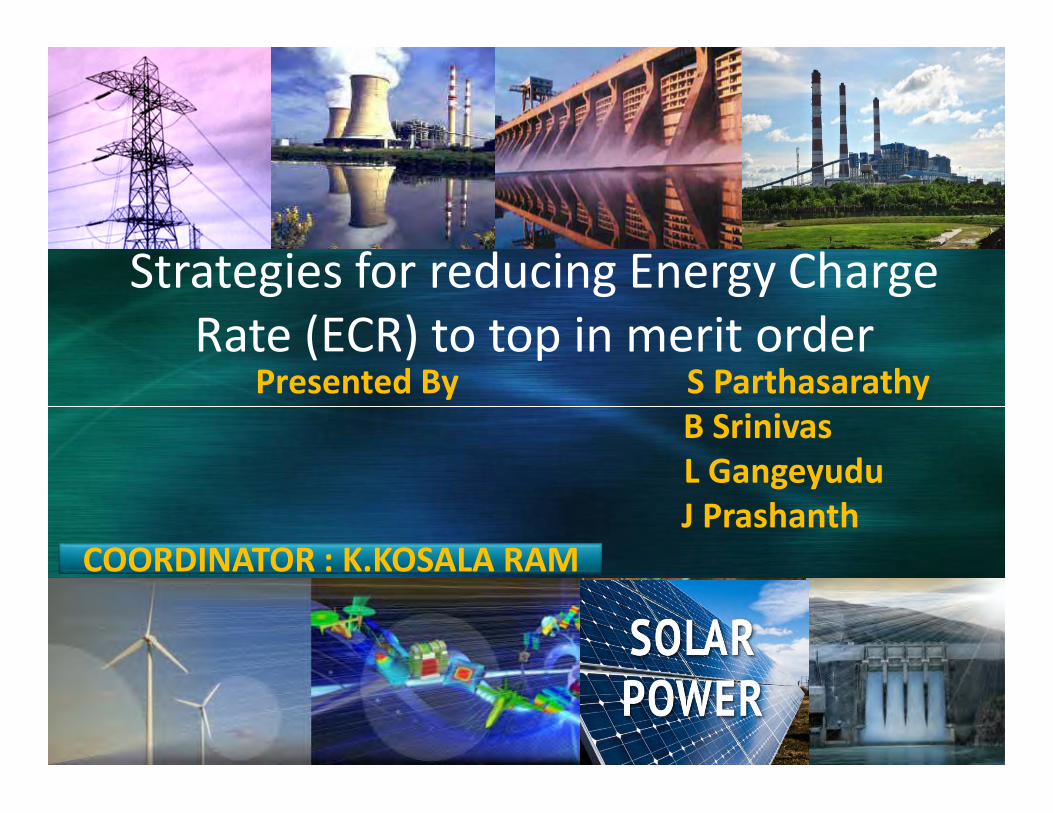
Strategies for reducing Energy Charge Rate (ECR) to top in merit order
Presented By S ParthasarathyB SrinivasL GangeyuduJ Prashanth
COORDINATOR : K.KOSALA RAM

Conclusion
Strategies to reduce ECR
Sensitivity Analysis
RSTPS Scenario
Fixed Cost and Variable Cost
Introduction : Tariff Components
Ramagundam

TARIFF COMPONENTS
Capacity Charges (Annual Fixed Cost)
Energy Charges ( Variable Cost )
Ramagundam

RETURN ON EQUITY
INTEREST ON LOAN CAPITAL
DEPRECIATION
INTEREST ON WORKING CAPITAL
O&M COST
CAPACITY CHARGE/ FIXED COST
Ramagundam

Variable Cost/ Energy Cost
Primary + Secondary Fuel cost
On ex-power plant basis
Paid by beneficiary for SG based on Normative parameters as ECR
Ramagundam

TO RANK IN MERIT ORDER
TO GET LOAD SCHEDULE
The merit order is a ranking of power stations, based on ascending order of their variable cost of generation.
Those with the lowest ECR rates are the first ones to be brought online to meet demand, and the plants with the highest ECR rates are the last to be brought on line
The rapid expansion of intermittent renewable energy sources, like Solar and Wind resulted in backing down base load station

LEADS TO…..
HIGH VARIABLE
COSTLEADS TO….
MAX THERMAL
BAKING/URS
HUGELOSSES/ MORE OPERATIONAL COMPLEXITIES
EFFECTS OF HIGH VARIABLE COST
Ramagundam

Ramagundam


FIXED COST for stage-I & 2
FIXED COST for stage-3
Source : EEMG RSTPS data
Ramagundam
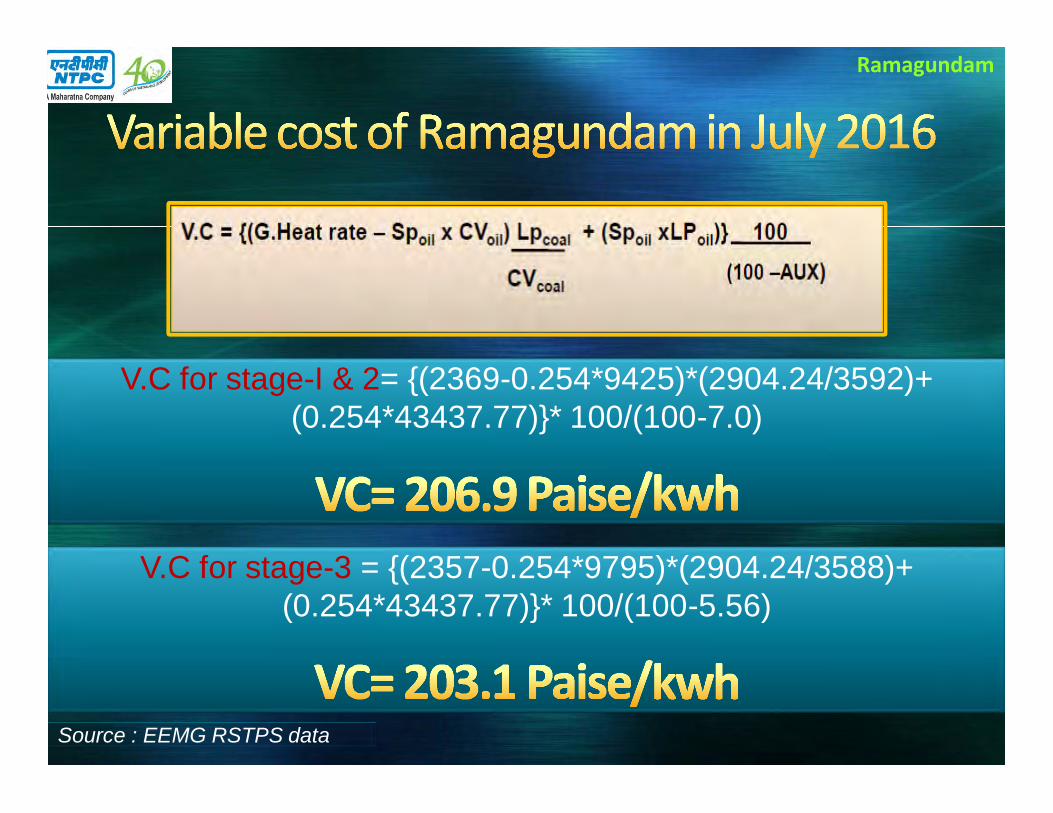
V.C for stage-I & 2= {(2369-0.254*9425)*(2904.24/3592)+ (0.254*43437.77)}* 100/(100-7.0)
V.C for stage-3 = {(2357-0.254*9795)*(2904.24/3588)+ (0.254*43437.77)}* 100/(100-5.56)
Source : EEMG RSTPS data
Ramagundam

0.000
0.500
1.000
1.500
2.000
2.500
3.000
Apr'15 May'15 Jun'15 Jul'15 Aug'15 Sep'15 Oct'15 Nov'15 Dec'15 Jan'16 Feb'16 Mar'16 apr'16 May'16 Jun-16 Jul-16
Stage-1&2 Stage-3
ECR Trend of RSTPS
Source : EEMG RSTPS data
Ramagundam

0.0
200.0
400.0
600.0
800.0
1000.0
1200.0
1400.0
Apr May Jun Jul Aug Sep Oct Nov Dec Jan Feb Mar
URS FY 2014-15 URS FY 2015-16
Source : EEMG RSTPS data
Month Apr May Jun Jul Aug Sep Oct Nov Dec Jan Feb MarURS FY 2014-15
in MU0.76 27.56 46.16 73.11 116.49 147.88 176.22 201.28 261.22 355.27 398.72 411.96
URS FY 2015-16 in MU
104.94 257.50 492.92 545.59 552.24 581.09 619.39 750.43 864.14 1071.10 1172.13 1199.46
191 % increase
URS Trend cumulative comparisionRamagundam

Major Reasons for increase in URS
Increase in Renewable Energy sources.
Rapid capacity addition
Competitive Market
Stringent CERC Regulations
Ramagundam

Southern Grid Installed capacity Comparision( 2012 Vs 2016)
Source : SRLDC
Installed capacity as on 31.07.2012
37 % increase in
installed capacity with in 4 years.
Ramagundam

RSTPS Beneficieries RSTPS St.I & II (U-1 to U-6) RSTPS St.III (U-7)
Installed Capacity @ 2100 500APTRANSCO 14.51 15.28KPTCL 22.68 23.80KSEB 11.67 12.20TNEB 25.24 26.53TELANGANA 17.03 17.93PONDY 4.00 4.26GOA 4.76 0.00HVDC 0.11 0.00TOTAL 100.00 100.00
RSTPS POWER ALLOCATION W.E.F 06.11.2015
Ramagundam

RSTPS MERIT ORDER AUG-2016
Ramagundam

RSTPS MERIT ORDER AUG-2016
Ramagundam

OUR TARGET IS TO TOP IN MERIT ORDER
In the present scenario, toremain in the competitivemarket, our aim shouldalways be to top in the meritorder, so that we get fullschedules.
Profit can be maximized .
Ramagundam

SENSITIVITY ANALYSIS
BRAINSTORMING
LITERATURE REVIEW & CASE
STUDIES
Ramagundam

Source : EEMG RSTPS data
0
5
10
15
20
25
25 50 75 100 125 150 175 200 225 250
1.94.1
6.38.4
10.612.8
15.017.1
19.321.5
Variable cost saving(Paisa/Kwh) Vs improving Heat rate
Ramagundam

Source : EEMG RSTPS data
02468
10121416
30 60 90 120 150 180 210 240 270 300
1.73.3
5.06.6
8.29.8
11.312.9
14.315.8
Reduction of Variable Cost Vs Improving of GCV
Improving GCV (Kcal/Kg)
Varia
ble
cost
savi
ng(P
aisa
/Kw
h)
Ramagundam

Source : EEMG RSTPS data
0
5
10
15
20 40 60 80 100 120 140 160 180 200
1.42.8
4.25.6
7.08.5
9.911.3
12.714.1
Variable cost saving(Paisa/Kwh) Vs reduction in coal cost
Reducing coal cost (Rs/MT)
Varia
ble
cost
savi
ng(P
aisa
/Kw
h)
Ramagundam

Source : EEMG RSTPS data
0
1
1
2
2
3
0.10 0.20 0.30 0.40 0.50 0.60 0.70 0.80 0.90 1.00
0.20.4
0.60.9
1.11.3
1.51.7
1.92.2
Variable cost saving(Paisa/Kwh) Vs reduction in APC
Reducing APC (in %))
Varia
ble
cost
savi
ng(P
aisa
/Kw
h)
Ramagundam

0
0
0
1
1
0.05 0.10 0.15 0.20
0.20.3
0.5
0.7
Variable cost saving(Paisa/Kwh) Vs reducing SOC
Reducing SOC (ml/Kwh)
Varia
ble
cost
savi
ng(P
aisa
/Kw
h)
Source : EEMG RSTPS data
Ramagundam

1900
1950
2000
2050
2100
2150
2200
2250
2300
2350
2400
300 325 350 375 400 425 450 475 500
Kcal
/kw
h
Kcal
/kw
h
Load (MW)
Turbine Heat Rate
Cycle Heat Rate
Source : EEMG RSTPS data 500 MW units
Ramagundam

2000
2100
2200
2300
2400
2500
2600
208161
143
2433 25052597
Load Vs Heat Rate
Heat Rate
Source: EEMG- NTPC RSTPS Case Study 200 MW
Ramagundam

6.00
7.00
8.00
9.00
10.00
11.00
208161
143
8.499.53 10.26
APC
APC
Source: EEMG- NTPC RSTPS case study 200 MW
Ramagundam

Fuel cost and Fuel GCV is having more sensitivity compared to Heat Rate and APC
What are the New
technologies to reduce variable
cost of generation??
How to minimize Heat
rate??
How to reduce APC ??
How to reduce fuel cost ??
Ramagundam

Reducing variable
cost
Reducing Coal Cost
Ramagundam

Rationalizing Coal linkage
Reducing Transportation cost-using NTPC rakes, reducing MGR expenses
Reducing Demurrage Charges
Coal conveyor technology
Ramagundam

Mahanadi Coalfields Limited
(MCL) ( 5LMT) Singareni colleriesCompany Ltd.
Case Study Of RSTPS REDUCING FUEL COST
0.73 Rs/Unit
DUE TO COAL MINE SWAPPING FROM
VARIABLE COST OF GENERATION REDUCED
South Eastern Coal (SECL)
( 5LMT)Singareni Colleries
Company Ltd..
0.50 Rs/Unit
0.72 Rs/Unit 0.50
Rs/Unit
22.5Paisa/ Unit
Ramagundam

Case Study Of RSTPS REDUCING FUEL COST
50 paise/Unit
60 paise/Unit
OPTIMISING FREIGHT RAKE BY TRIPARTITE AGREEMENT
VARIABLE COST OF GENERATION REDUCED
Reduced Freight Charge
NTPC
Railway
SCCL
Ramagundam

Ramagundam

REDUCING FUEL COSTGETTING COAL FROM SOURCES WITH LOW LANDED COST
Ramagundam
Sl No Source ROUTE Station GradeGCV
(Mid Value)(Kcal/Kg)
Coal-Notified Price
( Rs/MT)
Coal Value( Rs/MT)
Railway freight /
MGR price(Rs/MT)
Total Landed price
(RS/MT)
Landed Price (Rs) /1000
Kcal
1 SCCL - FSA OC 3-GDK MGR-RLY RDM G13 3,550 800.00 1,732.05 49.38 1,781.43 0.50
2 SCCL - FSA OC 3-GDK MGR RDM G13 3,550 800.00 1,732.05 53.10 1,785.15 0.50
3 SCCL – MOU OC 3-GDK MGR-RLY RDM G13 3,550 960.00 1,943.04 49.38 1,992.42 0.56
4 SCCL – MOU OC 3 MGR RDM G13 3,550 960.00 1,943.04 53.10 1,996.14 0.56
5 SCCL - FSA OC 3 MGR RDM G11 4,150 1,300.00 2,391.39 53.10 2,444.49 0.59
6 SCCL- FSA OC 3-GDK MGR-RLY RDM G10 4,450 1,610.00 2,800.18 49.38 2,849.56 0.64
7 SCCL- FSA OC 1 MGR RDM G10 4,450 1,610.00 2,800.18 53.10 2,853.28 0.64
8 SCCL- FSA Mandamarri RLY RDM G11 4,150 1,300.00 2,430.34 248.26 2,678.60 0.65
9 SCCL- FSA Kothagudem RLY RDM G13 3,550 800.00 1,883.86 450.00 2,333.86 0.66
10 SCCL - MoU OC 3 MGR RDM G11 4,150 1,560.00 2,734.25 53.10 2,787.35 0.67
11SCCL- FSA Mancherial (SRP) RLY RDM G9 4,750 1,730.00 3,073.46 248.26 3,321.72 0.70
12 SCCL- MoU Kothagudem RLY RDM G13 3,550 960.00 2,094.86 450.00 2,544.86 0.72
13 SCCL- MoU Mandamarri RLY RDM G11 4,150 1,560.00 2,773.21 248.26 3,021.47 0.73
14 SCCL- MoU OC 3-GDK MGR-RLY RDM G10 4,450 1,932.00 3,224.80 49.38 3,274.18 0.74
15 SCCL- MoU OC 1 MGR RDM G10 4,450 1,932.00 3,224.80 53.10 3,277.90 0.74
16 SCCL- FSA Manuguru RLY RDM G9 4,750 1,730.00 2,997.38 519.00 3,516.38 0.74
17SCCL- MoU Mancherial (SRP) RLY RDM G9 4,750 2,076.00 3,529.73 248.26 3,777.99 0.80
18 Imported coal RLY RDM G6 5,700 3,077.37 3,588.18 1,051.16 4,639.34 0.81
19 SCCL- MoU Manuguru RLY RDM G9 4,750 2,076.00 3,453.66 519.00 3,972.66 0.84
20 SCCL- FSA Manuguru RLY RDM G7 5,350 2,600.00 4,144.63 519.00 4,663.63 0.87
21 SCCL- MoU Manuguru RLY RDM G7 5,350 3,120.00 4,830.35 519.00 5,349.35 1.00
22 SCCL- FSA OC 2 MGR RDM G10 4,450 1,610.00 4,519.16 53.10 4,572.26 1.03
Landed price comaprison SCCL coal vis-a-vis CIL/Imported coal