Embed Size (px)
Citation preview
WEKA: Evaluation. Knowledge flow
Lab 4
Lab outline
• Evaluation metrics in WEKA Explorer
• Knowledge flow interface
• Generating ROC curves in Knowledge flow interface
WEKA: evaluation metrics
• Open WEKA
• Open file “adult_income.arff”

Evaluation options
?
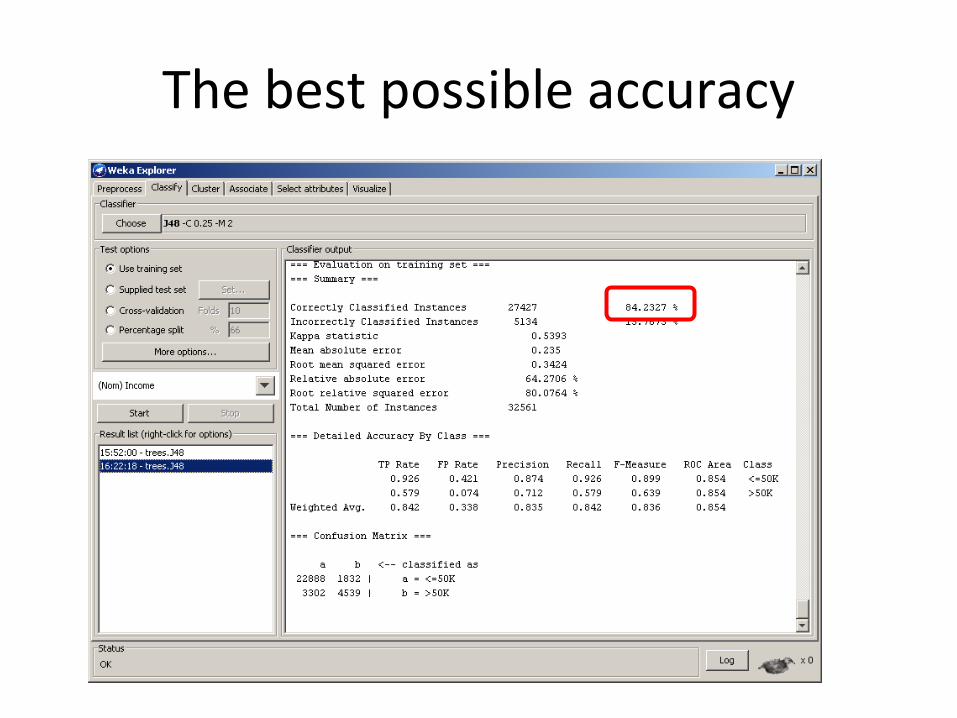
The best possible accuracy
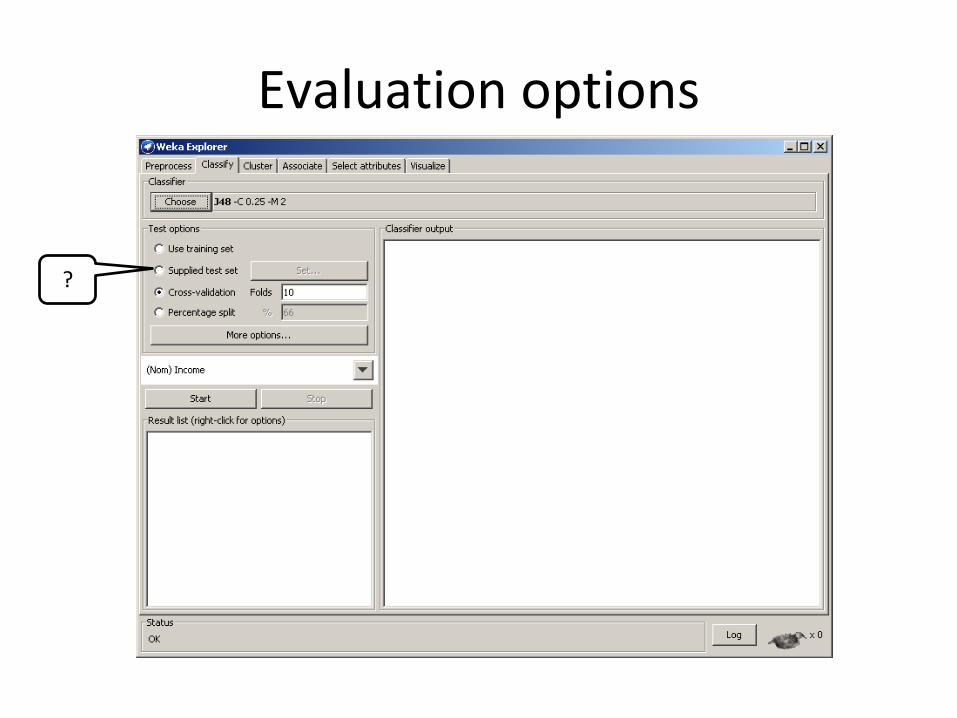
Evaluation options
?

Evaluation options
?

Evaluation options
?

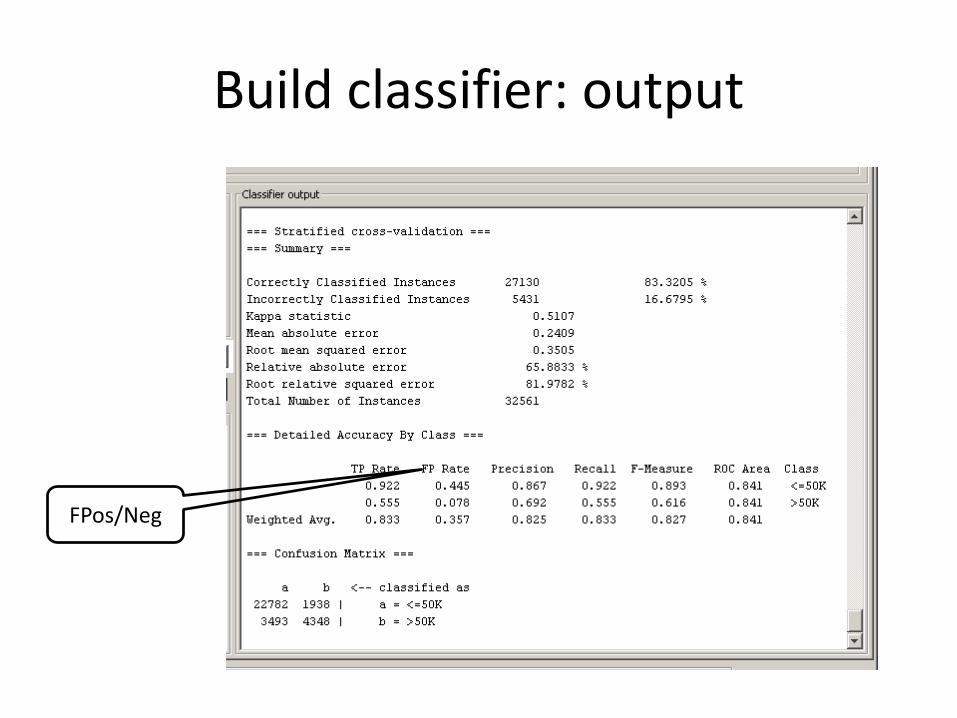
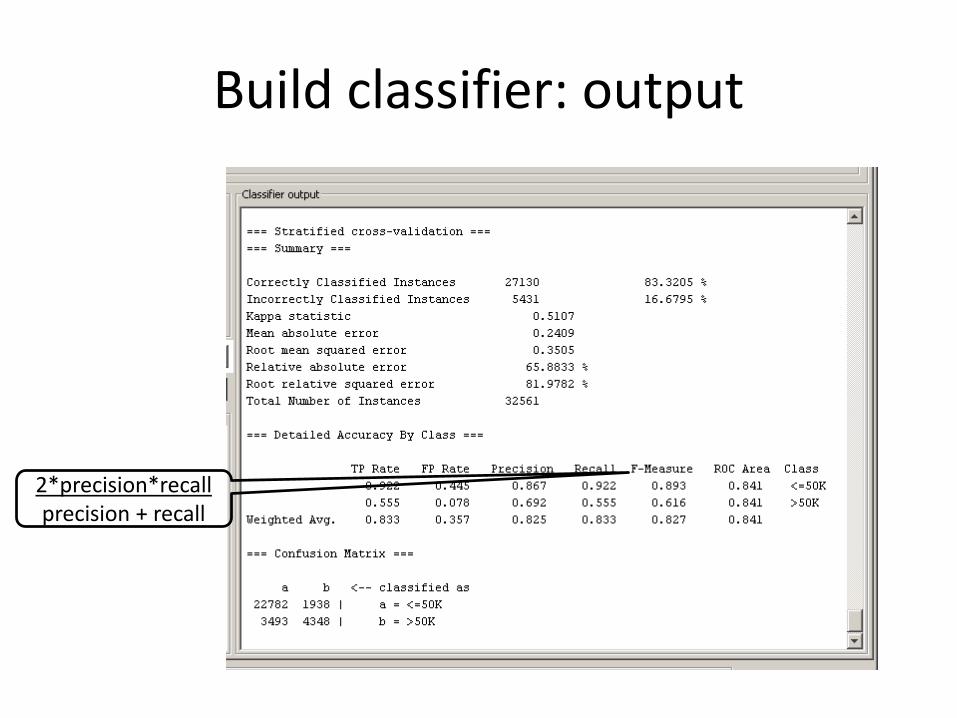
Build classifier: output
?

Build classifier: output
?
Vs. 84.23%

Build classifier: output
Your prediction is better than
random prediction
by 51%

Build classifier: output
Some per/instance
metrics

Build classifier: output
?

Build classifier: output
TPos/Pos
Build classifier: output
FPos/Neg

Build classifier: output
TPos/(Tpos+Fpos)
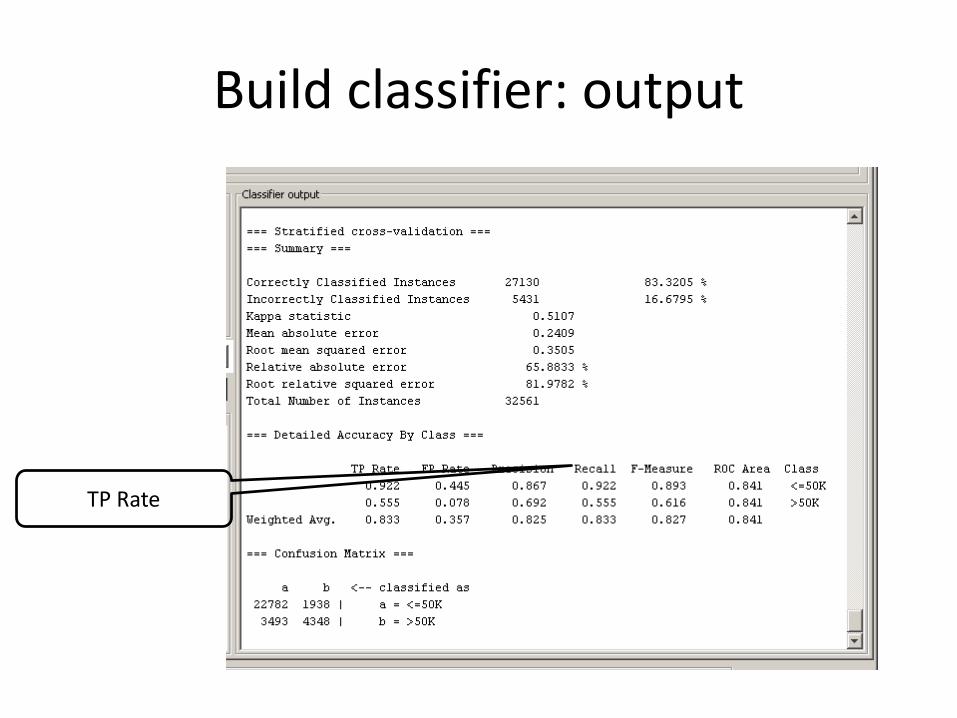
Build classifier: output
TP Rate
Build classifier: output
2*precision*recall precision + recall

Build classifier: output
Area under the ROC curve
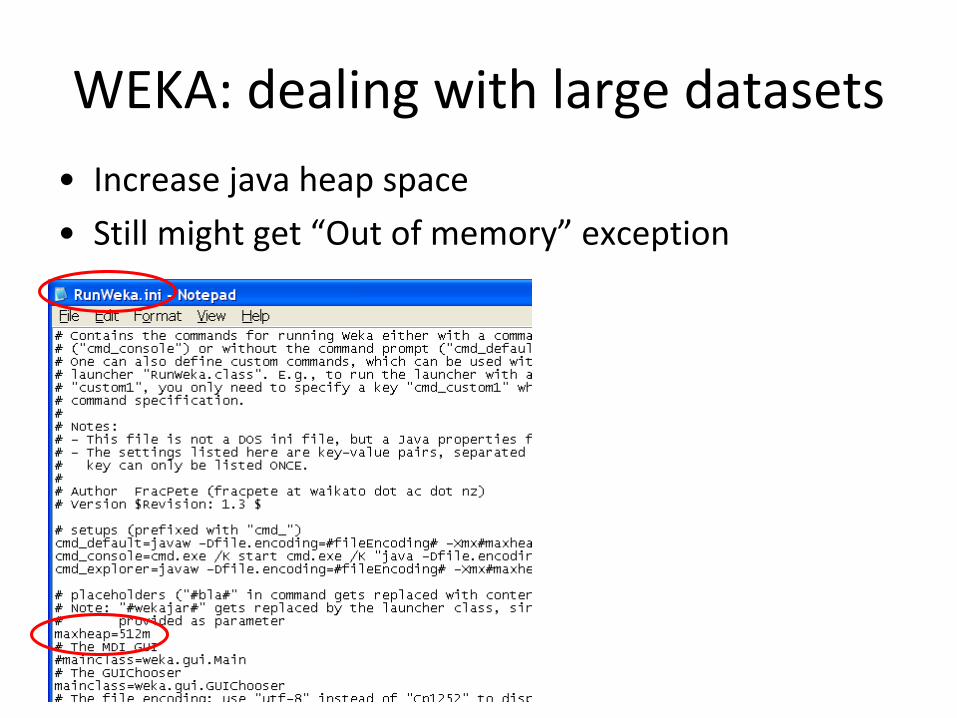
WEKA: dealing with large datasets
• Increase java heap space
• Still might get “Out of memory” exception
GUI I: WEKA Explorer and CLI
• Everything is in main memory: dataset, filter, model
• No large-scale data mining

GUI II. WEKA Knowledge Flow
• Design configuration for streamed data processing
• Specify data stream and run algorithms which stream data from one component to another
• If the algorithm allows incremental filtering and learning, data will be loaded sequentially from disk

Comparing classifiers. Knowledge flow
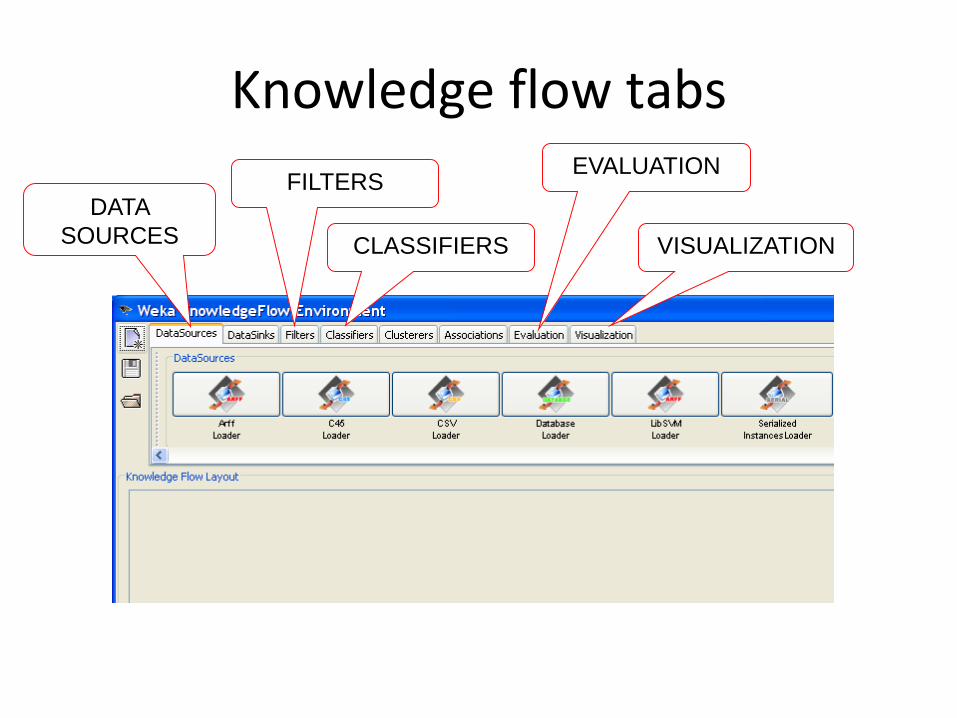
Knowledge flow tabs
DATA
SOURCES
FILTERS
CLASSIFIERS
EVALUATION
VISUALIZATION
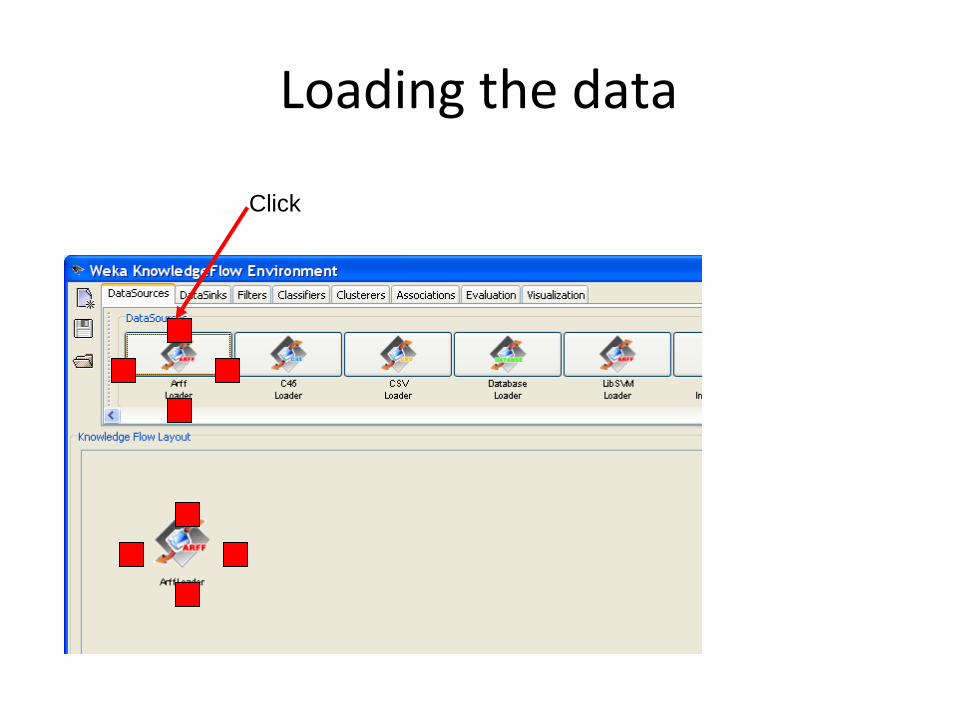
Loading the data
Click

Loading the data
Select file adult_income.arff
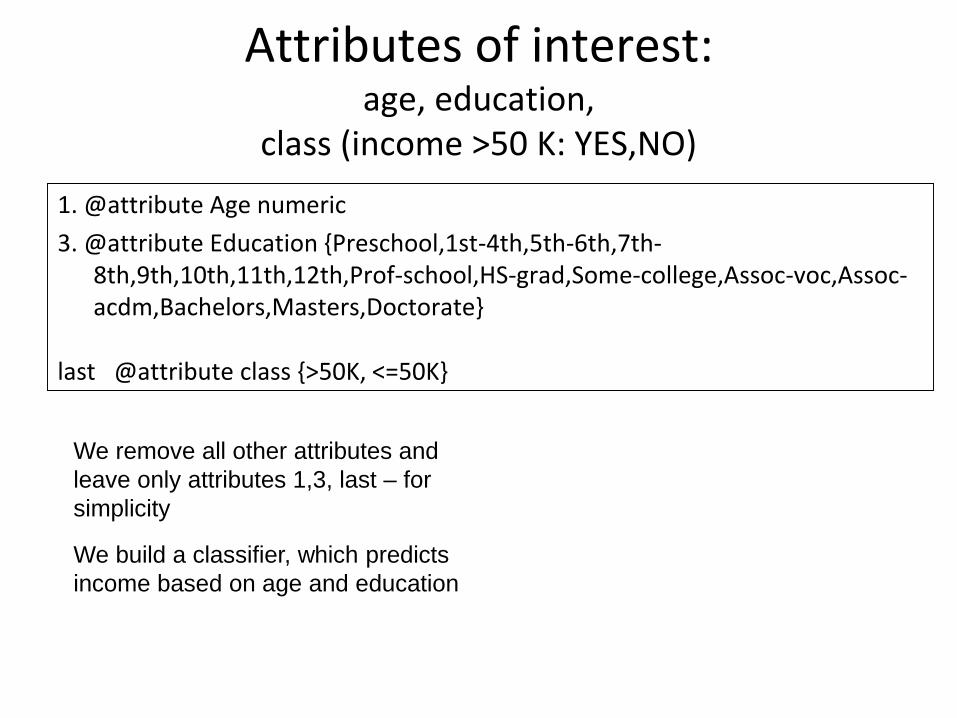
Attributes of interest: age, education,
class (income >50 K: YES,NO)
1. @attribute Age numeric
3. @attribute Education {Preschool,1st-4th,5th-6th,7th-8th,9th,10th,11th,12th,Prof-school,HS-grad,Some-college,Assoc-voc,Assoc-acdm,Bachelors,Masters,Doctorate}
last @attribute class {>50K, <=50K}
We remove all other attributes and
leave only attributes 1,3, last – for
simplicity
We build a classifier, which predicts
income based on age and education
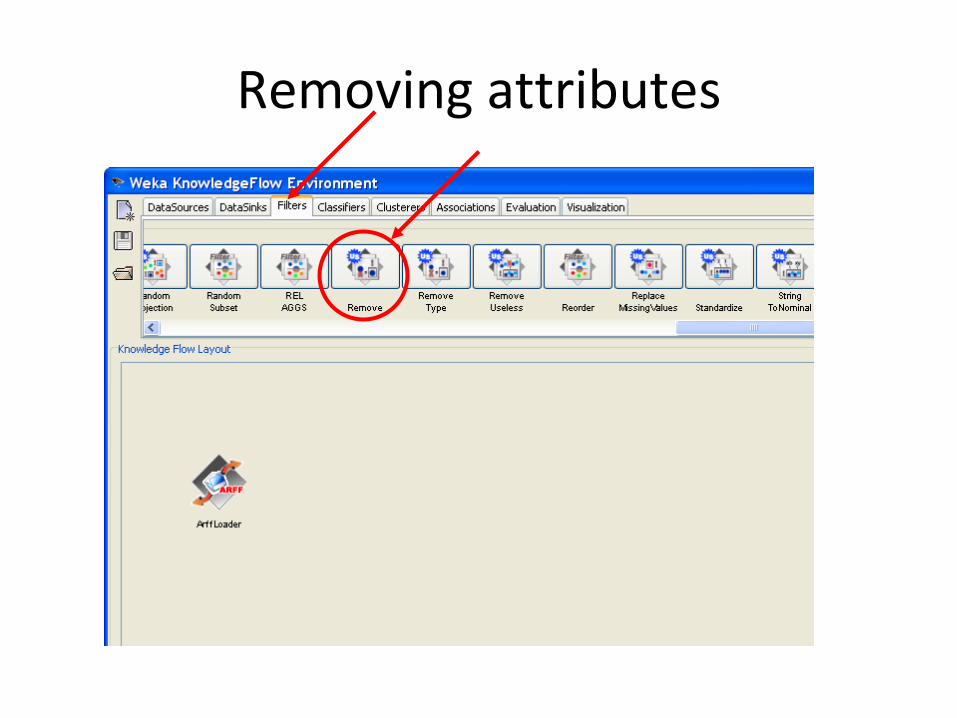
Removing attributes

Removing attributes

Removing attributes
Removing attributes
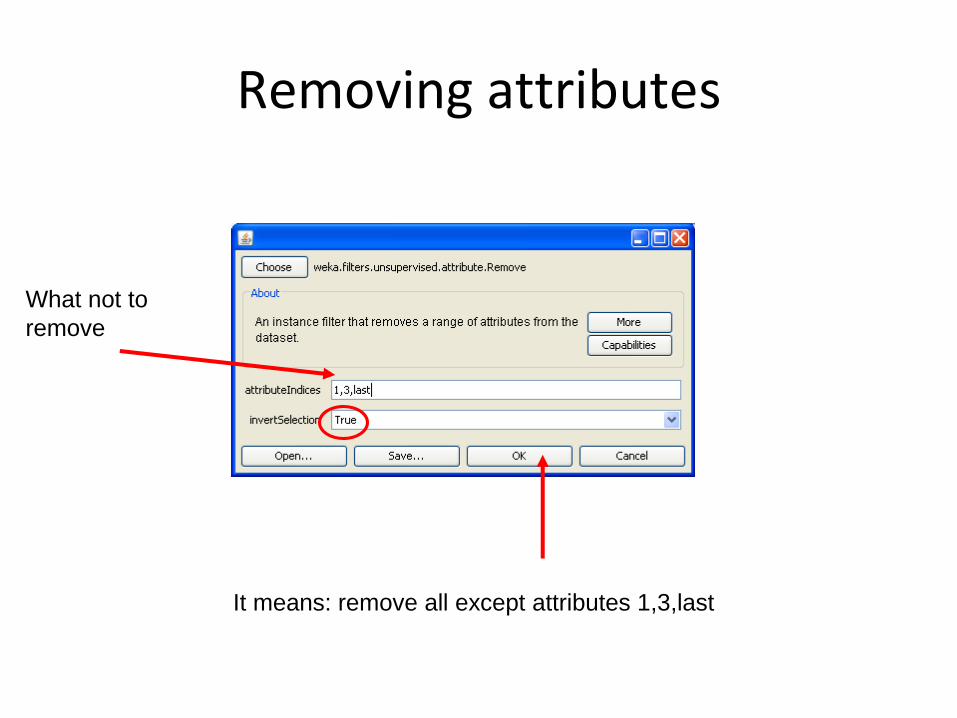
What not to
remove
It means: remove all except attributes 1,3,last
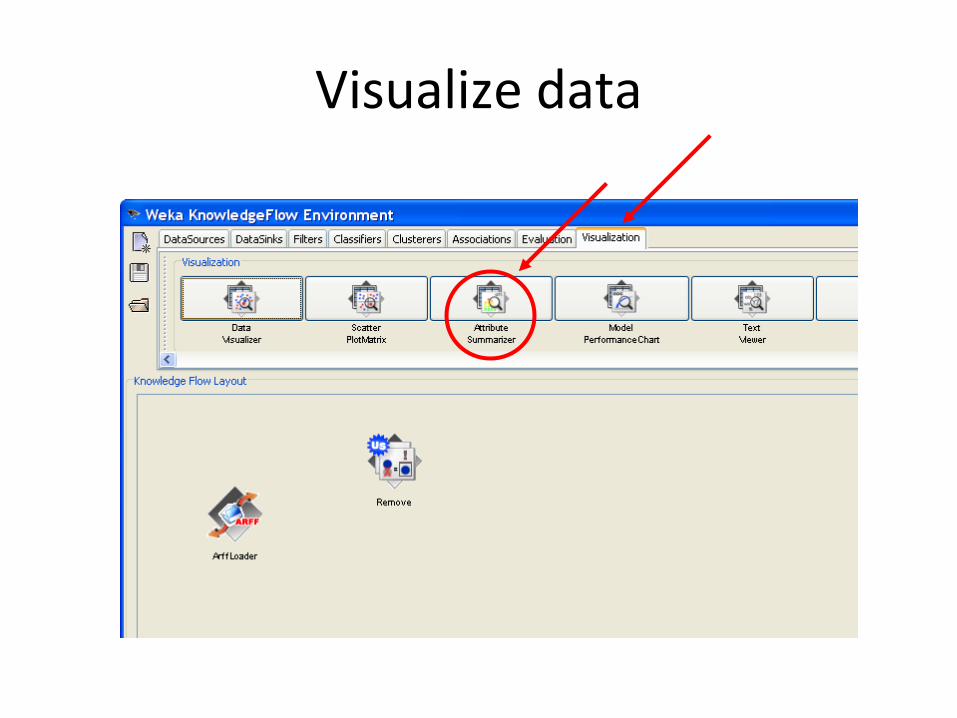
Visualize data

Visualize data

Connect the flow

Connect the flow: from data loader to attribute remover

Connect the flow: from attribute remover to summarizer
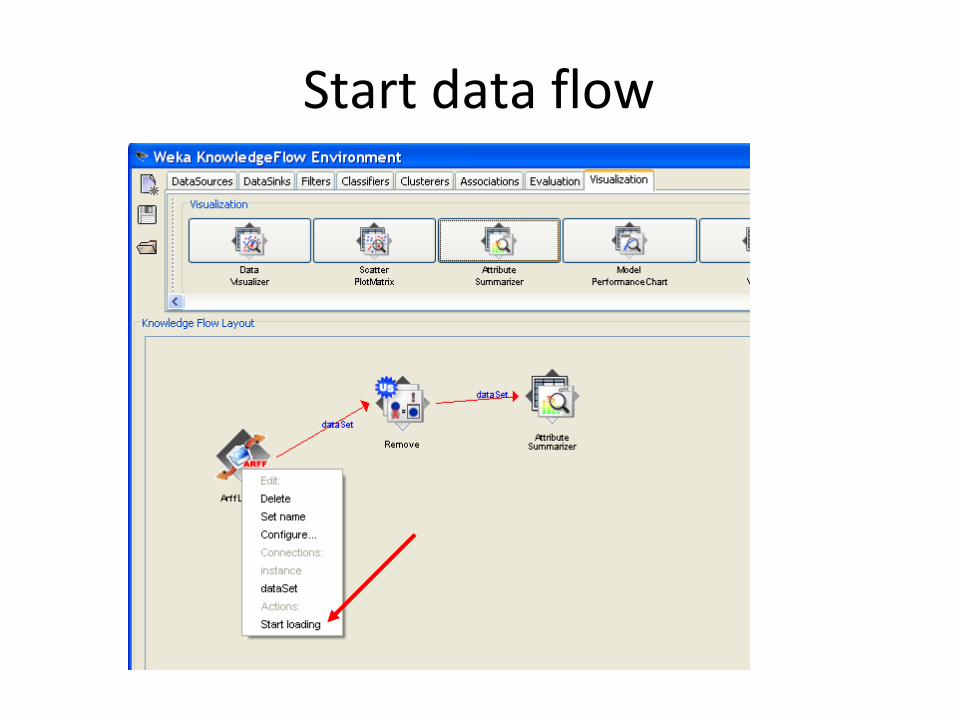
Start data flow
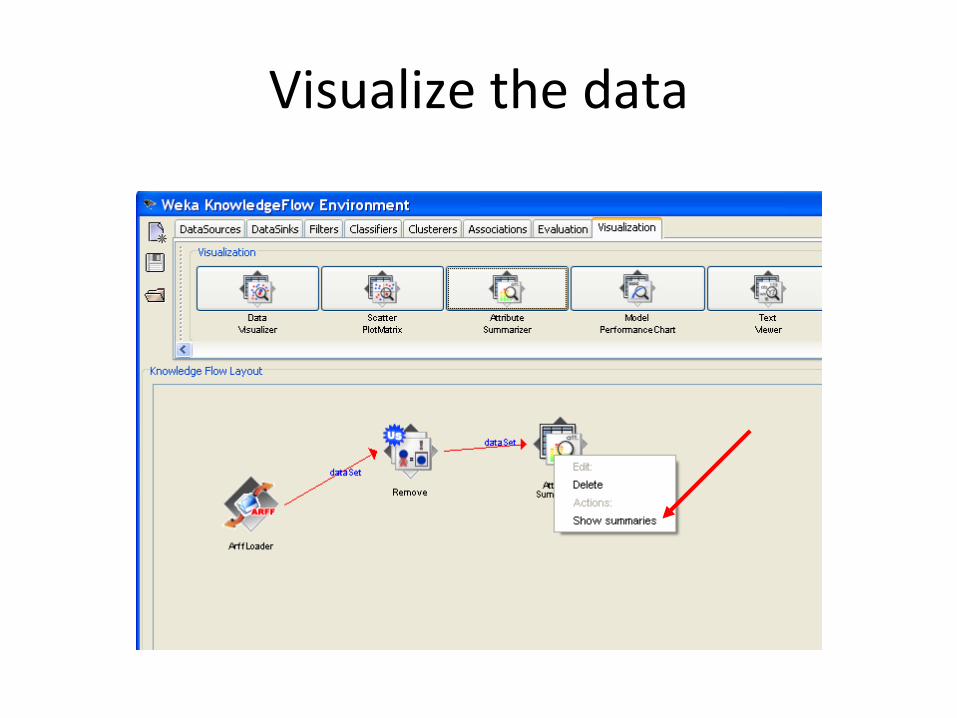
Visualize the data

Visualize the data
>50K
<=50K

Assigning the class
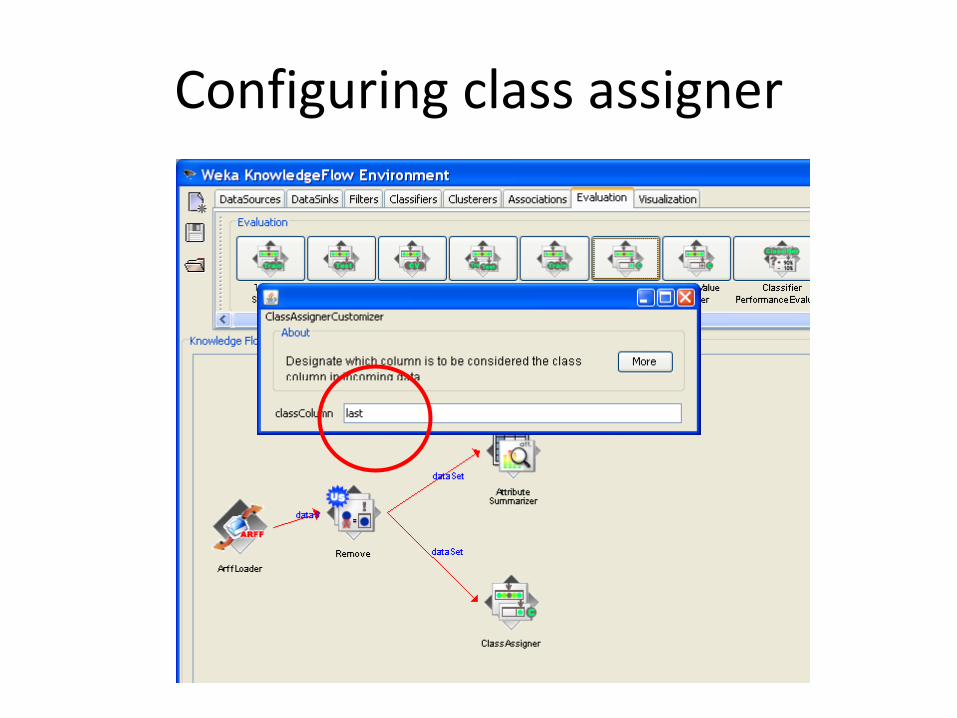
Configuring class assigner
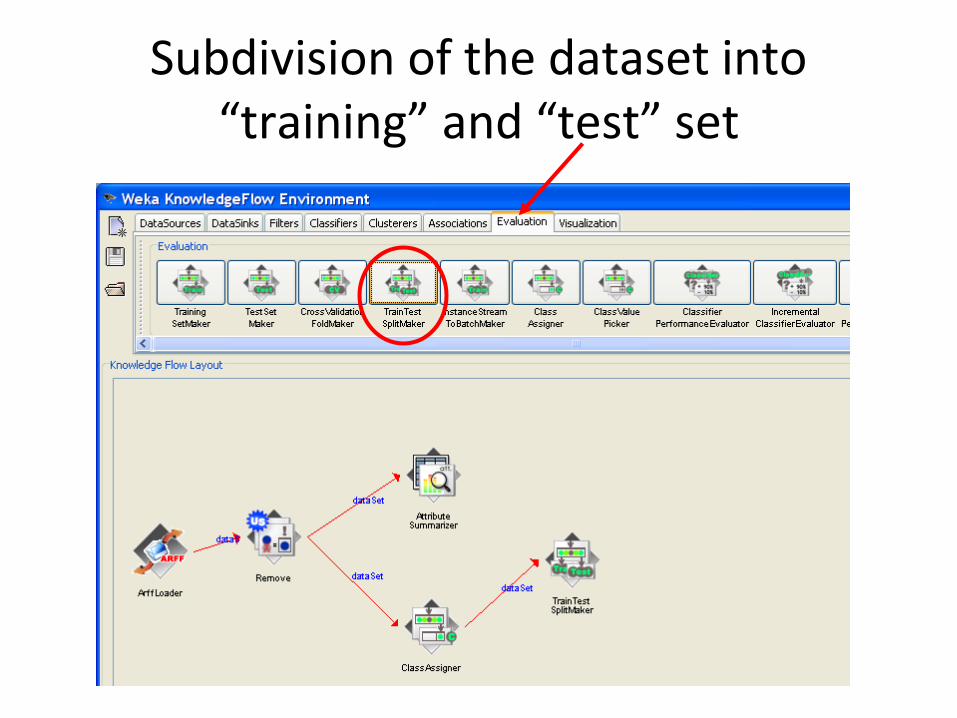
Subdivision of the dataset into “training” and “test” set

Subdivision of the dataset into “learning” and “test” set
We want to build our prediction
model on the 70% of the
whole dataset,
and test on the remaining
So, we set the TRAINTEST
SPLIT MAKER (EVALUATION)
in
the diagram and configure its
parameters.
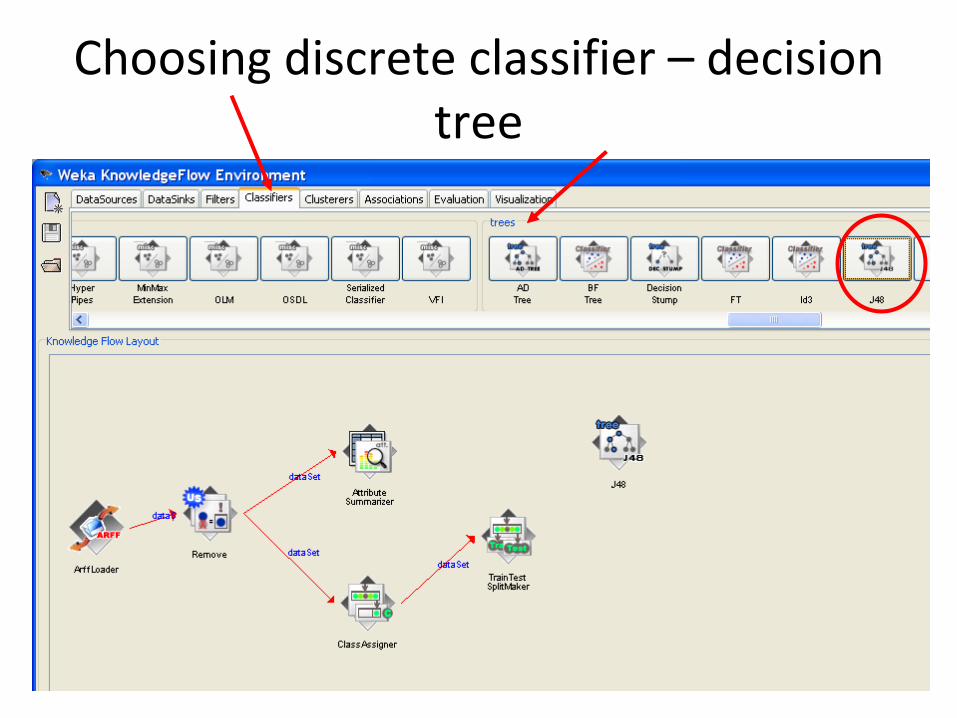
Choosing discrete classifier – decision tree

Connecting classifier to the data
We set J48
component in the
diagram,
we connect twicethe TRAIN TEST
SPLIT MAKER to this
new component:
twice because we
must use together the
training and the test
set which are
produced by the
same component.

Adding visualizer to see the classification results
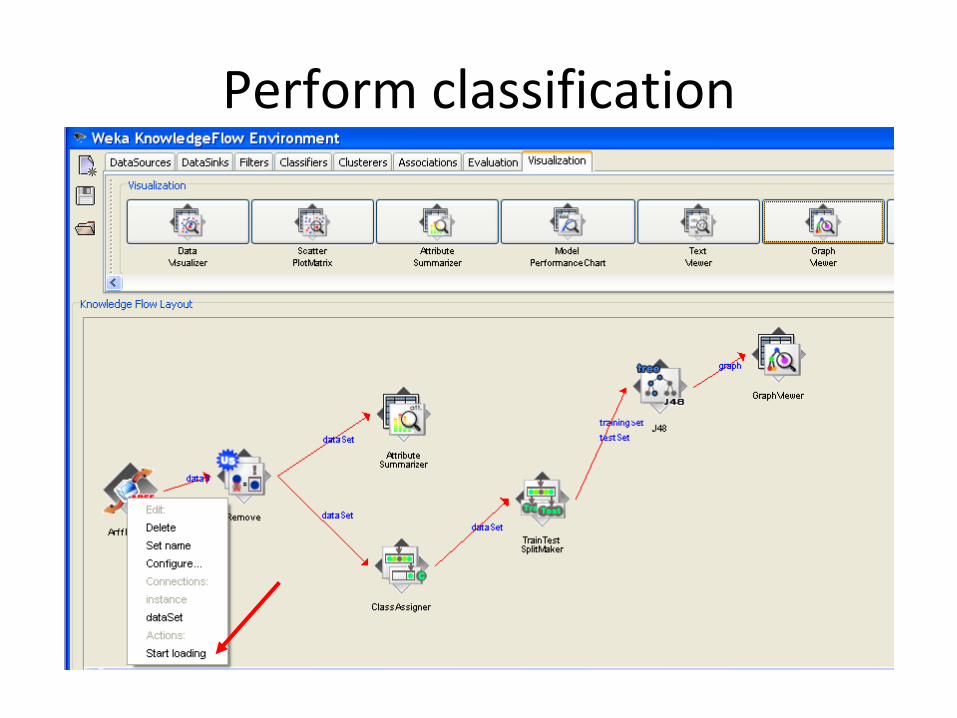
Perform classification

Show classification results (decision tree)

Classifier evaluation
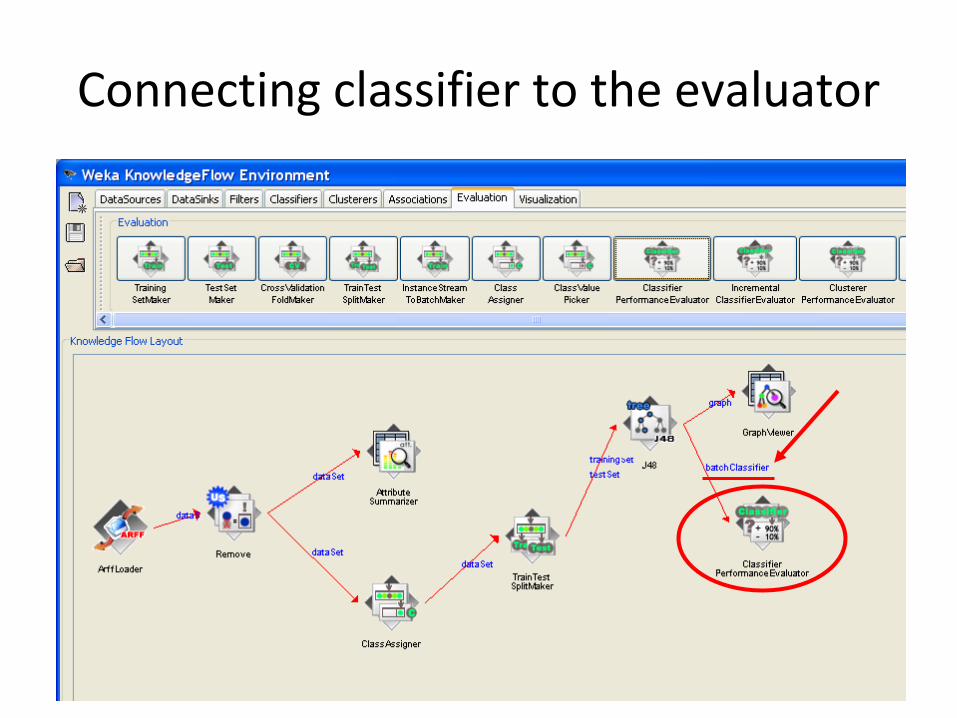
Connecting classifier to the evaluator
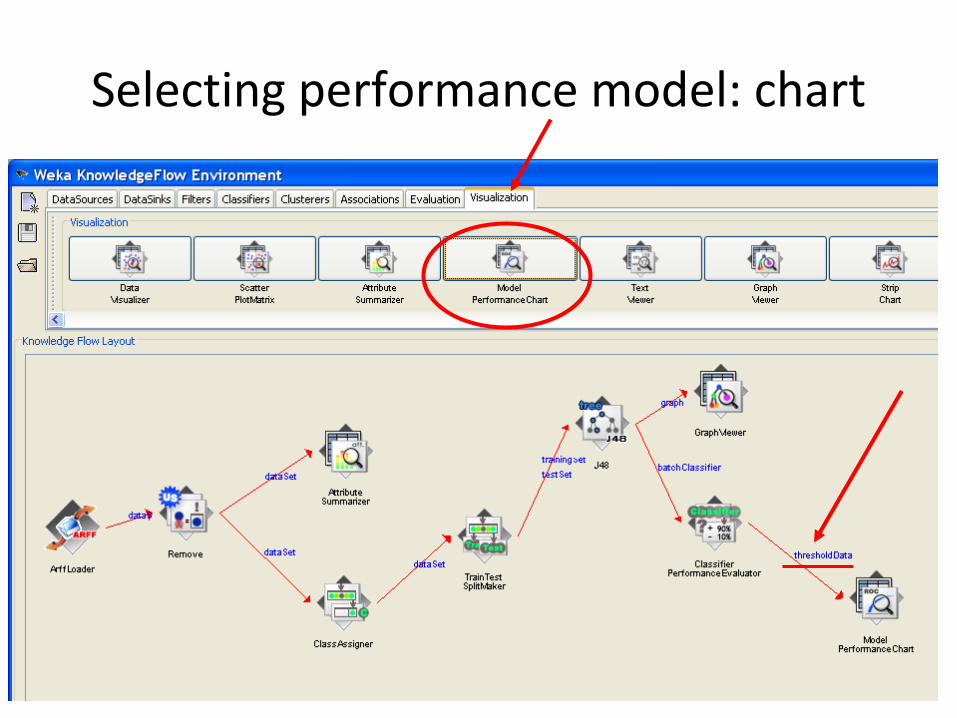
Selecting performance model: chart
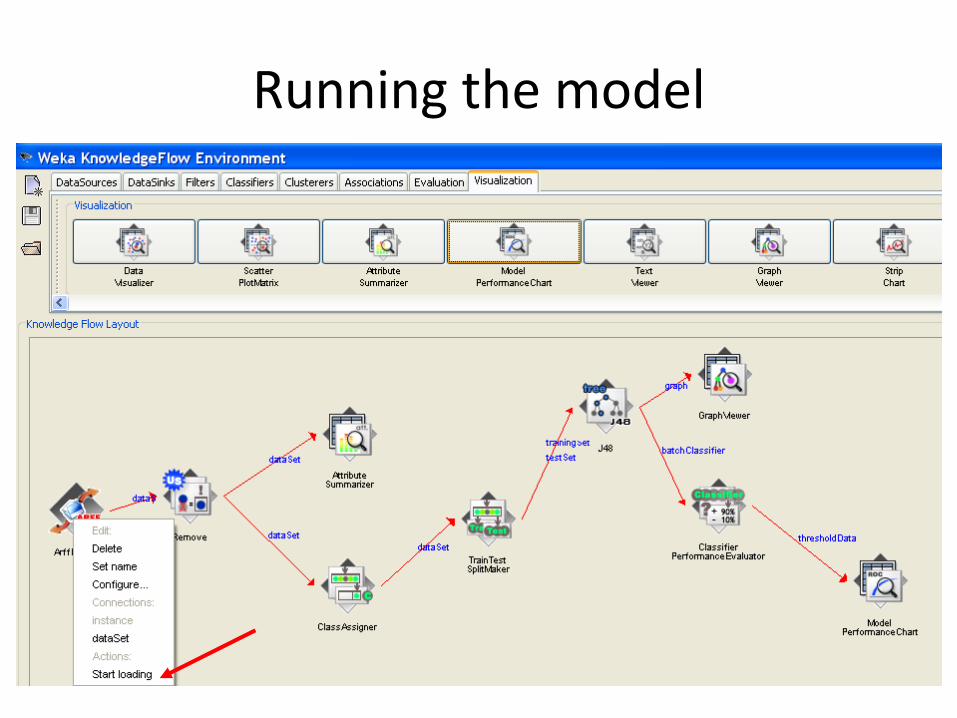
Running the model

Show chart: View ROC curve
Threshold value for dividing positives from negatives

Adding Naïve Bayes classifier

Adding separate performance evaluator for Naïve Bayes classifier
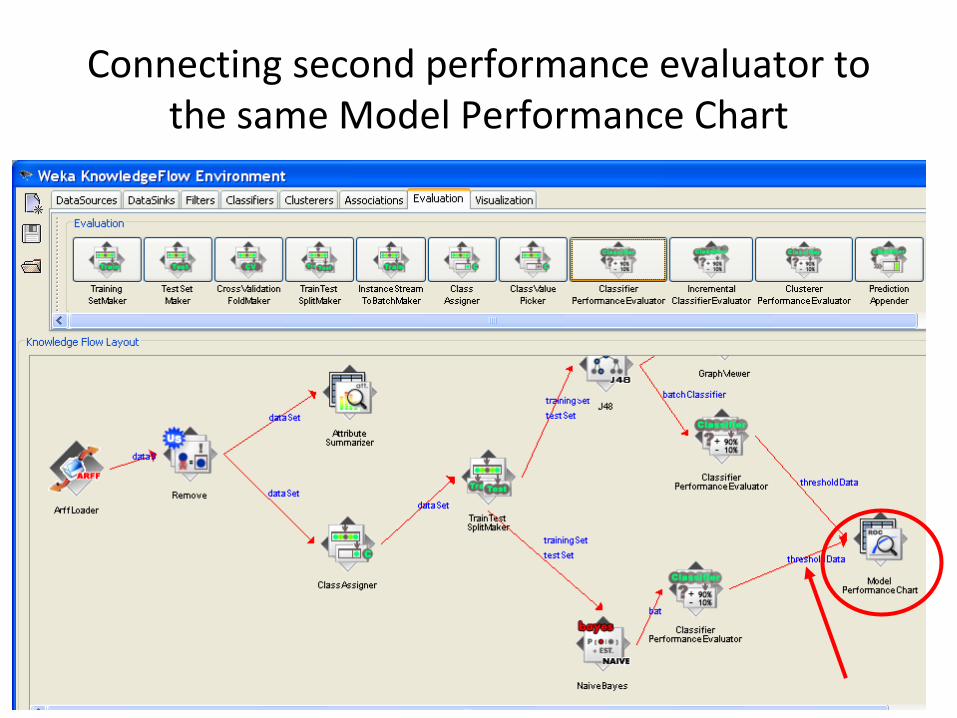
Connecting second performance evaluator to the same Model Performance Chart
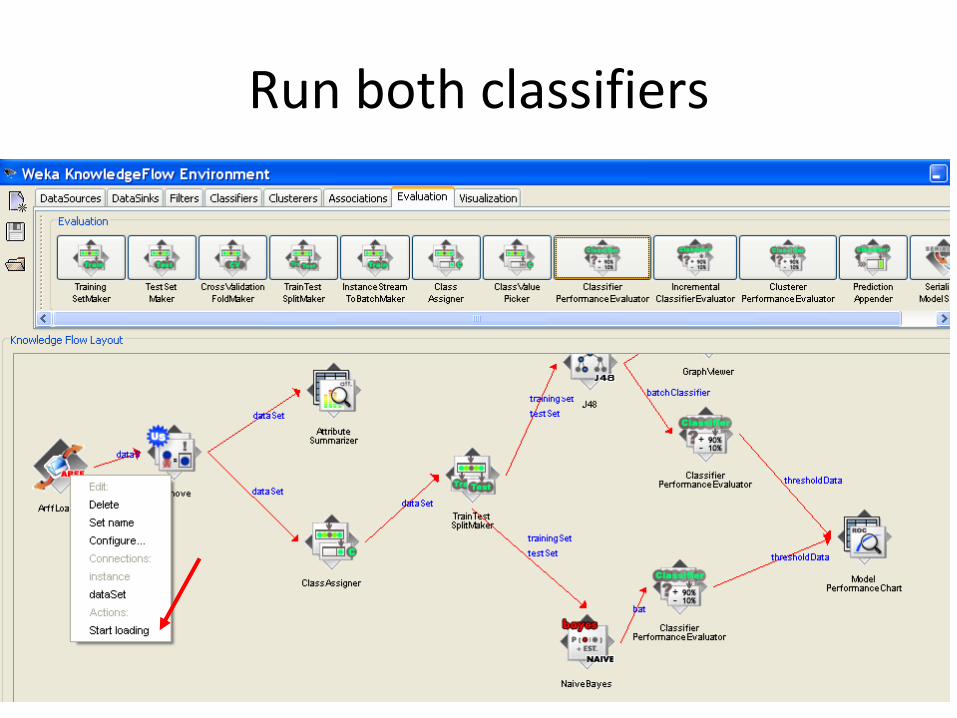
Run both classifiers

View ROC curves for both classifiers

Compare classifiers using their ROC curves

How good is the classifier
The area under the
ROC curve shows
the quality of a
classifier – not
accuracy, but the
ability to separate
between positive
and negative
instances.
What classifier is
better?
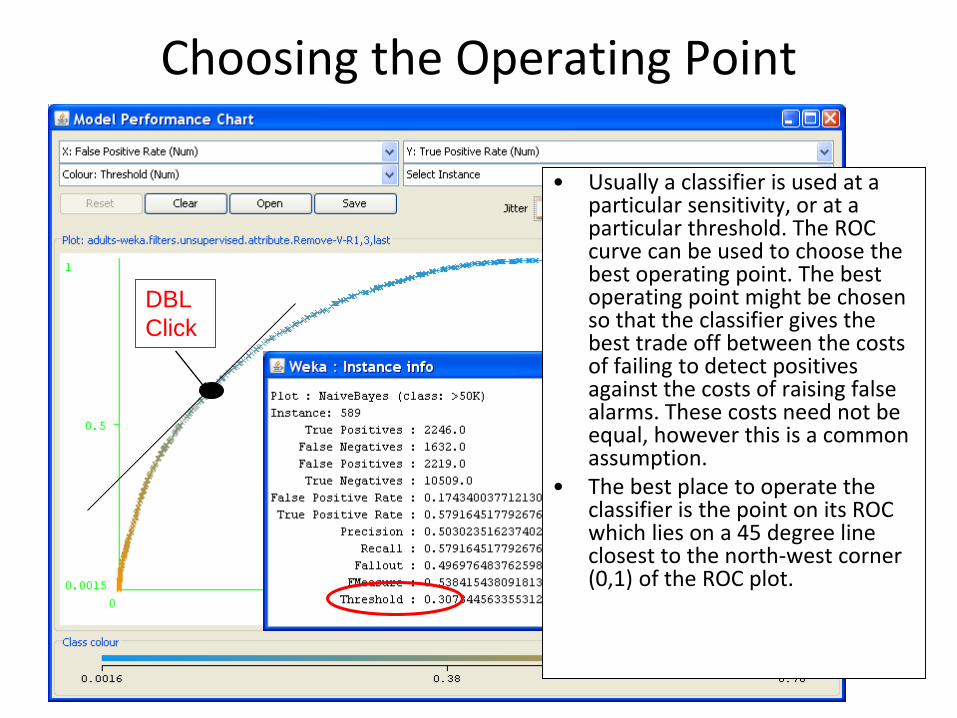
Choosing the Operating Point
• Usually a classifier is used at a particular sensitivity, or at a particular threshold. The ROC curve can be used to choose the best operating point. The best operating point might be chosen so that the classifier gives the best trade off between the costs of failing to detect positives against the costs of raising false alarms. These costs need not be equal, however this is a common assumption.
• The best place to operate the classifier is the point on its ROC which lies on a 45 degree line closest to the north-west corner (0,1) of the ROC plot.
DBL
Click
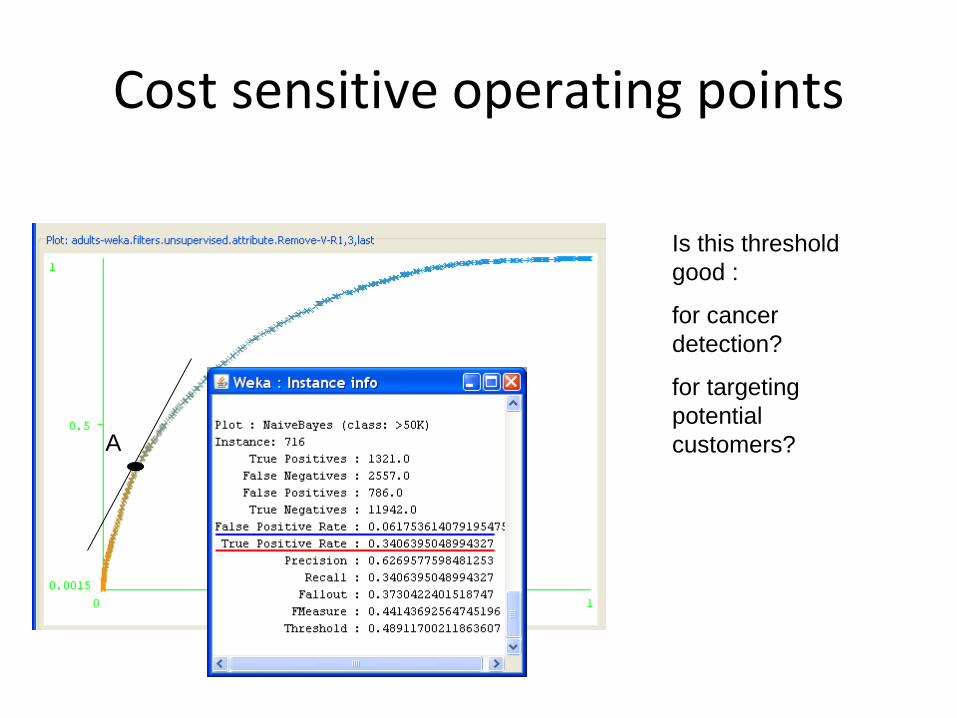
Cost sensitive operating points
A
Is this threshold
good :
for cancer
detection?
for targeting
potential
customers?

Cost sensitive operating points
BIs this threshold
good :
for cancer
detection?
for targeting
potential
customers?

Conclusions
• WEKA is a powerful datamining tool with the state-of-the art GUI, but is not very easy to use
• There are other open source data mining tools:– Orange:
• http://www.ailab.si/orange
– Tanagra: • http://eric.univ-lyon2.fr/~ricco/tanagra/en/tanagra.html