Embed Size (px)
Citation preview

American Journal of Primatology 38133-144 (1996)
Weight Gain in Captive Chimpanzee Infants: Comparisons by Sex, Rearing, and Colony
MARY W. MARZKE,',' DENNIS YOUNG,3 AND JO FRITZ' 'Primate Foundation of Arizona Mesa, and 'Department of Anthropology, and 3Department of Mathematics, Arizona State University, Tempe, Arizona
Weight gain has been monitored for 13 years in a mixed longitudinal study of captive chimpanzee growth and development. This report presents re- sults of a comparative analysis of weight relative to age in 175 animals during the first 24 months in four sexhearing groups (hand-reared fe- males, hand-reared males, mother-reared females, and mother-reared males) from three colonies with different physical, nutritional, and social environments (Primate Foundation of Arizona, University of Texas M.D. Anderson Cancer Center Department of Veterinary Resources, Bastrop, TX, and White Sands Research Center, Alamagordo, NM). The LOWESS method is used to generate fits of weight vs. age for each group and colony, with which individual animals a t these and other colonies may be com- pared for assessment of developmental status. Comparisons of the curves, using the jackknife approach, show that there are significant differences between the curves, indicating that rearing and environmental parame- ters may be factors in weight gain rate and must be considered in such an assessment. Rearing effects may be the dominant of these factors in weight gain. 0 1996 Wiley-Liss, Inc.
Key words: chimpanzee, infants, weight, growth, sex, rearing
INTRODUCTION A mixed longitudinal study of chimpanzee growth and development has been
under way at the Primate Foundation of Arizona (PFA) since 1981. Two other chimpanzee colonies were added to the study in 1988, the White Sands Research Center in Alamagordo, New Mexico (WS) and the University of Texas M.D. Ander- son Cancer Center Department of Veterinary Sciences in Bastrop, Texas (BA). The purpose of the study is to establish models for use by managers of captive chim- panzee colonies for the prediction of growth and development parameters by age. These models will provide a standard against which the development of colony chimpanzees may be assessed, and this is intended to assist managers in making decisions about many aspects of colony care. The parameters include weight, tooth eruption, maturation of the hand and wrist bones, and measurements of body segments. We report here the rates of weight gain from birth to 24 months in four
Received for publication May 7, 1993; revision accepted May 15, 1995.
Address reprint requests to Dr. Mary W. Marzke, Department of Anthropology, Arizona State Univer- sity, Tempe, A2 85287-2402.
0 1996 Wiley-Liss, Inc.

134 I Marzke et al.
groups of animals: hand-reared females (HF), hand-reared males (HM), mother- reared females (MF), and mother-reared males (MM). The rates are compared for (1) hand-reared females and males in the three colonies, (2) mother-reared females and males at BA and PFA, and (3) hand- and mother-reared females and males within PFA and within BA. (A full set of comparisons could not be made because of the lack of mother-reared animals at WS.)
There are two reports in the literature on weight gain in chimpanzee infants. A study by Gavan [1971] was based upon data for 16 animals raised in the nursery at Yerkes Laboratories of Primate Biology. Another sample studied by Lawrence and Gorzitze [1985] included 80 animals from the nursery at the Primate Research Institute, Holloman AFB, NM. They used a linear regression model to compute a function for weight as estimated by age, based upon mean weights of males and females combined for each month from birth to one year.
We present here curves involving a total of 175 animals relating weight gain to age over a two-year period for each sexhearing group in each of the three colonies. These provide more specific models for assessment of the rate of weight gain in captive chimpanzees than are available at present, and give an indication of the range of variability in weights that may exist among captive animals de- veloping under different physical and social conditions. This information will thereby provide a useful resource for colony managers in assessing the develop- ment of individual chimpanzees with specific developmental histories.
METHODS Sample
The sample includes infants from three facilities that differ in physical, nu- tritional, and social environments. From 1981 through March 1989, PFA chim- panzees were housed indoors in social groups that varied in size (2 to 8 animals) and agelsex composition. From March 1989 to date, most of the sampled animals also had access to outdoor play cages that provided an additional 224 to 824 square feet of floor space and 14 to 20 feet of vertical space. The social groups tend to be larger at the BA facility, where groups composed of adult males and females, juveniles and infants occupy octagonal outdoor corrals that are 4,300 square feet in area. The hand-reared animals in all three facilities interact with both humans and their hand-reared peers.
The number of animals and the frequencies of data points in each sexhearing category for the three colonies are given in Table I. The number of times each animal was weighed varies from 1 to 45, with a mean of 10. There are sibling and a few maternal and paternal relationships in the sample.
An animal is categorized as mother-reared if it has spent at least 12 months with its mother. All BA animals in this category were with their mothers for the full 24 months covered by the study. Thirteen of the 28 PFA mother-reared ani- mals, all born prior to 1985, were separated before 24 months of age, with a mean separation age of 12.8 months for females and 15 months for males. Within the PFA group there were eight animals that had been born at another institution, where they underwent frequent temporary separations from their mothers for routine examinations. The amount of time spent at that institution ranged from 6.5 to 14.5 months. The PFA mother-reared sample is thus more variable in its composition than the BA sample. Nevertheless, both for BA and for PFA our results show significant differences in growth rates between the two categories of mother-reared and hand-reared animals as we define them, indicating that the definitions are sufficient to reflect the effect on weight gain of spending at least one year with the mother.

Weight Gain in Chimpanzee Infants / 135
TABLE I. LOWESS Results for R2 and Mean Square Error, by Colony and RearindSex Grouv
Group No. of data points No. of animals Age range (months) R2 PFA HF 62 10 0-24 .93 PFA HM 20 6 6-24 .67 PFA MF 29 11 1-24 .71 PFA MM 52 17 3-24 .71 WS H F 196 28 0-24 .93 WS HM 118 24 1-24 .90 BA H F 101 21 0 -24 .85 BA HM 98 13 0-24 .92 BA MF 84 24 0-24 .91 BA MM 80 21 0-24 .86 All groups 840 175 0-24 .82
MSE
,612 1.335 1.104 1.157 .448 .644 .922 ,688 ,599 ,783 .935
-
-
Overall nutrition at the facilities was comparable. Mother-reared animals a t PFA and BA were breast fed during the period of this study. Hand-reared or animals separated from mothers prior to 24 months of age were fed commercial infant formula as the prime source of nutrition. At an appropriate age, fruit, vegetables, and a commercial primate chow were supplemented. Mother-reared animals also had access to these foods in addition to their mother’s milk.
Statistical Analysis The LOWESS method [Cleveland, 19791 for estimating the growth response
for each age was used to fit growth curves to the data. The method was used by Moses et al. [19921 to model baboon growth, and was selected for analysis of our data because the relationship of the responses over the age range considered here does not consistently conform to a linear regression or other known growth model.
LOWESS (“locally weighted regression scatterplot smoothing”) uses the fitting of locally linear or polynomial functions to estimate the true growth curve. The window ( f = fraction of data) used in constructing the estimated curve at each point was selected by the M plot method of Cleveland and Devlin [19881, which is an extension of the Mallows C, criterion for model selection in multiple linear regression. In the vast majority of the fits, the M plot method selected a value of f = 1.00. In order to compare the various LOWESS fits it was decided to use f = 1.00 for all fits. The degree of the local fitting polynomial was taken to be one (i.e., local linear fitting).
We compared fits for the curves of the different colony, rearing, and sex groups with the jackknife method used by Moses et al. [1992]. The overall alpha level for the collection of comparisons is set at 0.10 and Bonferroni’s method is used t o obtain the individual alphas by dividing .10 by the total number of comparisons.
Modifications of macros written for SAS [Friendly, 19911 were used to obtain LOWESS fits and their comparisons. All plots were generated using SAS/GRAPH [SAS Institute, 19901.
The low and high limits of age range for each group in the sample are shown in Table I. The low and high limits of age range for each comparison in the jack- knife analysis are given in Table 11. In some cases the age range is quite limited, because the lowest and highest ages for each group must have data for at least two animals so that the jackknife method can be appropriately used.
In order to assess the general effects of the three factors of colony, rearing, and

136 I Marzke et al.
TABLE 11. Results of Jackknife Comparison of LOWESS Curves for Weight Among Colonies and RearinslSex Groups
Mini- Maxi- No. of No. of mum mum No. of data No. of data P value usable usable animals points animals points based
Comparison Group 1 Group 2 age age group 1 group 1 group 2 group 2 Stat on z
Colonies BAHF PFAHF 0 21 21 100 10 54 0.5921 0.5538 BAHF WSHF 0 21 21 100 28 187 0.5165 0.6055 BAHM PFAHM 10 14 6 10 5 6 3.6424 0.0003 BAHM WSHM 1 24 12 86 24 118 1.8857 0.0593 BAMF PFAMF 12 24 22 39 10 23 2.1249 0.0336 BAMM PFAMM 6 24 21 62 17 48 1.9368 0.0528 PFAHF WSHF 0 23 10 61 28 194 0.3435 0.7312
a
a PFAHMWSHM 10 14 5 6 17 29 -3.2298 0.0012 Rearing groups BAHF BAMF 0 21 21 100 25 77 1.9528 0.0508
BAHM BAMM 0 24 13 98 23 80 4.9283 0 PFAHF PFAMF 12 23 9 30 9 20 3.6905 0.0002 PFAHMPFAMM 14 19 6 9 12 20 1.6891 0.0912
a
a
Sexes BAHF BAHM 0 14 21 91 13 87 -1.3492 0.1773 BAMF BAMM 0 24 25 84 23 80 -0.7 0.4839
PFAMF PFAMM 12 24 10 23 16 42 -0.9541 0.3401 WSHF WSHM 1 24 28 194 24 118 -1.3305 0.1835
PFAHF PFAHM 10 19 7 22 6 13 1.146 0.2518
“Significant (overall a = .10; individual OL level using Bonferroni’s method = .lo117 = ,0059)
sex on weight gain, a measure of the difference between the gain patterns for various pairings of colonylrearinglsex groups was obtained. The measure of differ- ence between two groups in a pairing is found as follows: (1) determine the mean weight at each age in each group; (2) find the absolute value of the differences between the mean weights at each age between the two groups; (3) average these absolute differences across all ages. Two groups with similar weight gain patterns will yield a small mean absolute difference, while very different growth patterns will yield a large mean absolute difference. There are eight pairings for assessing colony effects, four pairings for rearing effects, and five pairings for sex effects (see Table I11 for these pairings.) Formal statistical analysis of these difference data is difficult, since the mean absolute differences are not independent (a single group can appear in a pairing under each factor) and do not have equal variances (the number of weights at each age and the number of available ages are different from group to group). Informal descriptive approaches are used in our assessment of overall effects due to colony, rearing, and sex in weight gain.
RESULTS Comparison of Curves
The values of R2 and mean square error for the LOWESS fits for each colony and rearinglsex group are given in Table I. Results of the comparison of LOWESS fits for evidence of significant differences among rearinglsex groups and colonies may be found in Table 11.
Curves for weight vs. age differ as follows: (1) Significant differences are found between rearing groups among males at BA and among females at PFA. The hand-reared animals are heavier than those raised with their mothers. (2) Signif- icant differences among colonies are found for hand-reared males. The BA animals

Weight Gain in Chimpanzee Infants I 137
TABLE 111. Pairings for Assessing Colony, Rearing, and Sex Effects
Group 1 Group 2 Mean absolute difference
Colonies BA HF PFA HF .6515 BA HM PFA HM 1.6445 BA MF PFA MF ,9533 BA MM PFA MM .7785 BA HF WS HF .6417 BA HM WS HM ,5608 PFA HF WS HF .3201 PFA HM WS HM 1.0023
Mean .a191 Standard deviation .3982
Rearing BA HF BA MF 1.0747 BA HM BA MM 1.2974 PFA HF PFA MF 1.6218 PFA HM PFA MM 1.3527
Mean 1.3367 Standard deviation .2249
BA HF BA HM ,8720 BA MF BA MM .4014 PFA HF PFA HM .9935 PFA MF PFA MM ,8155 WS HF WS HM .2771
Mean .6719 Standard deviation ,3135
Sex
are heavier than those at PFA, and the WS males are heavier than their PFA counterparts. (Note, however, that the age range for both comparisons is quite small.) Differences between BA and PFA for both male and female mother-reared animals, and between BA and WS for hand-reared males approach significance, again with the BA animals exhibiting higher weights.
None of the differences between sexes in the curves is significant. All the LOWESS fits exhibit a relationship between weight gain and increase
in age over the first 24 months that is reasonably linear.
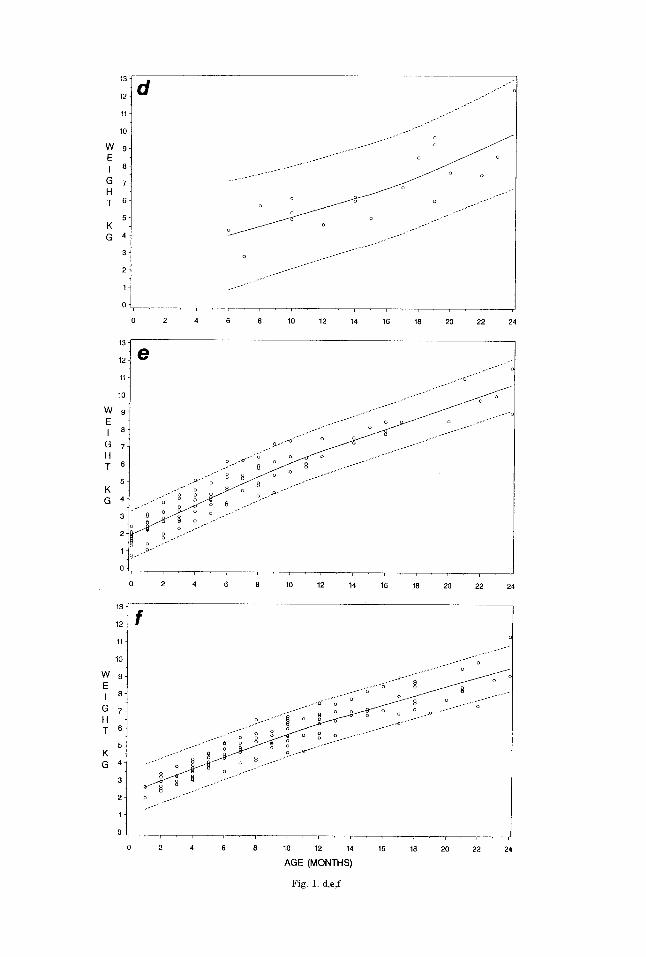
Range of Variability LOWESS fits with 95% prediction bands are shown for each sexlrearing group
in the three colonies (Figs. 1 and 2). The WS hand-reared females and the PFA hand-reared males have the smallest and largest range of variation, respectively. The widths of the prediction bands are affected by the sample sizes for the groups as well as by the variability in the data.
Comparison With Data From Previous Studies Plots of mean weight vs. age for the Primate Research Institute (PRI) and for
Yerkes Laboratories of Primate Biology were generated with published data [Lawrence & Gorsitze, 1985; Gavan, 19711. Midpoints in the age ranges presented in these publications were assumed to be the ages at which their weight data clustered. This is stated in the paper by Gavan [1971], but is not clearly indicated by Lawrence and Gorsitze [1985]. From a comparison of the plots with the LOW- ESS fits for the three colonies reported here (Fig. 3)) it appears that the PRI and Yerkes animals may tend to be heavier over the 0-24 month age range. However,

13
12 a
0 2 4 6 8 10 12 14 16 18 20 22 24
0 2 4 6 8 10 12 14 16 18 20 22 24
T
0
0 2 4 6 8 10 12 14 16 18 20 22 24
AGE (MONTHS)
Fig. 1. a,b,c (continued on next page) Fig. 1. LOWESS fits of growth curves to the data for hand-reared females and males, with 95% prediction bands: a: PFA females; b BA females; c: WS females; d PFA males; e: BA males; E WS males. Variability in width of the prediction bands may be attributed to variability in the data and in the sizes of the six samples. Significant differences were found between the PFA male curve and the male curves of both BA and WS. There are no significant differences between curves of males and females.
. . . . . . . . . . . . . . . . . . . . . . . . 0 2 4 6 8 10 12 14 16 18 20 22 24
O L - ? - - - - 7 . 1 . 1 . 1 . , . I . T . I
0 2 4 6 8 10 12 14 16 18 20 22 24
1 3 ] 12 f 11
10
-
-
w 9 - E .
G 7 - I 8:
H - T 6 -
K - 5 -
G 4 -
3 -
2 -
1 -
0 2 4 6 8 10 12 14 16 18 20 22 24
AGE (MONTHS)
Fig. 1. d,e,f

140 / Marzke et al.
''! 12
11 -
o i . I ' I ' I ' " " 1 ' ' ' '
C 2 4 6 8 10 12 14 16 18 20 22 24
b
0
0 2 4 6 B 10 12 14 16 18 20 22 24
AGE (MONTHS)
Fig. 2. a,b Fig. 2. LOWESS fits of growth curves to the data for mother-reared females and males, with 95% prediction bands: a: PFA females; b: BA females; c: PFA males; d: BA males. Differences between the curves of PFA and BA for both males and females approach significance. There are no significant differences between curves for males and females.
because of uncertainty as to whether the PRI ages are strictly comparable with those for the other colonies, tests for significant differences cannot be performed, and we cannot be confident that differences exist.
Relative Effects of Sex, Rearing, and Colony on Weight Gain The mean absolute differences for the various pairings are shown in Table 111,
along with the averages and standard deviations for the measurements in each factor. These show that the rearing pairs give the largest values, followed by the colony and sex pairs. All rearing mean absolute differences are larger than those

Weight Gain in Chimpanzee Infants I 141
12 1 3 1
- i - r , I , I , I , , , , , , , , , r 0 2 4 6 8 10 12 14 16 18 20 22 24
d
e - l
H - G 7-
T 6 -
5 - K - G 4 -
3 -
2 -
0 2 4 6 8 10 12 14 16 18 20 22 24
AGE (MONTHS)
Fig. 2. c,d
for colony and sex except for one colony pairing. The mean absolute differences for the colony and sex pairs do not appear to be that divergent. Based on these data, one might conjecture that rearing effects are the dominant factor in weight gain.
DISCUSSION The results of the analysis indicate a greater range of variability in weight
gain among captive chimpanzees than was indicated by previous reports based upon data from hand-reared animals in single colonies, in which only sexes were examined for significant differences. There appear to be patterns in this variation, with a tendency toward more rapid weight gain during the first 24 months among hand-reared animals than among mother-reared, and a tendency for colonies to differ in rates of weight gain for animals of all sexhearing categories. Our results

142 I Marzke et al.
1
0 2 4 6 8 10 12 14 16 18 20 22 24
AGE (MONTHS)
COLDNY ~ BA HINDIFEMU PFA tuNDIFEYLE WS HbNDIFEMNE U - 0 - D YERKESHUlDlFEM 0 0 0 PWHANDF€Y
1 ,
0 2 4 6 8 10 12 14 16 18 20 22 24
AGE (MONTHS)
C W N Y ~ M H U l D M U E P F I HUiD,"E WS HANDWALE tf-ft-0 YERKESHMDWuf 0 0 0 FWHANDMNE
Fig. 3. Comparison of PFA, BA, and WS LOWESS fits for hand-reared chimpanzees with plots of mean weight vs. age for the PRI and Yerkes samples: a: females; b males. The PRI and Yerkes animals appear to be heavier across the 0-24 month age range than animals in the three samples reported here.
are similar to those of PRI [Lawrence & Gorzitze, 19851 and Yerkes [Gavan, 19711 in showing a lack of significant difference between sexes in weight gain.
Interesting questions are raised by the results which will require long-term

Weight Gain in Chimpanzee Infants / 143
investigations. For example, are there management andlor behavioral differences among hand- and mother-reared animals that may explain differences between them in weight gain? And what specific differences between colonies in physical environment, social environment, and feeding protocols are common to all sex/ rearing categories, which might explain the overall tendency toward differences between the colonies in weight gain?
There are two possible reasons for the relatively large amount of variability found among the PFA mother-reared animals. One is the variability in age at which the animals in the PFA sample were separated from their mothers. The other is the difference between the PFA-born and PFA animals born at another institution in the number of times they were separated temporarily from their mothers for routine examinations. Unfortunately the PFA sample of data points is not large enough to be broken down into subgroups for separate comparison of PFA-born or 24-month PFA mother-reared animals with the BA sample, to assess the relative likelihood of these explanations.
The LOWESS fits for weight gain vs. age presented here should enhance the ability of colony managers to quickly assess the developmental status of a captive chimpanzee infant relative to its captive peers in each sexhearing category. The precision of this assessment will be greater for animals in the study colonies, but for captive chimpanzees elsewhere the plots may serve as a guide to the position of an individual animal relative to the range of variability that exists among animals exposed to a variety of protocols and environments. The history of each animal in a colony will suggest to colony managers the most appropriate model from our colonies for predicting its expected weight at a given age. The quality of the as- sessment of developmental status of course will be further enhanced as models for estimation of tooth eruption, handlwrist ossification, and maturation and segment growth are added to those of weight gain.
CONCLUSIONS
1. Hand-reared animals tend to gain weight at a significantly faster rate than
2. There is evidence of possible differences among colonies. It remains to be
3. Sex does not appear to be a significant factor in weight gain. 4. The present data base (including 175 animals and 840 data points) is
unique in providing models for the estimation of weight for ages birth to 24 months specific to four sexhearing categories of infants. Assessment of the developmental status of individual captive chimpanzee infants from other colonies thus can be made, relative to others with a similar sex and rearing history.
5. The data base is also unique in reflecting effects on weight gain of a wide variety of animal protocols and environments at three colonies. Therefore, it is possible to assess the developmental status of individual captive chimpanzee in- fants relative to a range of variation that may approach the full range for captive colonies in the United States.
mother-reared ones during the first 24 months.
seen if this is borne out with more data.
ACKNOWLEDGMENTS We thank Paul Fritz, Patricia Alford, D.V.M., James Bowen, D.V.M., Roy
Barnes, and the many staff members and students who have participated in the collection and analysis of data. The project is supported by NIH grant R 0 1 RR03578-06.
144 / Marzke et al.
REFERENCES Cleveland, W.S. Robust locally weighted re-
gression and smoothing scatter plots.
CAL ASSOCIATION 74:829-836, 1979. Cleveland, W.S.; Devlin, S.J. Locally
weighted regression: An approach to re- gression analysis by local fitting. JOUR- NAL OF AMERICAN STATISTICAL AS- SOCIATION 83596-610, 1988.
Friendly, M. SAS SYSTEM FOR STATISTI- CAL GRAPHICS. 1st ed. Cary, NC: SAS Institute, Inc., 1991.
Gavan, J.A. Longitudinal, postnatal growth in chimpanzee. Pp. 46-102 in THE CHIM- PANZEE, Vol. 4, G.H. Bourne, ed. Basel, Karger, 1971.
JOURNAL OF AMERICAN STATISTI-
Lawrence, W.A.; Gorzitze, A.B. Assessment of postnatal weight gain in nursery-reared infant chimpanzees. Pp. 157-164 in CLIN- ICAL MANAGEMENT OF INFANT GREAT APES. C.E. Graham, J.A. Bowen, eds. New York, Alan R. Liss, Inc., 1985.
Moses, L.E.; Gale, L.C.; Altmann, J. Meth- ods for analysis of unbalanced, longitudi- nal, growth data. AMERICAN JOURNAL OF PRIMATOLOGY 28:9-59,1992.
SAS Institute, Inc. SASlGRAPH Software. Reference, Version 6, First Edition, Vol. 1 and 2, Cary, NC: SAS Institute, Inc., 1990.


![Development of Captive Breeding, Seed Production … updated.pdforganisms as food in the larval rearing of the fish and prawn larvae was indicated earlier [20]. Many studies reported](https://img.dokumen.tips/doc/110x75/5ebbcd45ab03d3799645343a/development-of-captive-breeding-seed-production-organisms-as-food-in-the-larval.jpg)