Embed Size (px)
Citation preview

University of South CarolinaScholar Commons
Theses and Dissertations
12-15-2014
Weight-Gain and Energy BalanceBenjamin Thomas GordonUniversity of South Carolina - Columbia
Follow this and additional works at: https://scholarcommons.sc.edu/etd
Part of the Medicine and Health Sciences Commons
This Open Access Dissertation is brought to you by Scholar Commons. It has been accepted for inclusion in Theses and Dissertations by an authorizedadministrator of Scholar Commons. For more information, please contact [email protected].
Recommended CitationGordon, B. T.(2014). Weight-Gain and Energy Balance. (Doctoral dissertation). Retrieved from https://scholarcommons.sc.edu/etd/3043

WEIGHT-GAIN AND ENERGY BALANCE
by
Benjamin Thomas Gordon
Bachelor of Science
University of Miami, 2007
Master of Science
University of South Carolina, 2011
Submitted in Partial Fulfillment of the Requirements
For the Degree of Doctor of Philosophy in
Exercise Science
The Norman J. Arnold School of Public Health
University of South Carolina
2014
Accepted by:
Steven N. Blair, Major Professor
Gregory A. Hand, Committee Member
J. Larry Durstine, Committee Member
Clemens Drenowatz, Committee Member
Daniel P. O’Connor, Committee Member
Lacy Ford, Vice Provost and Dean of Graduate Studies

ii
© Copyright by Benjamin Thomas Gordon, 2014
All Rights Reserved.
iii
ABSTRACT
Energy balance is the result of a dynamic relationship between energy intake (EI),
energy expenditure (EE) and energy storage (ES). These three components of energy
balance have extremely complicated associations, and all three major components are
consistently influenced by physiologic, psychological, and sociologic factors. Concerted
changes between EE and EI result in alterations of the ES. Most often in clinical and
research settings, bodyweight is used as marker of body composition (i.e., ES) changes.
Traditional measurements of bodyweight do not give an accurate portrayal of ES change
or the role it has in energy balance. This dissertation supplies new methods of monitoring
ES that better estimate an individual’s true change in ES over time. These new methods
were then applied and used to categorize weight gain, loss and maintenance. Further, the
association between these categorizations and EE was investigated. Thus this dissertation
begins with an investigative analysis of one component of energy balance and then
progresses to the association between two components and the overall influence of the
association on energy balance. The three papers of this dissertation examine 1) the
overall bodyweight changes that occur over a year period in healthy adults 2) the overall
body composition changes that occur over a year period in healthy adults; and 3) the
associations of bodyweight and composition changes with average energy expenditures
over a year period. This dissertation used clinical measurements of bodyweight,
composition and objectively measured EE values, which were collected as a part of the

iv
first year of the Energy Balance Study (a comprehensive study designed to determine the
associations of caloric intake and EE on changes in bodyweight and composition in a
population of healthy men and women). The aims of the current dissertation are crucial to
providing insight and results for the primary aim of the Energy Balance Study.
The first study revealed that the participants of the Energy Balance Study are on
average gaining roughly a kilogram (kg) of bodyweight over a year period, which is
similar to estimates that have been made for the United States (US) population. However,
while 43% of the participants were found to be gaining weight, a greater majority (46%)
were maintaining bodyweight over the year period. The participants gaining and losing
the most weight were substantially heavier than those who maintained bodyweight.
Lastly, when the traditional measurements of monitoring bodyweight were compared to
linear mixed model estimations of bodyweight change they were found to largely over or
underestimate changes in the individual.
Study two showed that the average bodyweight the participants from the Energy
Balance Study gained (roughly 1kg) was predominantly due to increases in fat mass
(FM). Subsequently, on average the group gained slightly less than 1 kg of FM in a year
period. Similar to the trends seen in bodyweight changes, the greatest majority of
participants were considered to be maintaining fat mass. While overall the fat-free mass
(FFM) of the participants did not change substantially it was negatively correlated with
FM.
In the last study overall total daily EE was shown to be substantially elevated in the
participants considered as weight gainers and participants considered as fat-gainers.

v
However, the elevated total daily EE was most likely due to the substantially heavier
starting bodyweight of these two groups. When the total daily EE was analyzed on a per
kg of bodyweight basis, the trend was reversed and the weight maintenance group had the
highest values of EE. However, this was most likely due to the differences between
groups body surface area relative to bodyweight ratio. Lastly, the bodyweight and
composition maintenance groups had a lower percentage of total EE coming from
sedentary activities relative to the substantial bodyweight and composition gainers
vi
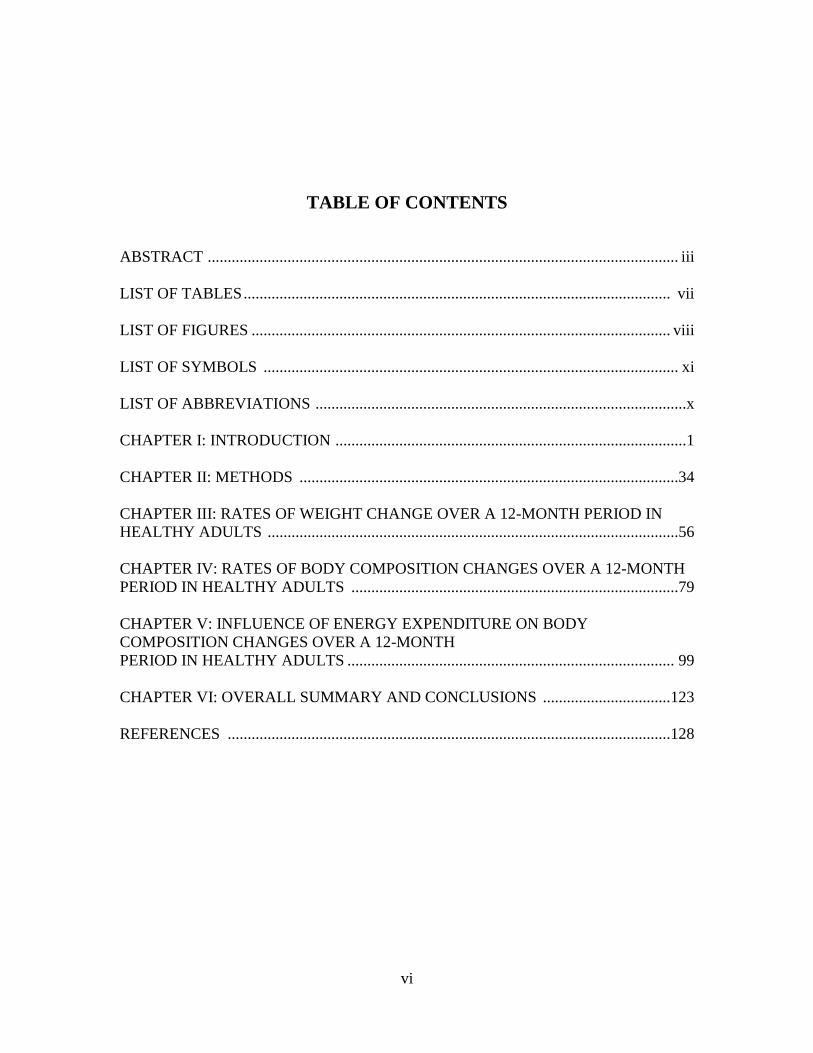
TABLE OF CONTENTS
ABSTRACT ...................................................................................................................... iii
LIST OF TABLES ........................................................................................................... vii
LIST OF FIGURES ......................................................................................................... viii
LIST OF SYMBOLS ........................................................................................................ xi
LIST OF ABBREVIATIONS .............................................................................................x
CHAPTER I: INTRODUCTION ........................................................................................1
CHAPTER II: METHODS ...............................................................................................34
CHAPTER III: RATES OF WEIGHT CHANGE OVER A 12-MONTH PERIOD IN
HEALTHY ADULTS .......................................................................................................56
CHAPTER IV: RATES OF BODY COMPOSITION CHANGES OVER A 12-MONTH
PERIOD IN HEALTHY ADULTS ..................................................................................79
CHAPTER V: INFLUENCE OF ENERGY EXPENDITURE ON BODY
COMPOSITION CHANGES OVER A 12-MONTH
PERIOD IN HEALTHY ADULTS .................................................................................. 99
CHAPTER VI: OVERALL SUMMARY AND CONCLUSIONS ................................123
REFERENCES ...............................................................................................................128

vii
LIST OF TABLES
Table 2.1 Measurements Taken for the Energy Balance .................................................. 54
Table 2.2: List of Questionnaires Administered in the Energy Balance Study ................55
Table 3.1: Weight-Change Distribution of the Total Energy Balance Population ...........71
Table 3.2: Characteristics of Male Weight Change Groups .............................................72
Table 3.3: Characteristics of Female Weight Change Groups ..........................................73
Table 4.1: Fat Mass Change Distribution .........................................................................92
Table 4.2: Characteristics of Male Fat-change Groups ....................................................93
Table 4.3: Characteristics of Female Fat-change Groups .................................................94
Table 5.1: Bodyweight and Composition Groups with Starting Weights
and Heights .....................................................................................................................115
Table 5.2: Total EE for Bodyweight and Composition Groups ......................................116
Table 5.3: Percentage of Calories from Sedentary Activities for Body Composition
Groups ..............................................................................................................................117
Table 5.4: Percentage of Calories from Sedentary Activities for Bodyweight Groups .. 118

viii
LIST OF FIGURES
Figure 3.1 Average Measured Weights with Linear Model Trajectories for All
Participants ........................................................................................................................74
Figure 3.2 Average Measured Weights with Linear Model Trajectory for Weight Gain
and Substantial Weight Gain Group .................................................................................75
Figure 3.3 Average Measured Weights with Linear Model Trajectory for Weight
Maintenance Group ...........................................................................................................76
Figure 3.4 Average Measured Weights with Linear Model Trajectory for Weight-Loss
and Substantial Weight-Loss Group .................................................................................77
Figure 3.5 Differences Between Measured Yearly Weight Change and Linear Mixed
Model Calculated Yearly Weight Change ........................................................................78
Figure 4.1 Average Measured Fat Mass with Linear Model Trajectory for Fat
Gain Group ........................................................................................................................95
Figure 4.2 Average Measured Fat Mass with Linear Model Trajectory for
Fat Maintenance Group .....................................................................................................96
Figure 4.3 Average Measured Fat Mass with Linear Model Trajectory for Fat Loss
Groups ...............................................................................................................................97
Figure 4.4 Differences Between Measured Yearly Fat Change and Linear Mixed Model
Calculated Yearly Weight Change ....................................................................................98
Figure 5.1: Total Daily Energy Expenditure for Weight-Change Groups ......................119
Figure 5.2: Total Daily Energy Expenditure for Fat-Change Groups ............................120
Figure 5.3: Total Daily Energy Expenditure per Kilogram of Bodyweight for
Weight-Change Groups ..................................................................................................121
Figure 5.4: Total Daily Energy Expenditure per Kilogram of Bodyweight for
Weight-Change Groups .................................................................................................. 122

ix
LIST OF SYMBOLS
N Sample size
β Regression slope
SEβ Standard Error of the regression slop

x
LIST OF ABBREVIATIONS
AEE .......................................................................................... Activity energy expenditure
AHA ........................................................................................ American Heart Association
AMA ................................................................................... American Medical Association
BMI ........................................................................................................... Body mass index
CAD ................................................................................................Coronary artery disease
CDC ............................................................................................ Center for disease control
DLW .................................................................................. Doubly labeled water technique
DXA ........................................................................................... Dual x-ray absorptiometry
EB ................................................................................................................ Energy balance
EE .......................................................................................................... Energy expenditure
EI .................................................................................................................... Energy intake
ES ................................................................................................................. Energy storage
FG ............................................................................................................................ Fat Gain
FL .............................................................................................................................. Fat loss
FM .......................................................................................................................... Fat mass
FFM ................................................................................................................. Fat-free mass
GI ................................................................................................................ Gastrointestinal
LMM .................................................................................................... Linear Mixed Model
MET ........................................................................................ Metabolic equivalent of task
MLIC ........................................................................ Metropolitan life insurance Company

xi
NEAT ......................................................................... Non-exercise activity thermogenesis
NIH ............................................................................................... National Institute Health
NHANES ............................................ National Health and Nutrition Examination Survey
NHES .................................................................................... National Examination Survey
RMR ..................................................................................................Resting metabolic rate
SD .......................................................................................................... Standard deviation
SFG ......................................................................................................... Substantial fat gain
SFL .......................................................................................................... Substantial fat loss
SWG ................................................................................................ Substantial weight gain
SWL ................................................................................................. Substantial weight loss
TD2 ............................................................................................................. Type 2 diabetes
TEF .......................................................................................... Thermogenic effect of food
US ................................................................................................................... United States
USDA .................................................................. United States Department of Agriculture
WG .................................................................................................................... Weight gain
WHO ......................................................................................... World Health Organization
WL ..................................................................................................................... Weight loss
WM ...................................................................................................... Weight maintenance

1
CHAPTER 1
OVERALL INTRODUCTION
Over the past 20 years obesity has come to the forefront of public health concern.
During this short period, prevalence rates of overweight or obese individuals have
exploded. In 1991 the estimated obesity prevalence in the United States (US) was 12.0%,
the value has now ballooned to 35.7%. And if current trends continue, an estimated 51%
of the population will be obese by 2030 (1;2). The rising obesity prevalence rates are
associated with a staggering rise in medical costs. Some investigators have estimated
obesity in the U.S. to be associated with 114 billion dollars per year in direct costs,
although it should be noted that these numbers have not been adjusted for the positive
effects of physical activity and exercise (3). Because of these widespread health and
economic costs associated with the disorder, researchers, specifically in the past two
decades have made a concerted effort to better understand it.
In medicine, obesity is known as a state of increased bodyweight, referring
explicitly to adipose tissue in large enough surplus to produce adverse health
consequences (4). These excessive amounts of adipose tissue are created when there are
alterations in the energy balance (EB) equation. The fundamental variables of EB are
energy intake (EI), energy expenditure (EE) and energy storage (ES) (5). EI is the total
amount of calories consumed by an individual including the total consumption of three
the major macronutrients, and to a lesser extent alcohol. The net absorption of these
nutrients varies depending on the individual, the type of food, how the food was prepared
2
and intestinal enzymatic activity(6). Depending on the aforementioned factors, 2-10% of
energy consumed is not absorbed and lost during excretion. The energy that is absorbed
by the gastrointestinal tract (GI) is known as metabolizable energy, this is what most
researchers consider true EI. While the absorbed calories are considered true EI, most
investigators calculate EI by the amount of calories that are consumed because of the
difficulty measuring the total amount absorbed (6). The calories taken up by the GI are
either stored by the body or used immediately for biological processes throughout the day
and lifespan of an individual. Every cell in the body is constantly in need of ATP to
conduct biological processes, therefore there is always a need for EI.
Collectively the energetic costs of all biological processes are the total EE. The
largest component of total EE takes place in the resting phase known as resting metabolic
rate RMR. This component typically comprises roughly two thirds of total daily EE.
RMR varies widely between individuals, mainly due to size, and body composition (7).
Typically, increases in lean mass cause substantial increases in RMR (8). Along with
RMR the thermogenic effect of food (TEF) also contributes to total EE. TEF is the EE
associated with the digestion and absorption of food, contributing roughly 10% of total
EE. The largest influential factor affecting TEF appears to be varying levels of
macronutrients; an example being the level of alcohol consumption. Increasing alcohol
consumption increases total EE, but also increases the amount of fat stored in the body
(9;10). Lastly, representing 15-30% of total EE is the active energy expenditure (AEE),
which represents all the energy consumed in activities requiring more than resting energy
level. AEE is typically segmented into exercising activity and non-exercising activity
(NEAT) (6).
3
Chronic imbalances between EE and EI result in alterations of the ES. The
predominant mode of ES in the body is the use of triglycerides. The average human
stores tens of thousands of calories in the form of triglycerides, while an obese individual
may store up to a million calories (11). Additional energy is stored in the form of
glycogen and protein, but while these two storage deposits have specific purposes,
triglycerides are able to store almost double the amount of calories in one gram.
The three major components of EB (i.e., EE, EI and ES) are constantly in flux, as
a result the values of EE and EI are almost never equal on a day-to-day basis. When
bodyweight is lost, the total EI is routinely less than the total EE for an extended period
of time, meaning ES must be used to match the EE. When bodyweight is gained the total
EI is routinely greater than total EE for an extended period of time, the additional energy
absorbed is stored. Changes in ES are stressful for the body and can lead to problems
others than those simply associated with obesity (12).
Changes in ES are typically measured by changes in overall weight. For the
general public and clinicians, bodyweight affords a method for ES trajectory. However,
measurements of bodyweight can be misleading for making assumptions on changes in
ES. Fluctuations in bodyweight can be attributed to other factors aside from changes in
ES such as, additional clothing, food and water consumption, measurement error, fluid
retention, and electrolyte imbalances (13). Some researchers have seen diurnal variations
in bodyweight of roughly 5lbs, this is with a consistent measurement protocol and
without a concerted effort from the participant to change weight during the measurement
period (13). Individuals making a concerted effort to change their weight can have much
more dramatic fluctuations. An investigation using high school wrestlers found that in a

4
12hr period (from weigh-in for the competition until the actual competition) the
competitors gained an average of 2.2±1.7% of their bodyweight, with the biggest gain
being 7.2% of their original bodyweight (14). These massive fluctuations in bodyweight
are mainly due to changes in body water. The average human is comprised of 60% water,
with gender, age and ethnicity causing variations (15). In normal healthy adults water
volume can fluctuate up to ±5% daily. This means that an adult male weighing 200lbs
can fluctuate up to 6lbs with typical changes in water. These substantial variations in
bodyweight can lead to incorrect assumptions regarding changes in ES (primarily
regarding body fat).
The actual ES changes that lead to obesity are hypothesized to be small but
substantial increases over an extended period of time. Hill et al. proposed that the obesity
pandemic has arisen from small differences between EE and EI (i.e., <100 kcals) (16).
This small gap between EE and EI requires several months of consistency to result in a
substantial change in ES. Thus average increases in bodyweight for the US over an entire
year are small estimated at about 1-3lbs (16). These small changes can be masked behind
the previously mentioned fluctuations in water levels, electrolytes and other physiologic
changes, making predictions of true weight-gain and true weight-loss very difficult (6).
More accurate estimations of changes in energy storage can be made by
measuring body composition. As previously mentioned triglycerides are the main form of
stored energy in the body, unlike fat-free mass, triglycerides have very low water content
(roughly 15% of water). Measurements of fat-mass and fat-free mass give a more
accurate depiction of what the trend of ES, better predicting the risk for obesity and
associated health-risks. While measurement of body composition shows ES change, there

5
are still measurement errors depending on which method is utilized. In addition, the
measurement of fat-free mass still holds the possibility of inaccuracies due to diet,
hydration level and electrolyte level.
The measurement errors and physiologic fluctuations of body composition and
bodyweight create low precision and misinterpretation of cross-sectional measurements.
To understand a rate of change in ES, multiple measurements such as in a longitudinal
study can be used in a linear mixed model (LMM) to estimate the rate of change in either
body composition or weight. Over multiple time points, LMM is capable of producing a
more accurate estimation of weight change of a period of time than cross-sectional
measurements.
As previously mentioned, ES is heavily influenced by EI and EE. When EI is
greater than EE, energy is stored. When EE is greater than EI, ES is used. The creation
and use of ES has been shown to be heavily influenced by other metabolic and
physiologic factors. Varying the protein and carbohydrate content of meals can greatly
impact whether excess energy is stored as fat mass or fat-free mass. A recent study by
Bray et al. measured the effects of varying the amount of protein in participants diets
(17). The investigation revealed that no matter what the variation of macronutrients a
range of 50-90% of all calories were stored as fat, and all of the groups gained similar
amounts of total fat. However, the groups that were fed a high-protein diet gained a
substantially greater amount of fat-free mass than the low protein group. In addition, a
recent meta-analysis by Peterson et al. found that the weighted pooled estimate of mean
lean body mass change was 1.1kg, and that higher volumes of training were associated
with larger increases in lean mass (18). While there have been several studies that have

6
investigated various environmental influences on ES, no study has measured the specific
effect of varying levels of EE on ES.
There have been several studies that have explored the topics of EE and EI in
varying populations, but there are no large-scale studies that have closely followed EE
and EI over an extended period time to investigate the relationships between EE, EI, ES,
weight-gain and obesity. More investigations are required for the proper investigation on
bodyweight and composition change, and the development of obesity. Specifically, there
is a need to clinically measure the amount of weight-gain over an extended period of time
to truly understand how individuals are gaining weight and the relevance of this weight-
gain. In addition, there is a need to clinically measure the amount of body composition
change over an extended period of time to understand how individuals are changing their
body composition along with changing weight. Lastly, the average EE associated with
changes in ES are not fully understood, and need to be further elucidated. This
dissertation will attempt to clarify questions regarding energy balance and the affects of
its components on weight balance, weight gain and obesity
Statement of Problem
The positive EB associated with storing ES, and gaining excess body fat to the
point of obesity is not well understood. The amount and rate of unhealthy weight-gain
relative to healthy weight-gain and health outcomes of both are unclear. Further, the
long-term patterns of average total daily EE and their effect on weight maintenance and
body composition is not clear. The overall goal of this dissertation is to first better
understand how bodyweight and composition change in healthy adults, and how these

7
changes are associated with EE. This will be determined through the following specific
aims. [1] To determine the overall bodyweight changes that occurs over a year period in a
group of 344 healthy adults. [2] To determine the overall body composition changes that
occurs over a year period to a group of 344 healthy adults. [3] To determine how average
total daily EE is associated with changes in bodyweight and composition of a year period.
Hypothesis
The following hypotheses are intended to test the given specific aims
Specific Aim 1
To determine the overall weight changes that occurs over a year period in a group
of 344 healthy adults.
1a. To determine the overall change in bodyweight of 344 healthy adults over a period of
12 months by measuring bodyweight at five time points (baseline, 3 month, 6 month, 9
month and 12 month).
1.1 The overall average weight-change of the 344 participants will be similar to
estimations of yearly weight gain of Americans, roughly 1-2kg.
1b. To estimate the weight-change of 344 healthy adults by using five bodyweight
measurements over a 12-month period in a LMM.
1.2 The LMM will give a precise prediction of each participant’s weight-change as
compared to the difference of two cross-sectional measurements (i.e., 12 month
minus baseline). The use of several measurements as opposed to two

8
measurements will better account for variations between measurements and
other varying factors yielding a better depiction of weight-change over time.
1c. To define weight-change by grouping the trajectories (produced by the LMM) into
five specific groups: participants that are gaining substantial amounts of bodyweight,
those who are gaining bodyweight, those maintaining bodyweight, those losing
bodyweight and those who are losing substantial amounts of bodyweight. The groups will
be based off each participant’s measure variation by comparing the LMM calculated
bodyweight and the overall slope standard error.
1.3 The group of weight-gainers will contain the largest number of participants,
while the weight-maintenance group will have the least amount of
participants.
Specific Aim 2
To determine the overall body composition changes that occurs during a year period
to a group of 344 healthy adults.
2a. To determine the overall change in body composition from 344 healthy adults over a
period of 12 months by using dual X-ray absorptiometry (DXA) estimates of body
composition at five time points (baseline, 3 month, 6 month, 9 month and 12 month) over
a year period.

9
2.1 The overall average body composition changes of the 344 participants will
predominantly be due to changes in body fat. Subsequently, the weight-
change experienced by participants will be primarily due to changes in body
fat.
2b. To estimate the weight-change of 344 healthy adults by using five bodyweight
measurements over a 12-month period in a linear mixed model (LMM).
2.2 The LMM will give precise predictions of body composition. The LMM will
take into account several measurements, which will adjust body composition
predictions based on measure-to-measure variation in each participant.
2c. To define body composition change by grouping the trajectories (produced by the
LMM) into ten (2 non-independent groups of 5 based on fat-change and fat-free mass
change) groups: participants who are gaining substantial amounts of body fat, those who
are gaining body fat, those maintaining body fat, those losing body fat, those who are
losing substantial amounts of body fat, those who are gaining substantial amounts of fat-
free mass, those who are gaining fat-free mass, those who are maintaining fat-free mass,
those who are losing fat-free mass and those who are losing substantial amounts of fat-
free mass.
2.3 The groups gaining body fat will have the most participants while the groups
maintaining fat will have the least number of participants. Lastly, the values
for the fat-gainer groups and the fat-stable groups will be highly correlated
with the weight-gainers and the weight-stable groups.
10
Specific Aim 3
To access the association between changes in ES and average EE values during the
time period of ES change.
3a. To determine whether participants categorized as gaining substantial weight or fat
have different associated total daily EE (with a SenseWear Mini Armband worn over a
10-day period at quarter-annual intervals) relative to the participants classified as weight
or fat stable.
3.1 The participants who maintain bodyweight over the year period will have the
higher relative total daily EE.
3b. To determine whether participants categorized as gaining substantial fat mass have
different total daily EE (with a SenseWear Mini Armband worn over a 10-day period at
quarter-annual intervals) relative to those who are maintaining fat-mass.
3.2 The participants who maintain body fat over the year period will have the
higher total daily EE.
3c. To determine whether participants categorized as gaining substantial bodyweight
derive a higher percentage of their total daily EE (recorded with a SenseWear Mini
Armband worn over a 10-day period at quarter-annual intervals) from sedentary activities
relative to participants classified as weight-stable.
3.3 The participants gaining substantial bodyweight will derive a higher
percentage of their total daily EE from sedentary behavior.
11
Scope
The current investigation is limited to describing the estimated rate weight-change, body
composition changes and the influence varying levels of activity EE has in a group of 344
random 21-35 yr old healthy adults over the course of 12 months time. Extrapolation of
these results to the general population, other age groups, or individuals with specific
disorders should be made with caution.
Literature Review
In the past century obesity has ascended from a relatively unknown disorder with
prevalence rates so low that no records were kept, to a prevalence of over 500 million
people worldwide (19). The World Health Organization (WHO) has recognized obesity
as being the 5th
highest cause of death in the world, with over 2.8 million lives being lost
a year. Obesity is not just a problem of carrying excess adipose tissue; obesity is also
linked to an extensive list of chronic diseases and disorders. Diseases such as type 2
diabetes (TD2), heart disease, stroke, osteoarthritis, dementia, Alzheimer’s, colon and
breast cancer and many others are associated with obesity (20;20-25). Obesity also comes
with an enormous economic cost as well. When the yearly medical costs of an average
sized adult are compared to that of an obese adult, on average the medical costs for the
obese individual is 30% greater than that of the regular-sized adult (26). Further, by 2030
the total additional healthcare costs of obesity for the U.S. are estimated at 48-66 billion
(Both references failed to adjust these values for the beneficial effects of exercise) (19).
12
The economic and health related numbers reveals obesity as the true public health threat
that it has become.
While many of the problems associated with obesity are clearly established, the
etiology of obesity is less than clear. How did a disorder with such a low prevalence for
thousands of years suddenly erupt in the past twenty years, rising to one of the biggest
public health problems of the century? The etiology of obesity is extremely complex,
with interactions occurring between environment, behaviors, genetics, epigenetics,
changing physiological conditions and several other factors. Changing environmental
factors such as declining rates of physical activity, declining rates of total daily EE,
increasing energy density of foods, increasing total daily EI, the presence of toxins in our
drinking water, changes in macronutrient composition of diets, even the proposed
existence of an obesity virus may also play central roles for the rise in obesity (27-32).
While the causes of obesity are still being sifted out, the measurement and monitoring of
ES are still misunderstood as well. Proper measurement and examination of ES change is
essential for understanding obesity and future prevention of the disorder. The remainder
of this review is dedicated to giving an extensive look into the maintenance and
measurement bodyweight and composition. Additionally, this review focuses on the
measurement of EE and the potential association between EE and ES.
Bodyweight
Bodyweight is the most commonly used marker of ES change. The maintenance
of bodyweight is a crucial aspect of survival in most mammals including humans. In
addition, weight management is stressed by most organizations in order to avoid obesity.

13
While bodyweight changes can indicate an energy storage change, the two are not
interchangeable. Acute changes in bodyweight can occur strictly because of inter and
extra-cellular water changes which have no effect on the total amount of body energy.
Researchers have seen diurnal variations in bodyweight due strictly to body water
changes of roughly 5lbs, this is without a concerted effort from the participant to change
weight during the measurement period (13). Individuals making a concerted effort to
change their weight can have much more dramatic fluctuations. A investigation using
high school wrestlers found that in a 12hr period (from weigh-in for the competition until
the actual competition) the competitors gained an average of 2.2±1.7% of their
bodyweight, with the biggest gain being 7.2% of their original bodyweight (14). These
acute fluctuations in body water can confound changes that appear to be due to energy
storage alteration. However, sustained changes in bodyweight do typically mean changes
in energy storage.
The importance of bodyweight in relation to obesity can be seen with
organizations such as the WHO, Center for Disease Control (CDC), and the Obesity
Society and how they categorize obesity. These organizations and subsequently most of
the world use BMI, which is directly dependent on bodyweight to classify obese and non-
obese individuals.
In 1980 the United States Department of Agriculture (USDA) and the U.S.
department of Health and Human Services worked together to create the U.S. dietary
guidelines. The new guidelines used a formula known as BMI to determine whether an
individual was overweight or not. BMI was originally created in the 1830’s by Belgian
Adolph Quetelet for purposes not related to obesity. Quetelet wanted to define the

14
‘normal man’ in every way possible including the average overall size; as a result he
came up with the BMI scale. While quest to find the average man was extremely
important to Quetelet, the information was largely useless to most researchers, and
because Charles Darwin had not yet released his fundamental text The Origin of Species
and his ideas on evolution, the research was only pertinent to individuals of that time
period. Therefore the BMI scale was largely overlooked for the majority of 1800’s and
1900’s. Mainly the method was ignored because as previously mentioned during the
1800’s and early 1900’s there was no tremendous need for a method of defining obesity.
However, by 1972 obesity was slowly moving to the forefront of public health in the
developed world, requiring a method for defining the disorder. That year the previously
mentioned Ancel Keys, who was already renowned in the scientific-community for his
association of saturated fats, coronary artery disease (CAD), and cholesterol, released a
investigation promoting BMI as the best indication of an individual’s body fat and
subsequently their future risk for certain chronic diseases (18). In this investigation Keys
et al. states explicitly that BMI to explain an individual’s relative body fat only works for
population studies, on the individual level there is too much variation and BMI becomes
inaccurate. The idea that BMI could evaluate obesity on a population scale was embraced
and the previously mentioned 1980’s Dietary Guidelines had markers for what ideal body
fat based on BMI, anything under 25-26kg/m2 was considered ideal for males. The BMI
values for ideal, overweight and obese have been changed a redefined by several
associations over the past 34 years (103). Typically there are two values that
organizations can base cut-offs for obesity and overweight, one is criterion standards and
the other is reference values. Reference values are typically based on observed population

15
distributions of measured weights. In contrast, criterion standards are based on the
relation of weight to morbidity or mortality outcomes. While there is a benefit of using
BMI for population estimations of obesity, BMI is unable to clinically diagnose an
individual with obesity, even though most physicians use BMI as a clinical diagnostic
tool. Obviously, since BMI only takes into account height and weight, there is no actual
measure of body fat. Rothman et al. considers there to be three major issues to consider
when using BMI, [1] errors stemming from the fact that BMI is an indirect measure of
obesity, [2] errors in self-reported data and [3] the poor sensitivity and specificity of
BMI. There are several instances in the regular population where misclassifications can
occur with BMI, with aging body fat is typically gained and muscle is typically lost
(104). There is a strong relationship between BMI and body fat, but that relationship is
not linear. Once BMI passes a certain level body fat no longer increases with BMI (105).
While BMI values are usually correlated with body fat values on a population level, body
fat is more important marker of obesity on the individual level.
If current markers of obesity are used on old measurements of weight and height,
the values of obesity look different. Some of the first reliable height and weight
measurements came from population estimations at the beginning of the 1960’s through
the used off the National Examination Survey (NHES). From 1959-1962 the NHES
conducted surveys on body measurements and other predictors of chronic disease. The
survey revealed that the average BMI for a male in the early 1960’s was 25.14±3.87,
while the average BMI for a female was 25.14±3.87. The obesity in the time frame of
1959-1962 was estimated to be 16% for females and 10% for males (102;106). These
measurements would estimate that the average U.S. citizen was overweight by the current

16
BMI cut-points. . A similar study very similar to the NHES was begun in 1971 called the
National Health and Nutrition Examination Survey (NHANES). Like the NHES before,
the NHANES data looked at risk factors, medical, dental and physiological
measurements. However unlike the NHES the NHANES combined the interviews with
physical examinations. By the first recorded measurements of the NHANES in 1971 the
BMI for women had gone up to 25.05±5.54 and the BMI for men had risen to
25.56±4.14. The rates of obesity in 1971 also increased for 17% in women and 12% for
men. By 1988 when the third round of NHANES statistics was being collected the mean
BMI for females was 26.17±6.09 and the average BMI for males was 26.36±4.85 with an
estimated 23% of women being obese and 18% of men. Throughout the 1990’s obesity
exploded, the average BMI for females was 28.34±7.13 and the average BMI for males
was 27.75±5.57. Obesity prevalence in 1999 was estimated at 34% for females and 27%
for males. Over an 8 year period from 1991 to 1999 the obesity rate increased an average
of 10% for the American population.
According to the behavioral risk factor surveillance system the estimated average
obesity rate for both males and females was 11% in 1990 and by 2000 it was hovering
around 30%. The current estimates for obesity in America hover at roughly 35%. Despite
having slowed down over the past 15 years the prevalence of obesity is still expected to
increase dramatically over the next 20 years. Finkelstein et al. estimates that over the next
20 years there will be a 33% increase in the total prevalence obesity, meaning that nearly
half the population will be considered obese (2). An even more staggering estimation was
performed by Wang et al. who estimate that by 2030 over 90% of the country will be
overweight and 51% will be considered obese (107).

17
Numerous studies have investigated the overall weight change of adults. On
average, bodyweight increases have been documented in humans well into the seventh
decade of life (36). The practice of closely monitoring bodyweight and its relation to
mortality and morbidity are attributed to insurance companies over 70 years ago (36).
These records of weight-change show increases in bodyweight in the average adult
throughout the adult life. Steady weight-gain throughout adult life has been viewed as
physiologically normal (37). Most weight-change studies in America have used cross-
sectional measurements overtime to look at average change in the population. These
original research papers show small yearly weight-changes of roughly 1-2 kg (16;38).
While many researchers have assumed these changes to be normal and attributed them to
a slowing metabolic rate, others attribute these changes as a primary reason for obesity
pandemic and point to a low energy flux as the reason for the slow weight-gain (5).
Better assumptions and predictions regarding ES change can be made when body
composition is measured.
Body Composition
While obesity is classified by the WHO using BMI (height and weight
measurements), they define obesity as abnormal or excessive fat accumulation that may
impair health. As previously mentioned, the use of BMI for the classification of obesity
was first promoted by the Ancel Keys. Organizations like the WHO, Center for Disease
Control (CDC), Obesity Society, American Heart Association (AHA), and the American
Obesity Association (AOA) all define obesity as an excess amount of adipose tissue, yet
classify it based off of height and weight (BMI) (39). Because of their high-cost and

18
sometimes impractical nature, no actual methods of body composition measurement have
been used in large-scale epidemiological studies or for regular obesity-related clinical use
(40). Nonetheless, measurement of body composition and its changes over time are just
as critical in understanding the true etiology of obesity and disturbances in EB.
Obesity has been viewed as a severe health risk for thousands of years (41), but
more recently the reasons for the connection between obesity and health have emerged.
Researchers have shown that both the total amount of body fat and the level of physical
fitness are independent health risk factors associated with obesity. There is a clear
association between obesity and physical inactivity and a large body of evidence
indicates that the level of physical fitness is the most crucial aspect in determining all-
cause mortality and morbidity independent of bodyweight or composition (42-45).
However, some researchers have shown that the total amount of body fat may influence
all-cause mortality and morbidity independent of the level of physical activity (40;46-48).
The relationship of total body fat and health risk is less clear than the relationship of
physical fitness and health risk.
Attempts to accurately measure body composition began several hundred years
ago, but accurate non-invasive measurements have only been available for the last few
decades (49). Currently, body composition is looked at on a five-level system with each
level increasing in complexity. When viewing body composition in this system, the five
levels are: whole-body, tissue-organ, cellular, molecular, and atomic. Thanks to the
advances in technology and understanding of body composition, the human body can be
examined at all five levels with varying degree of accuracy today. However, this was not
the case 70 years ago when the monitoring of body composition first began. Human body

19
composition actually began with attempts to accurately measure the body composition of
fish. Researchers investigating a way of determining the oil content of fish created a
‘two-compartment’ model to describe the characteristics of the body composition of the
fish (49). Albert Behnke (often considered the father of modern body composition
measurement) developed an underwater weighing system (hydrodensitometry) that
included adjustment for residual air trapped in the lungs for humans based off the ‘two-
compartment’ model that divided the body into fat-free mass (FFM) and fat mass (FM)
(50). Behnke’s development was essential for understanding body composition. Several
years later in 1953, Keys and Brozek discovered that the FFM, unlike the FM was not
heterogeneous, FFM contained water, protein, minerals and carbohydrates (51;52). Even
though the composition of FFM was considered heterogeneous the density of FFM was
considered to be stable and consistent from person-to-person. Much later due to better
technology, researchers were able to discern that the FM was divided into fats and nonfat
lipids and determine that FFM density was not the same (53).However before these
discoveries Siri determined the density of FM as roughly 0.9 g/cm3 and the density of
FFM as 1.1g/cm3. The determination of these densities led to the accurate estimation
body composition based off of density and the foundation of all two compartment body
composition estimations.
In the late 1950’s Siri determined that body composition could be more accurate
than just a two compartment model, he divided the model into a three compartment
model by separating the FFM into lean mass and non-lean mass (54). Later a four
compartment model was constructed separating FFM into water, bone, bone mineral and
non-bone (55). Currently, in order to gain the most accurate measurements of body

20
composition researches estimate the densities of a six compartment model including: fat
mass, water, bone mineral, lean mass, soft-tissue minerals and glycogen (56). Ultimately
multi-component models were created to provide estimates on various components of
FFM and the more components that are included the more accurate the models become.
While the multi-compartment techniques are very accurate, for the majority of
clinical purposes the use of simple two compartment model is more cost effective and is
typically favored. The two-compartment model has remained relevant in research
predominantly because of the pandemic of obesity and the overarching health problems
associated with excess adipose tissue. The accuracy of the multi-compartment models is
lost in the two compartment model because the assumption must be made that FFM has a
consistent density. Nonetheless, some of these two-compartment techniques still give
very accurate estimations of FFM and FM. The measurement of FM remains difficult for
most measuring tools; on the contrary FFM is easier to measure. Subsequently, most
methods estimate FFM and then subtract the FFM from total mass to estimate the FM
(55). Total body water, hydrostatic weighing, urinary creatinine excretion, total body
postassium and skinfold measurements all use the two-compartment model to estimate
FM and FFM.
As previously mentioned hydrodensitometry is the oldest technique which utilizes
the two-compartment model. Because it the oldest technique for estimating body density
it is often viewed as the gold-standard even though other techniques are more accurate.
The practice of underwater weighing requires the subject to be completely submerged in
water. The volume of water displaced once the subject is underwater is then used to
calculate the overall body density. Because of the already mentioned variations in FFM

21
density several assumptions must be made based off of ethnicity, growth, sexual
maturation, physical activity and disease (57;58).
At roughly the same time hydrodensitometry was being developed and
implemented the techniques for total body potassium measurement were also being made.
The analysis of total body potassium (TBK) was not possible until the practice of nuclear
weapons and facilities required workers to be monitored for radioactivity. To facilitate
this need of monitoring radioactivity in workers, whole body counters were created. Soon
after the monitors were created it was noted that a constant peak of radiation was being
emitted from all workers independent of exposure levels, this peak was due to 40
K.
Researchers soon connected the potassium isotope with levels of lean mass, and made the
assumption that potassium levels were constant throughout lean mass. However, like
many assumptions in body composition the idea that potassium levels were constant
throughout lean mass was also disproven (59;60). When using potassium as a predictor of
lean mass the researcher is truly looking at the working body cell and estimating the
amount of FFM (55) The benefit of TBK is the overall precision of measurement. TBK
has the highest precision of the two-compartment techniques, but the drawback is the
accuracy has been shown as less than stellar (61;62).
In a fashion similar to TBK, total body water (TBW) has also been used to
estimate FFM. The water compartment of the body makes up roughly 73% of FFM and
60% of the total body weight, so the use of TBW to estimate total FFM and total body
composition affords usable values (63). However, the amount of water in FFM and the
total body is not consistent with age, race, muscle mass and several other factors. In
addition the inter-individual variation of TBW is extremely high due to hydration status,
22
food choice and medication status. However, while TBW varies from day to day in an
individual the hydration ration (TBW/FFM) remains relatively constant. Typically TBW
is measured by using the dilution principle using a tracer dose of labeled water and the
collection of blood, urine or saliva. The radioisotopes (tritium, deuterium, or oxygen-18)
are very expensive, and like TBK their use does not afford the greatest accuracy.
Typically, there is a standard error of roughly 10% associated with absolute fat mass
measurement using TBW (55).
Another technique using the two-compartment model is skin fold-measurements.
Like the previously discussed techniques, skin fold measurement estimations of body
composition are made with numerous underlying assumptions. The previously mentioned
researchers Brozek and Keys were the first to use skinfold calipers for body composition
estimation in 1951 (64). Like TBK and TBW, this method makes an assumption. Skin
fold measurements assume that subcutaneous fat is directly correlated with total body fat.
Like the assumptions made for TBK and TBW the correlation assumption for skin folds
has been disproven as well.
The multi-compartment models are used more often in clinical settings relative to
the two compartment techniques. The most recognized of these techniques include DXA,
computerized tomography (CT) scan, and magnetic resonance imaging (MRI). Out of the
three multi-compartment models the DXA is the most widely used. Most DXA scans
provide estimates of soft, lean, bone and fat tissue. The DXA scans are very accurate, but
they are also expensive and expose the participant to very small amounts of radiation
(65). The CT scan actually is more accurate in estimating body composition because the
scans have the ability to delineate organ size, calculate fat and muscle distribution and
23
bone size. However, the CT equipment is more expensive than DXA equipment and the
participant is exposed to more radiation. The MRI is arguably the most accurate of the
three mentioned multi-compartment models. The associated downside of the MRI is that
they are expensive and take longer than the other two scans. Along with the CT scan they
share the distinction of being able to accurately estimate visceral fat because they take a
three-dimensional scan. Visceral fat has recently been independently linked to many
chronic diseases and disorders (66), so the ability to differentiate between visceral and
subcutaneous fat is extremely vital to health. More recently DXA scans have acquired the
ability to quantify visceral fat, but are assumed by most to be less accurate because the
DXA scan only scans in a 2-dimensional field unlike the MRI and CT scans (67).
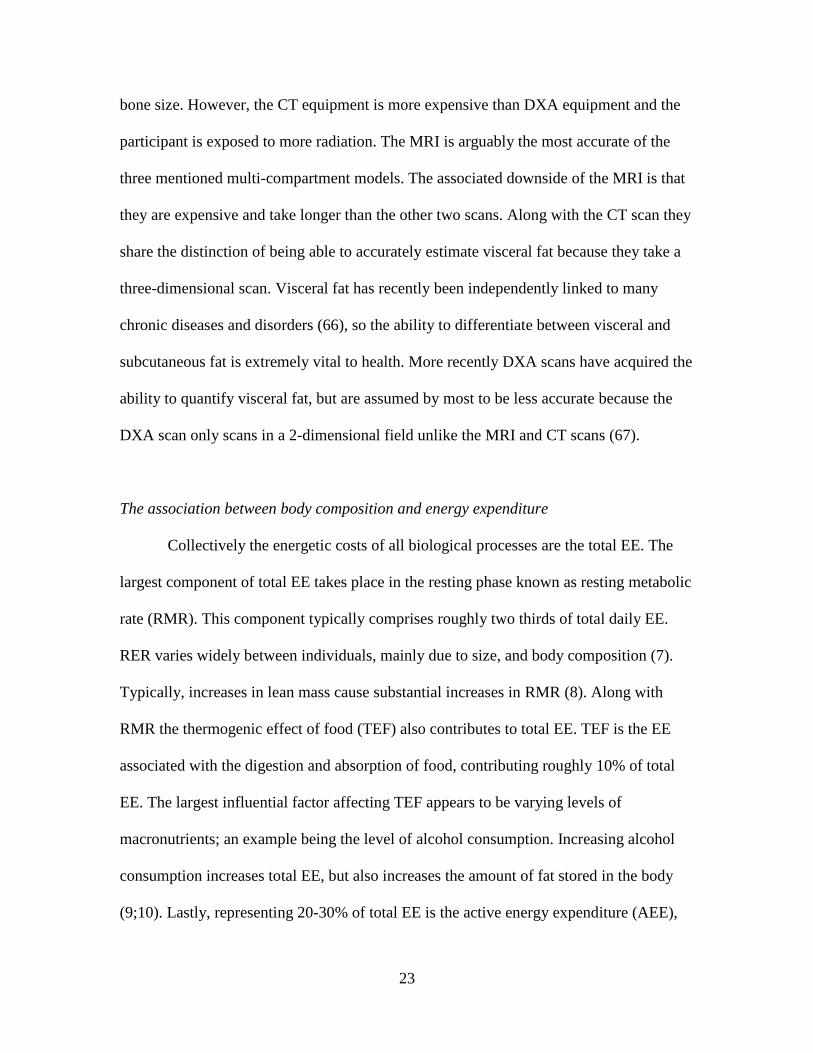
The association between body composition and energy expenditure
Collectively the energetic costs of all biological processes are the total EE. The
largest component of total EE takes place in the resting phase known as resting metabolic
rate (RMR). This component typically comprises roughly two thirds of total daily EE.
RER varies widely between individuals, mainly due to size, and body composition (7).
Typically, increases in lean mass cause substantial increases in RMR (8). Along with
RMR the thermogenic effect of food (TEF) also contributes to total EE. TEF is the EE
associated with the digestion and absorption of food, contributing roughly 10% of total
EE. The largest influential factor affecting TEF appears to be varying levels of
macronutrients; an example being the level of alcohol consumption. Increasing alcohol
consumption increases total EE, but also increases the amount of fat stored in the body
(9;10). Lastly, representing 20-30% of total EE is the active energy expenditure (AEE),

24
which represents all the energy consumed in activities requiring more than resting energy
level. AEE is typically segmented into exercising activity and non-exercising activity (6).
The techniques for measuring EE began nearly 400 years ago. Robert Boyle took
mice and sealed them in glass jars, not surprisingly the mice died. Along with mice Boyle
placed a candle and noted that the lives of the mice vanished at the same time as the
flame of the candle. From this experiment Boyle arrived at two conclusions, first, that
human life is combustible like a candle flame, and second that human life requires air
(113). The work of Boyle was quickly followed by the work of John Mayrow, who
performed a similar experiment to that of Boyle. Mayrow placed mice in sealed jars, but
recorded the changes in air in the jars, and found that mice died once they had consumed
roughly one fourteenth of the air in the jar. Mayrow, correct in his deductive reasoning
concluded that the air must consist of different parts. The work of Mayrow eventually led
to the first respirometer which quantified the consumed portion of air (114;115).
The elementary yet vital experiments Mayrow were followed by the experiments
of Lavoisier and Seguin nearly a century later (116). Lavoisier was a chemist enamored
with the process of combustion. Lavoisier and his admiration of combustion eventually
proved the phlogiston theory to be obsolete (117). The phlogistion theory was founded in
alchemy and hypothesized a fire-starting element was present inside of all combustible
entities and when combustion took place the phlogiston was released. Lavoisier was
intent on finding the true process of combustion in humans. Through countless studies
Lavoisier found that heat was produced between the steps of inhaling and exhaling and
that gas was exchanged. Eventually, Lavoisier was the first to describe a resting
metabolic rate (RMR), a resting VO2, and differences in these values between individuals

25
of varying physiological attributes. Perhaps the most important attribute of the
investigations made by Lavoisier was the founding of methodology for indirect
calorimetry and the measuring of EE in humans (114). Indirect calorimetry was
continually improved upon throughout the 18th and 19th century where Wilbur Olin
Atwater, a research chemist at Wesleyan University started using the methodology of
indirect calorimetry. Dr. Atwater unlike Lavoisier and Boyle before him was extremely
interested in human nutrition and composition of EI. While investigating EI, Dr. Atwater
inadvertently started studying EE as well using indirect calorimetry. With a 4 x 8 foot
container that measured oxygen consumption and carbon dioxide production, and energy
expenditure of humans. More importantly Dr. Atwater was one of the first scientists to
truly measure the interplay between EE and EI. While many of his advancements on
indirect calorimetry and EE still stand today, most of his beliefs on nutrition have been
proven false (118).
Predominantly, the measurement of oxygen consumption that was used in the
18th and 19th century is still used today. While the instruments have become more
sophisticated and open-flow systems are used in place of closed systems, the concepts
and general principles remain. The measures of EE were advanced upon by A.V. Hill and
the measurement of oxygen consumption and EE during different levels of athletic
performance (119). Interestingly, in the late 1920’s there was an increased EE following
exercise and found that EE rate was steady during exercise as long as the intensity was
below metabolic threshold. While Hill’s research discoveries further elucidated the
mysteries of human EE, indirect calorimetry fell short when trying to truly measure total
daily EE. Being restrained to a small container or strapped to Douglas bags for the

26
purpose of measuring oxygen consumption limited the capacity of testing EE. However,
around the time of Hill’s discoveries the use of direct observation began to be used to
measure the EE of physical activity.
Direct observation of physical activity is a very labor intensive job requiring
several skilled observers to record the activity being monitored. These methods of
accessing activity have mostly been used when evaluating the activities of either team
sports or of industrial workers who have highly repetitive movements. Many of the early
studies were initiated to improve work efficiency to improve profits. Frank Gilbreth and
Frederick Winslow Taylor performed many of these original investigations with the
primary motive of improving work efficiency (120). The goal was not to solely track the
amount of energy expended, but to track the movements that were unnecessary. The
skilled observer would also carry a stopwatch to find the minimum time in which the skill
could be performed, then work out notes on how the worker could possibly reach that
minimum time. Frederick Winslow Taylor was so consumed with this concept of making
tasks faster that he was known to constantly have a stopwatch around his neck. While
these studies were the foundation for time-and-motion studies, none of the experiments
were focused on the EE of the employees.
In 1931, William Giaque and Herrick Johnston isolated two different isotopes of
oxygen, followed in the same year by the discovery of deuterium (hydrogen isotope) by
Harold Urey (121). These isotopes were not well understood at the time, primarily
because the neutron had yet to be discovered. Nonetheless these isotopes were extremely
important; primarily because of there heavier mass they could be tracked and followed
through biological processes. Even though they were discovered in the early 30’s they
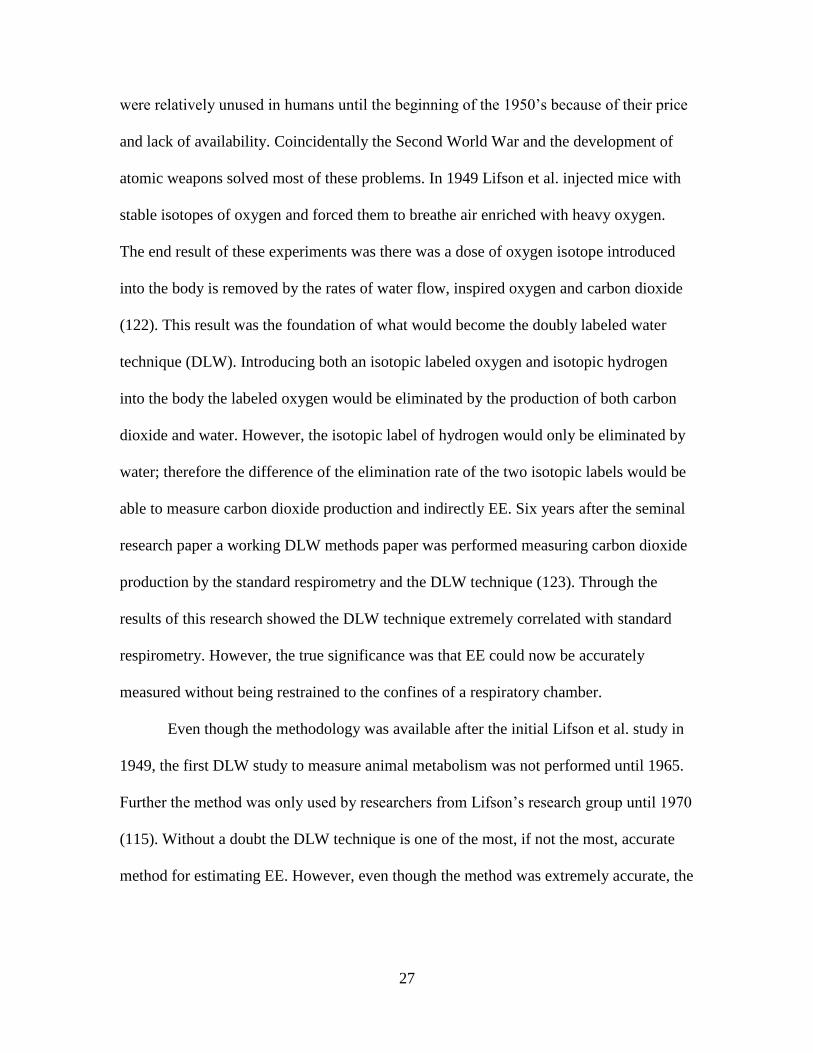
27
were relatively unused in humans until the beginning of the 1950’s because of their price
and lack of availability. Coincidentally the Second World War and the development of
atomic weapons solved most of these problems. In 1949 Lifson et al. injected mice with
stable isotopes of oxygen and forced them to breathe air enriched with heavy oxygen.
The end result of these experiments was there was a dose of oxygen isotope introduced
into the body is removed by the rates of water flow, inspired oxygen and carbon dioxide
(122). This result was the foundation of what would become the doubly labeled water
technique (DLW). Introducing both an isotopic labeled oxygen and isotopic hydrogen
into the body the labeled oxygen would be eliminated by the production of both carbon
dioxide and water. However, the isotopic label of hydrogen would only be eliminated by
water; therefore the difference of the elimination rate of the two isotopic labels would be
able to measure carbon dioxide production and indirectly EE. Six years after the seminal
research paper a working DLW methods paper was performed measuring carbon dioxide
production by the standard respirometry and the DLW technique (123). Through the
results of this research showed the DLW technique extremely correlated with standard
respirometry. However, the true significance was that EE could now be accurately
measured without being restrained to the confines of a respiratory chamber.
Even though the methodology was available after the initial Lifson et al. study in
1949, the first DLW study to measure animal metabolism was not performed until 1965.
Further the method was only used by researchers from Lifson’s research group until 1970
(115). Without a doubt the DLW technique is one of the most, if not the most, accurate
method for estimating EE. However, even though the method was extremely accurate, the

28
method was only cited sparingly throughout the 70’s and 80’s in scientific literature
(115). The reason this method was so rarely used is the enormous price tag it carries.
Regardless of measurement methods, EE is a process of energy production from
energy substrates (carbohydrates, lipids, proteins, and alcohol) combustion, in which
there is oxygen consumption and carbon dioxide production. This results in part of the
energy being lost as heat, and the remaining energy being stored in the high-energy bonds
of the ATP. The total energy required for an organism to function can be divided into
three components, RMR, TEF and AEE. The RMR is the minimal energy required for
body vital function maintenance. In an average-sized human the RMR represents roughly
60-70% of EE for those who are sedentary and roughly 50% for those who are physically
active. As previously mentioned the original RMR measurements were performed by
Lavoisier with indirect calorimetry. However early in the 20th century several intricate
and advanced(for their time) investigations were coordinated by Francis G. Benedict in
the Nutrition Laboratory of the Carnegie Institution of Washington (124). The purpose of
these studies was to develop a database which could be used to establish normal
standards for RMR and be the basis for RMR prediction equations (125). Amazingly,
while other prediction equations have been generated since the creation of the Harris-
Benedict studies (126), the original equations are still heavily used today to estimate
RMR. With some specific populations the Harris-Benedict prediction equations have
been shown to not accurately predict RMR (127). Nonetheless, these studies revealed the
impact of RMR on total EE, showing that over 60% of calories are dedicated to resting
maintenance of the body. In addition, the Harris-Benedict studies found that RMR varied
heavily with several factors including ethnicity, weight, lean body mass, age, smoking

29
habits, physical activity levels, diet, and environmental temperatures have all been shown
to affect an RMR.
While RMR has been shown by many investigations to be influenced by ethnicity
(128), the extent to which it influences RMR is open to speculation. Some investigators
reason that when other factors that influence RMR are accounted for except for ethnicity,
what are left are phenotypes not genotypes. Although ethnicity is a social way in which
humans recognize visual characteristics, they are not all genetically homogenous (129).
Unlike ethnicity, bodyweight and overall size have been repeatedly shown to
substantially influence RMR (130;131). Generally, a higher bodyweight results in a
higher absolute RMR. However, when looking at RMR per kg of bodyweight the RMR
does not have as strong a relationship with bodyweight. The most influential factor
regarding RMR is the amount of lean mass on an individual (8). The more lean muscle
mass an individual carries the higher the RMR. Even at rest muscle is substantially more
metabolically active than adipose tissue which causes these dramatic rises in RMR. Some
researchers postulated that the major differences in seen in fat-free mass are due to
different sizes in the very metabolically active tissues like the kidneys and the heart
(132). However, multiple investigations have shown that when these metabolically active
tissues are accounted for the prediction equations for resting energy expenditure are no
better than the equations created with simply fat-free mass not accounting for the
metabolically active organs.
The TEF is also known as diet-induced thermogenesis and is defined as the
increase in RMR following consumption of a meal (133). The previously mentioned
Seguin and Lavoisier were the first to show that oxygen consumption was increased

30
following a meal (134). More studies followed Lavoisier, showing that meals high in
protein caused greater increases in TEF than meals high in carbohydrates and fats. Wang
et al., was the first to question whether TEF played a role in obesity(135). The research
group eventually concluded that TEF played an insubstantial role in the development of
obesity. The responses of TEF are based on the activation of the sympathetic nervous
system, and there are known differences between obese and non-obese individuals in the
activation of the sympathetic nervous system (136). The TEF is thought to represent a
total of 3-10% of total EE, while this seems like a relatively small amount of calories
there are researchers that think TEF plays a substantial role in the development of obesity
(137). Many factors have been shown to affect TEF, on of the most substantial variables
is the size of the meal being ingested. D’Alessio et al. found that when a 1000-kcal meal
in consumed the fasting values accounts for roughly 10% of the total EI and this
percentage increases with an increasing caloric value (138). As previously mentioned the
macronutrient composition of a meal has also been investigated as far as the influence on
TEF. Proteins have the largest effect on TEF, while carbohydrates increase the value less.
Interestingly, it appears that fat has very little effect on the TEF (139-141). In addition to
the size, caloric and macronutrient content of a meal the meals of the day preceding
measurement appear to make a noticeable difference. Some researchers also hypothesize
that the amount of carbohydrate currently stored in the form of glycogen will dictate how
much TEF increases. This shows that the conversion of glucose to lipid instead of
glucose being converted to glycogen before being oxidized requires a greater amount of
energy (142). Body fat also influences TEF and has negative correlation that appears to

31
be independent of insulin resistance, however, insulin resistance combined with a high
body fat have shown extremely reduced values of TEF
The last component of total daily EE is AEE, which on average comprises
roughly two-thirds of total daily EE. Typically AEE is further subdivided into exercise
EE and NEAT. For the vast majority of the world exercise EE has been negligible for
centuries, and NEAT has been the predominant component of AEE (143). Even in
modern society including the most passionate athletic exercisers, NEAT still includes the
majority of calories included in AEE. NEAT includes every aspect of being an animated
human including all activities in daily life except for planned programmed exercise.
Because this obviously includes an extreme wide-variety of activities often times it is
difficult to define the parameters and how influential NEAT is to total daily EE. In
addition, NEAT is the most variable component of EE both within individual
measurement and between individual measurements. Interestingly, humans and animals
seem to vary enormously in the amount of spontaneous physical activity they accumulate.
Further, NEAT unlike exercise, may not require regulation from the higher cortex for the
brain, but instead from more autonomic brain sites such as the hypothalamus.
Some researchers believe that unconscious and volitional movement are under
homeostatic regulation and may be switched on or off in response to under or
overnutrition (144). While the theory that the brain regulates all NEAT in response to
fluctuations in eating there is relatively no testing supporting or negating this idea.
Another interesting theory is that NEAT is an intrinsic trait set by genes, and inherited at
a different level for each individual. However these levels of NEAT interact and fluctuate
with the environment (145). Those individuals who fidget more or spend more time

32
standing are more resistant to gaining weight than others (146;147). Intriguingly, both
theories have been supported by research. Regardless of the complete validation of either
theory it appears that there is a large neural component contributing to the control of
NEAT.
EE and ES are two of the three critical variables of the EB equation. Typically the
EB equation is viewed as ΔES=ΔEI-ΔEE, meaning that with concerted efforts to change
EI or EE a direct change in ES will be made. The regulation of the three variables of the
energy balance equation is heavily controlled by the endocrine system, the gut biota of
the gastrointestinal (GI) tract and the higher functioning centers of the central nervous
system (CNS). However, this is beyond the scope of the current review, for more
information on the regulation of the EB equation the reader should refer to the listed
references (4;68-71). There is an inherent efficiency to this regulation, and many
researchers believe that energy balance is best regulated for weight maintenance at a high
energy flux. Energy balance was left largely uninvestigated until the 1950’s. Jean Mayer,
Ph.D., D.SC, was one of the first to investigate energy balance and the etiology of
obesity. Mayer recognized that while an inflated EE realized through increased physical
activity generally results in an equivalent spike in EI, this does not always occur. His
previous animal studies show when rats are exercised on treadmills for incremental
predetermined volumes, EI varies linearly with exercise only within certain limits of
activity (108). Low enough activity levels termed the “sedentary” range do not evoke a
subsequent decrease in food intake, instead caused a substantial increase. Further, the
energy imbalance within the sedentary range resulted in an increase in both weight and
fat content of the rats. While intriguing, these experimental results had not been

33
explicated in humans; leaving the possibility that this was purely a rat phenomenon and
had no translation.
In the 1956 manuscript Relation between Caloric Intake, Bodyweight and
Physical Work: Studies in an Industrial Male Population in West Bengal, Mayer et al.
investigated the energy balance of 213 male workers of the Ludlow Jute Co., Ltd., at
Chengail, West Bengal (109). The workers of the West Bengal factory had an extreme
range of physical activity demands within the confines of their jobs allowing Mayer et al.
to attempt to correlate physical activity with food intakes and bodyweight. The workers
were divided into five roughly even-sized groups (Sedentary, light work, medium work,
heavy work and very heavy work) based upon their general daily physical activity. The
EI of all five groups were obtained through dietary interviews. Additionally, their diets
were analyzed for the amounts of animal protein, vegetable protein, total protein, fat,
carbohydrate, calories, thiamine, riboflavin, niacin, and vitamin C. Along with activity
level and EI other information was obtained including height, weight and various socio-
economic parameters.
Bodyweights of the Indian workers recorded as a function of physical activity
displayed an exponential decline with increasing physical activity, showing an asymptote
in bodyweight starting at the light group workers. The discrepancy between the sedentary
group and the activity workers is also seen in their BMI. The four working groups hold
BMIs of approximately 20, while the sedentary group hovers around a 25. The caloric
intake as a function of physical activity results mirrored those of the previous animal
studies. Between groups there were two established zones, the normal activity zone and
the sedentary zone. The normal activity zone containing the light work, medium work,

34
heavy work and very heavy work groups revealed a linear relationship among physical
activity and EI. The lightest workers in the normal activity zone have the lowest calories
consumed per day and the heaviest workers have the highest amount of calories
consumed per day. However, once the workers level of physical activity dips into the
sedentary zone the level of EI increases drastically, to a point approximately equal to that
of the heavy workers. This research importantly highlighted the evidence that potentially
there is an unregulated energy balance zone. Once the EE dipped into this sedentary zone
the regulatory factors of the endocrine and CNS was unable to control EI. While the
exemplary work of Mayer et al. helped reveal some of the associations between EE and
ES, the relationship is still not completely understood. The association between changes
in ES and levels of EE need to be explored.

35
CHAPTER II:
METHODS
Overall Methods:
The Energy Balance Study
The current dissertation will analyze data that was collected as a part of The
Energy Balance Study in an effort to elucidate the previously mentioned aims. The
primary outcome of The Energy Balance Study was to clinically monitor changes in
bodyweight and composition among young healthy adults. In addition, try to measure the
extent to which total daily energy expenditure (EE) and total daily energy intake (EI)
contribute to the measured bodyweight and composition changes. The aims of this
dissertation closely follow the overall aims of The Energy Balance Study, mainly how is
the bodyweight and composition changing over a year. The steep rise in obesity
prevalence over the past two decades has revealed that Americans are gaining weight
consistently. However, the exact amount of weight-gain and the rate at which the weight
is gained is unknown. Energy storage (ES) change is nearly impossible to predict with
only two bodyweight measurements. Dramatic daily fluctuations in total bodyweight are
caused by other factors aside from changes in ES, mainly water. With up to 65% of the
body being comprised of water; changes in hydration level greatly affect overall
bodyweight. These rapid changes in body water conceal the true trajectories of ES
36
Several questions remain regarding weight-gain and obesity. These questions
remain because there have been almost no studies with precise repeated measures of
bodyweight and composition in a clinical environment arranged in a longitudinal study
design. The Energy Balance Study is a clinical longitudinal study attempting to measure
the potential variables of weight gain and energy balance more accurately than ever
before.
Sample Population
The study recruited 430 healthy young adults (344 participants will be used in the
analysis of the three aims), age 21-35 years, with a body mass index (BMI) of 20-35
kg/m2. The recruited participants who completed their baseline had an average age of
27.7±3.8 yrs. The gender distribution of the participants was 212 males and 218 females,
while the racial distribution was 66.5% were Caucasian, 12.6% were African American,
10.7% were Asian, 3.0% Hispanic and the remaining 7.2% were reported as other or
mixed. Educationally, the sample population was comprised of 83.7% college graduates.
Lastly, the majority of participants (85.1%) did not have children and were not married
(52.1%).
The inclusion and exclusion criteria were generated in attempts to recruit
participants who would be healthy enough and available to participate for at least one
year of clinical measurements. The final exclusion criteria incorporated into the study
design were the following: medications used for weight-loss, started or stopped smoking
within 6 months of beginning the study, any type of weight-loss surgery, moving from
37
the area within the next 15 months, hypertensive (150mmHg systolic and/or 90mmHg
diastolic), currently diagnosed or taking medications for a major chronic health
conditions, history of depression, taking selective serotonin reuptake inhibitors,
ambulatory blood glucose levels ≥ 145 mg/dl, giving birth within the 12 months,
planning to start or stop birth control in the next 12 months while participating in the first
year of the study. The Energy Balance study protocols were approved by the University
of South Carolina Institutional Review Board.
For the current set of studies, the analyses will include all participants who
completed the measurements for bodyweight and composition, and wore an armband
activity monitor for each of the measured time points (baseline, 3m, 6m, 9m and 12m).
Lastly, outliers will be removed on per aim basis depending on the measurements being
used.
Study timeline
After baseline measurements, participants will be measured roughly every three
months over a year period. This dissertation will include data collected through the 12
month assessment. Table 2.1 includes all of the measurements that will be taken and
Table 2.2 includes all of the questionnaires that will be administered. The following are
detailed descriptions of all measurements to be used in the analyses for the current
dissertation.

38
Anthropometric Measurements:
All anthropometric measurements for the five primary visits (baseline, 3, 6, 9, and 12
month) were performed with the participant dressed in a pair of surgical scrubs and bare
feet. For all visits the BMI (kg/m2) was calculated from the average of three height and
weight measurements using a traditional stadiometer and electronic scale. The values for
both bodyweight and height were recorded to the nearest 0.1 centimeter and 0.1kg. Body
composition was measured using a Lunar fan-beam dual X-ray absorptiometry (DXA)
scanner (GE Healthcare model 8743, Waukesha, WI). The scans recorded total fat mass
(FM) and fat-free mass (FFM), as well as torso, arm and leg composition. In addition, the
scans recorded bone mineral density and content. For the baseline, 6 and 12 month visits
the waist and hip circumference of each participant was measured. The waist and hip
circumferences were measured using a calibrated spring-loaded tape measure. Waist
circumference was determined at the point midway between the costal margin and iliac
crest in the mid-axillary line approximately 2 inches above the umbilicus. Hip
circumference was measured at the widest point around the greater trochanter.
Circumferences recorded were the average of three measurements and were rounded to
the nearest 0.1cm.
Energy Expenditure:
The Energy Balance study used three measurement methods for the estimation of energy
expenditure (EE). The three methods included the SenseWear Mini Armband
(BodyMedia Inc. Pittsburgh, PA), the ActivPal (small inclinometer), and doubly labeled

39
water (DLW). Because the Activpal does not give a true estimation of EE and DLW was
only given to half of the participants, the SenseWear Mini Armband (BodyMedia Inc.
Pittsburgh, PA) was used as the primary measure of EE. The portable, multi-sensor
device is worn on the upper-left arm with the sensor itself resting over the triceps muscle.
EE is measured using a combination of a tri-axial accelerometer with biological sensors
measuring heat flux, galvanic skin response, near-body ambient temperature, and skin
temperature. The various measures are then entered into an algorithm using a Naïve
Bayes classifier for superior pattern recognition of estimating the context of an activity.
The combination of sensors gives the Mini Armband an enhanced ability to detect a
wider variety of activities (72). The detection ability of the Mini Armband has gone
through laboratory, free-living conditions (against DLW), and been compared to other
previously validated accelerometers. In a recent investigation by Johannsen et al. the
SenseWear Mini Armband was compared to the EE values generated by the use of free-
living DLW. The Mini Armband was exceptionally valid showing an average of 22
kcal/day difference in total daily EE, with error rates as low as 8.3±6.5%. The precise
results culminated in a regression analysis showing an R2=0.71 and intraclass correlations
of 0.85. The intraclass correlations suggested that only 15% of the variance was due to
the difference in DLW and armband methods, while the other 85% was due to differences
among individuals (72).
At each measurement period the participants were instructed to wear the monitor
for 10 consecutive days constantly for 24 hours except during water activities (i.e.,
swimming, bathing, showering, or water aerobics). When the participant did remove the
monitor the participants recorded these periods in an activity log. Each participant was

40
instructed to record any time the armband was removed in as much detail as possible
including the exact time the armband was removed and put back on. The non-wear
activities were then incorporated into the estimations of EE based on corresponding MET
values according to the 2011 Compendium of Physical Activities (73). The MET values
were then multiplied by the participant’s own measured resting metabolic rate (RMR).
The participant was considered to be compliant if they had seven days of (including 5
week days and 2 weekend days) at least 23 hours of verifiable time (either logged non-
wear time or armband worn).
Specific Aim 1
To determine the overall weight changes that occurs over a year period in a group of 344
healthy adults.
Overview: 344 healthy men and women aged 21 to 35 years old with a BMI of 20-
35kg/m2 from the Energy Balance Study will be used. The participants were monitored
for 12 months for weight changes and anthropometric changes. Each participant had
laboratory measurements performed at five different time points including a baseline, 3-
month, 6-month, 9-month and 12-month. The same clinical measurement protocols were
followed for each measurement period to ensure consistency among measurements. For a
full list and description of the measurements refer to Table 2 and the overall methods
section. The 12-month data for participants who performed all measurement periods will
be used for analysis. Once the 12-months of data are completed, the weight measurement
at each quarterly measurement period including baseline will be used to construct a linear

41
mixed-model (LMM) for weight change. The model will use bodyweight as a dependent
variable so that the interdependence of each measurement is taken into account. The
LMM will calculate an overall average slope indicating the rate of weight-change for the
entire population. The overall average slope will take into account the sum of the fixed
slopes for the entire group. In addition, the individual’s slope will be calculated as well
using the sum of the fixed (average) slope. The individual (total) slope, will be the sum of
the fixed and random slope estimates, and will represent the rate of change in weight for
each participant. Once the slopes are calculated the standard error (SE) of each individual
slope will be computed as the square root of the sum of the variances for each estimate.
The SE of the random slope estimate for each participant will be computed using the
predict command’s reses option in STATA 13 (Stata Corp., College Station, TX).
Following the creation of the SE values, the participants will then be grouped based these
values into five groups including substantial weight gainers, weight gainers, weight
maintenance, weight losers, and substantial weight losers. The groups will be determined
by comparing the participants projected bodyweight change, as calculated by the LMM
relative to the SE. The participant’s weight-change will be categorized into five
categories including: substantial weight-loss (SWL), weight-loss (WL), weight-
maintenance (WM), weight-gain (WG) and substantial weight-gain (SWG).
Research Design
The Energy Balance Study was an observational longitudinal study consisting of 430
healthy men and women aged 21 to 35 years old with a BMI of 20-35kg/m2. The group
was followed for 12-months having measurements taken roughly every three months at

42
the time periods baseline, 3m, 6m, 9m, 12m. The participants will all measurements
during the 12 months of data will be used for analysis. The weight will be gathered from
the electronic scale measurements and the data will be used for a LMM which will
provide rate of change trajectories for weight-change.
Hypothesis
1.1 The overall average weight-change of the 344 participants will be similar to
estimates for the yearly weight gain of Americans, roughly 1-3lb.
1.2 The LMM will give predictions with less intra-subject variability and therefore a
more precise rate of bodyweight change. The use of several measurements as opposed to
two measurements will better account for intra-subject variation.
1.3 The overall amount of weight gainers will be greater than the other two groups.
The weight-stable group will have the least amount of participants.
Anticipated Outcomes
The trajectories produced by the LMM will show that the total EB group has a greater
amount of weight-gainers than when compared to weight-change using cross-sectional
analysis of 12-month weight minus the baseline measurement.
The trajectories of weight gain will be similar across gender as well as the entire age
range of the group (21-35yr).

43
Specific Methods
Anthropometric Measurements:
All anthropometric measurements for the five primary visits (baseline, 3, 6, 9, and 12
month) were performed with the participant dressed in a pair of surgical scrubs and bare
feet. For all visits the BMI (kg/m2) was calculated from the average of three height and
weight measurements using a traditional stadiometer and electronic scale. The values for
both weight and height were recorded to the nearest 0.1 centimeter and 0.1kg.
Linear Mixed Model Analysis for Weight-change Trajectory
A LMM will be used to analyze the estimated weight-change of the 344 participants over
12 months using 5 (Baseline 2, 3, 6, 9, and 12 month) of the time point weight
measurements. However prior to solidifying the permanent mixed-effect regression
model the measurements and assumptions made will be checked to ensure the residuals
and estimates of the random intercepts are normally distributed. An iterative influence
diagnostics performed on SAS 9.3 in order to identify any outliers or abnormal
measurements. Because of the large volume of participants in the study the dates between
follow-up measurements will be on slightly different days meaning the observations will
be uneven. The mixed effect regression model accounts for these differences in
measurement time making it a premier tool for analysis of longitudinal data. In addition,
weight measurements vary depending on fluid retention, electrolyte balance,
menstruation and other acute factors. These vary factors can cause deviations in the
weight measurement that do not reflect a true increases or decreases in energy storage,
44
the mixed effect regression model accounts for these variations. The random-effects
model will allow individual participants to have their own intercepts and slopes which
allow for the precise changes that are needed to monitor weight over extended periods of
time.
Grouping of weight-change
Once the trajectories from the LMM are created the participants will be divided
based on gender and the amount of weight-change that was experienced during the 12-
month period. There will be 5 specific groups of weight-change for each gender
including: Substantial weight-gain, weight gain, weight maintenance, weight-loss and
substantial weight-loss. The calculation of each participants slope and associated standard
error (SE) will be used to categorize annual weight change into 5 categories: substantial
weight gain (SWG) if positive and 95% CI excluded 0; weight gain (WG) if positive and
68% CI excluded 0; weight maintenance (WM) if 68% CI contained 0; weight loss (WL)
if negative and 68% CI excludes 0; and substantial weight loss (SWL) if negative and
95% CI excludes 0.
Specific Aim 2
To determine the overall body composition changes that occurs over a year period to a
group of 344 healthy adults.
Overview: 344 healthy men and women aged 21 to 35 years old with a BMI of 20-
35kg/m2 from the Energy Balance Study will be used. The participants were monitored
for 24 months (however for this aim 12-months of data will be used) for weight-changes

45
and anthropometric changes. Each participant had laboratory measurements performed at
7 different time points including a baseline 1, baseline 2, baseline 3, 3-month, 6-month,
9-month and 12-month. The same clinical measurement protocols were followed for each
measurement period to ensure consistency among measurements. For a full list and
description of the measurements refer to table 2 and the overall methods section. The 12-
month data for participants who performed all measurement periods will be used for
analysis. Once the 12-months of data are completed, the body composition measurements
at each quarterly measurement period including baseline will be used to construct a LMM
for body composition. The model will use FM and FFM as two correlated dependent
variables in a single multivariate model, so that a covariance matrix is formed for the
residuals allowing FFM and FM to be correlated within person at each time point. The
individual slopes for FM and FFM will be used to create ten (2 non-independent groups
of 5 based on fat-change and fat-free mass change) groups: participants who are gaining
substantial amounts of FM, those who are gaining FM, those maintaining FM, those
losing FM, those who are losing substantial amounts of FM, those who are gaining
substantial amounts of FFM, those who are gaining FFM, those who are maintaining
FFM, those who are losing FFM, and those who are losing substantial amounts of FFM.
Research Design
The Energy Balance Study was an observational longitudinal study consisting of 430
healthy men and women aged 21 to 35 years old with a BMI of 20-35kg/m2. The group
was followed for 12-months having measurements taken roughly every three months at
the time periods baseline, 3m, 6m, 9m, 12m. The participants will all measurements

46
during the 12 months of data will be used for analysis. The body composition will be
gathered from the DXA measurements and the data will be used for a LMM which will
provide rate of change trajectories for fat-free and FM.
Hypothesis
2.1 The overall average body composition changes of the 344 participants will exhibit
changes in body fat similar to the changes seen in overall bodyweight. Primarily the
weight gained by participants will be due to additional body fat.
2.2 The LMM will give a better representation of each participant’s true body
composition changes as compared to a traditional simple cross-sectional measurement.
The linear mixed model will include several measurements. The use of several
measurements as opposed to two measurements will better account for random
fluctuations and give a true determination of body composition changes over a year.
2.3 The three groups of fat gainers will have a greater amount of participants than the
other 6 groups. The fat-stable groups will have the least amount of participants. The
values for the fat-gainer group and the fat-stable groups will be highly correlated with the
weight-gainers and the weight-stable groups.

47
Anticipated Outcomes
The trajectories produced by the linear mixed-effects model will show that the total EB
group has a greater amount of fat-gainers than when compared to fat change using cross-
sectional measurements of 12-month weight minus the baseline measurement.
The trajectories of fat and fat-free change will be similar across gender as well as the
entire age range of the group (21-35yr).
Specific Methods
Anthropometric Measurements:
All anthropometric measurements for the 5 primary visits (baseline, 3, 6, 9, and 12
month) were performed with the participant dressed in a pair of surgical scrubs and bare
feet. For all visits the BMI (kg/m2) was calculated from the average of three height and
weight measurements using a traditional stadiometer and electronic scale. The values for
both weight and height were recorded to the nearest 0.1 centimeter and 0.1kg. Body
composition was measured using a Lunar fan-beam dual X-ray absorptiometry (DXA)
scanner (GE Healthcare model 8743, Waukesha, WI). The scans recorded total fat and
FFM, as well as torso, arm and leg composition. In addition, the scans recorded bone
mineral density and content. For the baseline, 6 and 12 month visits the waist and hip
circumference of each participant was measured. The waist and hip circumferences were
measured using a calibrated spring-loaded tap measure. Waist circumference was
determined at the point midway between the costal margin and iliac crest in the mid-
48
axillary line approximately 2 inches above the umbilicus. Hip circumference was
measured at the widest point around the greater trochanter. Circumferences recorded
were the average of three measurements and were rounded to the nearest 0.1cm.
Linear Mixed Model Analysis for Weight-change Trajectory
A LMM will be used to analyze the estimated body composition changes of the 344
participants over 12 months using 5 (Baseline 2, 3, 6, 9, and 12 month) body composition
measurements. However prior to solidifying the permanent mixed-effect regression
model the measurements and assumptions made will be checked to ensure the residuals
and estimates of the random intercepts are normally distributed. An iterative influence
diagnostics performed on SAS 9.3 in order to identify any outliers or abnormal
measurements. Because of the large volume of participants in the study the dates between
follow-up measurements will be on slightly different days meaning the observations will
be uneven. The LMM accounts for these differences in measurement time making it a
premier tool for analysis of longitudinal data. The model will use FM and FFM as two
correlated dependent variables in a single multivariate model, so that a covariance matrix
is formed for the residuals allowing FFM and FM to be correlated within person at each
time point. The multivariate model will create two fixed intercepts, two fixed slopes, 2
random intercepts and 2 random slopes; essentially there will be 2 univariate equations
into a single equation. The correlated residuals for each of the equations will allow FFM
and FM to be correlated within the person at each time point.

49
Grouping of body composition change
The ten categories will be generated once the trajectories from the LMM are
created for FFM and FM. There will be 10 non-exclusive groups of fat change and fat-
mass change including: Substantial fat-gain (SFG), fat gain (FG), fat maintenance
(FMM), fat loss (FL), substantial fat loss (SFL), substantial fat-free gain (SFFG), fat-free
gain (FFG), fat-free maintenance (FFMM), fat-free loss (FFL), substantial fat-free loss
(SFFL). The calculation of each participants slope and associated standard error (SE) will
be used to categorize annual FM and FFM change into ten categories: substantial fat gain
or fat-free gain (SFG or SFFG) if positive and 95% CI excluded 0; fat or fat-free gain
(FG or FFG) if positive and 68% CI excluded 0; fat or fat-free maintenance (FMM or
FFMM) if 68% CI contained 0; fat or fat-free loss (FL or FFL) if negative and 68% CI
excludes 0; and substantial fat or fat-free loss (SFL or SFFL) if negative and 95% CI
excludes 0.
Specific Aim 3
To determine the effect of total average daily activity EE on body composition
independent of changes in EE due to changes in bodyweight.
Overview: 344 healthy men and women aged 21 to 35 years old with a BMI of 20-
35kg/m2 from the Energy Balance Study will be used. The participants were monitored
for 24 months (however for this aim 12-months of data will be used) for weight-changes
and anthropometric changes. Each participant had laboratory measurements performed at
five different time points including a baseline, 3-month, 6-month, 9-month and 12-month.
The same clinical measurement protocols were followed for each measurement period to
50
ensure consistency among measurements. For a full list and description of the
measurements refer to table 2 and the overall methods section. Once the 12-months of
data are completed, the 5 EE measurement periods, consisting of 10-days of constant
wear-time for each participant will be averaged to generate overall-mean EE for each
participant. The overall average EE for all of the participants will then be compared
based on the groups of bodyweight and composition change from aims 1 and 2. The
overall EE, EE per kg of bodyweight, percentage of EE from sedentary activity and
physical activity EE will be compared between the groups of bodyweight and
composition change. The four measurements of EE will tested amongst the bodyweight
and composition groups with a single ANOVA.
Research Design
The Energy Balance Study was an observational longitudinal study consisting of 430
healthy men and women aged 21 to 35 years old with a BMI of 20-35kg/m2. The group
was followed for 12-months having measurements taken roughly every three months at
the time periods baseline, 3m, 6m, 9m, 12m. The complete 12 months of data will be
used for analysis. The EE measurements will come from the use of the SenseWear Mini
Armband measurements. The bodyweight and composition rate of values produced in
aim 1 and 2 will be used for each participant.
Hypothesis
3.1 The participants who maintain bodyweight over the year period will have the
higher relative total daily EE.

51
3.2 The participants who maintain body fat over the year period will have the
higher total daily EE.
3.3 The participants gaining substantial bodyweight will derive a higher
percentage of their total daily EE from sedentary behavior
Anticipated Outcomes
Participants who are gaining weight but have a high EE will experience a greater amount
of FFM than relative to those participants gaining weight with a low EE.
Participants who are losing weight but have a high EE will lose a higher percentage of
FM as opposed to FFM relative to those participants losing weight that have a low EE.
The largest majority of participants will be weight-gainers and have a low EE. These
participants will gain more fat-mass relative to the other groups of participants.
Specific Methods
Anthropometric Measurements
All anthropometric measurements for the 5 primary visits (baseline, 3, 6, 9, and 12
month) were performed with the participant dressed in a pair of surgical scrubs and bare
feet. For all visits the BMI (kg/m2) was calculated from the average of three height and
weight measurements using a traditional stadiometer and electronic scale. The values for
both weight and height were recorded to the nearest 0.1 centimeter and 0.1kg. Body

52
composition was measured using a Lunar fan-beam dual X-ray absorptiometry (DXA)
scanner (GE Healthcare model 8743, Waukesha, WI). The scans recorded total fat and
FFM, as well as torso, arm and leg composition. In addition, the scans recorded bone
mineral density and content. For the baseline, 6 and 12 month visits the waist and hip
circumference of each participant was measured. The waist and hip circumferences were
measured using a calibrated spring-loaded tap measure. Waist circumference was
determined at the point midway between the costal margin and iliac crest in the mid-
axillary line approximately 2 inches above the umbilicus. Hip circumference was
measured at the widest point around the greater trochanter. Circumferences recorded
were the average of three measurements and were rounded to the nearest 0.1cm.
Energy Expenditure
The Energy Balance study used three types of measurement for estimation of energy
expenditure. The three types included the SenseWear Mini Armband (BodyMedia Inc.
Pittsburgh, PA), the ActivPal (small inclinometer), and DLW. Because the Activpal does
not give a true estimation of EE and DLW was only given to half of the participants, the
SenseWear Mini Armband (BodyMedia Inc. Pittsburgh, PA) is used as the primary
measure of energy expenditure. The portable, multi-sensor device is worn on the upper-
left arm with the sensor itself resting over the triceps muscle. Energy expenditure and
activity are measured using a combination of a tri-axial accelerometer with biological
sensors measuring heat flux, galvanic skin response, near-body ambient temperature, and
skin temperature. The various measures are then entered into an algorithm using a Naïve

53
Bayes classifier for superior pattern recognition of estimating the context of an activity.
The combination of sensors gives the Mini Armband an enhanced ability to detect a
wider variety of activities (72) In addition, the Mini Armband has gone through both
laboratory and free-living conditions (against DLW) and other previously validated
accelerometers. In a recent investigation by Johannsen et al. The SenseWear Mini
Armband was compared to the EE values generated by the use of free-living DLW. The
Mini Armband was exceptionally valid showing an average of 22 kcal/day difference in
total daily EE, with error rates as low as 8.3±6.5%. The precise results culminated in a
regression analysis showing an R2 =0.71 and intraclass correlations of 0.85. The
intraclass correlations suggested that only 15% of the variance was due to the difference
in DLW and armband methods, while the other 85% was due to differences among
individuals (72).
At each measurement period of The Energy Balance Study the participants were
instructed to wear the monitor for 10 consecutive days, for 24 hours a day, except during
water activities (i.e., swimming, bathing, showering, or water aerobics). If the monitor
was removed the participants recorded the type and duration of activity that was
performed while the armband was removed in an activity log. The non-wear activities
were then incorporated into the estimations of EE based on corresponding MET values
according to the 2011Compendium of Physical Activities (73). The MET values were
then multiplied by the participant’s own measured resting metabolic rate (measured
during the baseline, 6-month and 12-month visits). The participant was considered to be
compliant if they had 7 days of (including 5 week days and 2 weekend days) at least 23
hours of verifiable time (either logged non-wear time or armband worn).

54
Linear Mixed Model Analysis for Weight-change Trajectory
The LMMs created in aim 1 and 2 to analyze the estimated rate of bodyweight and
composition change of the 344 participants over 12 months using 5 (Baseline 2, 3, 6, 9,
and 12 month) will be used in aim 3 to compare relative to the participants energy
expenditure.
Statistical Analysis
Data will be analyzed with commercial software (Sigma Stat, SPSS, Chicago, IL).
Statistical analysis will consist of one-way ANOVA’s to test for differences in the four
measures of EE across the groups of bodyweight and composition change created in aims
1 and 2. Post-hoc power calculations will be done. Statistical significance will be set with
an alpha value of p<0.05. Data will be presented as means ± SEM in figures and means
±SD in tables.

55
Table 2.1: Measurements Taken for the Energy Balance Study
Baseline
3M 6M 9M 12M 15M
18M 21M 24M
Physical
activity and
dietary
assessment
X X X X X X X X
Body
composition
assessment
X X X X X X X X X
Resting
metabolic
rate
X X X X X
Blood
chemistry X X X X X
Fitness test X X
Doubly-
labeled
water
(n=184)
X

56
Table 2.2: List of Questionnaires Administered in the Energy Balance
Study
Baseline
3M 6M 9M 12M 15M
18M 21M 24M
Demographics X X X
Medical
History X
Pittsburgh
Sleep Quality
Index
X X X
Perceived
Stress Scale X X X
Eating
disorders X X X
Three-Factor
Eating
Questionnaire
X X X
Control of
Eating
Questionnaire
X X X
Body Image X X X
Profile of
Mood State X X X
Social
desirability-
Social App
X X X
International
Physical
Activity
Questionnaire
X X
Physical
Activity X X X X X X X X X
Life Events X X X X X X X X X

57
CHAPTER III
RATES OF WEIGHT-CHANGE IN THE ENERGY BALANCE
STUDY OVER A ONE YEAR PERIOD
Abstract:
Introduction: The current research literature lacks detailed evidence on how bodyweight
changes throughout adult life. Tracking bodyweight measurements from measurement to
measurement tends to increase intra-person variability because of body water flux. A
better method for monitoring bodyweight-change over time is needed to better
understand weight maintenance and weight-gain.
Objective: The purpose of this study was to measure bodyweight changes in young
healthy adults for a year period. Then, develop a linear mixed model (LMM) to predict
bodyweight changes in the adults participating in the study.
Methods: 339 healthy young adults completed a year-long longitudinal study, which
included five clinical measurement sessions where bodyweight was measured. The
recorded bodyweight measurements were used to create an LMM, which calculated the
rate of bodyweight-change. Based on the predicted LMM measurements the participants
were categorized into one of five groups (substantial weight loss (SWL), weight loss
(WL), weight maintenance (WM), weight gain (WG), or substantial weight gain (SWG).
58
Results: The male participants who completed the study had a calculated yearly weight-
change of 1.34±2.28, and female participants who completed the study had a calculated
yearly weight change of 0.79±2.08. Once the male participants were grouped, roughly
93% (154 participants) were considered to either be maintaining or gaining weight. Only
approximately 7% (12 participants) were considered as losing weight over the year
period. For females a similar trend was recorded with 86% (148 participants) being
considered maintaining or gaining, while only 14% (25 participants) were considered to
be losing weight. Lastly, for both males and the females the SWG and SWL groups had a
substantially heavier bodyweight at baseline relative to the WM group.
Conclusion: The calculated weight-change for males and females by the LMM was very
similar to measured weight-change over 12 months. However, when both values are
viewed for each individual in the study, the LMM predicted change and the measured
change are significantly different. Assessing bodyweight from measurement to
measurement may lead to a misinterpretation of how bodyweight is truly changing over
time.
Keywords: Bodyweight, Linear mixed model, weight-change, weight-gain
Introduction
Obesity is a public health concern in the United States, (US), with over a third of
the population being affected by the disorder. As evidenced by the dramatic increases in
obesity prevalence, Americans are rapidly gaining weight. While there is clear
understanding that Americans are gaining weight, little is actually known regarding the

59
pattern and rate of weight-gain. What percentage of the population is gaining weight?
What percentage of the population is maintaining weight? Is the percentage of the
population who are gaining weight equal across genders? What is the difference between
substantial weight gain and inconsequential weight gain?
Weight-change is often thought of as the result of an energy storage change,
which is not always the case. Typically body composition is viewed in a two
compartment model divided into fat mass (FM) and fat-free mass (FFM) (15). These two
components have drastically different energy densities, and fluid levels. FFM is
comprised of a much higher percentage of water than FM; roughly 80% of FFM is water.
The water composition of fat tissue is much less, but can range from 7 to 43% (74).
Considering that the amount of FFM is typically much higher than fat-mass, the total
water content of the body may be as high as 75% of the total mass. Relatively moderate
changes in this large volume of water can account for dramatic acute changes in weight.
The body typically loses 2-3 liters of water a day with the amount of water being lost
fluctuating dramatically depending on the amount of physical activity performed and
environmental stressors. This water is gained back through hydration in food and drink
and hydration levels in an individual can vary greatly day-to-day. These large
fluctuations in water cause changes in weight not due to a true change in energy storage
in the tissue, since water has no energy value.
Traditionally studies measuring weight-change, take a starting measurement
relative to an ending measurement to describe weight-change over a certain period of
time. There are several inadequacies in this form of measuring weight-change. The
difference between two cross-sectional bodyweight measurements cannot account for

60
changes due to fluctuations in water, i.e., inter-measurement variability. The simple
difference method assumes that the starting measurement is what the individual weighed
at the time of measurement, whereas the LMM gives a prediction of their starting weight
based on all of the measurements taken. Multiple measurements may be used when
longitudinal data is employed to monitor weight-change. Factoring in multiple
measurements and the precision of these measurements an LMM is able to predict a rate
of change.
The following study predicts rates of weight-change using clinical bodyweight
measurements in a linear mixed model (LMM) over a 12-month period with healthy
participants ages 21-35yr at baseline. This investigation affords precise estimates of
overall weight-change and rates of weight-change in healthy young Americans.
Methods
Study Population
The current study uses data that were collected from June 2011 to January 2014 as
part of The Energy Balance Study. The complete methods and overall study design have
been described (75). The current study uses a subset of The Energy Balance population
including 344 healthy young adults (339 were used for final analysis after exclusion of
outliers) ages 21-35 years old, with a body mass index (BMI) of 20-35 kg/m2. Exclusion
criteria included planned weight-loss surgery, hypertension (150- mmHg systolic and/or
90 mmHg diastolic), taking selective serotonin reuptake inhibitors, giving birth within the
past 12 months, planning to start or stop birth control in the next 12 months while
participating in the first year of the study, history of depression, currently diagnosed or
taking medications for a major chronic health condition, using medications to lose
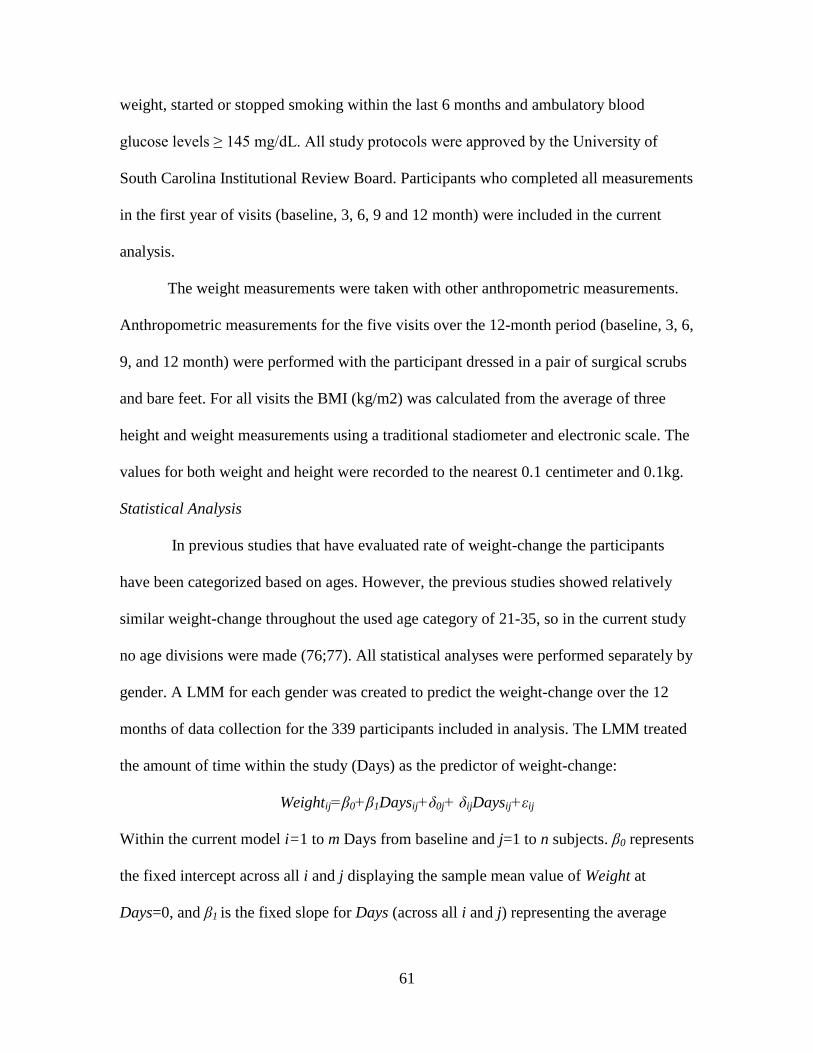
61
weight, started or stopped smoking within the last 6 months and ambulatory blood
glucose levels ≥ 145 mg/dL. All study protocols were approved by the University of
South Carolina Institutional Review Board. Participants who completed all measurements
in the first year of visits (baseline, 3, 6, 9 and 12 month) were included in the current
analysis.
The weight measurements were taken with other anthropometric measurements.
Anthropometric measurements for the five visits over the 12-month period (baseline, 3, 6,
9, and 12 month) were performed with the participant dressed in a pair of surgical scrubs
and bare feet. For all visits the BMI (kg/m2) was calculated from the average of three
height and weight measurements using a traditional stadiometer and electronic scale. The
values for both weight and height were recorded to the nearest 0.1 centimeter and 0.1kg.
Statistical Analysis
In previous studies that have evaluated rate of weight-change the participants
have been categorized based on ages. However, the previous studies showed relatively
similar weight-change throughout the used age category of 21-35, so in the current study
no age divisions were made (76;77). All statistical analyses were performed separately by
gender. A LMM for each gender was created to predict the weight-change over the 12
months of data collection for the 339 participants included in analysis. The LMM treated
the amount of time within the study (Days) as the predictor of weight-change:
Weightij=β0+β1Daysij+δ0j+ δijDaysij+εij
Within the current model i=1 to m Days from baseline and j=1 to n subjects. β0 represents
the fixed intercept across all i and j displaying the sample mean value of Weight at
Days=0, and β1 is the fixed slope for Days (across all i and j) representing the average

62
linear trend (rate of change) across Days. δ0j calculates the random intercept for each j
representing the deviation of each person’s intercept from β0 (at Days=0), and δ1j is the
random slope for Days for each j representing the deviation of each person’s slope from
β1. The individual (total) slope, which is the sum of fixed and random slope estimates, β1
+ δ1j, represents the rate of change in weight for subject j. The SE of this individual slope
was computed as the square root of the sum of the variances for each estimate. The SE of
the random slope estimate for each individual was computed using the predict
command’s reses option in STATA 13 (Stata Corp., College Station, TX).Iterative
influence diagnostics including Cook’s Distance were performed using SAS 9.3 software
in order to indentify any outliers or abnormal measurements. The LMM was fit so that
the intercept estimate was set on the baseline day of the study allowing for weight
prediction of the initial measurement and for the last measurement.
Once the model was fitted each participant’s were divided based on
gender and the amount of weight-change that was experienced during the 12-month
period. Five specific groups of weight-change for each gender including: Substantial
weight-gain, weight gain, weight maintenance, weight-loss and substantial weight-loss.
The calculation of each participants slope and associated standard error (SE) were used to
categorize the weight change into the five categories: substantial weight gain (SWG) if
positive and 95% CI excluded 0; weight gain (WG) if positive and 68% CI excluded 0;
weight maintenance (WM) if 68% CI contained 0; weight loss (WL) if negative and 68%
CI excludes 0; and substantial weight loss (SWL) if negative and 95% CI excludes 0.

63
For comparison between groups the weight-change groups paired t-test were used
and a p-value <0.05 was used to determine significance. For comparison between gender
a paired t-test was used and a p-value<0.05 was used to determine significance.
Results
The average yearly weight-change for males was calculated by the LMM to be
1.34±2.28 kg (1.64±2.77%), while females were calculated to have a change of
0.78±2.07kg (1.09±2.81%) per year. The average weight-change trajectory for each
gender can be seen in Figure 3.1. When the average yearly weight-change was calculated
for males using the simple difference method measurement (i.e., subtracting the baseline
from the 12-month measurement), the result was 1.28±3.47kg. For females the simple
difference method yielded a result of 0.76±2.93kg. For both genders the simple
difference method of measurement and LMM appear very similar, yielding roughly
equivalent averages for the year. However, the difference between absolute values of the
simple difference measurement and the calculated weights accrued from the LMM was
1.02±0.91kg for males and 0.82±0.71kg for females, showing that there were substantial
differences between the two methods on the individual participant level.
Out of the 166 male participants, 154 were considered as either maintaining or
gaining weight. For the 173 female participants, 148 participants were considered as
either maintaining or gaining weight. When viewing the weight-change groups, the SWG
group had the highest average calculated weight-change for males and females
(4.20±1.10kg for males and 3.83±1.15kg for females). The weight trajectories for both

64
genders can be seen in Figure 3.2. The simple difference method yielded a weight-change
of 4.72±1.86kg for males and an almost identical 4.72±1.92kg for females, which was not
considered substantially different than the calculated LMM values. The absolute
difference between the simple difference measurement and the LMM calculated
measurement for the SWG group was the second highest difference amongst the five
weight-change groups for both genders as seen in Figures 3.4 and 3.5. The greatest
difference between the two weight-change values was a difference of 5.28kg; the
participant had a measured weight-change of 9.20kg and the LMM calculated weight-
gain of 4.39kg.
Males in the WG group gained an average of 2.19±0.40kg and females gained an
average of 1.88±0.40kg. The simple difference method revealed a weight-gain of
2.62±0.84kg for males and 2.16±0.91kg. The weight trajectories for both genders can be
seen in Figure 3.2. Interestingly the calculated weight-change values for males were
considered substantially different (p=.003) than the simple difference method values.
However, this did not hold true for the females (p=0.117). However, the greatest
difference for either gender between the two weight-change values was a difference of
2.25kg; the participant had a measured weight-change of4.70kg and the LMM calculated
weight-gain of 2.45kg.
Both genders for the WM groups had a very modest weight-change. For males the
weight-change was 0.10±0.85kg and for females the weight-change was calculated as
0.19±0.67kg. The weight-change over the year period can be seen in Figure 3.3.
Interestingly, the simple difference method measured the both males and females in the
WM group as losing bodyweight over the 12-months. For men the simple difference

65
method recorded a weight-change of -0.43±1.57kg and for women the simple difference
method recorded a weight-change of -0.07±1.14. This difference was only significantly
different for males (p=.012). The absolute difference for both genders between the simple
difference measurement and the calculated estimates were actually larger then either
measurements of weight-change at 0.76±0.60kg for males and 0.46±0.60kg for females.
The greatest difference between the two weight-change values was a difference of
2.76kg; the participant had a measured weight-change of -3.75kg and the LMM
calculated weight-change of -0.99 kg
The changes for both genders in the SWL and WL can be seen in Figure 3.4. For
males in the SWL group the simple difference method revealed an average weight-loss of
-7.78±1.77kg which was substantially different (p<0.001) from the calculated LMM
measurements. For females in the SWL group the average weight loss was -5.24±1.78kg
which was not significantly different than the calculated LMM measurements. In
addition, the SWL group had the largest absolute difference for males between the simple
difference measurements and the calculated estimates of the LMM with a difference of
2.10±1.52kg. The greatest difference between the two weight-change values was a
difference of 3.92kg; the participant had a measured weight-change of -9.19kg and the
LMM calculated weight-loss of 5.63kg.For the WL group the difference between the
LMM calculated weight-change and the simple difference measured weight-change was
considered to be substantial (p<0.001) and resulted in an absolute difference between
means of 1.29±1.04 for males and 0.90±0.50kg. The greatest difference between the two
weight-change values was a difference of 3.03kg; the participant had a measured weight-
change of -5.02kg and the LMM calculated weight-loss of 2.0kg. Full descriptions of the

66
calculated bodyweight-changes divided by gender using the LMM over the 12-months
are listed in Table 3.1.
Once the outliers were removed from the final number of participants there were a
total of 166 men and 173 females. Males and females had a similar number of
participants in each weight-change group. However, the WL group for females contained
17 participants whereas for males the WL group only contained six participants. When
viewing the absolute weight-change difference between the simple difference method and
the LMM values it seems that males have larger differences between the two methods.
However, when these differences are measured as a percentage of their starting baseline
weight they are no longer significant. In addition, there were substantial differences
within gender among baseline measurements of weight and BMI, as seen in Table 3.2.
The WM group had an average weight of 79.08±12.17kg and was substantially lighter
than the SWL and SWG groups which had average starting weights of 89.12±12.33kg
(p<.001) and 86.07±14.09kg (p=0.038). The substantial differences in weight
subsequently caused substantial differences in BMI as well (p<0.001). The trends for
starting bodyweight and starting BMI were also seen for females as seen in Table 3.3.
The starting weight for women in the WM group was 64.09±9.96, while the starting
weight for the SWL group was 75.19±10.23 and for the SWG group it was 74.99±15.32.
These starting weights were substantially different (p<0.001) and subsequently made the
BMI values substantially different as well (p<0.001).
Discussion
The current study is distinct from many longitudinal weight-change studies in the
consistency of clinical measurement protocols and the use of a LMM. While a few
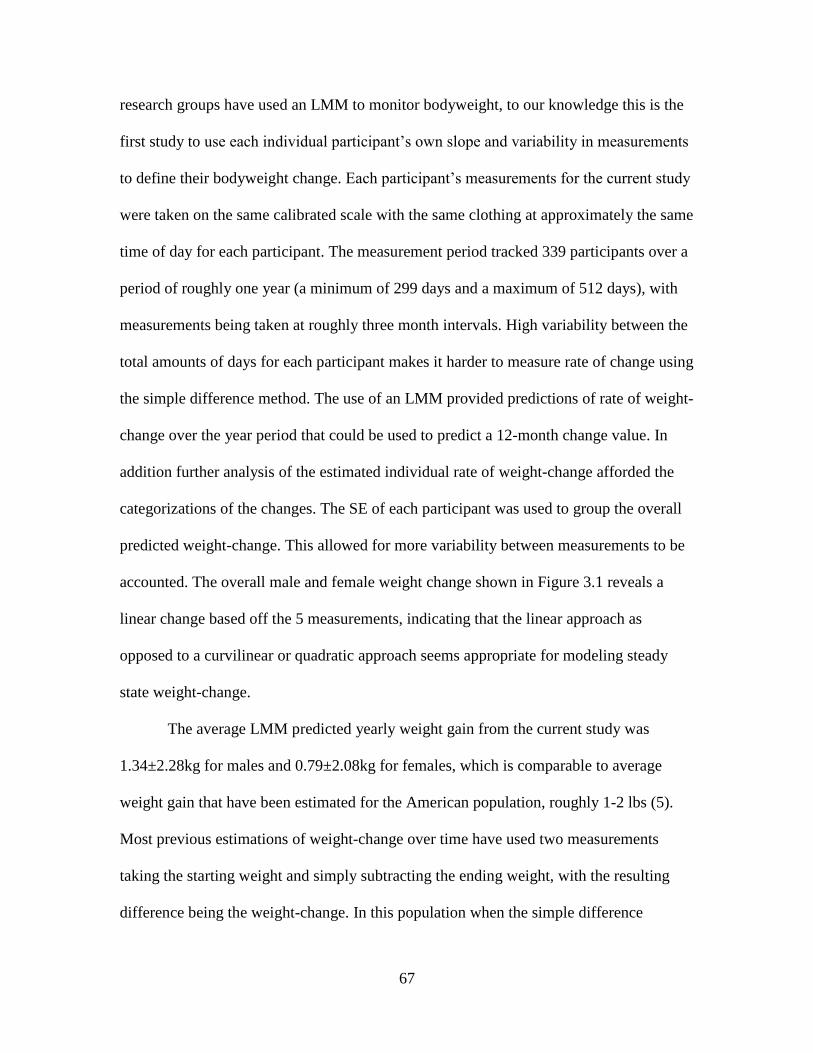
67
research groups have used an LMM to monitor bodyweight, to our knowledge this is the
first study to use each individual participant’s own slope and variability in measurements
to define their bodyweight change. Each participant’s measurements for the current study
were taken on the same calibrated scale with the same clothing at approximately the same
time of day for each participant. The measurement period tracked 339 participants over a
period of roughly one year (a minimum of 299 days and a maximum of 512 days), with
measurements being taken at roughly three month intervals. High variability between the
total amounts of days for each participant makes it harder to measure rate of change using
the simple difference method. The use of an LMM provided predictions of rate of weight-
change over the year period that could be used to predict a 12-month change value. In
addition further analysis of the estimated individual rate of weight-change afforded the
categorizations of the changes. The SE of each participant was used to group the overall
predicted weight-change. This allowed for more variability between measurements to be
accounted. The overall male and female weight change shown in Figure 3.1 reveals a
linear change based off the 5 measurements, indicating that the linear approach as
opposed to a curvilinear or quadratic approach seems appropriate for modeling steady
state weight-change.
The average LMM predicted yearly weight gain from the current study was
1.34±2.28kg for males and 0.79±2.08kg for females, which is comparable to average
weight gain that have been estimated for the American population, roughly 1-2 lbs (5).
Most previous estimations of weight-change over time have used two measurements
taking the starting weight and simply subtracting the ending weight, with the resulting
difference being the weight-change. In this population when the simple difference

68
method is applied, the average weight-change is 1.19±3.24kg for males and 0.71±2.76kg.
When the averages of the calculated and measured weight-changes are compared there is
only a slight difference of .05kg, indicating that for population estimates there is little
different between the two methods.
The major difference between the simple difference method and LMM
estimations surfaced on the individual level of analysis. The difference between the
absolute values of the simple difference method and the LMM estimations is
0.92±0.82kg, which is nearly the same size as the weight-change experienced by
participants. However, the absolute difference is not realized in the overall averages
because relative to the LMM estimations the simple difference measurement
overestimated and underestimated participant values. Looking at the difference between
the two methods shows that the simple difference method is a flawed indicator of the rate
of change over the time span. Out of the 339 total participants only 67 (20%) had
calculated LMM values that were greater than those measured with the simple difference
method. All of the simple difference measurements for the participants who experienced
weight-loss (n-39) were overestimated, while only 17% of the weight-gainers (n=146)
were underestimated. The most weight-change values which were underestimated by the
simple difference method were in the WM group where 27% of the total 156 participants
had a higher predicted yearly weight-change relative to the simple difference method.
However, the largest underestimated discrepancy between the simple difference
measurement and the LMM estimations was 1.64kg. The simple difference measurement
recorded a weight-gain of 0.55kg while the LMM calculated a weight-gain of 2.19kg.
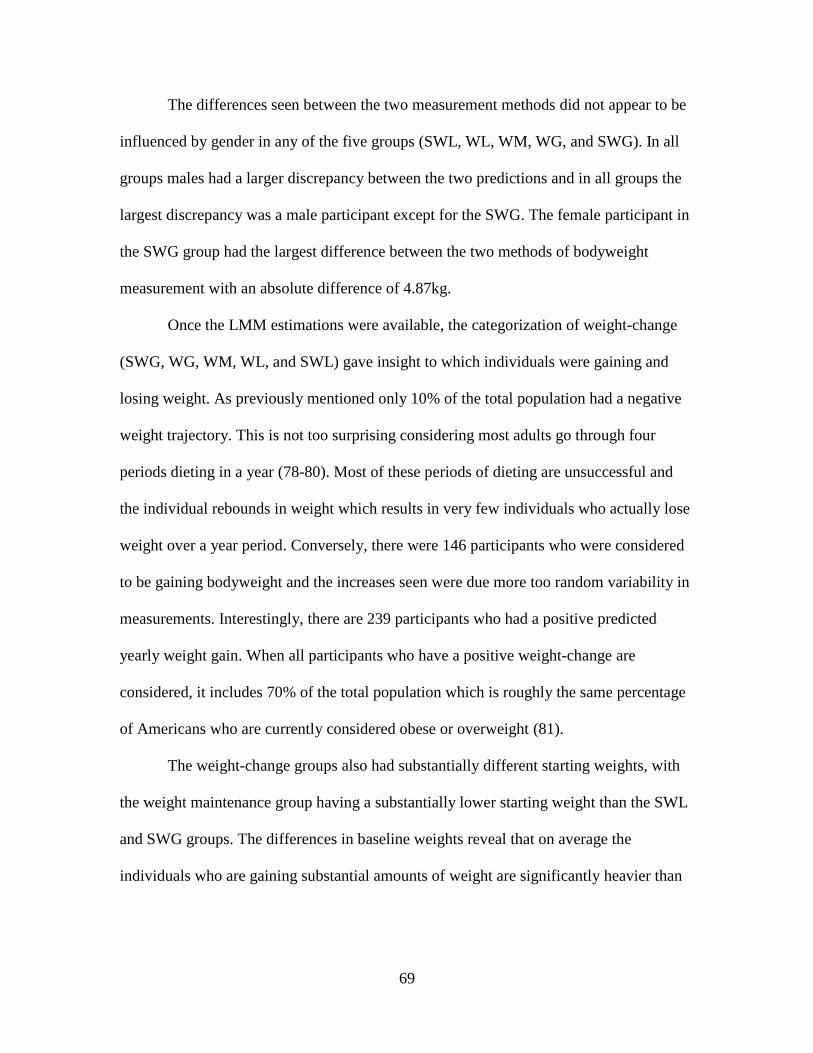
69
The differences seen between the two measurement methods did not appear to be
influenced by gender in any of the five groups (SWL, WL, WM, WG, and SWG). In all
groups males had a larger discrepancy between the two predictions and in all groups the
largest discrepancy was a male participant except for the SWG. The female participant in
the SWG group had the largest difference between the two methods of bodyweight
measurement with an absolute difference of 4.87kg.
Once the LMM estimations were available, the categorization of weight-change
(SWG, WG, WM, WL, and SWL) gave insight to which individuals were gaining and
losing weight. As previously mentioned only 10% of the total population had a negative
weight trajectory. This is not too surprising considering most adults go through four
periods dieting in a year (78-80). Most of these periods of dieting are unsuccessful and
the individual rebounds in weight which results in very few individuals who actually lose
weight over a year period. Conversely, there were 146 participants who were considered
to be gaining bodyweight and the increases seen were due more too random variability in
measurements. Interestingly, there are 239 participants who had a positive predicted
yearly weight gain. When all participants who have a positive weight-change are
considered, it includes 70% of the total population which is roughly the same percentage
of Americans who are currently considered obese or overweight (81).
The weight-change groups also had substantially different starting weights, with
the weight maintenance group having a substantially lower starting weight than the SWL
and SWG groups. The differences in baseline weights reveal that on average the
individuals who are gaining substantial amounts of weight are significantly heavier than

70
those individuals maintaining their weight. Additionally, those individuals losing
substantial weight are significantly heavier than those maintaining their bodyweight.
Using the LMM calculated weight-changes enabled the variation between
measurements to be factored in to the yearly calculated weight; this limited the influence
of rapid bodyweight fluctuations due to water retention or dehydration.
Conclusion
The average calculated LMM weight-change for the males and females in the
entire Energy Balance population was very similar to the weight-change measured by
taking the 12-month measurement and subtracting the baseline measurement. In addition,
both values were close to estimated bodyweight-changes by the U.S. population in
current literature (5). However, while the simple difference measurement average and the
LMM prediction average were close, they were very different on a person-to-person
basis. Using the LMM enabled the variation between measurements to be factored into
the yearly calculated weights; this limited the influence of rapid bodyweight fluctuations
due to water retention or dehydration. Because of the elimination of random variation
between measurements the LMM method gives a more accurate estimation of weight-
gain and more accurately depicts weight maintenance, and weight –loss as well.
The Energy Balance sample population was made up of predominantly weight-
maintenance participants (n-156). However, nearly the same number of participants was
considered as weight-gainers (n-146). Also interesting to note were that the two heaviest
groups at baseline were the SWG and SWL groups, while the WM group had a baseline
weight that was substantially less than SWG and SWL. More research needs to be

71
performed to better understand the reason why the WM group was able to maintain a
consistent bodyweight over the year period.
Funding: This study was supported by an unrestricted grant from The Coca-Cola
Company.
Acknowledgement: We thank the Energy Balance Staff for the collection and
management of the data used in this study and the participants for the dedication to
completing the measurements. We also thank our International Advisory Board for help
and guidance throughout the study

72
Table 3.1: Weight-Change Distribution of the Total Energy Balance
Population
Total
Participants
(n)
Calculated
Yearly Wt.
Change (kg)
Female
Participants
(n)
Calculated
Yearly Wt.
Change
(kg)
Male
Participants
(n)
Calculated
Yearly
Wt.
Change
(kg)
SWL 14 -4.18±1.17 8 -3.77±1.34 6 -
4.72±0.73
WL 23 -1.91±0.36 17 -1.81±0.34 6 -
2.18±0.31
WM 156 0.15±0.76 84 0.18±0.68 72 0.11±0.86
WG 77 2.06±0.42 33 1.88±0.40 44 2.18±0.40
*
SWG 69 4.03±1.13 31 3.83±1.16 38 4.20±1.10
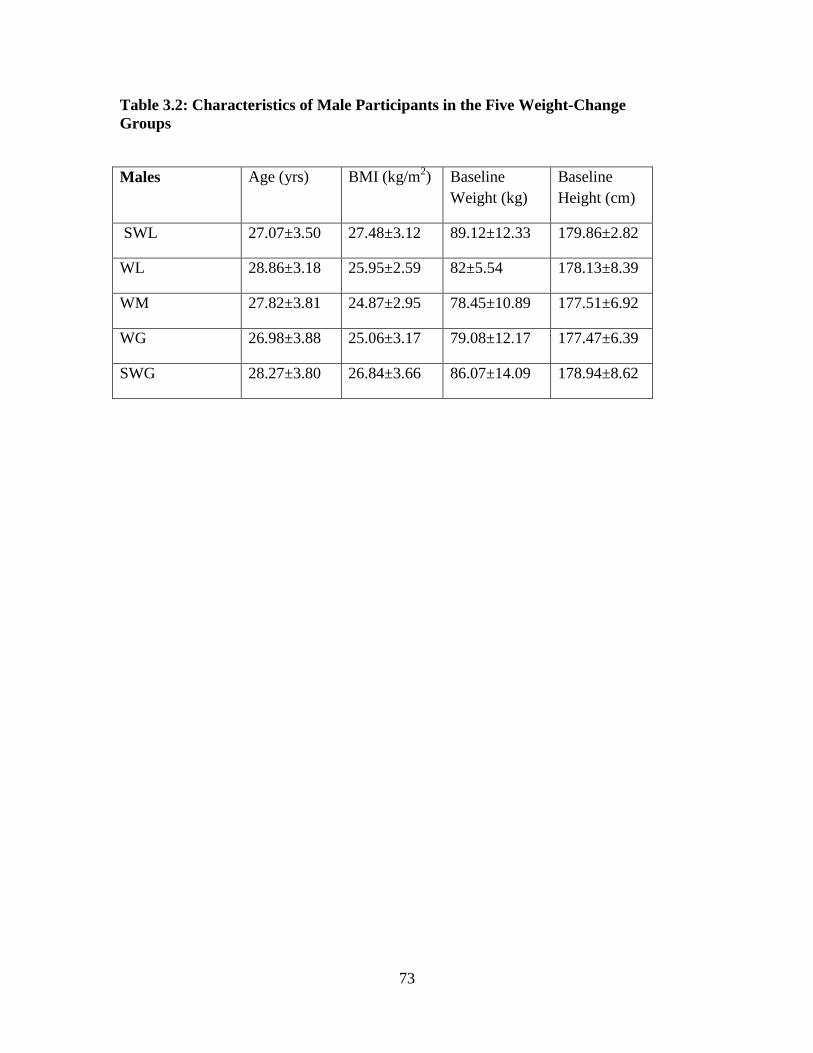
73
Table 3.2: Characteristics of Male Participants in the Five Weight-Change
Groups
Males Age (yrs) BMI (kg/m2) Baseline
Weight (kg)
Baseline
Height (cm)
SWL 27.07±3.50 27.48±3.12 89.12±12.33 179.86±2.82
WL 28.86±3.18 25.95±2.59 82±5.54 178.13±8.39
WM 27.82±3.81 24.87±2.95 78.45±10.89 177.51±6.92
WG 26.98±3.88 25.06±3.17 79.08±12.17 177.47±6.39
SWG 28.27±3.80 26.84±3.66 86.07±14.09 178.94±8.62

74
Table 3.3: Characteristics of Female Participants in the Five
Weight-Change Groups
Females Age (yrs) BMI Baseline
Weight (kg)
Baseline
Height (cm)
SWL 28.00±4.52 27.13±4.25 75.19±10.23 166.69±5.63
WL 27.68±4.27 27.03±4.78 75.79±16.51 166.93±6.91
WM 28.27±3.66 24.09±3.87 64.09±9.96 163.22±6.12
WG 26.96±3.18 26.42±4.73 72.85±12.73 166.21±6.14
SWG 27.38±3.55 26.91±4.26 74.99±15.32 166.61±6.93

75
Figure 3.1 Average Measured Weights with Linear Model Trajectories for All
Participants

76
Figure 3.2 Average Measured Weights with Linear Model Trajectory for Weight
Gain and Substantial Weight Gain Group

77
Figure 3.3 Average Measured Weights with Linear Model Trajectory for Weight
Maintenance Group

78
Figure 3.4 Average Measured Weights with Linear Model Trajectory for Weight-
Loss and Substantial Weight-Loss Group

79
Figure 3.5 Differences Between Measured Yearly Weight Change and Linear
Mixed Model Calculated Yearly Weight Change
80
CHAPTER IV
YEARLY RATES OF BODY COMPOSITION CHANGE IN THE
ENERGY BALANCE STUDY
Abstract:
Introduction: The rate of body composition (fat mass (FM) and fat-free mass (FFM))
change is extremely important in the risk for obesity and in monitoring overall health.
The amounts of FM and FFM changes that occur in young adults over time have not been
studied on a large-scale or with great accuracy. Simple difference methods of measuring
body composition changes under and overestimate the actual changes that occur,
specifically in fat-free mass. There is a need to fully define the rate of body composition
change in healthy adults in order to better understand the fluctuation of body composition
over a year period.
Objective: The purpose of this study was to measure body composition changes in young
healthy adults for a year period. Then, develop a multivariate linear mixed model (LMM)
to accurately predict FM and FFM changes in the adults participating in the study.
Methods: 337 healthy, young adults completed a year-long longitudinal study including
5 clinical measurement sessions where body composition was measured using Dual-
energy X-ray absorptiometry (DXA). The five body composition measurements were

81
then used to create a linear mixed model (LMM) that estimates the rate of body
composition change. The body composition changes were then categorized into 5 groups
based off of changes in FM (substantial fat loss (SFL), fat loss (FL), fat mass
maintenance (FMM), fat gain (FG), substantial fat gain (SFG)).
Results: After accounting for outliers the entire group of 337 participants had a
calculated yearly FM change of 0.91±2.03kg (Range: -6.79 – 8.00kg). FFM did not
substantially change over the course of a year in the participants of the Energy Balance
Study. The LMM created for body composition had no random slope for FFM, which
meant no overall change in FFM. Once the participants were grouped based on their fat-
change, 45% (153 participants) were considered to maintain fat mass over the year
period. Additionally, about the same amount (144 participants) was considered to be
gaining fat-mass.
Conclusion:
Body composition changes seen in the sample population were almost due entirely to
changes in FM. On average the FFM did not change substantially. The LMM average
calculated fat-gain for the entire Energy Balance population was very similar to the
measured fat-change. However, the values were substantially different on the individual
level. Estimates of FM over time such as the estimates gathered in this study may give
more accurate risk assessments of obesity and excessive fat gain.

82
Introduction
Obesity affects the lives of approximately 100 million Americans. The disorder is
associated with many chronic diseases, early death, and disability (83). The health and
economic burdens of obesity are well established (26). Clinically, as recognized by most
organizations, obesity is categorized by body mass index (BMI). Originally known as the
Quetelet index, BMI divides an individual’s body mass by their height squared (84).
Keys et al. originally revealed BMI as having high correlations with body density and
skinfold measurements on the population level (85). The NIH Consensus Development
Conference on the Health Implications of Obesity convened 13 years later and was the
first to define obesity by BMI (86). Most organizations use BMI to define obesity
because BMI correlates with body FM (87). Even though there are well established
associations between BMI and health, increased adiposity is an important component of
obesity, and an independent risk factor for cardiovascular disease, all-cause mortality and
other obesity related risk (46;88;89).
Many health organizations include excess adiposity in their definitions of obesity, yet do
not include values for what is considered excessive fat-gain. Accurate estimates of body
composition change over time could be used to estimate risks and discrepancies between
different demographic groups and better describe obesity and metabolic syndrome.
Relatively few studies have investigated body composition change over time with
accurate clinical measurements (38;90). Presently no studies have used a method as
accurate as dual-energy X-ray absorptiometry (DXA) to estimate change in body
composition over time. Previous studies measuring body composition change have used
two measurements and simply used the difference in measurements as body composition

83
change over time. There are several inadequacies in this form of measuring body
composition change. The simple difference measurement style is fairly accurate when
looking at body composition change for an entire population, but when evaluating
changes in the individual, accuracy is lost. Longitudinal data analysis of accurate
measurements such as DXA results will result in more reliable changes in body
composition. In addition the results will allow for a better categorization for what is truly
considered substantial FM and FFM changes relative to FM and FFM maintenance.
The following study estimates rates of body composition change using DXA
measurements in a LMM over a 12-month period with healthy participants who were
ages 21-35yr at baseline. This investigation affords precise estimates of overall body
composition and categorizes these changes for healthy young Americans.
Methods
Sample Population
The current study uses data that was collected as part of The Energy Balance
Study; the data was collected from June 2011 to January 2014. The complete methods
and overall study design have already been described in detail in previous publications
(75). The sample data for the current study includes 342 healthy young adults ages 21-35
years old, with a body mass index (BMI) of 20-35 kg/m2, who completed all body
composition measurements of the first year of the Energy Balance Study. Exclusion
criteria for the study included planned weight-loss surgery, hypertensive (150- mmHg
systolic and/or 90 mmHg diastolic), taking selective serotonin reuptake inhibitors, giving
birth within the past 12 months, planning to start or stop birth control in the next 12
months while participating in the first year of the study, history of depression, currently

84
diagnosed or taking medications for a major chronic health condition, using medications
to lose-weight, started or stopped smoking within the last 6 months and ambulatory blood
glucose levels ≥ 145 mg/dL. All study protocols were approved by the University of
South Carolina Institutional Review Board.
Body Composition and Anthropometric Measurements
The body composition measurements were taken with all other anthropometric
measurements. All clinical measurements for the 5 primary visits (baseline, 3, 6, 9, and
12 month) were performed with the participant dressed in a pair of surgical scrubs and
bare feet. For all visits the BMI (kg/m2) was calculated from the average of three height
and weight measurements using a traditional stadiometer and electronic scale. The values
for both weight and height were recorded to the nearest 0.1 centimeter and 0.1kg. Body
composition was measured using a Lunar fan-beam dual X-ray absorptiometry (DXA)
scanner (GE Healthcare model 8743, Waukesha, WI). The scans recorded total fat and
fat-free mass, as well as torso, arm and leg composition. In addition, the scans recorded
bone mineral density and content. For the baseline, 6 and 12 month visits the waist and
hip circumference of each participant was measured. The waist and hip circumferences
were measured using a calibrated spring-loaded tap measure. Waist circumference was
determined at the point midway between the costal margin and iliac crest in the mid-
axillary line approximately 2 inches above the umbilicus. Hip circumference was
measured at the widest point around the greater trochanter. Circumferences recorded
were the average of three measurements and were rounded to the nearest 0.1cm.

85
Statistical Analysis
A multivariate LMM was created for both genders to predict the body
composition change over a year period for the 342 participants included in analysis. The
LMM treated the amount of time within the study as the predictor of body composition
using FFM and FM as dependent variables. Within the LMM that was created, i=1 to m
Days and j=1 to n subjects. Β0 represents the fixed intercept regardless across all i and j
displaying the value of Weight at Days=0, and β1 is the fixed slope for Days (across all i
and j) representing the average linear trend across Days. Δ0j calculates the random
intercept for each j representing the deviation of each person’s intercept from β0 (at
Days=0), and δ1j is the random slope for Days for each j representing the deviation of
each person’s slope from β1. After the LMM was created but before final analyses, model
assumptions were checked to ensure the residuals and estimates of the random intercepts
were normally distributed. An iterative influence diagnostics program on SAS 9.3
software was used in order to indentify any outliers or abnormal measurements. 5 outliers
were identified out of the original 342. One participant was trying to activity gain-weight
and put on muscle mass over the year period, another participant was injured and unable
to walk for several months. Another participant limited EI to extreme proportions
drastically cutting bodyweight and therefore adjusting their body composition. The last
outlier consistently increased energy expenditure every measurement period and
reportedly reduced EI every measurement period. These 5 outliers were removed, leaving
337 participants for final analysis. For the final analysis descriptive characteristics of
participants in each fat-mass change category were summarized using means and

86
standard deviations. T-tests analyzed differences between groups and genders for body
composition.
Fat-Mass Change Categories
Once the model was created the fat-mass change calculated by the LMM was
categorized into five groups including: substantial fat-loss (SFL), fat-loss (FL), fat mass-
maintenance (FMM), fat-gain (FG) and substantial fat-gain (SFG). The five categories
were generated by using each participant’s overall standard error of the slope generated
from the LMM. If the calculated FM change was greater than 2 SE above 0 then the
participant was considered to be in the SFG group. Next, if the calculated fat change was
between one SE and two SE above 0 the participant was considered to be in the FG
group. In fat-loss, if the calculated FM change was between one SE and two SE below 0
then the participant was considered to be in the FL group. If the calculated body
composition change was greater than two SE below 0 then the participant was considered
as part of the SFL group. Lastly, if the calculated FM change was neither 1 SE above 0,
nor 1 SE below 0, than the participant was considered in FMM.
Results
The LMM created for FFM and FM yielded no random slope for the FFM
variable meaning for the Energy Balance population FFM on average did not vary from
measurement to measurement, nor did it change substantially over time. The overall fixed
average slope created for FFM was not substantially different from 0, meaning that on
average the change in bodyweight was predominantly due to FM. Overall the FFM in the
sample population was extremely stable, but FM changed substantially over the year

87
period. While FFM had no substantial increase, and no variability, it was found to be
negatively correlated with FM within the individual over time (i.e., small decreases in
FFM were consistently associated with increases in FM.). Because no significance was
found in variability or change of FFM, the remainder of the results will be dedicated to
describing the changes that were seen in FM.
The average yearly FM change for the total 337 participants as calculated by the
LMM was 0.91±2.03kg (1.41±2.58%). The average FM trajectory for all participants
carried a slope of 0.0025kg per day, seen in Figure 4.1. When the average yearly FM is
calculated by the traditional measurement, which is simply the baseline measurement
subtracted from the 12-month measurement, the resulting value is 0.98±2.70kg. Similar
to bodyweight, the change in FM on a population level appeared similar between the
traditional method and the changes calculated by the LMM. However, the average
absolute difference between the traditional measurement and the calculated FM accrued
from the LMM was 0.84±0.73kg, showing that there were substantial differences
between the two methods of FM quantification on the individual participant level.
Out of the 337 total participants 297 were considered as either maintaining or
gaining FM. Only 40 participants, slightly more than 10% of the entire group was
considered as losing FM. When viewing the total population as divided into FM yearly-
change groups, the SFG group had the highest average calculated FM change of
3.61±1.11kg (4.42±1.36%) with a daily average fat change of 0.010kg per day as seen in
Figure 4.2. The traditional method revealed a FM change of 4.02±1.84kg, which was not
considered substantially different than the calculated LMM values (p=0.116). However,
the absolute difference between the traditional measurement and the LMM calculated

88
measurement for the SFG group was over a kilogram different at 1.00±0.88kg. The
greatest difference between the traditional measurement and the LMM prediction was a
difference of 3.77kg; the participant had a measured FM increase of 10.92kg and the
LMM calculated a fat increase of 7.14kg.
As expected, the FG group gained substantially more fat than the FMM group and
substantially less fat than the SWG group with an average yearly fat-gain of 1.90±0.42kg
(2.47±0.59%), while the traditional method revealed a fat-gain of 2.37±1.03.
Subsequently, as seen in Figure 4.2, the slope (fat-gain per day) is substantially less for
the FG group as well. Unlike the SFG group, the FG calculated fat-change values were
considered substantially different (p<0.001) than the fat change values gathered by the
traditional method. The absolute difference between the traditional measurement and
calculated estimate was lower than the SFG group at 0.79±0.61kg. Nonetheless, the
greatest difference between the calculated and measured values was a difference of
3.65kg; the participant had a measured fat change of5.39kg and the LMM calculated fat
change of 1.74kg.
As expected, the FMM group had a small fat change of 0.15±0.66kg
(0.21±0.94%) as calculated by the LMM. As seen in Figure 4.3 the small gain left the
daily fat-gain at nearly 0 (0.0004kg per day). The traditional method measured the FMM
group an even smaller gain of 0.10±1.22kg of fat mass over the 12-months, which was
not considered substantially different (p=0.665) from the measures calculated by the
LMM. The absolute difference between the traditional measurement and the calculated
estimates was larger than either measurement at 0.59±0.52kg. The greatest difference

89
between the measurement and LMM estimate was a difference of 2.33kg; the participant
had a measured fat-change of 3.3kg and the LMM calculated fat-change of 0.97 kg
The SFL group lost substantially more fat than the FL group with respective
losses of -3.96±1.40kg (-5.09±1.72%) and -1.73±0.31kg (-2.37±0.57%). As seen in
Figure 4.4, the SFL group had the second greatest fat-change (second to the SFG group)
per day of -0.011kg per day. Measured with the traditional method the SFL group had an
average weight-loss of -5.61±2.52kg which was substantially different (p<0.001) from
the calculated LMM measurements. In addition, the SFL group had the largest absolute
differences between the traditional measurements and the calculated estimates of the
LMM with a difference of 1.66±1.45kg. The greatest difference between the measured
and calculated values was a difference of 4.12kg; the participant had a measured fat
change of -10.22kg and the LMM estimated fat-loss of 6.10kg.
The FL group was found to have a yearly fat-loss of -2.01±1.13 when measured
by the traditional method. The difference between the LLM estimated fat-change and the
traditional method of measuring fat-change was considered to be substantial (p<0.001).
In addition, the absolute difference between means was 0.77±0.54. The greatest
difference between the measured value and calculated value was a difference of 2.1kg;
the participant had a measured fat-change of -4.1kg and the LMM calculated weight-loss
of 2.0kg. Full descriptions of the calculated fat changes separated by gender using the
LMM over the year measurement are listed in Table 3.1.
Once the outliers were removed from the final number of participants there were a
total of 164 men and 173 females. The five fat-change groups were mostly even between
genders. However, the WL group did have the most disparity between genders and was

90
predominantly female (17/25 or 68%).When viewing the absolute fat-change between
genders in each of the fat-change groups there appear to be substantial gender
differences. However, if percent body fat is used instead of overall mass, there is no
substantial difference between the fat-change in genders. While there was no significance
in fat-change between genders, there were substantial differences within gender among
baseline measurements of weight and BMI, as seen in Table 4.2. The FMM group had an
average baseline weight of 72.49±12.59kg and was substantially lighter than the SFL and
SFG groups which had average starting weights of 84.96±14.73kg (p<.001) and
86.13±14.26kg (p<0.001). The substantial differences in weight subsequently caused
substantial differences in BMI as well (p<0.001). The trends for starting bodyweight and
starting BMI were also seen for females as seen in Table 4.3. The starting weight for
women in the FMM group was 64.90±10.57, while the starting weight for the SFL group
was 78.18±13.44 and for the SWG group it was 74.23±14.42. These starting weights
were substantially different (p<0.001) and subsequently made the BMI values
substantially different as well (p<0.001).
Discussion
A surprising outcome of using the LMM with two dependent variables was that
FFM did not substantially change over the course of a year in the participants of the
Energy Balance Study. The LMM created for body composition had no random slope for
FFM, which meant no overall change in FFM. Further, there was no variance from
measurement to measurement for the average participant, nor did the measurements
change substantially over time. The overall fixed average slope created for FFM was not
substantially different from 0, meaning that on average the change in bodyweight was

91
predominantly due to FM. Overall the FFM in the sample population was extremely
stable. A stable FFM is understandable in this population. One reason for a stable FFM is
the age of the population; the average age of the population is roughly 28 years old. The
average age for the participant is one in which there are no expected increases in FFM
due to growth and no expected substantial decreases due to aging. In spite of the age of
the population there are ways in which the participants could have increased their FFM.
For example, certain types of resistance training can cause dramatic increases in FFM.
While certain lifestyle adaptations can dramatically increase FFM very few of these were
used by the participants Energy Balance Study. As a result the majority of body
composition changes that were seen in the study’s participants were due to FM changes.
Considering there was no change in FFM, most of the changes in bodyweight
were similar to the changes in FM. The categorizations of fat-mass change were crucial
to truly understanding whether a participant in the study was gaining, maintaining or
losing fat-mass. SE of each participant was used to group the overall calculated fat-
change. This allowed for more accurate assessments because of true fat-change versus
large variability between measurements. Originally the study was planned to group both
FM and FFM change for the 337 participants. But, because the LMM revealed no
changes in FFM only FM was grouped. Since only FM changed substantially it was
hypothesized that the bodyweight-changes and groups that were made in a previous paper
would be similar. However, there were several members of the sample population that
were not categorized into the same relative groups for bodyweight and composition.
Three participants were considered SFL, but not SWL and 2 participants were considered
SWL, but not SFL. Eight participants were considered WL, but not FL and 10 were

92
considered FL, but not WL. Forty-seven participants were considered WM, but not
FMM, and 46 were considered FMM, but not WM. 16 participants were considered WG,
but not FG, while 17 were considered FG, but not WG. Lastly, 6 participants were
considered SWG, but not SFG and 5 were considered SFG, but not SWG. So, despite
there being similarities between bodyweight-change and fat-change, there are also
substantial differences between groups.
Like the LMM created for bodyweight, eliminates some of the within participant
variation between measurements. FM, unlike FFM has a very low water percentage.
Because of the low water content it would be expected to fluctuate less rapidly.
Nonetheless there were still large differences between the LMM calculated values and the
traditional measured values. The average absolute difference between the two values
almost eclipsed the overall fat-change of the group. The total average fat-change of the
population was 0.91±2.03kg, while the absolute difference between the two values was
0.79±0.74kg. Since, the measurements were at least 70 days apart it allowed participants
to diverge from their typical fat-gain trajectory.
Once categorized the composition of the body composition groups was similar to
that of the bodyweight groups with the majority of participants being characterized as fat-
stable (n-153) they had a calculated fat-change of 0.15±0.06kg (0.21±0.94%). Nearly as
many participants were considered fat-gainers (n-144). Further, there were very few
people roughly 11% that were considered as fat-losers. Interesting to note, the SFL group
had the largest absolute difference between the measured values and the calculated values
of the LMM. This is especially apparent in the males where the absolute difference
between the two values was 2.39±1.58kg. The discrepancy between the LMM and the

93
actual measured values can be seen in Figure 4.3. The difference between the average FM
value of the 6 month visit and 3 month visit is 0.18kg, whereas the difference between the
average FM value of the 6 month and 9 month visit is 3.53kg. These dramatic differences
between rates of fat-loss caused the overall trajectory line to be much different from the
measurements.
Conclusion
The calculated fat-change by the LMM averaged for the entire Energy Balance
population was very similar to the weight-change calculated by the LMM created for
bodyweight-change. This would be expected considering the population had no
substantial changes in FFM. Using the Energy Balance Study population as a sample
population for young healthy adults in America would indicate that the majority of young
American’s are gaining a relatively small (<1kg) of body fat per year that is heavily
contributing to a yearly bodyweight gain of roughly 1-2kg. More studies are needed to
understand the best ways of preventing this small fat gain to minimize the risk of obesity.
However, when viewed on an individual basis the values for each participant are
substantially different. Traditional measurements of bodyweight are inaccurate for
accessing bodyweight-change.
Funding: This study was supported by an unrestricted grant from The Coca-Cola
Company.

94
Acknowledgement: We thank the Energy Balance Staff for the collection and
management of the data used in this study and the participants for the dedication to
completing the measurements. We also thank our International Advisory Board for help
and guidance throughout the study.

95
Table 4.1: Fat Mass Change Distribution
Total
Participants
(n)
Calculated
Yearly Fat.
Change
(kg)
Calculated
Yearly
Percentage
of Fat
Change (%)
Female
Participants
(n)
Calculated
Yearly Fat
Change (kg)
Calculated
Yearly
Percentage of
Fat Change
(%)
Male
Participants
(n)
Calculated
Yearly Wt.
Change (kg)
Calculated
Yearly
Percentage
of Fat
Change (%)
SFL 15 -
3.96±1.4
0
-
5.09±1.72
8 -
3.55±1.44
-4.62±1.84 7 -4.67±1.17 -
5.81±1.38
FL 25 -
1.74±0.3
1
-
2.37±0.57
17 -
1.74±0.33
-2.45±0.64 8 -1.71±0.26 -
2.19±0.32
FM 153 0.15±0.6
6
0.21±0.94 85 0.13±0.59 0.84±0.53 68 0.17.74 -
0.08±0.94
FG 76 1.90±0.4
2
2.47±0.59 32 1.69±0.35 2.34±0.60 44 2.05±0.40 2.57±0.57
SFG 68 3.61±1.1
1
5.01±2.39 31 3.45±1.11 5.49±2.57 37 3.73±1.11 4.61±2.18
95

96
Table 4.2: Characteristics of Male Fat-change Groups
Males Age (yrs) BMI (kg/m2) Baseline
Weight (kg)
Baseline
Height (cm)
Substantial fat-
loss (SFL)
26.89±3.47 27.13±3.74 84.96±14.73 176.68±7.26
Fat-loss (FL) 30.07±4.31 26.25±2.49 80.80±8.29 175.44±5.29
Fat
maintenance
(FM)
27.71±3.62 24.25±3.04 72.49±12.59 172.54±9.70
Fat-gain (FG) 27.41±4.07 25.28±2.85 79.48±10.83 177.20±6.12
Substantial fat-
gain (SFG)
27.75±3.62 26.71±4.01 86.13±14.26 179.47±8.23

97
Table 4.3: Characteristics of Female Fat-change Groups
Females Age (yrs) BMI Baseline
Weight (kg)
Baseline
Height (cm)
Substantial
weight loss
(SWL)
27.72±4.77 28.20±4.14 81.28±14.06 169.55±8.27
Weight-loss
(WL)
28.03±4.25 27.21±4.75
74.76±14.69 165.58±6.93
Weight-
maintenance
(WM)
27.89±3.41 24.17±4.10 64.90±10.57 164.06±6.75
Weight-gain
(WG)
27.91±3.82 26.70±4.73 72.98±12.52 165.53±5.98
Substantial
weight-gain
(SWG)
27.14±3.60 26.57±4.28 74.23±14.43 166.87±6.18

98
Figure 4.1 Average Measured Fat Mass with Linear Model Trajectory
for Fat Gain Group

99
Figure 4.2 Average Measured Fat Mass with Linear Model Trajectory
for Fat Maintenance Group
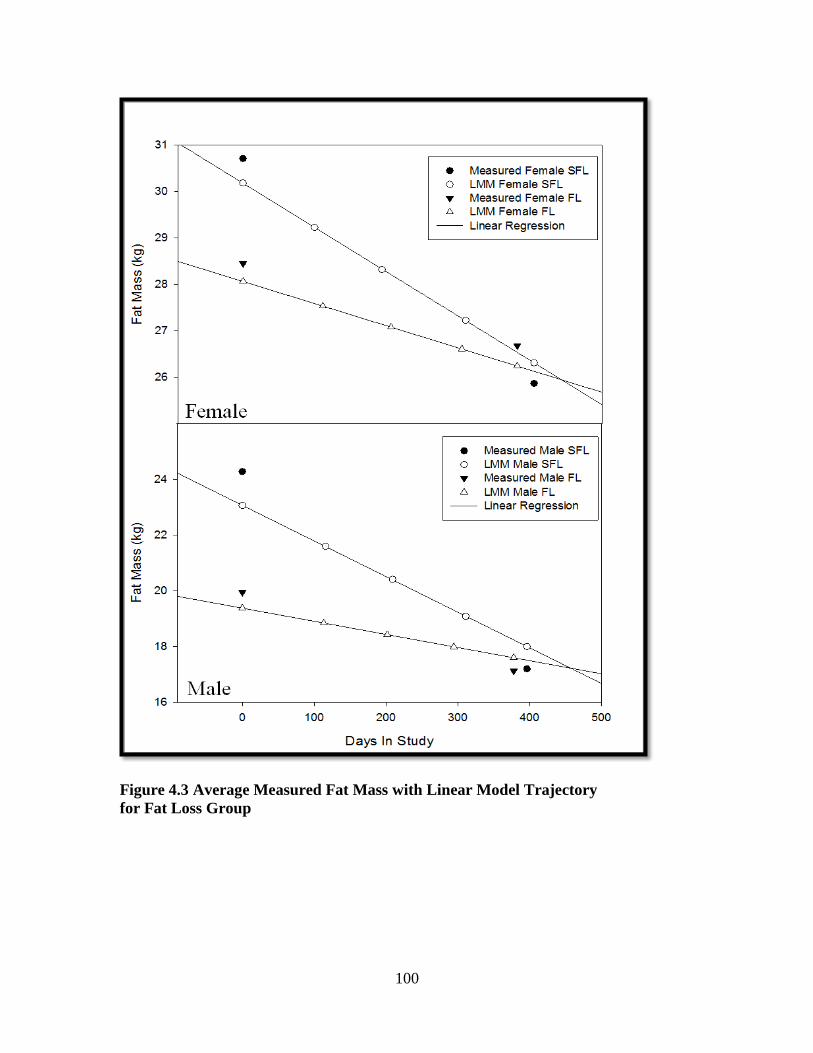
100
Figure 4.3 Average Measured Fat Mass with Linear Model Trajectory
for Fat Loss Group

101
Figure 4.4 Differences Between Measured Yearly Fat Change and
Linear Mixed Model Calculated Yearly Weight Change

102
CHAPTER V
THE ASSOCIATION BETWEEN CHANGES IN BODYWEIGHT
AND COMPOSITION WITH TOTAL DAILY ENERGY
EXPENDITURE
Abstract
Introduction: Energy expenditure (EE) and energy storage (ES) are two crucial
components of energy balance. With the increases in the prevalence of obesity,
investigations focusing on energy balance are necessary for a better understanding of how
to prevent and categorize risk for this serious disorder. On average the adult American
increases bodyweight and composition throughout adulthood. Although increased EE
through higher levels of physical activity (PA) have been heavily promoted by public
health officials, the association between EE and changes in bodyweight is not clearly
understood in America today.
Objective: The purpose of this study was to better define the association between
changes in bodyweight and composition with averages of EE over a year period.
Methods: 337 healthy, young adults completed a year-long longitudinal study including
5 clinical measurement sessions, where body composition was calculated using Dual-
energy X-ray absorptiometry (DXA) and bodyweight was measured. The bodyweight and
composition measurements were then used to create two linear mixed models (LMM)

103
that calculated the rate of bodyweight and composition change. The participants werethen
categorized into groups of bodyweight and composition change. The EE of these groups,
including total daily EE, total daily EE per kg of bodyweight, RER and percentage of EE
from sedentary activities were compared.
Results: The average total daily EE was substantially greater for the participants
categorized as substantially gaining weight (SWG) and substantially gaining fat (SFG)
relative to the eight other categories of weight and fat change (substantial weight-loss
(SWL), weight-loss (WL), weight maintenance, (WM), weight-gain (WG), substantial
fat-loss (SFL), fat-loss (FL), fat-maintenance (FM) and fat-gain (FG)). A similar result
was seen in body composition, a substantially higher average total daily EE was found in
those participants gaining substantial body fat. However, when viewing total daily EE on
a per kilogram basis the trends seen with total daily EE are reversed; the weight and fat
maintenance groups expend the most energy on a per kilogram basis.
Discussion: Multiple influential factors are associated with bodyweight and composition
change. However along with energy intake (EI), EE make up the primary components
causing ES changes. Because of the greater body mass, heavier people require more
energy to do the same activity as a lighter individual with less body mass. So there was
an association between the substantial weight-change groups and increased energy
expenditure. However, when EE is compared on a per kilogram basis the weight
maintenance group had substantially greater EE values due to the ratio of body surface
area relative to weight.
104
Conclusion:
There were substantial differences observed in total daily EE, total daily EE per kg of
bodyweight, and percentage of EE from sedentary activities amongst groups of
bodyweight and composition. The SWG and SFG groups were significantly different
from the maintenance groups in the previously mentioned variables. The SWG and SFG
groups had a higher total daily EE due to their substantially higher starting bodyweight,
while the maintenance groups had a higher EE per kg. Lastly the maintenance groups
spent less percentage of their total EE in sedentary activities, suggesting a higher level of
activity to maintain weight.
Introduction
The maintenance of bodyweight and composition are critically linked to overall
health. Previous cross-sectional and longitudinal data from the United States (US) have
shown that healthy adults gain an average of 1-2kg of bodyweight per year, with
subsequent changes in body composition (90). With younger adults the changes in body
composition are primarily due to increases in FM. Excess increases in FM lead to obesity
and are associated with a myriad of chronic diseases (83). The overall preservation of
healthy levels of FM and FFM are essential for health. While a basic understanding of
FFM and FM changes associated with normal adults has been established, the changes in
obese individuals are less understood. Nearly one third of the US population is obese
(92). A better understanding of how excessive body composition changes over time are
associated with factors such as energy expenditure (EE) is needed.

105
While there have been some studies that have investigated the longitudinal
changes in bodyweight-change (38;77;93), only a select few investigations have
investigated the longitudinal changes in body composition (90;94). In addition, these
studies did not categorize the bodyweight or composition change, highlighting the
difference between weight-maintenance and substantial weight-gains. Moreover, the
factors that influence bodyweight and composition, specifically EE, were not fully
explored. Physical activity and total daily EE have been promoted as methods of weight
maintenance and healthy bodyweight over the adult lifespan (95;96). The associated total
daily EE for adults increasing bodyweight relative to those maintaining bodyweight are
not well understood.
The purpose of the current study was to establish a better understanding of how
changes in bodyweight and composition in a group of young (ages 21-35) healthy adults
is associated with total daily EE.
Methods
The current study uses data that was collected as part of The Energy Balance
Study; data was collected from June 2011 to January 2014. The complete methods and
overall study design have already been described in detail in previous publications (75).
The current study uses a subset of The Energy Balance population including 344 healthy
young adults (339 were used for final analysis after exclusion of outliers) ages 21-35
years old, with a body mass index (BMI) of 20-35 kg/m2. Exclusion criteria included
planned weight-loss surgery, hypertensive (150- mmHg systolic and/or 90 mmHg
diastolic), taking selective serotonin reuptake inhibitors, giving birth within the past 12
months, planning to start or stop birth control in the next 12 months while participating in

106
the first year of the study, history of depression, currently diagnosed or taking
medications for a major chronic health condition, using medications to lose weight,
started or stopped smoking within the last 6 months and ambulatory blood glucose levels
≥ 145 mg/dL. All study protocols were approved by the University of South Carolina
Institutional Review Board. Participants who completed all measurements in the first year
of visits (baseline, 3, 6, 9 and 12 month) were included in the current analysis.
The body composition measurements were taken with other anthropometric
measurements. Anthropometric measurements for the 5 visits over the 12-month period
(baseline, 3, 6, 9, and 12 month) were performed with the participant dressed in a pair of
surgical scrubs and bare feet. For all visits the BMI (kg/m2) was calculated from the
average of three height and weight measurements using a traditional stadiometer and
electronic scale. The values for both weight and height were recorded to the nearest 0.1
centimeter and 0.1kg. Body composition was measured using a Lunar fan-beam dual X-
ray absorptiometry (DXA) scanner (GE Healthcare model 8743, Waukesha, WI). The
scans recorded total fat and fat-free mass, as well as torso, arm and leg composition. For
the baseline, 6 and 12 month visits the waist and hip circumference of each participant
was measured. The waist and hip circumferences were measured using a calibrated
spring-loaded tap measure. Waist circumference was determined at the point midway
between the costal margin and iliac crest in the mid-axillary line approximately 2 inches
above the umbilicus. Hip circumference was measured at the widest point around the
level of the greater trochanter. Circumferences recorded were the average of three
measurements and were rounded to the nearest 0.1cm.

107
Total Daily Energy Expenditure Values
The EE values were measured using a SenseWear Mini Armband (BodyMedia
Inc. Pittsburgh, PA). The portable, multi-sensor device is worn on the upper-left arm with
the sensor itself resting over the triceps muscle. EE and activity are estimated using a
combination of a tri-axial accelerometer with biological sensors measuring heat flux,
galvanic skin response, near-body ambient temperature, and skin temperature. The Mini
Armband has gone through validation with both laboratory and free-living conditions
(against DLW) and other previously validated accelerometers. In a recent investigation
by Johannsen et al. The SenseWear Mini Armband was compared to the EE values
generated by the use of free-living DLW (72). At each measurement period of The
Energy Balance Study the participants were instructed to wear the monitor for 10
consecutive days constantly for 24 hours except during water activities (i.e., swimming,
bathing, showering, or water aerobics). When the participant did remove the monitor the
participants recorded these periods in an activity log. Each participant was instructed to
record any time the armband was removed in as much detail as possible including the
exact time the armband was removed and put back on. The non-wear activities were then
incorporated into the estimations of EE based on corresponding MET values according to
the 2011Compendium of Physical Activities (73). The MET values were then multiplied
by the participant’s own measured resting metabolic rate. The participant was considered
to be compliant if they had 7 days of (including 5 week days and 2 weekend days) at least
23 hours of verifiable time (either logged non-wear time or armband worn).

108
Groupings for Analysis
The Energy Balance Study population was divided into two categorization
groupings based off of bodyweight and composition changes experienced over a 12-
month period. The two grouping systems of bodyweight and composition were not
exclusive. The calculation of each participants slope and associated standard error (SE)
were used to categorize both bodyweight and composition into the categories: substantial
weight gain (SWG) if positive and 95% CI excluded 0; weight gain (WG) if positive and
68% CI excluded 0; weight maintenance (WM) if 68% CI contained 0; weight loss (WL)
if negative and 68% CI excludes 0; and substantial weight loss (SWL) if negative and
95% CI excludes 0. For the fat categories: substantial fat gain (SFG) if positive and 95%
CI excluded 0; fat gain (FG) if positive and 68% CI excluded 0; fat maintenance (FMM)
if 68% CI contained 0; fat loss (FL) if negative and 68% CI excludes 0; and substantial
fat loss (SFL) if negative and 95% CI excludes 0.
Once the categorizations for bodyweight and composition change of the year
period were created the 10 groups were compared based on the average EE values that
were created from the SenseWear Mini Armband data.
Results
The Energy Balance Study population was divided into two categorization
groupings based off of bodyweight and composition. The 10 groups of bodyweight and
composition were not equal in total participant number or gender. The number and
gender of participants in each weight and composition class can be seen in Table 5.1. In
109
total 339 participants were used in the categorizations of bodyweight and 337 participants
were categorized for body composition. Both bodyweight and composition analysis
started with 344 participants, but 5 were excluded as outliers from the bodyweight
analysis, as well as 7 from the body composition analysis. Considering there was no
change in FFM and most change in bodyweight was due to increases in body fat there are
strong similarities between groups. However, there are several participants who do not
fall in the same category of weight-change as their fat-change and as well as the
converse. 3 participants were considered SFL, but not SWL and 2 participants were
considered SWL, but not SFL. 8 participants were considered WL, but not FL and 10
were considered FL, but not WL. 47 participants were considered WM, but not FMM,
and 46 were considered FMM, but not WM. 16 participants were considered WG, but not
FG, while 17 were considered FG, but not WG. Lastly, 6 participants were considered
SWG, but not SFG and 5 were considered SFG, but not SWG. So, despite there being
similarities between bodyweight-change and fat-change, there are also substantial
differences between groups.
Bodyweight Results
When total daily EE was averaged for all 5 groups, the SWG group had a
substantially higher value than the WM group when looking at genders combined. The
other three groups were not substantially different as seen in Table 5.2. The significance
continued when looking at genders separately, with the SWG having a substantially
higher average total daily EE than WM for both male and female, refer to Figure 5.1.
When gender was combined the SWG group expended over 200 more calories per day
relative to the WM group. As seen in Table 5.1, the groups the WM group held a higher

110
percentage of females and the SWG held a higher percentage of males, thus exacerbating
the already substantial difference seen in the separate gender values to a greater extent in
the combined gender value.
The trends that are seen in total daily EE values are reversed when the EE is
expressed on a per kilogram of bodyweight basis. The WM group has an average of
37.44±4.65, while the SWG group has an average of 34.61±4.83, making the difference
substantially different (p<0.001). While the WM group did have a higher average than
the SWL group the difference was not substantial (p=0.092), as seen in Figure 5.3. With
EE per day of roughly 38 kcal/(kg day), the males in all groups except for the SWG had
very similar values. The differences seen in the values for the combined gender groups
are mainly due to the differences seen in the female participants. The difference between
SWG and WM in women is substantial (p<0.001), and while the p value for the
difference between the SWL group and the WM is smaller it still is not substantial
(p=0.081).
When viewing the measured calories per day required for RER, the SWG burned
substantially more calories per day in RER relative to the WM (p<0.001). No other
differences were seen between groups in the measured RER. While there were no
substantial differences between groups in calories expended in physical activity (PA) the
WM group have the highest absolute value. All of the values for total daily EE, total daily
EE per kg of bodyweight, RER and PA EE can be seen in Table 5.2. Lastly, the
percentage of calories from sedentary activities was analyzed for each bodyweight group.
The SWG group derived substantially more of their total calories from sedentary

111
activities relative to the WM group (p=0.034). All averages of EE from sedentary
activities can be seen in Table 5.3.
Body Composition Results
The results seen for the body composition groups were similar to those seen with
bodyweight, but there were some differences. Total daily EE was averaged for all 5
groups of body composition; the SFG group was substantially higher value than the WM
group when looking at genders combined (p<0.001). The other three groups were not
substantially different as seen in Table 5.2. A similar trend was seen when viewing
genders separately, with the SFG having a substantially higher average total daily EE
than FMM for both genders. When gender was combined the SFG group expended over
250 more calories per day relative to the FMM group, refer to Figure 5.2. Similar to the
bodyweight groups, the FMM group held a higher percentage of females and the SFG
held a higher percentage of males, which made the difference between FMM and SFG
greater in the combined gender totals.
The trends seen for bodyweight groups were similar to those seen in the body
composition groups. The total daily EE value trends were reversed when the EE was
expressed on a per kilogram of bodyweight basis. The FMM group was substantially
higher than SFG (p<0.001). The FMM group was not substantially different from the
SFL group (p=0.261), as seen in Figure 5.4.Unlike the bodyweight groups, the males in
the FL group had the highest level of EE per kg of bodyweight with the FMM group very
close. In general there was more difference between all of the male groups than there was

112
in the bodyweight groups. Therefore the differences seen in the values for the combined
gender groups are due to differences seen in both genders.
When viewing the measured calories per day required for RER, the SFG burned
substantially more calories per day in RER relative to the FMM (p<0.001). No other
differences were seen between groups in the measured RER. While there were no
substantial differences between groups in calories expended in physical activity (PA) the
FMM group have the highest absolute value. All of the values for total daily EE, total
daily EE per kg of bodyweight, RER and PA EE for the body composition groups can be
seen in Table 5.2. Like the bodyweight groups, the percentage of calories from sedentary
activities was also analyzed for each body composition group. The SFG group derived
substantially more of their total calories from sedentary activities relative to the FMM
group (p=0.019). All averages of EE from sedentary activities can be seen in Table 5.4.
Discussion
When analyzed, the EE of the bodyweight and composition groups had substantial
differences within groups. As previously mentioned the LMM that was created for body
composition included FFM as a dependent variable. If FFM did not change significantly
over time than it may be deduced that the majority of bodyweight-changes that occurred
over the year would be due to FM alone. Since this was the scenario it would seem that
categorizing the population based on yearly FM change and yearly bodyweight-change
would yield very similar results. While there were some definite similarities between the
FM and bodyweight groups there were also some apparent differences. These differences
are echoed in the values seen for EE.

113
For total daily EE the group with highest value was the SFG, but there was a mere
6 kcal difference between SFG and SWG. Both SFG and SWG were substantially higher
than the respective FMM and WM groups. The differences seen in overall total daily EE
are not surprising considering the respective starting weights of both the SFG and SWG
groups. These two groups have baseline weights that are roughly 10kg higher than the
two maintenance groups. The larger mass requires a substantial more amount of energy to
sustain which lead to the substantially higher total daily EE. While the differences in total
daily EE for females are slightly less exaggerated, most likely this is due to smaller
amount of total calories burned. Since the SWG and SFG groups are adding a tremendous
amount of ES over the relatively short amount of time (a year), an expected reason would
be a reduced EE. Looking at the values of total daily EE there seems to be the opposite
trend, the groups gaining the most mass are on average expending the most calories.
However keeping in mind the previously mentioned baseline weights the differences in
EE are understandable.
Viewing EE on a per kg basis the values are rearranged and the two maintenance
groups of WM and FMM become the highest calorie expending groups. Once again
because of the substantial differences in starting weight the differences in EE per kg are
to be expected. But even though EE per kg is higher for the maintenance groups does not
necessarily mean these groups are expending substantially more calories when factoring
in the differences of weight. While EE is affected by bodyweight and composition it is
also affected by body surface area (BSA). A greater BSA relative to bodyweight creates a
higher basal metabolic rate, which is the reason for a taller thinner individual’s having a

114
higher metabolic rate (97). Factoring in bodyweight and BSA would afford a more
accurate way of looking at the EE of each of the participants.
Another way to analyze the EE of the participants was through the analysis of the
measured RER. Following the same trend as overall total daily EE, the RER was
substantially increased for the SFG and SWG groups. When the values of RER are
divided by the total daily EE a percentage of calories derived from purely sedentary
activities can be calculated. Looking at the percentage of calories coming from sedentary
activities shows that the SWG and SFG groups derive a substantially larger percentage of
their EE from sedentary activities. Conversely the weight and fat maintenance groups
derived a substantially less percentage of expended calories from sedentary activities. In
addition to the SFG and SWG groups expending substantially less calories in non-
sedentary activities relative to the WM and FMM groups, the SWL and SFL groups did
as well. Even though the participants of the SWL and SFL were losing a large percentage
of ES over a year period they had a lower EE per kg of bodyweight and were deriving
proportionately more expended calories from sedentary activities relative to the
maintenance groups. This supports the idea that the members of the SWL and SFL
groups reduced their total and fat mass through reductions in EI rather than substantial
increases in EE. In addition the SWG and SFG groups appear to have gained significant
amounts of ES through a decreased EE per kg.
Conclusion
There were substantial differences among weight and fat mass change groups in
all of the observed EE variables that were measured including, total daily EE, total daily
EE per kg of bodyweight, RER and percentage of EE from sedentary activities. The SWG

115
and SFG groups were substantially different from the maintenance groups in total daily
EE, expending a substantially more amount of calories. However, the increased calorie
expenditure was due to a significantly higher starting bodyweight that by the end of the
year period was on average 4kg greater. While the bodyweight did increase significantly
over the year period there was no subsequent increase in EE of the five measurements.
This would be more likely in the SFG and SWG groups considering the 4kg increase in
bodyweight. The WM and FMM groups had substantially higher EE when analyzed on a
per kg basis relative to the SWG and SFG groups. In addition, the WM and FMM groups
had substantially less percentage of their total EE derived from sedentary activities,
which suggests a higher activity level relative to the SWL, SFL, SFG and SWG groups.
More research is needed to incorporate the fluctuations in EI to fully understand the
energy balance in relation to weight gain and weight maintenance.
Funding: This study was supported by an unrestricted grant from The Coca-Cola
Company.
Acknowledgement: We thank the Energy Balance Staff for the collection and
management of the data used in this study and the participants for the dedication to
completing the measurements. We also thank our International Advisory Board for help
and guidance throughout the study.
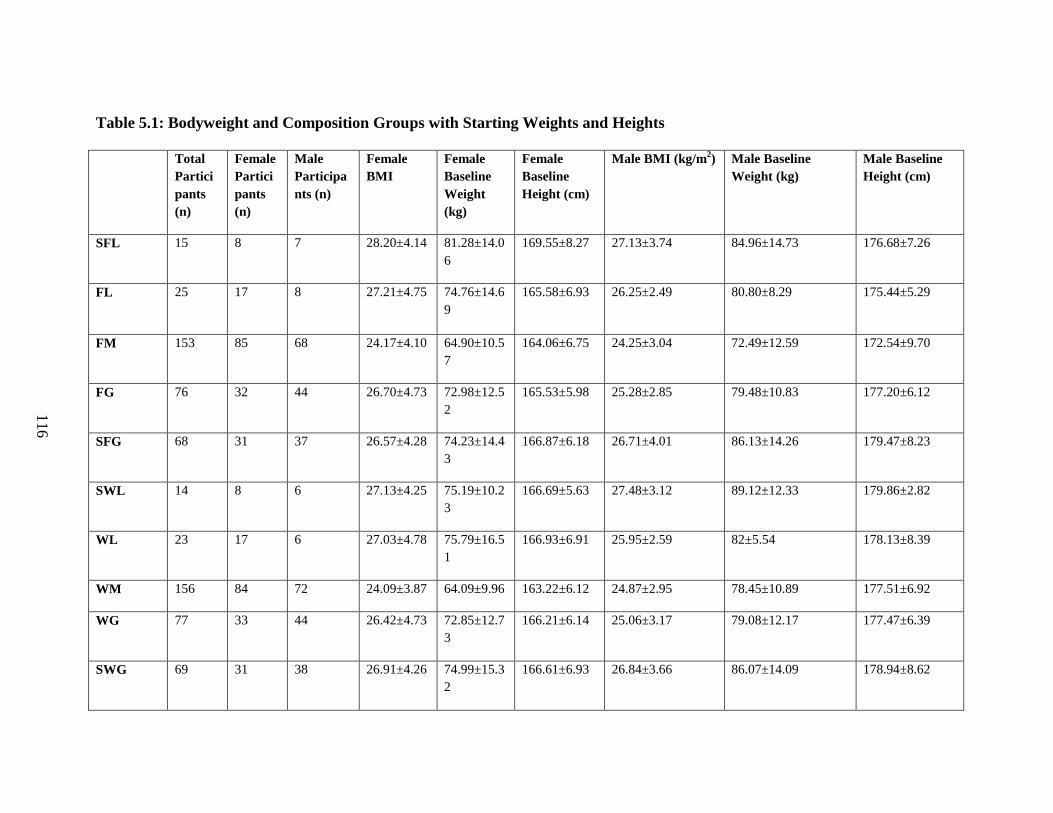
116
Table 5.1: Bodyweight and Composition Groups with Starting Weights and Heights
Total
Partici
pants
(n)
Female
Partici
pants
(n)
Male
Participa
nts (n)
Female
BMI
Female
Baseline
Weight
(kg)
Female
Baseline
Height (cm)
Male BMI (kg/m2) Male Baseline
Weight (kg)
Male Baseline
Height (cm)
SFL 15 8 7 28.20±4.14 81.28±14.0
6
169.55±8.27 27.13±3.74 84.96±14.73 176.68±7.26
FL 25 17 8 27.21±4.75 74.76±14.6
9
165.58±6.93 26.25±2.49 80.80±8.29 175.44±5.29
FM 153 85 68 24.17±4.10 64.90±10.5
7
164.06±6.75 24.25±3.04 72.49±12.59 172.54±9.70
FG 76 32 44 26.70±4.73 72.98±12.5
2
165.53±5.98 25.28±2.85 79.48±10.83 177.20±6.12
SFG 68 31 37 26.57±4.28 74.23±14.4
3
166.87±6.18 26.71±4.01 86.13±14.26 179.47±8.23
SWL 14 8 6 27.13±4.25 75.19±10.2
3
166.69±5.63 27.48±3.12 89.12±12.33 179.86±2.82
WL 23 17 6 27.03±4.78 75.79±16.5
1
166.93±6.91 25.95±2.59 82±5.54 178.13±8.39
WM 156 84 72 24.09±3.87 64.09±9.96 163.22±6.12 24.87±2.95 78.45±10.89 177.51±6.92
WG 77 33 44 26.42±4.73 72.85±12.7
3
166.21±6.14 25.06±3.17 79.08±12.17 177.47±6.39
SWG 69 31 38 26.91±4.26 74.99±15.3
2
166.61±6.93 26.84±3.66 86.07±14.09 178.94±8.62
116
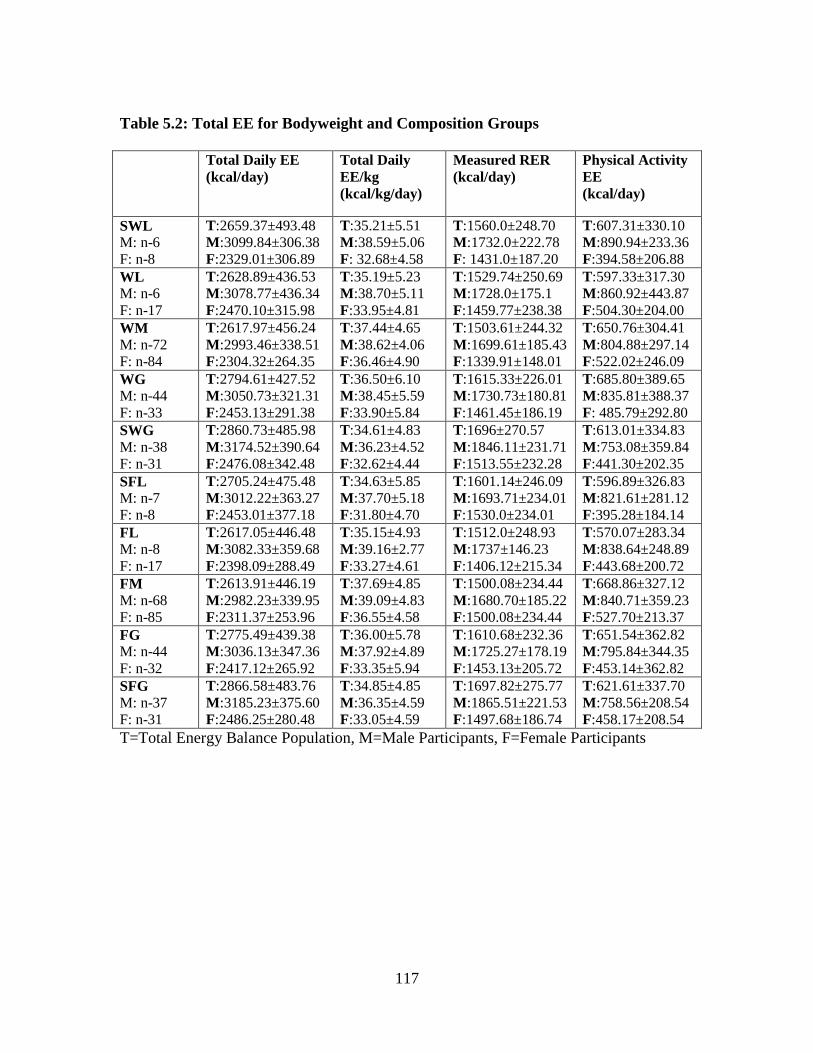
117
Table 5.2: Total EE for Bodyweight and Composition Groups
Total Daily EE
(kcal/day)
Total Daily
EE/kg
(kcal/kg/day)
Measured RER
(kcal/day)
Physical Activity
EE
(kcal/day)
SWL
M: n-6
F: n-8
T:2659.37±493.48
M:3099.84±306.38
F:2329.01±306.89
T:35.21±5.51
M:38.59±5.06
F: 32.68±4.58
T:1560.0±248.70
M:1732.0±222.78
F: 1431.0±187.20
T:607.31±330.10
M:890.94±233.36
F:394.58±206.88
WL
M: n-6
F: n-17
T:2628.89±436.53
M:3078.77±436.34
F:2470.10±315.98
T:35.19±5.23
M:38.70±5.11
F:33.95±4.81
T:1529.74±250.69
M:1728.0±175.1
F:1459.77±238.38
T:597.33±317.30
M:860.92±443.87
F:504.30±204.00
WM
M: n-72
F: n-84
T:2617.97±456.24
M:2993.46±338.51
F:2304.32±264.35
T:37.44±4.65
M:38.62±4.06
F:36.46±4.90
T:1503.61±244.32
M:1699.61±185.43
F:1339.91±148.01
T:650.76±304.41
M:804.88±297.14
F:522.02±246.09
WG
M: n-44
F: n-33
T:2794.61±427.52
M:3050.73±321.31
F:2453.13±291.38
T:36.50±6.10
M:38.45±5.59
F:33.90±5.84
T:1615.33±226.01
M:1730.73±180.81
F:1461.45±186.19
T:685.80±389.65
M:835.81±388.37
F: 485.79±292.80
SWG
M: n-38
F: n-31
T:2860.73±485.98
M:3174.52±390.64
F:2476.08±342.48
T:34.61±4.83
M:36.23±4.52
F:32.62±4.44
T:1696±270.57
M:1846.11±231.71
F:1513.55±232.28
T:613.01±334.83
M:753.08±359.84
F:441.30±202.35
SFL
M: n-7
F: n-8
T:2705.24±475.48
M:3012.22±363.27
F:2453.01±377.18
T:34.63±5.85
M:37.70±5.18
F:31.80±4.70
T:1601.14±246.09
M:1693.71±234.01
F:1530.0±234.01
T:596.89±326.83
M:821.61±281.12
F:395.28±184.14
FL
M: n-8
F: n-17
T:2617.05±446.48
M:3082.33±359.68
F:2398.09±288.49
T:35.15±4.93
M:39.16±2.77
F:33.27±4.61
T:1512.0±248.93
M:1737±146.23
F:1406.12±215.34
T:570.07±283.34
M:838.64±248.89
F:443.68±200.72
FM
M: n-68
F: n-85
T:2613.91±446.19
M:2982.23±339.95
F:2311.37±253.96
T:37.69±4.85
M:39.09±4.83
F:36.55±4.58
T:1500.08±234.44
M:1680.70±185.22
F:1500.08±234.44
T:668.86±327.12
M:840.71±359.23
F:527.70±213.37
FG
M: n-44
F: n-32
T:2775.49±439.38
M:3036.13±347.36
F:2417.12±265.92
T:36.00±5.78
M:37.92±4.89
F:33.35±5.94
T:1610.68±232.36
M:1725.27±178.19
F:1453.13±205.72
T:651.54±362.82
M:795.84±344.35
F:453.14±362.82
SFG
M: n-37
F: n-31
T:2866.58±483.76
M:3185.23±375.60
F:2486.25±280.48
T:34.85±4.85
M:36.35±4.59
F:33.05±4.59
T:1697.82±275.77
M:1865.51±221.53
F:1497.68±186.74
T:621.61±337.70
M:758.56±208.54
F:458.17±208.54
T=Total Energy Balance Population, M=Male Participants, F=Female Participants

118
Table 5.3: Percentage of Calories from Sedentary Activities for Body Composition Groups
SFL FL FM FG SFG
%Sedentary T:56.59±8.88
M:54.08±6.34
F:59.08±9.97
T:53.72±7.25
M:49.34±4.93
F:55.79±7.36
T:53.06±7.71
M:52.92±7.97
F:53.06±7.54
T:55.19±9.28%
M:54.37±9.24%
F:56.32±9.35%
T:55.67±6.94%
M:55.66±7.07%
F:55.68±6.96%
118
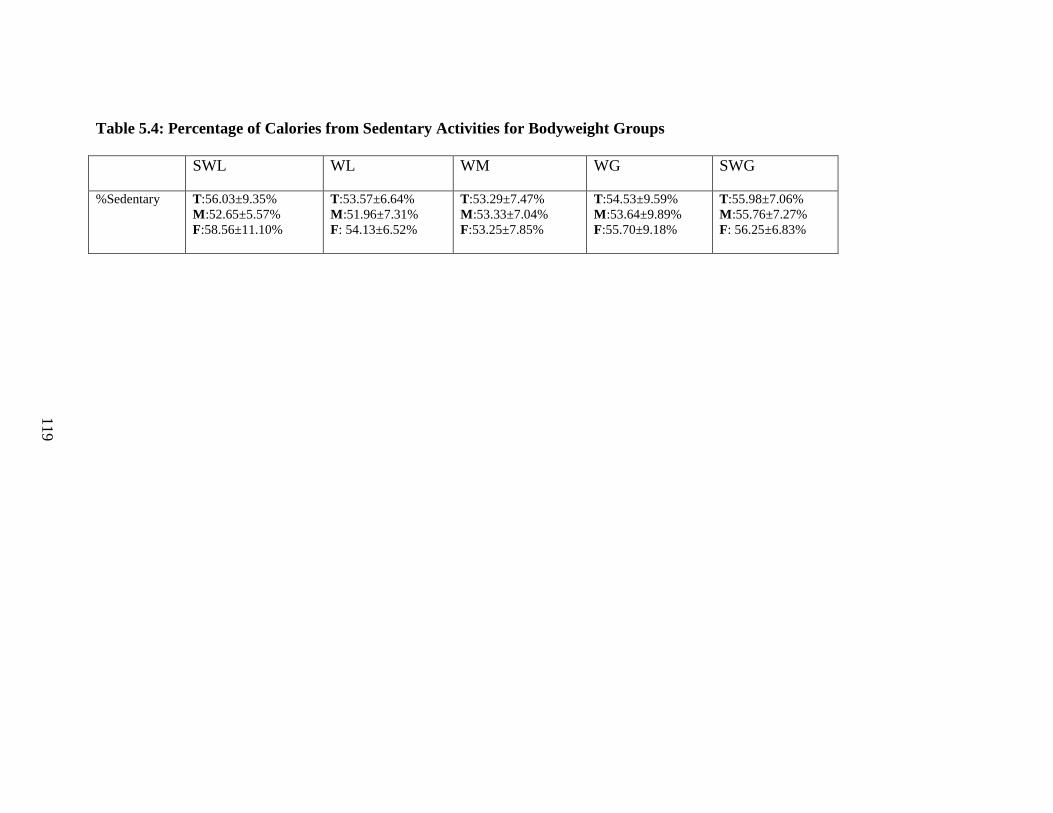
119
Table 5.4: Percentage of Calories from Sedentary Activities for Bodyweight Groups
SWL WL WM WG SWG
%Sedentary T:56.03±9.35%
M:52.65±5.57%
F:58.56±11.10%
T:53.57±6.64%
M:51.96±7.31%
F: 54.13±6.52%
T:53.29±7.47%
M:53.33±7.04%
F:53.25±7.85%
T:54.53±9.59%
M:53.64±9.89%
F:55.70±9.18%
T:55.98±7.06%
M:55.76±7.27%
F: 56.25±6.83%
119

120
Figure 5.1: Total Daily Energy Expenditure for Weight-Change Groups
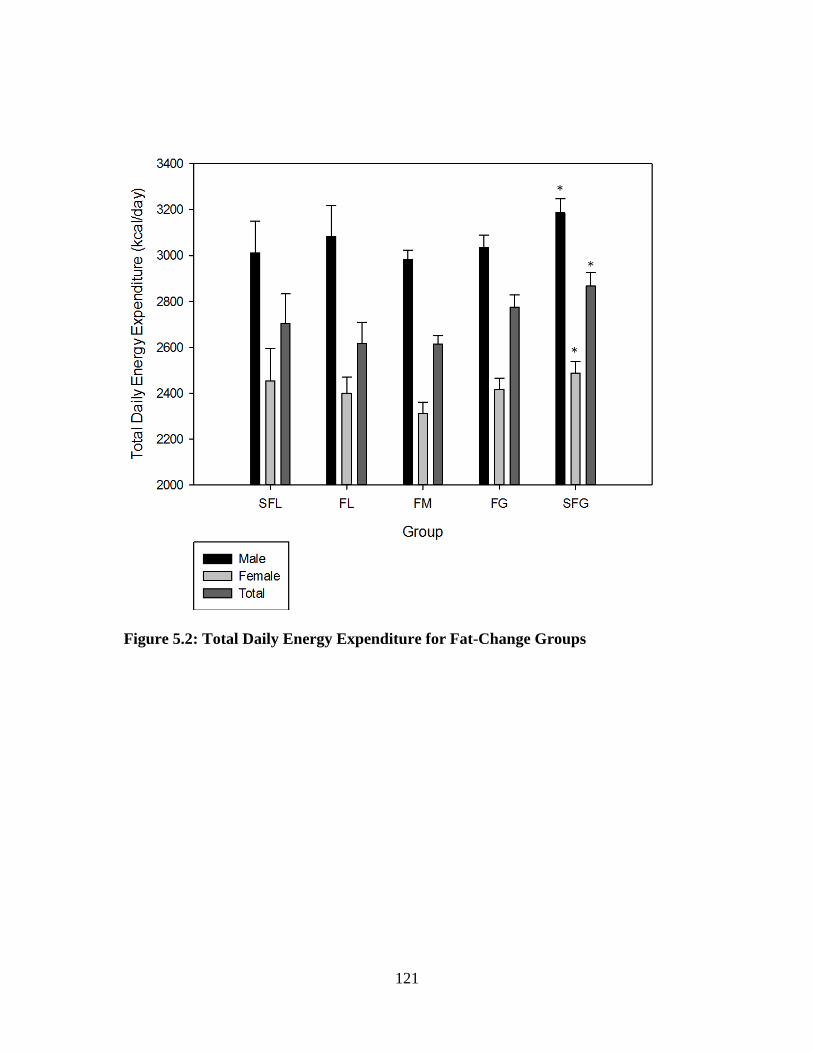
121
Figure 5.2: Total Daily Energy Expenditure for Fat-Change Groups

122
Figure 5.3: Total Daily Energy Expenditure per Kilogram of Bodyweight for
Weight-Change Groups

123
Figure 5.4: Total Daily Energy Expenditure per Kilogram of Bodyweight for
Weight-Change Groups

124
CHAPTER VI
OVERALL SUMMARY AND CONCLUSIONS
The balancing of energy in the human body throughout adult life is an extremely
intricate process that affects weight-change, risk of obesity and overall health. The
current dissertation has served to investigate several areas of energy balance to better
understand how energy balance and weight-change are viewed by the public.
The major purpose of this dissertation was to characterize bodyweight and
composition change in terms of steady state rate of change. Lastly, see how EE is
associated with the various categorizations of bodyweight and composition change.
Specifically, the purpose of the current dissertation was to:
1) To determine the overall weight-changes that occurs over a year period in a large
group of healthy adults.
2) To determine the overall body composition changes that occurs over a year period
to a group of 344 healthy adults.
3) To determine the association between changes in bodyweight and composition
and EE.
The three investigations of this dissertation were collected as a part of the first
year of the Energy Balance Study (a comprehensive study designed to determine the

125
associations of caloric intake and energy expenditure on changes in bodyweight
and composition in a population of healthy men and women). The investigations of
the current dissertation are crucial to providing insight and results to the primary aim
of this study.
The three studies of this dissertation used the quarter-annual clinical
measurements that were collected over the first year of the Energy Balance study. The
first two studies two models utilized linear mixed models (LMM) to examine the
effects of bodyweight and composition. The use of an LMM accounted for between
participant changes, and for inter-measurement variation for each participant. The
LMM provided a distinctive prospective on both bodyweight and composition
changes, which is not typically seen in the current research literature. The primary
aim of the Energy Balance study was to observe the changes of bodyweight and
composition over an initial timeframe of 12-months. To truly observe rates of change
and account between measurement variations, a LMM is necessary. The first and
second aim gave deeper insight into the question of how energy storage changes over
extended periods of time, which is crucial to better under energy balance. The third
aim took the data regarding ES that was gained in aims 1 and 2 and associated this
with the EE of each participant.
The primary results from these three studies include:
1. The calculated weight-change by the LMM averaged for the entire Energy
Balance population was very similar to the weight-change measured by taking the
12-month measurement and subtracting the baseline measurement. However,

126
when viewed on an individual basis the values for each participant are
substantially different. Traditional measurements of bodyweight are inaccurate for
accessing bodyweight-change.
2. There were substantial differences observed in total daily EE, total daily EE per
kg of bodyweight, RER and percentage of EE from sedentary activities amongst
groups of bodyweight and composition. The SWG and SFG groups were
substantially different from the maintenance groups in the previously mentioned
variables. The SWG and SWF groups had a higher total daily EE due to their
substantially higher starting bodyweight, while the maintenance groups had a
higher EE per kg. Lastly the maintenance groups spent less percentage of their
total EE in sedentary activities, suggesting a higher level of activity to maintain
weight.
3. There were substantial differences observed in total daily EE, total daily EE per
kg of bodyweight, RER and percentage of EE from sedentary activities amongst
groups of bodyweight and composition. The SWG and SWF groups were
substantially different from the maintenance groups in the previously mentioned
variables. The SWG and SWF groups had a higher total daily EE due to their
substantially higher starting bodyweight, while the maintenance groups had a
higher EE per kg. Lastly the maintenance groups spent less percentage of their
total EE in sedentary activities, suggesting a higher level of activity to maintain
weight.
The results from the current dissertation provided crucial information for better
understanding energy balance. The chief novelties of these studies are the

127
examination of bodyweight and composition with LMM, which allow for more
understanding of how ES changes in the individual over time. In addition, the last
study shows that there is a link between EE and maintaining bodyweight and
composition. The participants who were considered in weight maintenance weighed
substantially less than the participants gaining substantial amounts of mass. This
suggests that the behaviors and tendencies that have driven EE and EI in the
participants gaining mass during the length of the study, have most likely been
driving their EE and EI for several years before the study. The first two papers
suggest that anyone with a positive trajectory of weight is at risk for weight to
increase above a healthy level. Regardless of fluctuations in water, the yearly trend
shows gains in weight. The first two papers also show that while there were many
participants in the Energy Balance study who were trying to lose weight, very few
succeeded in having a negative trajectory of weight for the entire year. The third
paper added associations of EE with the novel groupings of weight-change and fat-
change that were created in papers 1 and 2. Paper 3 suggests that the individual’s
maintaining their weight and fat-mass are deriving substantially less of their calories
from sedentary activities. The studies of this dissertation are the first to look at
changes of bodyweight and composition of the same sample population using a LMM
to more accurately predict the changes. Further studies should include how the EI of
an individual varies over time so that a more accurate assessment of the full energy
balance equation may be depicted.
In summary, the use of an LMM depicting changes in mass and weight were more
accurate than traditional methods for projecting mass and weight gain over extended

128
periods of time. The LMM eliminated much of the between measurement extraneous
fluctuation that is due to water flux and other factors. The two models for bodyweight
and composition were compared and in this population of young healthy adults it was
realized that the predominant amount of bodyweight-change was due to fat change.
Lastly, connections between ES and EE were made in the last paper showing an
association between a substantially decreased percentage of total daily EE coming from
sedentary activities and the maintenance of bodyweight and composition. Therefore,
these three papers stress the importance of proper monitoring of bodyweight and
composition and the importance of non-sedentary EE

129
REFERENCES
1. Mokdad AH, Serdula MK, Dietz WH, Bowman BA, Marks JS, Koplan JP. The
spread of the obesity epidemic in the United States, 1991-1998. JAMA 1999 Oct
27;282(16):1519-22.
2. Finkelstein EA, Khavjou OA, Thompson H, Trogdon JG, Pan L, Sherry B, Dietz
W. Obesity and severe obesity forecasts through 2030. Am.J.Prev.Med. 2012
Jun;42(6):563-70.
3. Tsai AG, Williamson DF, Glick HA. Direct medical cost of overweight and
obesity in the USA: a quantitative systematic review. Obes.Rev. 2011
Jan;12(1):50-61.
4. Spiegelman BM, Flier JS. Obesity and the regulation of energy balance. Cell 2001
Feb 23;104(4):531-43.
5. Hill JO, Wyatt HR, Peters JC. Energy balance and obesity. Circulation 2012 Jul
3;126(1):126-32.
6. Hall KD, Heymsfield SB, Kemnitz JW, Klein S, Schoeller DA, Speakman JR.
Energy balance and its components: implications for body weight regulation.
Am.J.Clin.Nutr. 2012 Apr;95(4):989-94.
7. Johnstone AM, Murison SD, Duncan JS, Rance KA, Speakman JR. Factors
influencing variation in basal metabolic rate include fat-free mass, fat mass, age,
and circulating thyroxine but not sex, circulating leptin, or triiodothyronine.
Am.J.Clin.Nutr. 2005 Nov;82(5):941-8.
8. Illner K, Brinkmann G, Heller M, Bosy-Westphal A, Muller MJ. Metabolically
active components of fat free mass and resting energy expenditure in nonobese
adults. Am.J.Physiol Endocrinol.Metab 2000 Feb;278(2):E308-E315.
9. Friedman JM. Obesity in the new millennium. Nature 2000 Apr 6;404(6778):632-
4.
10. Raben A, Agerholm-Larsen L, Flint A, Holst JJ, Astrup A. Meals with similar
energy densities but rich in protein, fat, carbohydrate, or alcohol have different
effects on energy expenditure and substrate metabolism but not on appetite and
energy intake. Am.J.Clin.Nutr. 2003 Jan;77(1):91-100.

130
11. Hirsch J, Knittle JL. Cellularity of obese and nonobese human adipose tissue.
Fed.Proc. 1970 Jul;29(4):1516-21.
12. Torres SJ, Nowson CA. Relationship between stress, eating behavior, and obesity.
Nutrition 2007 Nov;23(11-12):887-94.
13. Stevens J, Truesdale KP, McClain JE, Cai J. The definition of weight
maintenance. Int.J.Obes.(Lond) 2006 Mar;30(3):391-9.
14. Wroble RR, Moxley DP. Acute weight gain and its relationship to success in high
school wrestlers. Med.Sci.Sports Exerc. 1998 Jun;30(6):949-51.
15. Fosbol MO, Zerahn B. Contemporary methods of body composition
measurement. Clin.Physiol Funct.Imaging 2014 Apr 15.
16. Hill JO, Wyatt HR, Reed GW, Peters JC. Obesity and the environment: where do
we go from here? Science 2003 Feb 7;299(5608):853-5.
17. Bray GA, Smith SR, de JL, Xie H, Rood J, Martin CK, Most M, Brock C,
Mancuso S, Redman LM. Effect of dietary protein content on weight gain, energy
expenditure, and body composition during overeating: a randomized controlled
trial. JAMA 2012 Jan 4;307(1):47-55.
18. Peterson MD, Sen A, Gordon PM. Influence of resistance exercise on lean body
mass in aging adults: a meta-analysis. Med.Sci.Sports Exerc. 2011 Feb;43(2):249-
58.
19. Wang YC, McPherson K, Marsh T, Gortmaker SL, Brown M. Health and
economic burden of the projected obesity trends in the USA and the UK. Lancet
2011 Aug 27;378(9793):815-25.
20. Kahn SE, Hull RL, Utzschneider KM. Mechanisms linking obesity to insulin
resistance and type 2 diabetes. Nature 2006 Dec 14;444(7121):840-6.
21. Curioni C, Andre C, Veras R. Weight reduction for primary prevention of stroke
in adults with overweight or obesity. Cochrane.Database.Syst.Rev.
2006;(4):CD006062.
22. Frezza EE, Wachtel MS, Chiriva-Internati M. Influence of obesity on the risk of
developing colon cancer. Gut 2006 Feb;55(2):285-91.
23. Gabay O, Hall DJ, Berenbaum F, Henrotin Y, Sanchez C. Osteoarthritis and
obesity: experimental models. Joint Bone Spine 2008 Dec;75(6):675-9.
24. Stephenson GD, Rose DP. Breast cancer and obesity: an update. Nutr.Cancer
2003;45(1):1-16.

131
25. Yudkin JS, Kumari M, Humphries SE, Mohamed-Ali V. Inflammation, obesity,
stress and coronary heart disease: is interleukin-6 the link? Atherosclerosis 2000
Feb;148(2):209-14.
26. Withrow D, Alter DA. The economic burden of obesity worldwide: a systematic
review of the direct costs of obesity. Obes.Rev. 2011 Feb;12(2):131-41.
27. Dhurandhar NV. Infectobesity: obesity of infectious origin. J.Nutr. 2001
Oct;131(10):2794S-7S.
28. Fox KR, Hillsdon M. Physical activity and obesity. Obes.Rev. 2007 Mar;8 Suppl
1:115-21.
29. Hamilton MT, Hamilton DG, Zderic TW. Role of low energy expenditure and
sitting in obesity, metabolic syndrome, type 2 diabetes, and cardiovascular
disease. Diabetes 2007 Nov;56(11):2655-67.
30. Prentice AM, Jebb SA. Fast foods, energy density and obesity: a possible
mechanistic link. Obes.Rev. 2003 Nov;4(4):187-94.
31. Stubbs CO, Lee AJ. The obesity epidemic: both energy intake and physical
activity contribute. Med.J.Aust. 2004 Nov 1;181(9):489-91.
32. Vom Saal FS, Nagel SC, Coe BL, Angle BM, Taylor JA. The estrogenic
endocrine disrupting chemical bisphenol A (BPA) and obesity. Mol.Cell
Endocrinol. 2012 May 6;354(1-2):74-84.
33. Andres R, Muller DC, Sorkin JD. Long-term effects of change in body weight on
all-cause mortality. A review. Ann.Intern.Med. 1993 Oct 1;119(7 Pt 2):737-43.
34. Chow CC, Hall KD. The dynamics of human body weight change.
PLoS.Comput.Biol. 2008 Mar;4(3):e1000045.
35. Flier J, Maratos-Flier E. Energy homeostasis and body weight. Curr.Biol. 2000
Mar 23;10(6):R215-R217.
36. Garn SM. Fractionating healthy weight. Am.J.Clin.Nutr. 1996 Mar;63(3
Suppl):412S-4S.
37. Jequier E, Tappy L. Regulation of body weight in humans. Physiol Rev. 1999
Apr;79(2):451-80.
38. Guo SS, Zeller C, Chumlea WC, Siervogel RM. Aging, body composition, and
lifestyle: the Fels Longitudinal Study. Am.J.Clin.Nutr. 1999 Sep;70(3):405-11.
39. Dulloo AG, Jacquet J, Solinas G, Montani JP, Schutz Y. Body composition
phenotypes in pathways to obesity and the metabolic syndrome. Int.J.Obes.(Lond)
2010 Dec;34 Suppl 2:S4-17.
132
40. Snijder MB, van Dam RM, Visser M, Seidell JC. What aspects of body fat are
particularly hazardous and how do we measure them? Int.J.Epidemiol. 2006
Feb;35(1):83-92.
41. Haslam D. Obesity: a medical history. Obes.Rev. 2007 Mar;8 Suppl 1:31-6.
42. Blair SN, Kohl HW, III, Paffenbarger RS, Jr., Clark DG, Cooper KH, Gibbons
LW. Physical fitness and all-cause mortality. A prospective study of healthy men
and women. JAMA 1989 Nov 3;262(17):2395-401.
43. Myers J, Prakash M, Froelicher V, Do D, Partington S, Atwood JE. Exercise
capacity and mortality among men referred for exercise testing. N.Engl.J.Med.
2002 Mar 14;346(11):793-801.
44. Paffenbarger RS, Jr., Hyde RT, Wing AL, Lee IM, Jung DL, Kampert JB. The
association of changes in physical-activity level and other lifestyle characteristics
with mortality among men. N.Engl.J.Med. 1993 Feb 25;328(8):538-45.
45. Warburton DE, Nicol CW, Bredin SS. Health benefits of physical activity: the
evidence. CMAJ. 2006 Mar 14;174(6):801-9.
46. Bigaard J, Frederiksen K, Tjonneland A, Thomsen BL, Overvad K, Heitmann BL,
Sorensen TI. Body fat and fat-free mass and all-cause mortality. Obes.Res. 2004
Jul;12(7):1042-9.
47. Christou DD, Gentile CL, DeSouza CA, Seals DR, Gates PE. Fatness is a better
predictor of cardiovascular disease risk factor profile than aerobic fitness in
healthy men. Circulation 2005 Apr 19;111(15):1904-14.
48. Stevens J, Cai J, Evenson KR, Thomas R. Fitness and fatness as predictors of
mortality from all causes and from cardiovascular disease in men and women in
the lipid research clinics study. Am.J.Epidemiol. 2002 Nov 1;156(9):832-41.
49. Heymsfield SB, Pietrobelli A, Wang Z, Saris WH. The end of body composition
methodology research? Curr.Opin.Clin.Nutr.Metab Care 2005 Nov;8(6):591-4.
50. Spencer F. History of Physical Antropology. New York: 97 A.D.
51. BROZEK J, Keys A. Relative body weight, age and fatness. Geriatrics 1953
Feb;8(2):70-5.
52. Keys A, BROZEK J. Body fat in adult man. Physiol Rev. 1953 Jul;33(3):245-325.
53. Shen W, Chen J. Application of imaging and other noninvasive techniques in
determining adipose tissue mass. Methods Mol.Biol. 2008;456:39-54.

133
54. Wang Z, Heymsfield SB, Pi-Sunyer FX, Gallagher D, Pierson RN, Jr. Body
composition analysis: Cellular level modeling of body component ratios.
Int.J.Body Compos.Res. 2008;6(4):173-84.
55. Ellis KJ. Human body composition: in vivo methods. Physiol Rev. 2000
Apr;80(2):649-80.
56. Wang ZM, Deurenberg P, Guo SS, Pietrobelli A, Wang J, Pierson RN, Jr.,
Heymsfield SB. Six-compartment body composition model: inter-method
comparisons of total body fat measurement. Int.J.Obes.Relat Metab Disord. 1998
Apr;22(4):329-37.
57. Schutte JE, Townsend EJ, Hugg J, Shoup RF, Malina RM, Blomqvist CG.
Density of lean body mass is greater in blacks than in whites. J.Appl.Physiol
Respir.Environ.Exerc.Physiol 1984 Jun;56(6):1647-9.
58. Heymsfield SB, Wang J, Kehayias J, Heshka S, Lichtman S, Pierson RN, Jr.
Chemical determination of human body density in vivo: relevance to
hydrodensitometry. Am.J.Clin.Nutr. 1989 Dec;50(6):1282-9.
59. Cohn SH, Vaswani AN, Yasumura S, Yuen K, Ellis KJ. Improved models for
determination of body fat by in vivo neutron activation. Am.J.Clin.Nutr. 1984
Aug;40(2):255-9.
60. Ellis KJ, Yasumura S, Vartsky D, Vaswani AN, Cohn SH. Total body nitrogen in
health and disease: effects of age, weight, height, and sex. J.Lab Clin.Med. 1982
Jun;99(6):917-26.
61. Pierson RN, Jr., Wang J, Heymsfield SB, Russell-Aulet M, Mazariegos M,
Tierney M, Smith R, Thornton JC, Kehayias J, Weber DA, et al. Measuring body
fat: calibrating the rulers. Intermethod comparisons in 389 normal Caucasian
subjects. Am.J.Physiol 1991 Jul;261(1 Pt 1):E103-E108.
62. Pierson RN, Jr., Wang J. Body composition denominators for measurements of
metabolism: what measurements can be believed? Mayo Clin.Proc. 1988
Sep;63(9):947-9.
63. Kotler DP, Thea DM, Heo M, Allison DB, Engelson ES, Wang J, Pierson RN, Jr.,
St LM, Keusch GT. Relative influences of sex, race, environment, and HIV
infection on body composition in adults. Am.J.Clin.Nutr. 1999 Mar;69(3):432-9.
64. BROZEK J, Keys A. The evaluation of leanness-fatness in man; norms and
interrelationships. Br.J.Nutr. 1951;5(2):194-206.
65. Forbes GB. Perspectives on body composition. Curr.Opin.Clin.Nutr.Metab Care
2002 Jan;5(1):25-30.

134
66. Tchernof A, Despres JP. Pathophysiology of human visceral obesity: an update.
Physiol Rev. 2013 Jan;93(1):359-404.
67. Micklesfield LK, Goedecke JH, Punyanitya M, Wilson KE, Kelly TL. Dual-
energy X-ray performs as well as clinical computed tomography for the
measurement of visceral fat. Obesity.(Silver.Spring) 2012 May;20(5):1109-14.
68. Jumpertz R, Le DS, Turnbaugh PJ, Trinidad C, Bogardus C, Gordon JI, Krakoff J.
Energy-balance studies reveal associations between gut microbes, caloric load,
and nutrient absorption in humans. Am.J.Clin.Nutr. 2011 Jul;94(1):58-65.
69. Zheng H, Lenard NR, Shin AC, Berthoud HR. Appetite control and energy
balance regulation in the modern world: reward-driven brain overrides repletion
signals. Int.J.Obes.(Lond) 2009 Jun;33 Suppl 2:S8-13.
70. Ahima RS, Lazar MA. Adipokines and the peripheral and neural control of energy
balance. Molecular Endocrinology 2008;22(5):1023-31.
71. Remmers F, Delemarre-van de Waal H. Developmental programming of energy
balance and its hypothalamic regulation. Endocrine reviews 2010;32(2):272-311.
72. Johannsen DL, Calabro MA, Stewart J, Franke W, Rood JC, Welk GJ. Accuracy
of armband monitors for measuring daily energy expenditure in healthy adults.
Med.Sci.Sports Exerc. 2010 Nov;42(11):2134-40.
73. Ainsworth BE, Haskell WL, Herrmann SD, Meckes N, Bassett DR, Jr., Tudor-
Locke C, Greer JL, Vezina J, Whitt-Glover MC, Leon AS. 2011 Compendium of
Physical Activities: a second update of codes and MET values. Med.Sci.Sports
Exerc. 2011 Aug;43(8):1575-81.
74. THOMAS LW. The chemical composition of adipose tissue of man and mice.
Q.J.Exp.Physiol Cogn Med.Sci. 1962 Apr;47:179-88.
75. Hand GA, Shook RP, Paluch AE, Baruth M, Crowley EP, Jaggers JR, Prasad VK,
Hurley TG, Hebert JR, O'Connor DP, et al. The energy balance study: the design
and baseline results for a longitudinal study of energy balance. Res.Q.Exerc.Sport
2013 Sep;84(3):275-86.
76. Williamson DF. Epidemiologic analysis of weight gain in U.S. adults. Nutrition
1991 Jul;7(4):285-6.
77. Sheehan TJ, DuBrava S, DeChello LM, Fang Z. Rates of weight change for black
and white Americans over a twenty year period. Int.J.Obes.Relat Metab Disord.
2003 Apr;27(4):498-504.
78. Yun D, Silk KJ. Social norms, self-identity, and attention to social comparison
information in the context of exercise and healthy diet behavior. Health Commun.
2011 Apr;26(3):275-85.

135
79. Elfhag K, Rossner S. Who succeeds in maintaining weight loss? A conceptual
review of factors associated with weight loss maintenance and weight regain.
Obes.Rev. 2005 Feb;6(1):67-85.
80. Elfhag K. Personality correlates of obese eating behaviour: Swedish universities
Scales of Personality and the Three Factor Eating Questionnaire.
Eat.Weight.Disord. 2005 Dec;10(4):210-5.
81. Willett WC, Hu FB, Thun M. Overweight, obesity, and all-cause mortality.
JAMA 2013 Apr 24;309(16):1681.
82. Hennecke M, Freund AM. Identifying success on the process level reduces
negative effects of prior weight loss on subsequent weight loss during a low-
calorie diet. Appl.Psychol.Health Well.Being. 2014 Mar;6(1):48-66.
83. Yates T, Davies MJ, Khunti K. Obesity and chronic disease in younger people: an
unfolding crisis. Br.J.Gen.Pract. 2012 Jan;62(594):4-5.
84. Heymsfield SB, Gallagher D, Mayer L, Beetsch J, Pietrobelli A. Scaling of
human body composition to stature: new insights into body mass index.
Am.J.Clin.Nutr. 2007 Jul;86(1):82-91.
85. Keys A, Fidanza F, Karvonen MJ, Kimura N, Taylor HL. Indices of relative
weight and obesity. J.Chronic.Dis. 1972 Jul 1;25(6):329-43.
86. Kuczmarski RJ, Flegal KM. Criteria for definition of overweight in transition:
background and recommendations for the United States. Am.J.Clin.Nutr. 2000
Nov;72(5):1074-81.
87. Gallagher D, Visser M, Sepulveda D, Pierson RN, Harris T, Heymsfield SB. How
useful is body mass index for comparison of body fatness across age, sex, and
ethnic groups? Am.J.Epidemiol. 1996 Feb 1;143(3):228-39.
88. Katzmarzyk PT, Janssen I, Ardern CI. Physical inactivity, excess adiposity and
premature mortality. Obes.Rev. 2003 Nov;4(4):257-90.
89. Spiegelman BM, Flier JS. Obesity and the regulation of energy balance. Cell 2001
Feb 23;104(4):531-43.
90. Kyle UG, Melzer K, Kayser B, Picard-Kossovsky M, Gremion G, Pichard C.
Eight-year longitudinal changes in body composition in healthy Swiss adults.
J.Am.Coll.Nutr. 2006 Dec;25(6):493-501.
91. Fielding RA, Vellas B, Evans WJ, Bhasin S, Morley JE, Newman AB, Abellan
van KG, Andrieu S, Bauer J, Breuille D, et al. Sarcopenia: an undiagnosed
condition in older adults. Current consensus definition: prevalence, etiology, and
consequences. International working group on sarcopenia. J.Am.Med.Dir.Assoc.
2011 May;12(4):249-56.

136
92. Ogden CL, Carroll MD, Flegal KM. Prevalence of obesity in the United States.
JAMA 2014 Jul;312(2):189-90.
93. Chumlea WC, Guo SS, Zeller CM, Reo NV, Siervogel RM. Total body water data
for white adults 18 to 64 years of age: the Fels Longitudinal Study. Kidney Int.
1999 Jul;56(1):244-52.
94. Heitmann BL, Garby L. Composition (lean and fat tissue) of weight changes in
adult Danes. Am.J.Clin.Nutr. 2002 May;75(5):840-7.
95. Kyle UG, Morabia A, Schutz Y, Pichard C. Sedentarism affects body fat mass
index and fat-free mass index in adults aged 18 to 98 years. Nutrition 2004
Mar;20(3):255-60.
96. Haapanen N, Miilunpalo S, Pasanen M, Oja P, Vuori I. Association between
leisure time physical activity and 10-year body mass change among working-aged
men and women. Int.J.Obes.Relat Metab Disord. 1997 Apr;21(4):288-96.
97. da Rocha EE, Alves VG, Silva MH, Chiesa CA, da Fonseca RB. Can measured
resting energy expenditure be estimated by formulae in daily clinical nutrition
practice? Curr.Opin.Clin.Nutr.Metab Care 2005 May;8(3):319-28.