Embed Size (px)
Citation preview
UNITED STATES SENTENCING COMMISSION
Weighing the Charges:Simple Possession of Drugs in the Federal Criminal Justice System

Patti B. SarisChair
Charles R. Breyer Vice Chair
Dabney L. Friedrich Commissioner
Rachel E. Barkow Commissioner
William H. Pryor, Jr. Commissioner
Michelle Morales Ex Officio
J. Patricia Wilson SmootEx Officio
Kenneth P. CohenStaff Director
Glenn R. SchmittDirectorOffice of Research and Data
September 2016
United States Sentencing CommissionOne Columbus Circle, N.E.Washington, DC 20002www.ussc.gov
1
Introduction1
The simple possession of illegal drugs is a criminal offense under federal law2 and in many state jurisdictions. The offense occurs “when someone has on his or her person, or available for his or her use, a small amount of an illegal substance for the purpose of consuming or using it but without the intent to sell or give it to anyone else.”3
Simple drug possession is a misdemeanor under federal law which provides that an offender may be sentenced to a term of imprisonment of not more than one year, fined a minimum of $1,000, or both. However, if an offender is convicted of simple possession after a prior drug related offense has become final, the offender can be charged with a felony simple possession offense.4
The number of federal offenders whose most serious offense was simple drug possession increased nearly 400 percent during the six-year period between fiscal years 2008 and 2013. A change of this magnitude over a relatively short period of time triggered further investigation into these cases using data on offender and offense characteristics routinely collected by the United States Sentencing Commission (“the Commission”), as well as additional data collected specifically for this project.
At first, this dramatic increase in the number of offenders sentenced for the simple possession of drugs seems to suggest a substantially increased focus on this offense by federal law enforcement personnel. Further analysis, however, does not support such a conclusion. A closer inspection of the data demonstrates that this increase is almost entirely attributable to a single drug type—marijuana—and to offenders who were arrested at or near the U.S./Mexico border (a group almost entirely composed of offenders from the District of Arizona). For simple possession of marijuana offenders arrested at locations other than the U.S./Mexico border, the median quantity of marijuana involved in the offense was 5.2 grams (0.2 ounces). In contrast, the offense conduct of simple possession of marijuana offenders arrested at that border involved a median quantity of 22,000 grams (48.5 pounds or 776.0 ounces)—a quantity that appears in excess of a personal use quantity.5
Weighing the Charges: Simple Possession of
Drugs in the Federal Criminal Justice System
Melissa K. Reimer
Research Associate Office of Research and Data
United States Sentencing Commission
2
Federal Simple Possession Offenders
The federal simple possession offenders analyzed in this report were those offenders sentenced between fiscal years 2008 and 2013 with a primary offense type of simple possession and/or offenders for whom the most serious guideline applied in the offense was USSG §2D2.1 (Simple Possession). This methodology identified 2,319 offenders in fiscal year 2013. To satisfy the Commission’s statutory research obligation, a wide variety of information on offender and offense characteristics is routinely coded in every case. For this analysis, the routinely collected data was augmented through a further review of these 2,319 cases, collecting more detailed information relating to the events surrounding the offense that is not readily available in the Commission’s Offender Datasets.6
Recent Trend in Number of Simple Possession Offenders
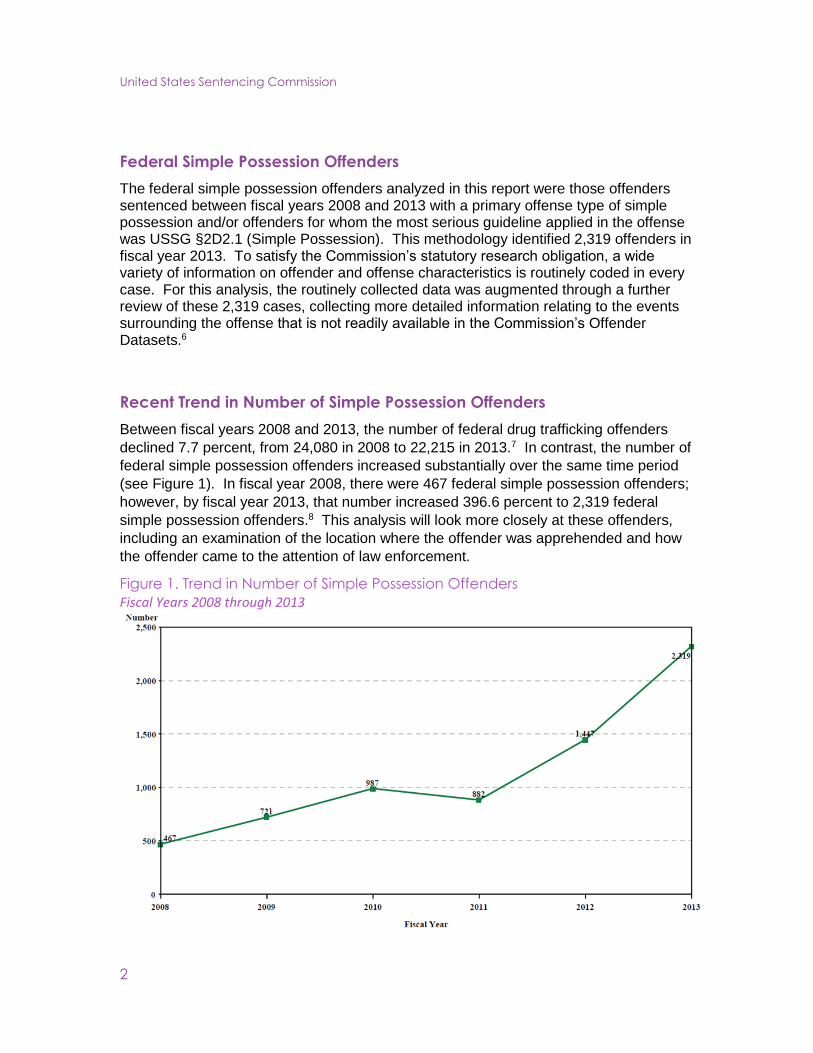
Between fiscal years 2008 and 2013, the number of federal drug trafficking offenders
declined 7.7 percent, from 24,080 in 2008 to 22,215 in 2013.7 In contrast, the number of
federal simple possession offenders increased substantially over the same time period
(see Figure 1). In fiscal year 2008, there were 467 federal simple possession offenders;
however, by fiscal year 2013, that number increased 396.6 percent to 2,319 federal
simple possession offenders.8 This analysis will look more closely at these offenders,
including an examination of the location where the offender was apprehended and how
the offender came to the attention of law enforcement.
Figure 1. Trend in Number of Simple Possession Offenders
Fiscal Years 2008 through 2013
Simple Possession
3
Analysis
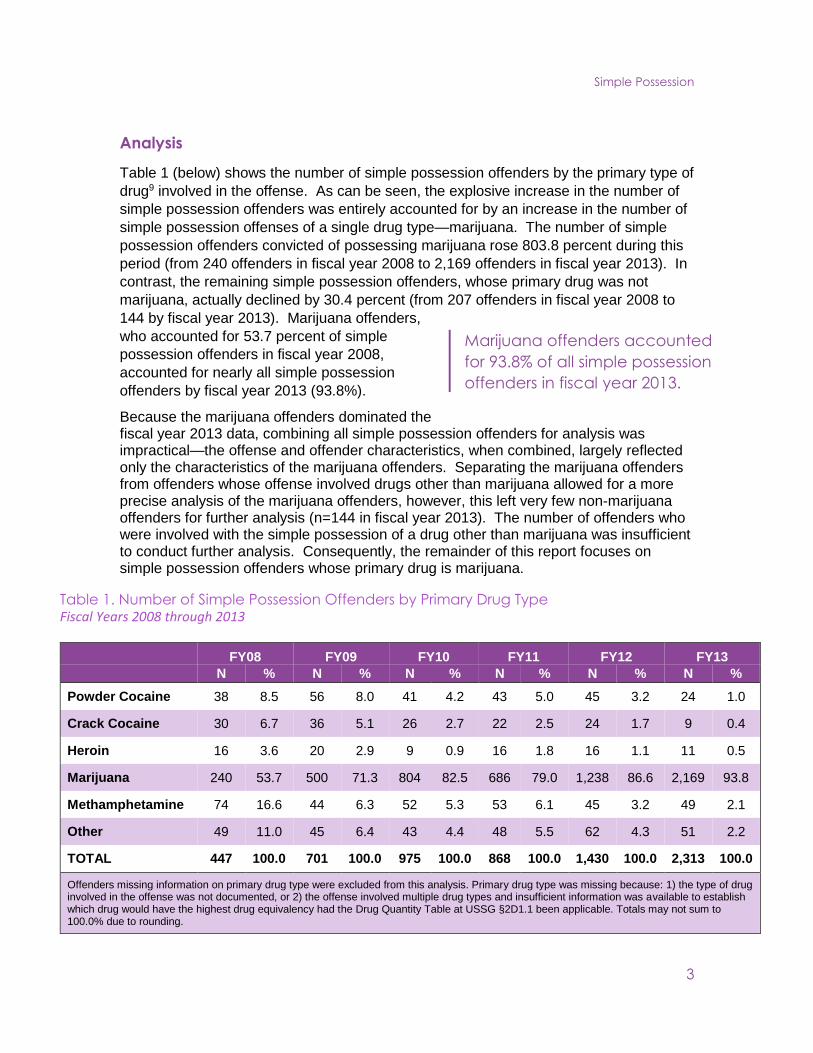
Table 1 (below) shows the number of simple possession offenders by the primary type of
drug9 involved in the offense. As can be seen, the explosive increase in the number of
simple possession offenders was entirely accounted for by an increase in the number of
simple possession offenses of a single drug type—marijuana. The number of simple
possession offenders convicted of possessing marijuana rose 803.8 percent during this
period (from 240 offenders in fiscal year 2008 to 2,169 offenders in fiscal year 2013). In
contrast, the remaining simple possession offenders, whose primary drug was not
marijuana, actually declined by 30.4 percent (from 207 offenders in fiscal year 2008 to
144 by fiscal year 2013). Marijuana offenders,
who accounted for 53.7 percent of simple
possession offenders in fiscal year 2008,
accounted for nearly all simple possession
offenders by fiscal year 2013 (93.8%).
Because the marijuana offenders dominated the fiscal year 2013 data, combining all simple possession offenders for analysis was impractical—the offense and offender characteristics, when combined, largely reflected only the characteristics of the marijuana offenders. Separating the marijuana offenders from offenders whose offense involved drugs other than marijuana allowed for a more precise analysis of the marijuana offenders, however, this left very few non-marijuana offenders for further analysis (n=144 in fiscal year 2013). The number of offenders who were involved with the simple possession of a drug other than marijuana was insufficient to conduct further analysis. Consequently, the remainder of this report focuses on simple possession offenders whose primary drug is marijuana.
Table 1. Number of Simple Possession Offenders by Primary Drug Type Fiscal Years 2008 through 2013
FY08 FY09 FY10 FY11 FY12 FY13
N % N % N % N % N % N %
Powder Cocaine 38 8.5 56 8.0 41 4.2 43 5.0 45 3.2 24 1.0
Crack Cocaine 30 6.7 36 5.1 26 2.7 22 2.5 24 1.7 9 0.4
Heroin 16 3.6 20 2.9 9 0.9 16 1.8 16 1.1 11 0.5
Marijuana 240 53.7 500 71.3 804 82.5 686 79.0 1,238 86.6 2,169 93.8
Methamphetamine 74 16.6 44 6.3 52 5.3 53 6.1 45 3.2 49 2.1
Other 49 11.0 45 6.4 43 4.4 48 5.5 62 4.3 51 2.2
TOTAL 447 100.0 701 100.0 975 100.0 868 100.0 1,430 100.0 2,313 100.0
Offenders missing information on primary drug type were excluded from this analysis. Primary drug type was missing because: 1) the type of drug involved in the offense was not documented, or 2) the offense involved multiple drug types and insufficient information was available to establish which drug would have the highest drug equivalency had the Drug Quantity Table at USSG §2D1.1 been applicable. Totals may not sum to 100.0% due to rounding.
Marijuana offenders accounted
for 93.8% of all simple possession
offenders in fiscal year 2013.

United States Sentencing Commission
4
Location of Offenses by Judicial District
In fiscal year 2013, 40 districts reported at least one offender who was convicted of simple possession of marijuana. The vast majority of the marijuana simple possession offenders were sentenced in a single district, the District of Arizona. Of the 2,169 offenders, 86.7 percent (n=1,880) were sentenced in the District of Arizona. Following Arizona, the district with the greatest number of offenders was the Western District of Texas with 107 offenders (4.9% of the total) followed by the Eastern District of Virginia with 34 offenders (1.6%). Of the remaining districts reporting simple possession offenses, the majority reported fewer than ten marijuana simple possession offenders (32 districts). Fifteen of these districts sentenced only a single offender and 54 districts reported no marijuana possession offenders in fiscal year 2013.
In contrast, in fiscal year 2008 no single district dominated the simple possession caseload. In 2008, the Eastern District of Virginia reported the most marijuana simple possession offenders with 26 offenders (10.8% of the total). The District of Wyoming reported 21 offenders (8.8%) followed by the Western District of Texas (n=20, 8.3%), the Western District of Kentucky (n=19, 7.9%), and the District of Utah (n=12, 5.0%). The District of Arizona (which, again, accounted for 86.7% of fiscal year 2013’s caseload) reported only nine marijuana simple possession offenders in fiscal year 2008 (3.8% of the total). Similar to fiscal year 2013, among districts reporting simple possession offenses, the majority reported fewer than ten offenders (36 districts). Thirteen of these districts sentenced only a single offender and 51 districts reported no marijuana simple possession offenders in fiscal year 2008.
Table 2. Top 10 Districts Sentencing Marijuana Simple Possession
Offenders10
FY08 FY13
District N % District N %
Eastern Virginia 26 10.8 Arizona 1,880 86.7
Wyoming 21 8.8 Western Texas 107 4.9
Western Texas 20 8.3 Eastern Virginia 34 1.6
Western Kentucky 19 7.9 Utah 19 0.9
Utah 12 5.0 Southern California 15 0.7
New Jersey 11 4.6 Eastern North Carolina 11 0.5
Middle Georgia 10 4.2 New Jersey 11 0.5
Arizona 9 3.8 Wyoming 11 0.5
Southern Georgia 9 3.8 South Dakota 9 0.4
Western Oklahoma 9 3.8 Middle Georgia 7 0.3
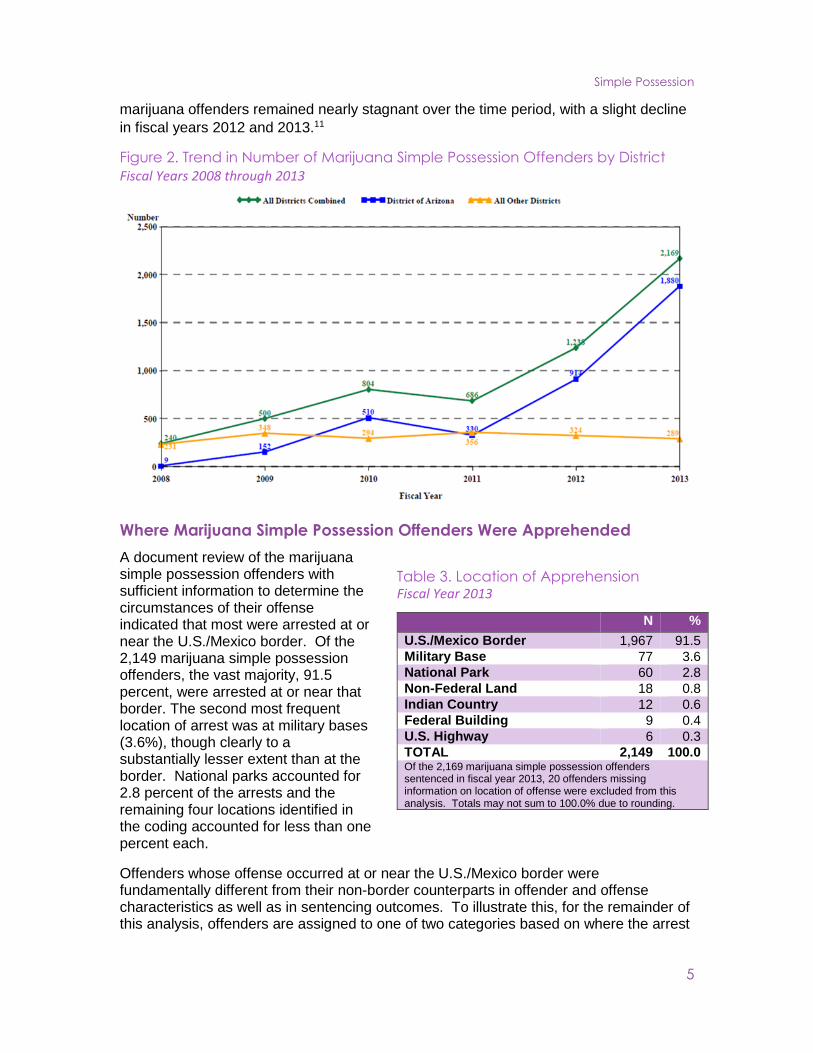
The table above shows the disproportionate contribution of Arizona to the fiscal year
2013 data compared to its contribution in fiscal year 2008. Figure 2 re-examines the
trend in the number of offenders over time graphically, and demonstrates that the
explosive increase in the number of simple possession of marijuana offenders nationally
parallels exactly the growth in the number of marijuana possession offenders sentenced
in the District of Arizona. For all other districts, the trend for simple possession of
Simple Possession
5
marijuana offenders remained nearly stagnant over the time period, with a slight decline
in fiscal years 2012 and 2013.11
Figure 2. Trend in Number of Marijuana Simple Possession Offenders by District
Fiscal Years 2008 through 2013
Where Marijuana Simple Possession Offenders Were Apprehended
A document review of the marijuana simple possession offenders with sufficient information to determine the circumstances of their offense indicated that most were arrested at or near the U.S./Mexico border. Of the 2,149 marijuana simple possession offenders, the vast majority, 91.5 percent, were arrested at or near that border. The second most frequent location of arrest was at military bases (3.6%), though clearly to a substantially lesser extent than at the border. National parks accounted for 2.8 percent of the arrests and the remaining four locations identified in the coding accounted for less than one percent each.
Offenders whose offense occurred at or near the U.S./Mexico border were fundamentally different from their non-border counterparts in offender and offense characteristics as well as in sentencing outcomes. To illustrate this, for the remainder of this analysis, offenders are assigned to one of two categories based on where the arrest
Table 3. Location of Apprehension Fiscal Year 2013
N %
U.S./Mexico Border 1,967 91.5
Military Base 77 3.6
National Park 60 2.8
Non-Federal Land 18 0.8
Indian Country 12 0.6
Federal Building 9 0.4
U.S. Highway 6 0.3
TOTAL 2,149 100.0 Of the 2,169 marijuana simple possession offenders sentenced in fiscal year 2013, 20 offenders missing information on location of offense were excluded from this analysis. Totals may not sum to 100.0% due to rounding.

United States Sentencing Commission
6
occurred. Offenders who were arrested at or near the U.S./Mexico border are assigned to the “Border” category while all others are assigned to the “Non-Border” category.12
Offender Characteristics
There were clear differences between Border and Non-Border offenders with respect to gender and citizenship. Nearly all Border offenders were male (91.4%) while Non-Border offenders have a much greater proportion of females (Non-Border 22.9% female; Border 8.6% female).
A substantial difference was seen in the citizenship status of Border and Non-Border offenders. Among Border offenders, 94.3 percent are not U.S. citizens. This sharply contrasts with Non-Border offenders, 83.5 percent of whom are U.S. citizens.
Non-Border offenders were slightly older than Border offenders at the time of sentencing. The average age of Non-Border offenders at sentencing was 32 years compared to 28 years for Border offenders.
Unfortunately, it is impossible to examine the racial/ethnic make-up of Border offenders because this information was missing for all but 11 of the 1,967 Border offenders.13 Data for Non-Border offenders was more complete, permitting a race/ethnicity analysis. Among Non-Border offenders, almost half are White (49.3%).
Table 4. Selected Characteristics of Marijuana Simple Possession Offenders Fiscal Year 2013
Border Offenders (N=1,967)
Non-Border Offenders (N=182)
AVERAGE AGE 28 32
RACE/ETHNICITY N % N %
White - - 33 49.3
Black - - 17 25.4
Hispanic - - 7 10.5
Other - - 10 14.9
GENDER
Male 928 91.4 94 77.1
Female 87 8.6 28 22.9
CITIZENSHIP
U.S. Citizen 102 5.7 71 83.5
Non-U.S. Citizen 1,692 94.3 14 16.5 Information on offender race/ethnicity was missing for all but 11 marijuana simple possession offenders located at or near the U.S./Mexico border, therefore information on race/ethnicity cannot be presented for this group. Offenders missing information required for a given analysis were excluded from that analysis. Totals may not sum to 100.0% due to rounding.
Simple Possession
7
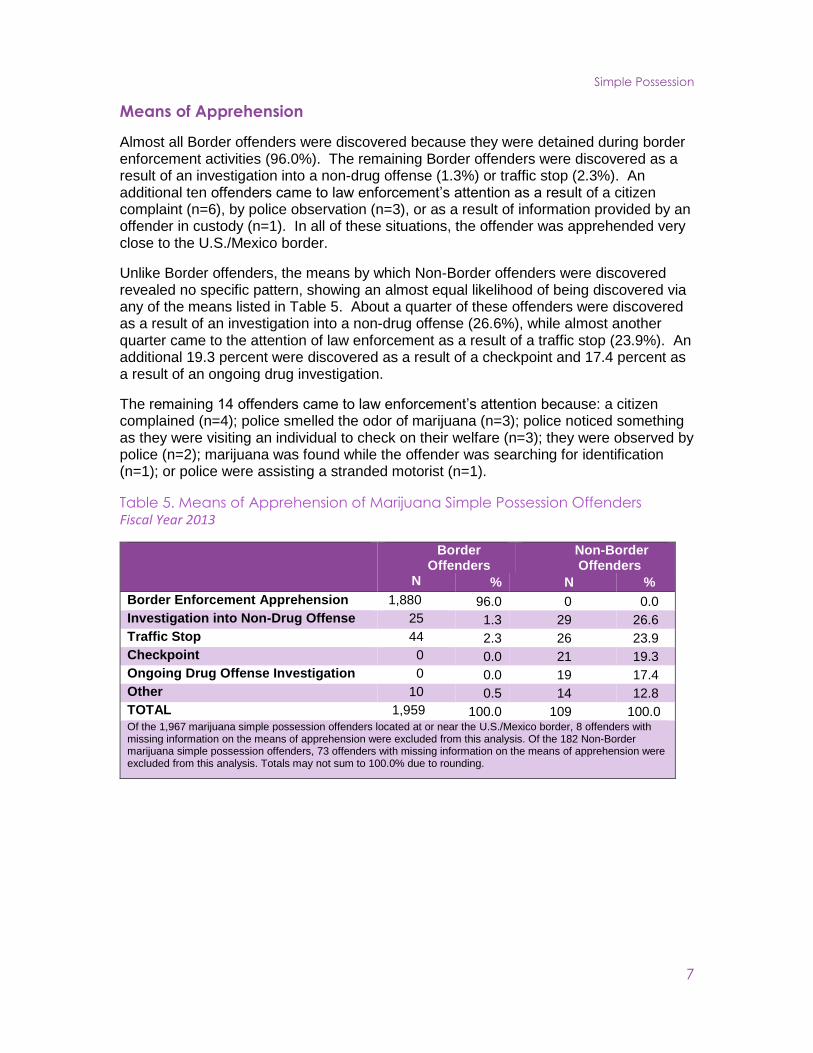
Means of Apprehension
Almost all Border offenders were discovered because they were detained during border enforcement activities (96.0%). The remaining Border offenders were discovered as a result of an investigation into a non-drug offense (1.3%) or traffic stop (2.3%). An additional ten offenders came to law enforcement’s attention as a result of a citizen complaint (n=6), by police observation (n=3), or as a result of information provided by an offender in custody (n=1). In all of these situations, the offender was apprehended very close to the U.S./Mexico border.
Unlike Border offenders, the means by which Non-Border offenders were discovered revealed no specific pattern, showing an almost equal likelihood of being discovered via any of the means listed in Table 5. About a quarter of these offenders were discovered as a result of an investigation into a non-drug offense (26.6%), while almost another quarter came to the attention of law enforcement as a result of a traffic stop (23.9%). An additional 19.3 percent were discovered as a result of a checkpoint and 17.4 percent as a result of an ongoing drug investigation.
The remaining 14 offenders came to law enforcement’s attention because: a citizen complained (n=4); police smelled the odor of marijuana (n=3); police noticed something as they were visiting an individual to check on their welfare (n=3); they were observed by police (n=2); marijuana was found while the offender was searching for identification (n=1); or police were assisting a stranded motorist (n=1).
Table 5. Means of Apprehension of Marijuana Simple Possession Offenders Fiscal Year 2013
Border Offenders
Non-Border Offenders
N % N %
Border Enforcement Apprehension 1,880 96.0 0 0.0
Investigation into Non-Drug Offense 25 1.3 29 26.6
Traffic Stop 44 2.3 26 23.9
Checkpoint 0 0.0 21 19.3
Ongoing Drug Offense Investigation 0 0.0 19 17.4
Other 10 0.5 14 12.8
TOTAL 1,959 100.0 109 100.0 Of the 1,967 marijuana simple possession offenders located at or near the U.S./Mexico border, 8 offenders with missing information on the means of apprehension were excluded from this analysis. Of the 182 Non-Border marijuana simple possession offenders, 73 offenders with missing information on the means of apprehension were excluded from this analysis. Totals may not sum to 100.0% due to rounding.

8
United States Sentencing Commission
Means of Apprehension by Location of Arrest14
Border offenders were apprehended exclusively at or near the U.S./Mexico border and,
as reported in Table 5, they were discovered largely as a result of border enforcement
activities.
In contrast, Table 6 demonstrates that there was wide variation in the place and reason
for apprehension among most of the Non-Border offenders. That said, associations
between the two factors were identified. Offenders discovered on a military base were
most often identified because of a security checkpoint (44.7%). An offender discovered
in a national park was most likely identified because of an investigation into a non-drug
offense (58.3%). An offender apprehended on non-federal land most likely came to the
attention of law enforcement as a result of an ongoing drug investigation (82.4%). Not
unexpectedly, three of the four offenders apprehended on a U.S. highway were
discovered as a result of a traffic stop and two offenders, found in a federal building,
were discovered as a result of a standard building security check.
Table 6. Means of Apprehension by Location of Non-Border Marijuana Simple
Possession Offenders Fiscal Year 2013
Military Base
National Park
Non-Federal
Land
Indian Country
U.S. Highway
Federal Building
N % N % N % N % N % N %
Border Enforcement Apprehension
0 0.0 0 0.0 0 0.0 0 0.0 0 0.0 0 0.0
Investigation into Non-Drug Offense
5 13.2 21 58.3 1 5.9 2 16.7 0 0.0 0 0.0
Traffic Stop 11 29.0 5 13.9 2 11.8 5 41.7 3 75.0 0 0.0
Checkpoint 17 44.7 1 2.8 0 0.0 1 8.3 0 0.0 2 100.0
Ongoing Drug Offense Investigation
0 0.0 3 8.3 14 82.4 2 16.7 0 0.0 0 0.0
Other 5 13.2 6 16.7 0 0.0 2 16.7 1 25.0 0 0.0
TOTAL 38 100.0 36 100.0 17 100.0 12 100.0 4 100.0 2 100.0
Of the 182 Non-Border marijuana simple possession offenders sentenced in fiscal year 2013, 73 offenders with missing information on the means of apprehension were excluded from this analysis. Totals may not sum to 100.0% due to rounding.

Simple Possession
9
Sentencing
There are stark differences between Border and Non-Border offenders in sentencing
factors and sentencing outcomes. Nearly all Border offenders had little or no prior
criminal history and were placed in Criminal History Category (CHC) I (99.3%). Far
fewer Non-Border offenders were in CHC I (64.4%).
Table 7. Sentencing Characteristics for Marijuana Simple Possession Offenders Fiscal Year 2013
Border Offenders (N=1,967)
Non-Border Offenders (N=182)
MEDIAN DRUG WEIGHT 22,000 grams 5.2 grams
CRIMINAL HISTORY CATEGORY N % N % Category I 1,515 99.3 85 64.4 Category II 7 0.5 19 14.4 Category III 2 0.1 18 13.6 Category IV 0 0.0 6 4.6 Category V 0 0.0 1 0.8 Category VI 1 0.1 3 2.3
TYPE OF SENTENCE IMPOSED Prison Only 1,923 97.8 48 26.4 Prison + Community Split 2 0.1 0 0.0 Probation + Confinement 0 0.0 6 3.3 Probation Only 42 2.1 105 57.7 Fine Only 0 0.0 23 12.6
MEDIAN SENTENCE Months Months 6 0
Offenders missing information required for an analysis were excluded from that analysis. The median drug weight analysis required an exact drug weight; if a weight range was provided, the weight was treated as missing and excluded from the median weight computation. The “Prison and Community Split” category includes all cases in which offenders received prison and conditions of confinement as described in USSG §5C1.1. Sentences of probation were included in the median sentence computation as zero months. In addition, the median sentence computation includes time of confinement as described in USSG §5C1.1. Totals may not sum to 100.0% due to rounding.
The median sentence for Border offenders was six months and almost all received a
sentence of imprisonment (97.9%). Non-Border offenders received a prison sentence
less frequently. Only 26.4 percent of Non-Border offenders received a prison sentence
while most of the offenders received a sentence of probation only (57.7%) or a sentence
of a fine only (12.6%).15
Border and Non-Border offenders differed sharply in the amount of marijuana involved in
the simple possession offense. Non-Border offenders generally were found with only a
small amount of marijuana. The median weight of marijuana among Non-Border
offenders was 5.2 grams (0.2 ounces). In contrast, the median weight of the marijuana
found among Border offenders was 22,000 grams (48.5 pounds or 776.0 ounces).

United States Sentencing Commission
10
Summary
Between fiscal years 2008 and 2013 the total number of federal simple possession
offenders increased by 396.6 percent. This growth, however, is almost entirely
accounted for by the substantial growth in simple possession offenses involving
marijuana. The number of offenders sentenced for simple possession of marijuana
during this time period increased by 803.8 percent. A single judicial district, the District
of Arizona, accounted for 86.7% of all marijuana simple possession offenders sentenced
in fiscal year 2013. The cases from this district are largely responsible for the increase in
the total number of simple possession cases. If marijuana offenders are excluded from
the analysis, the number of federal offenders convicted of simple possession of drugs
each year is very small and actually has
declined since fiscal year 2008.
Almost all (91.5%) of this large, and
growing, number of federal simple
possession of marijuana offenders
sentenced in fiscal year 2013 were
apprehended at or near the U.S./Mexico
border. Offenders apprehended at that
border and those apprehended away from the border differ in important ways. Among
offenders with a known means of apprehension, the simple possession of marijuana
offenders apprehended at the U.S./Mexico border were nearly all apprehended due to
border enforcement activities (96.0%) or very near the border (4.0%). In contrast, simple
possession of marijuana offenders arrested away from the border were apprehended at
a variety of locations, most with exclusive federal jurisdiction such as military bases
(34.9%) or national parks (33.0%).
The majority of the Non-Border offenders (almost 70 percent) were identified because of
a non-drug related event (26.6% because of non-drug related investigation; 23.9% as a
result of a traffic stop; and 19.3% at checkpoints—primarily at military bases). Most
offenders (97.9%) apprehended at or near the U.S./Mexico border received a prison
sentence compared to 26.4 percent of offenders apprehended away from the border.
Perhaps the most important difference between the two groups is the quantity of drugs
involved in the offense. Offenders apprehended at or near the U.S./Mexico border were
arrested with a substantially greater amount of marijuana than Non-Border offenders—
48.5 pounds compared to 5.2 grams—an amount that does not appear to correspond to
the Office of National Drug Control Policy definition of simple possession of drugs. This
difference in quantity suggests that the sizable increase in simple possession cases in
recent years is the result of marijuana drug trafficking cases in which the offender was
sentenced only for a possession offense.
The median weight of marijuana
found among Border offenders
was 48.5 pounds, an amount
that does not appear to
correspond to simple possession.
Simple Possession
11
Endnotes
1 The author gratefully acknowledges Emily Herbst and Kevin Maass for their assistance in reviewing the cases and collecting the data augmenting the Commission’s standard fiscal year datafiles.
2 Neither the statute (21 U.S.C. § 844) nor the guideline (USSG §2D2.1) specify a drug weight for this offense.
3 Jeffrey Robinson, OFFICE OF NATIONAL DRUG CONTROL POLICY, WHO'S REALLY IN PRISON FOR MARIJUANA 13 (2005), https://www.ncjrs.gov/ondcppubs/publications/pdf/whos_in_prison_for_marij.pdf.
4 21 U.S.C. § 844. A conviction that occurs after a prior drug related offense has become final triggers a mandatory minimum of not less than 15 days in custody, raises the maximum available penalty to two years,
and increases the fine to a minimum of $2,500. If the conviction occurs after two or more prior convictions
for drug related offenses have become final, the mandatory minimum penalty becomes 90 days in custody,
the maximum available penalty is three years, and the minimum fine is $5,000. In order for the enhanced
felony penalties to apply, the government must meet the procedural requirements set forth in 21 U.S.C. §
851 (proceedings to establish prior convictions).
5 Under USSG §2D1.1 (Unlawful Manufacturing, Importing, Exporting, or Trafficking (Including Possession with Intent to Commit These Offenses); Attempt or Conspiracy) an offender convicted of distributing or
possession with intent to distribute 22,000 grams of marijuana would be subject to a guideline range of 21-
27 months before consideration of any other adjustment or criminal history calculation under the guidelines.
6 See Appendix for more information. The definition of simple possession offenses used for this analysis differs from the definitions used in the Commission’s annual SOURCEBOOK OF FEDERAL SENTENCING
STATISTICS. This analysis is limited to offenders sentenced pursuant to a conviction for a Class A
misdemeanor or felony drug possession offense. This data does not include petty misdemeanor offenders
whose offense was docketed through the Central Violations Bureau.
7 Only offenders with complete guideline application information who were sentenced under USSG §§2D1.1 (Unlawful Manufacturing, Importing, Exporting, or Trafficking (Including Possession with Intent to Commit
These Offenses); Attempt or Conspiracy), 2D1.2 (Drug Offenses Occurring Near Protected Locations or
Involving Underage or Pregnant Individuals; Attempt or Conspiracy), 2D1.5 (Continuing Criminal Enterprise;
Attempt or Conspiracy), 2D1.6 (Use of Communication Facility in Committing Drug Offense; Attempt or
Conspiracy), 2D1.8 (Renting or Managing a Drug Establishment; Attempt or Conspiracy), 2D1.10
(Endangering Human Life While Illegally Manufacturing a Controlled Substance; Attempt or Conspiracy), or
2D1.14 (Narco-Terrorism) were included in this analysis.
8 Although not included in this analysis, the increase in the number of simple possession offenders continued in fiscal year 2014 (n=2,350). In fiscal year 2015, the number of offenders fell slightly (n=2,274).
9 The primary drug type for simple possession offenders is the drug type that would have received the highest drug equivalency had the Drug Quantity Table at USSG §2D1.1 been applied.
10 The eleventh top district that sentenced marijuana simple possession offenders was the Southern District of Texas, which sentenced nine marijuana simple possession offenders in fiscal year 2008, and seven
marijuana simple possession offenders in fiscal year 2013.
11 The increase in the number of marijuana simple possession offenders continued in fiscal year 2014 with 2,183 offenders nationwide. The District of Arizona sentenced 1,917 of these offenders. In fiscal year 2015,
the number of marijuana simple possession offenders nationwide decreased slightly to 2,095 offenders. The
District of Arizona sentenced 1,775 of those offenders.
12 The Border category of offenders is largely composed of offenders sentenced in the District of Arizona which accounted for 94.7 percent (n=1,863) of the 1,967 Border offenders.
United States Sentencing Commission
12
Endnotes Continued
13 The presentence report (PSR), written for the Court by a U.S. Probation Officer, is a primary source of certain offense and offender information recorded by the Commission. The vast majority of federal cases
(for example, 91.2% of the fiscal year 2013 cases received by the Commission) include a PSR. However,
this document can be waived by the Court. A review of the document status for the marijuana simple
possession offenders found that the PSR, particularly for those offenders sentenced along the U.S./Mexico
border, was often waived. While demographic and other information is typically extracted from the PSR,
some of this information may be gleaned from the other available documents sent to the Commission by the
Courts. These other documents were used for this study when the PSR was not available. Despite
examination of these other documents, some information could not be found, for example, race/ethnicity of
the offender.
14 The rate of missing information on means of apprehension varied by location of arrest. For offenses at the U.S./Mexico border, the means of apprehension was missing in less than one percent of the 1,967 cases
(n=8, 0.4%). When the offense occurred on a military base, the means by which the offender came to law
enforcement’s attention was missing in 50.6% of cases (39 of 77 cases). See Appendix for a complete
distribution of missing information for this field.
15 The remaining 3.3 percent of Non-Border offenders received a sentence that included both probation and some form of confinement.
Simple Possession
13
Appendix
Methodology
The Commission receives sentencing documentation on all federal felony and Class A misdemeanor cases sentenced during each fiscal year. Pursuant to 28 U.S.C. § 994(w), the chief judge of each district is required to ensure that within 30 days of entry of judgment in a criminal case, the sentencing court submits a report of sentence to the Commission that includes: (1) the judgment and commitment order; (2) the written statement of reasons; (3) any plea agreement; (4) the indictment or other charging document; (5) the presentence report; and (6) any other information the Commission requests. For fiscal year 2013, the overall casesubmission rate by the district courts was 99.7 percent.
Data from the documents submitted by the courts are extracted and coded for entry into various databases. The analysis in this paper started by analyzing data contained in the Offender Datasets. To create the Offender Datasets, the Commission routinely collects case identifiers, sentencing data, demographic variables, statutory information, the complete range of court guideline decisions, and departure and variance information.
The Commission classifies offenses either by the primary offense category, which is statute based,1 or by the primary sentencing guideline applied to the offender’s conduct. Information on the primary sentencing guideline is typically collected from the Presentence Report (PSR). When the PSR is waived, as it is in many simple possession offenses, classification can be made using only the statutes of conviction. For this reason, the Commission reports far fewer offenders sentenced under USSG §2D2.1 (Simple Possession) than there are with a primary offense category of simple possession.2 Furthermore, not all offenders with a primary offense category of simple possession are sentenced under USSG §2D2.1, which means their sentencing exposure under the guidelines is driven by something other than the simple possession conduct.
For this analysis, simple possession offenders are defined as either offenders with a primary offense category of simple possession and no sentencing guideline available, or offenders sentenced under USSG §2D2.1. Offenders with conflicting documentation regarding guideline application were excluded from the analysis.
For this analysis, the Commission augmented the Offender Dataset to collect information that is
not readily available in that dataset by undertaking a special coding project of simple possession
offenders sentenced in fiscal year 2013. This was necessary to answer specific questions
raised by the substantial increase in the number of these offenses reported by the courts
between fiscal years 2008 and 2013. The special coding project collected information related to
the location of the offense, how the simple possession offense came to law enforcement’s
attention, and the means of apprehension. Coders captured information from the offense
descriptions available in the PSR or, if that document was unavailable, the plea agreement
and/or charging document. Because of a lack of documentation, these items could not always
be coded. As a consequence, the number of offenders available for analysis is sometimes less
than the total number of simple possession offenders identified.
United States Sentencing Commission
14
Appendix Tables
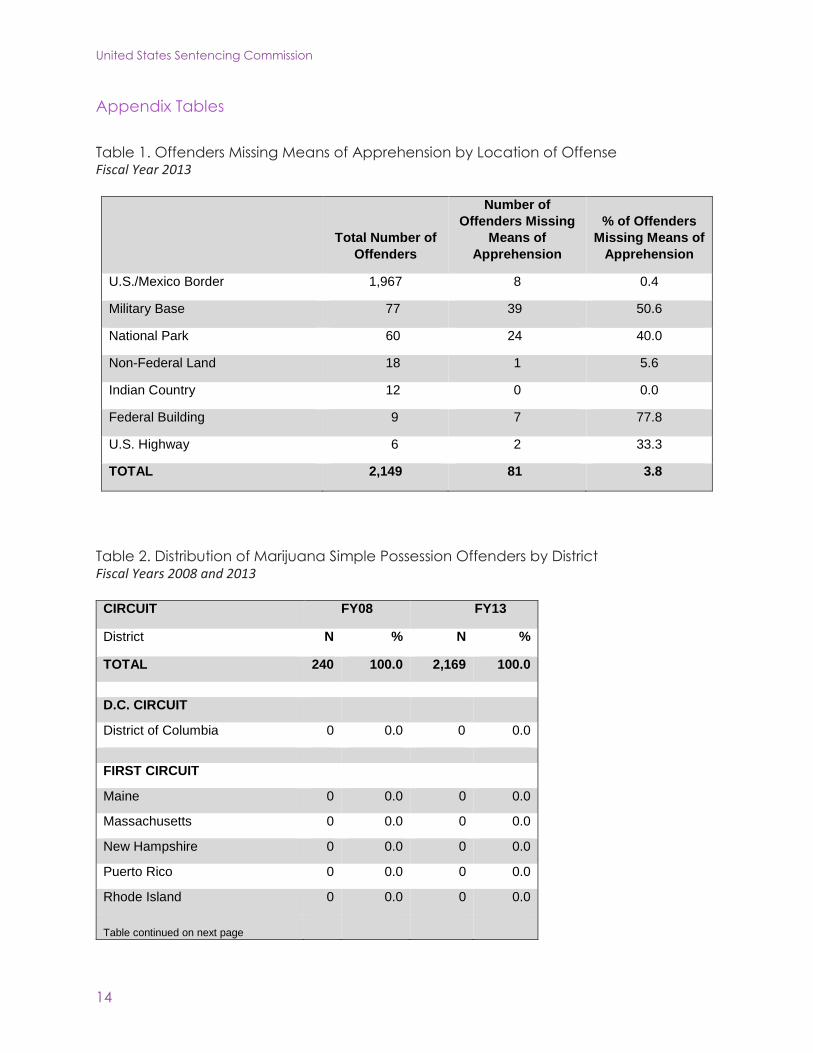
Table 1. Offenders Missing Means of Apprehension by Location of Offense Fiscal Year 2013
Total Number of
Offenders
Number of
Offenders Missing
Means of
Apprehension
% of Offenders
Missing Means of
Apprehension
U.S./Mexico Border 1,967 8 0.4
Military Base 77 39 50.6
National Park 60 24 40.0
Non-Federal Land 18 1 5.6
Indian Country 12 0 0.0
Federal Building 9 7 77.8
U.S. Highway 6 2 33.3
TOTAL 2,149 81 3.8
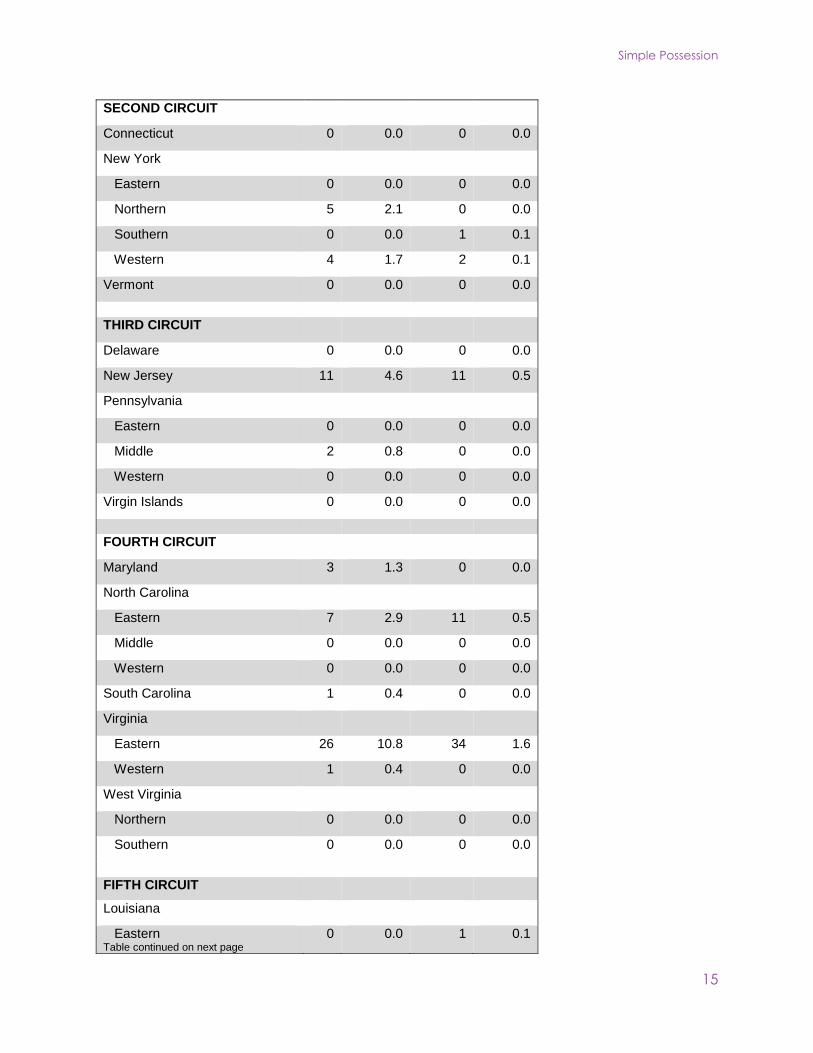
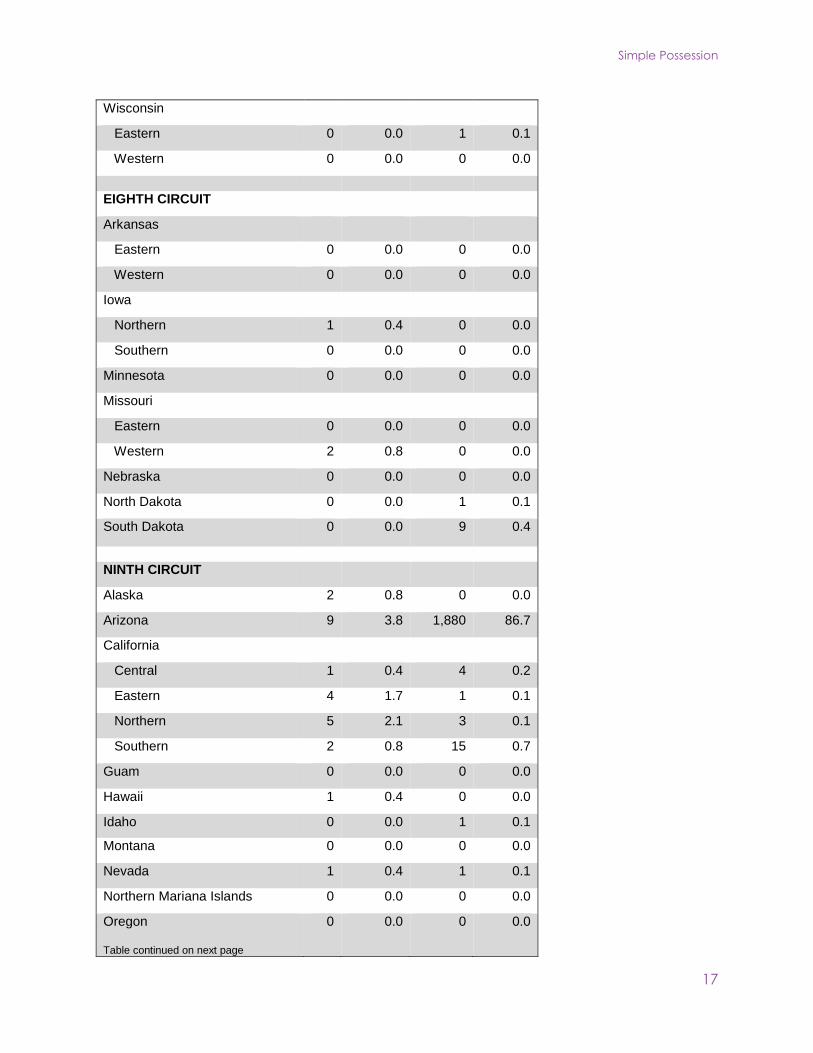
Table 2. Distribution of Marijuana Simple Possession Offenders by District Fiscal Years 2008 and 2013
CIRCUIT FY08 FY13
District N % N %
TOTAL 240 100.0 2,169 100.0
D.C. CIRCUIT
District of Columbia 0 0.0 0 0.0
FIRST CIRCUIT
Maine 0 0.0 0 0.0
Massachusetts 0 0.0 0 0.0
New Hampshire 0 0.0 0 0.0
Puerto Rico 0 0.0 0 0.0
Rhode Island 0 0.0 0 0.0
Table continued on next page
Simple Possession
15
SECOND CIRCUIT
Connecticut 0 0.0 0 0.0
New York
Eastern 0 0.0 0 0.0
Northern 5 2.1 0 0.0
Southern 0 0.0 1 0.1
Western 4 1.7 2 0.1
Vermont 0 0.0 0 0.0
THIRD CIRCUIT
Delaware 0 0.0 0 0.0
New Jersey 11 4.6 11 0.5
Pennsylvania
Eastern 0 0.0 0 0.0
Middle 2 0.8 0 0.0
Western 0 0.0 0 0.0
Virgin Islands 0 0.0 0 0.0
FOURTH CIRCUIT
Maryland 3 1.3 0 0.0
North Carolina
Eastern 7 2.9 11 0.5
Middle 0 0.0 0 0.0
Western 0 0.0 0 0.0
South Carolina 1 0.4 0 0.0
Virginia
Eastern 26 10.8 34 1.6
Western 1 0.4 0 0.0
West Virginia
Northern 0 0.0 0 0.0
Southern 0 0.0 0 0.0
FIFTH CIRCUIT
Louisiana
Eastern Table continued on next page
0 0.0 1 0.1

United States Sentencing Commission
16
Middle 0 0.0 0 0.0
Western 3 1.3 3 0.1
Mississippi
Northern 0 0.0 0 0.0
Southern 0 0.0 0 0.0
Texas
Eastern 0 0.0 0 0.0
Northern 0 0.0 1 0.1
Southern 9 3.8 7 0.3
Western 20 8.3 107 4.9
SIXTH CIRCUIT
Kentucky
Eastern 1 0.4 0 0.0
Western 19 7.9 3 0.1
Michigan
Eastern 1 0.4 0 0.0
Western 1 0.4 1 0.1
Ohio
Northern 0 0.0 1 0.1
Southern 7 2.9 4 0.2
Tennessee
Eastern 3 1.3 0 0.0
Middle 2 0.8 1 0.1
Western 0 0.0 1 0.1
SEVENTH CIRCUIT
Illinois
Central 0 0.0 0 0.0
Northern 0 0.0 0 0.0
Southern 1 0.4 0 0.0
Indiana
Northern 1 0.4 0 0.0
Southern
Table continued on next page
0 0.0 0 0.0
Simple Possession
17
Wisconsin
Eastern 0 0.0 1 0.1
Western 0 0.0 0 0.0
EIGHTH CIRCUIT
Arkansas
Eastern 0 0.0 0 0.0
Western 0 0.0 0 0.0
Iowa
Northern 1 0.4 0 0.0
Southern 0 0.0 0 0.0
Minnesota 0 0.0 0 0.0
Missouri
Eastern 0 0.0 0 0.0
Western 2 0.8 0 0.0
Nebraska 0 0.0 0 0.0
North Dakota 0 0.0 1 0.1
South Dakota 0 0.0 9 0.4
NINTH CIRCUIT
Alaska 2 0.8 0 0.0
Arizona 9 3.8 1,880 86.7
California
Central 1 0.4 4 0.2
Eastern 4 1.7 1 0.1
Northern 5 2.1 3 0.1
Southern 2 0.8 15 0.7
Guam 0 0.0 0 0.0
Hawaii 1 0.4 0 0.0
Idaho 0 0.0 1 0.1
Montana 0 0.0 0 0.0
Nevada 1 0.4 1 0.1
Northern Mariana Islands 0 0.0 0 0.0
Oregon
Table continued on next page
0 0.0 0 0.0

United States Sentencing Commission
18
Washington
Eastern 0 0.0 1 0.1
Western 4 1.7 4 0.2
TENTH CIRCUIT
Colorado 0 0.0 0 0.0
Kansas 2 0.8 3 0.1
New Mexico 0 0.0 2 0.1
Oklahoma
Eastern 0 0.0 0 0.0
Northern 1 0.4 0 0.0
Western 9 3.8 3 0.1
Utah 12 5.0 19 0.9
Wyoming 21 8.8 11 0.5
ELEVENTH CIRCUIT
Alabama
Middle 1 0.4 1 0.1
Northern 4 1.7 1 0.1
Southern 0 0.0 3 0.1
Florida
Middle 0 0.0 0 0.0
Northern 6 2.5 3 0.1
Southern 0 0.0 0 0.0
Georgia
Middle 10 4.2 7 0.3
Northern 5 2.1 2 0.1
Southern 9 3.8 4 0.2
Totals may not sum to 100.0% due to rounding. SOURCE: U.S. Sentencing Commission, Simple Possession Datafile.
Simple Possession
19
1 See Appendix A of the Commission’s 2013 SOURCEBOOK OF FEDERAL SENTENCING STATISTICS for a detailed
description of how the primary offense category is determined.
2 See Table 3 in the 2013 SOURCEBOOK OF FEDERAL SENTENCING STATISTICS, which reports 2,332 simple possession
offenders based on primary offense type compared to Table 33, which reports 189 simple possession offenders based on primary sentencing guideline.
Appendix Endnotes


![Introduction1 [Compatibility Mode]](https://img.dokumen.tips/doc/110x75/577cd5b71a28ab9e789b74c4/introduction1-compatibility-mode.jpg)