Embed Size (px)
Citation preview
Weibull Statistical Analysis of the MechanicalStrength of a Glass Eroded by Sand BlastingM. A. Madjoubi,* C. Bousbaa, M. Hamidouche and N. Bouaouadja
Laboratory of Materials, IOMP, Ferhat Abbas University, Se tif 19000, Algeria
(Received 28 January 1999; accepted 14 March 1999)
Abstract
In Saharian regions, the erosion of glass by sandparticles during sandstorms is a regular phenom-enon. The progressive loss of matter on surfacea�ects both the optical transmission and mechanicalstrength. In this work, the in¯uence of sand impactson glass strength was simulated in laboratory. Weused Weibull distribution function to characterizestatistically the variation of the mechanical strengthof a soda-lime glass in the as received state and ero-ded by sand blasting during 30 and 60 min. From thefailure probabilities distributions, we notice animportant drop in strength values (about 13%) after30 min and a tendency to level out with a muchreduced dispersion after 60 min. The Weibull plotsfor the as-received state and for the 30 min erodedstate present curves with a knee. They were con-sidered as bimodal forms (two straigth lines) denot-ing the presence of two kinds of defects that controlstrength. The Weibull plot for the 60 mins erodedstate sample presents one straight line (unimodalform) that indicates the predominance of erosiondefects. From micrographical observations on erodedspecimen, we observed a tendency toward a dama-ging homogeneity of the surfaces exposed to sandblasting. This explains the uniformity of the strengthvalues obtained after 1 h of sand blasting. # 1999Elsevier Science Ltd. All rights reserved
Keywords: glass, mechanical properties, strength,erosion, sand blasting.
1 Introduction
Under the same conditions of specimen prepara-tion and loading, the experimental evaluation ofglass mechanical strength gives very scattered
values (see Fig. 1) that necessitate a statistical ana-lysis. The coe�cient of variation about the meancan reach more than 20%. The strength valuesdispersion is inherently tied to the distribution ofsurface ¯aws introduced during glass processing,by mechanical contact during the use of glass orinduced by agressive environments such as sandblasting, chemical attacks, etc.Among statistical distribution functions, the
Weibull model is the most widely used to analysestatistically strength measurements and life timepredictions of glass components. It is very suitableby its simple mathematical form and by its adapt-ability to experimental data. Since its publicationin 1939, it has been applied by numbrous researchworkers on di�erent brittle materials (ceramics) tocharacterize strength and lifetime variability undervarious loading conditions.1±5
The tests made on brittle materials revealed thattheir fracture strength depends essentially on theexistence of volumetric or surface ¯aws that acts asstress intensi®ers. The fracture occurs when thestress at any ¯aw is su�cient to cause unstablecrack propagation. On a uniformaly stressed spe-cimen, it is the most critical ¯aw (by its size, formand position) that controls strength. The prob-ability distribution of strength corresponds then tothe distribution of critical ¯aws. A theoretical ana-lysis made by Jayatilaka and Trustrum6 has shownthe relation between di�erent possible ¯aw sizedistribution following an inverse power law to theWeibull distribution. The Weibull's model, basedon `the weakest link concept' considers the materialstructure as a chain whose strength is controlled byits weakest link which is equivalent to the regionwith the largest ¯aw.2
According to this theory as presented by Var-ashneya,7 the cumulative probability of failure P ofa body is given by:
P � 1ÿ Exp ÿR� � �1�
Journal of the European Ceramic Society 19 (1999) 2957±2962
# 1999 Elsevier Science Ltd
Printed in Great Britain. All rights reserved
P I I : S 0 9 5 5 - 2 2 1 9 ( 9 9 ) 0 0 0 8 7 - 4 0955-2219/99/$ - see front matter
2957
* To whom correspondence should be addressed.
where R is the risk of rupture de®ned for a volumeV as
R ��
V
� ÿ �U� �=�0� �mdV for � > �U �2�
R � 0 for � < �U �3�
� is the stress applied on the element dV; �U is thethreshold stress, i.e. the minimum stress that cancause failure; �0 is a scaling or normalizing para-meter whose unit is the unit of: stress�volume1/m,and m is the Weibull modulus, also called the shapeparameter.The Weibull modulus characterizes the strength
distribution. As this number gets larger, the dis-tribution narrows. Typical values of m for soda-lime glass are between 5 and 15. The thresholdstress �U is usually set equal to zero to obtain, afterintegrating R, a two parameter function [Eq. (7)]easier to linearize without compromising theresults. It was shown indeed by Trustrum andJayatilaka8 that setting �U equal to zero gives moreconservative results (overestimation of failureprobabilities) without any major change in theoverall cumulative failure probability distribution.R can be written in a simple integrated form as:
R � YV:V��=�0�m �4�
where YV is a factor that depends on the loadingconditions. It is equal to 1 in tensile loading whereV is uniformly stressed.The productYV:V represents the e�ective volume,
i.e. the volume of an equivalent specimen tested in
tension that would have the same probability offracture as that tested in another loading condi-tions (3- or 4-point bending).For glasses whose strengths are mainly con-
trolled by surface ¯aws, the expression of Rbecomes:
R � YS:S �=�0� �m �5�
where YS:S is the e�ective surface.For 4-point bending test, YS has been de®ned by
integration as:
YS � m Li=L0� � � 1� � �6�
w=h� � � 1= m� 1� �� � �=2 1� w=h� ��
m� 1f g� �where Li is the inner span, L0 the outer span, w thewidth and h the height of the specimen.The loading factor YS and the surface S are
taken as part of the �0 parameter rede®ned withthe unit of stress (MPa) such that the Weibull dis-tribution function becomes:
P � 1ÿ Exp ÿ �=�0� �m� � �7�
By taking twice the logarithms of the survivalprobability 1ÿ P� �, we obtain the equation:
LnLn 1= 1ÿ P� �� � � m:Ln �� � � Ln 1=�0� �m� � �8�
This equation can be plotted as a straight lineLnLn[1/(1ÿP)] versus Ln(�) whose slope is theWeibull modulus m and whose intercept at theorigin is Ln[(1/s0)
m].The parameters m and �0 de®ning the Weibull
distribution [eqn. (7)] are usually determined eithergraphically or numerically by the least squaresmethod. For that purpose, we must assign a failureprobability Pi to each value of �i after ranking allthe measured values in ascending order ( i takingvalue from 1 to n which corresponds to the numberof measurements of the sample tested) according toone of the principal probability estimators used:
Pi � i= n� 1� � �9�
Pi � iÿ 0�5� �=n �10�
Pi � iÿ 0�3� �= n� 0�4� � �11�
Although it was shown by numerical simulationthat the second [eqn. (10)] and the third [eqn. (11)]estimators give more precise results, the ®rst esti-
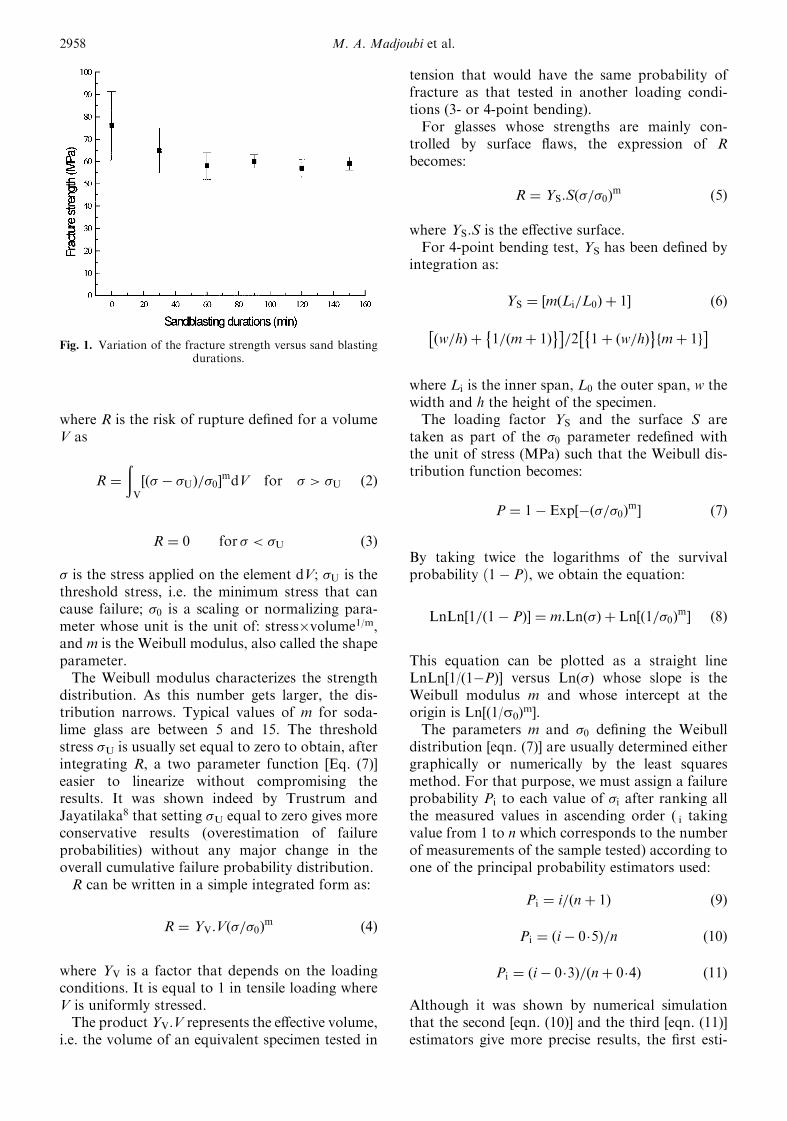
Fig. 1. Variation of the fracture strength versus sand blastingdurations.
2958 M. A. Madjoubi et al.
mator [eqn. (9)] is still frequently used for designpurposes as it gives more conservative estimates ofWeibull modulus.9
The parameters m and �0 can also be determinedwith more precision using non-linear equationmethods10 based on ®tting the data �i to the non-linear [eqn. (7)]. Among those methods, we havethe method of moments, the maximum likelihoodmethod and the direct non-linear least squaresanalysis. From di�erent studies made by simula-tion (using Monte Carlo method) on the e�ciencyof these di�erent methods, it appears that themaximum likelihood method gives the least biasedresults8,11 on the parameter m.Among the assumptions considered in the use of
Weibull model is that the material is an homo-geneous medium with one population of ¯awsrandomly distributed in su�cient number withinall the specimens. In the case of the presence of twodi�erent ¯aw populations that control strength, theWeibull plot �LnLn�1= 1ÿ P� � versus Ln(�)] willhave a bimodal form (i.e. two straight lines plot).To clearly characterize the presence of a second¯aw population, it is recommended to use severalsamples with di�erent sized tests specimens.12 Thiswould give for one ¯aw population a uniform par-allel shift of the strength distribution on a conven-tional failure cumulative probability graphaccording to the Weibull size scaling relationship:
�2=�1 � S1=S2� �1=m �12�
This relation says that a specimen of e�ective sur-face S2 would have the same failure probability asa specimen of surface S1 if the stress is changedfrom �1 to �2. If there is a second ¯aw population,the strength distribution would shift in a non-parallel and non-uniform way with a change inspecimen size. When it is possible, the use of frac-tography for visualizing fracture origins can alsohelp to identify the ¯aw population that controlstrength.In the case of bimodal form where failure origins
are known by fractography, methods such as thecensored data technique13 or the maximum like-lihood technique14 could be used for characterizingthe Weibull parameters for the concurred ¯awspopulations (e.g. edge and surface ¯aws in glass).
2 Experimental Procedures
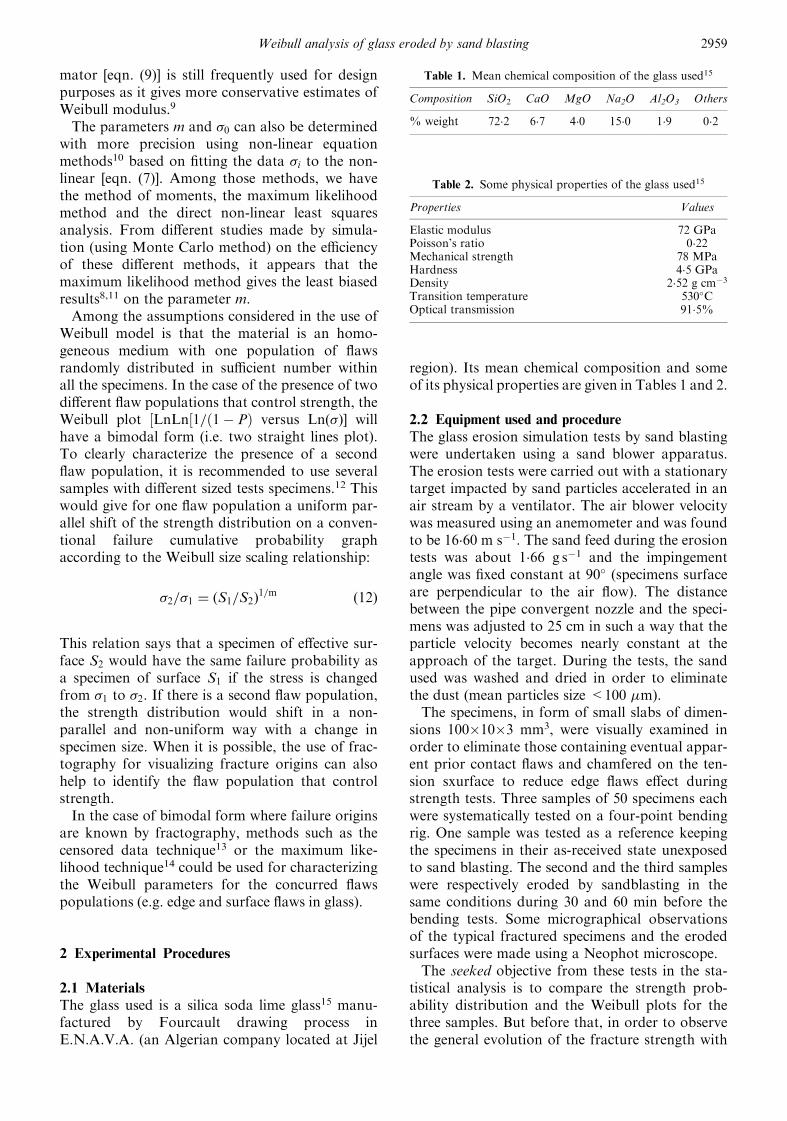
2.1 MaterialsThe glass used is a silica soda lime glass15 manu-factured by Fourcault drawing process inE.N.A.V.A. (an Algerian company located at Jijel
region). Its mean chemical composition and someof its physical properties are given in Tables 1 and 2.
2.2 Equipment used and procedureThe glass erosion simulation tests by sand blastingwere undertaken using a sand blower apparatus.The erosion tests were carried out with a stationarytarget impacted by sand particles accelerated in anair stream by a ventilator. The air blower velocitywas measured using an anemometer and was foundto be 16.60 m sÿ1. The sand feed during the erosiontests was about 1.66 g sÿ1 and the impingementangle was ®xed constant at 90� (specimens surfaceare perpendicular to the air ¯ow). The distancebetween the pipe convergent nozzle and the speci-mens was adjusted to 25 cm in such a way that theparticle velocity becomes nearly constant at theapproach of the target. During the tests, the sandused was washed and dried in order to eliminatethe dust (mean particles size <100 �m).The specimens, in form of small slabs of dimen-
sions 100�10�3 mm3, were visually examined inorder to eliminate those containing eventual appar-ent prior contact ¯aws and chamfered on the ten-sion sxurface to reduce edge ¯aws e�ect duringstrength tests. Three samples of 50 specimens eachwere systematically tested on a four-point bendingrig. One sample was tested as a reference keepingthe specimens in their as-received state unexposedto sand blasting. The second and the third sampleswere respectively eroded by sandblasting in thesame conditions during 30 and 60 min before thebending tests. Some micrographical observationsof the typical fractured specimens and the erodedsurfaces were made using a Neophot microscope.The seeked objective from these tests in the sta-
tistical analysis is to compare the strength prob-ability distribution and the Weibull plots for thethree samples. But before that, in order to observethe general evolution of the fracture strength with
Table 1. Mean chemical composition of the glass used15
Composition SiO2 CaO MgO Na2O Al2O3 Others
% weight 72.2 6.7 4.0 15.0 1.9 0.2
Table 2. Some physical properties of the glass used15
Properties Values
Elastic modulus 72 GPaPoisson's ratio 0.22Mechanical strength 78 MPaHardness 4.5 GPaDensity 2.52 g cmÿ3
Transition temperature 530�COptical transmission 91.5%
Weibull analysis of glass eroded by sand blasting 2959

the sand blasting durations, some preliminary testswere made on small samples (n � 6) for di�erenttimes up to 150 min (see Fig. 1).
3 Results and Discussion
The bending results of the preliminary tests arepresented in Fig. 1. Two principal remarks can bemade from these results. We, ®rst of all, notice asharp drop in strength within an hour durationfollowed by almost constant level of strengthvalues. The second remark concerns the decrease ofthe standard deviation from 0 min duration (unex-posed specimens to erosion tests). There is lessvalues scattering with time.After achieving the bending tests on the three
samples for the as-received state and for the 30 and60 min sand blasting durations, we ordered thestrength values for each sample and assigned aprobability Pi to each value �i using the estimatorPi � 1= n� 1� �. The di�erent cumulative prob-abilities distribution are shown in Fig. 2. For a50% failure probability, the strength decreasesfrom 76 MPa for the as-received state to 66 MPaafter 30 min and to 64 MPa after 60 min durations.With the exception of a few high extreme values,the distributions for the eroded glass during 30 and60 min are comparably closer to each other.In Fig. 3, we have represented the three di�erent
Weibull plots. We can observe that the bimodalcharacter of the lines is clearly apparent for theinitial state (t � 0 min) and tends to disappear after30 and then 60 min of sand blasting. The Weibullplot for the as-received state (t � 0 min) shows twostraight line sections. This bimodal distributionindicates the presence of two ¯aws families that are
responsible for the strength distribution. There is alower line whose slope gives a Weibull modulusm � 24�2 concerning the weakeast strength values,caused probably by predominant defects intro-duced during specimen preparation. These couldbe severe edge ¯aws remaining after cutting andchamfering operations. The upper line with Wei-bull modulus m � 4�2 covers a large dispersion ofstrength values corresponding to the distribution ofsurface ¯aws left after the processing or induced bymechanical contact. For the damaged surface dur-ing 30 min, the Weibull plot presents also a bimo-dal form with a lower line (m � 18�2) and an upperline (m � 6�3). Here also, we have two statistical¯aws families that intervene in the strength dis-tribution. The lower values part could be causedby erosion exclusively as all these values seem to beweaker than the lowest extreme value obtained forthe as-received state. The higher values part with aWeibull modulus comparable to that of the as-received glass would then be caused by other sur-face ¯aws. The almost straight line for the 60 minduration with a high modulus (m � 10�46) indi-cates the predominance of erosion defects and anarrow values dispersion.The microscopic observations [Fig. 4(a) and 4(b)]
present the surface damage caused by erosionrespectively for 30 and 60 min durations. Themicrographs show the formation of individualdefects that group and then extend progressivelyon all the surface when the duration increases. Wecan clearly observe that there is a tendency to anhomogeneization of the surface damaging, whichexplains the reduced values dispersion seen withsand blasting durations in Fig. 1.Figure 5 shows some details of typical surface
damage induced by sand impacts. The damage is
Fig. 2. Variation of the failure probability versus the fracturestrength.
Fig. 3. Weibull plots established for three di�erent states: as-received state (t � 0 min) and sand blasted for 30 and 60 min.
2960 M. A. Madjoubi et al.

essentially produced by scaling with formation andextension of lateral cracks corresponding to sharpindentation damage. We can show, for example, thetrace of lateral cracks which are nearly parallel to thesurface (arrow a), the cracks which curve up andintersect the glass surface (arrow b) and ®nally themorphology of the scales after detachment (arrow c).
Conical fractures typical of Hertzian indentation(blunt indentation damage) were also noticed.16
4 Conclusion
A statistical analysis based on Weibull's modelhelped us to follow and to describe the variation ofthe mechanical strength of a soda-lime glass erodedby sand blasting during 30 and 60 min. A sharpdecrease in strength happens during the ®rst 30min. The corresponding Weibull plot show abimodal form denoting the distribution betweenthe severe defects caused by erosion and those lesssevere left after the specimen preparation. After 1 hduration of sand blasting, a straight line isobtained with a high Weibull modulus (m � 10�46)characterizing the predominance of erosion defectsthat give a narrow dispersion of fracture strengthvalues. The reduced strength scatter shows that thecumulate sand blasting erosion induced a distribu-tion of severe ¯aws which is approaching uni-formity in comparison with that of the as-receivedstate ¯aws. The tendency towards an homogeneousdamaged surface has been revealed from micro-scopic observations. Besides, the closeness of thetwo strength distributions for 30 and 60 min dura-tions suggests that there is no further strengthdegradation after 30 min.
References
1. Evans, A. G. and Langdon, T. G., Structural ceramics.Prog. Mater. Sci., Vol. 21. Pergamon Press, Elmsford,NY, 1976, pp. 171±425.
2. Davidge, R. W., Mechanical Behaviour of Ceramics.Cambridge University Press, Cambridge, 1979, (chapter9).
3. Wiederhorn, S. M. and Fuller, E. R., Structural reliabilityof ceramic materials. Mater. Sci. Eng., 1985, 71, 169.
4. Petrovic, J. J. and Stout, M. G., Fracture of Al2O3 incombined tension/torsion: II, Weibull theory. J. Am.Ceram. Soc., 1981, 64, 661±666.
5. Williams, R. M. and Swank, L. R., Use of Weibullstatistics to correlate MOR ball on ring and rotationalfast fracture tests. J. Am. Ceram. Soc., 1983, 66, 765±768.
6. Jayatilaka, A. S. and Trustrum, K., Statistical approachto fracture. J. Mater. Sci., 1977, 12, 1426±1430.
7. Varashneya, A. R., Fundamentals of inorganic glasses.New York State College of Ceramics, Alfred University,New York, 1994.
8. Trustrum, K. and Jayatilaka, A. S., On estimating theWeibull modulus for a brittle materials. J. Mater. Sci,1979, 14, 1080±1084.
9. Bergman, B., On the estimation of the Weibull modulus.J. Mater. Sci. Letters, 1984, 3, 689±692.
10. Steen, M., Sinnema, S. and Bressers, J., Statistical analysisof bend strength data according to di�erent evaluationmethods. J. Eur. Ceram. Soc., 1992, 9, 437±445.
11. Langlois, R., Estimation of Weibull parameters. J. Mater.Sci. Letters, 1991, 10, 1049±1051.
Fig. 4. Micrographs of the eroded surfaces showing thedamage caused by the sand particle impacts after (a) 30 min,
(b) 60 min (�82).
Fig. 5. Micrograph of the damaged surfaces showing somedetails (arrows a, b, c) of the formation sequences of lateral
cracks (�320).
Weibull analysis of glass eroded by sand blasting 2961

12. Quinn, G. D., Design data for engeneering ceramics: areview of the ¯exure tests. J. Am. Ceram. Soc., 1991, 74,2037±2066.
13. Jakus, K., Ritter, J. E., Service, T. and Sonderman, D.,Evaluation of bimodal concurrent ¯aw distributions. J.Am. Ceram. Soc., 1981, 64, 174±175.
14. Sonderman, D., Jakus, K., Ritter, J. E., Yuhaski, S. andService, T. H., Maximum likelihood estimation techni-
ques for concurrent ¯aw subpopulations. J. Mater. Sci.,1985, 20, 20±23.
15. Bousbaa, C., Iferroudjene, N., Bouzid, S. andBouaouadja, N., E�ects of durations of sand blasting onthe properties of window glass. Glass Techn., 1998, 39,24±26.
16. Lawn, B. R., Fracture of brittle solids, 2nd Edn. Cam-bridge University Press, Cambridge (chapter 8).
2962 M. A. Madjoubi et al.