Embed Size (px)
Citation preview

WEEK ON RACE & ETHNICITY
INTRODUCTION TO SOCIOLOGY
Professor Adam Isaiah Green
Winter 2013
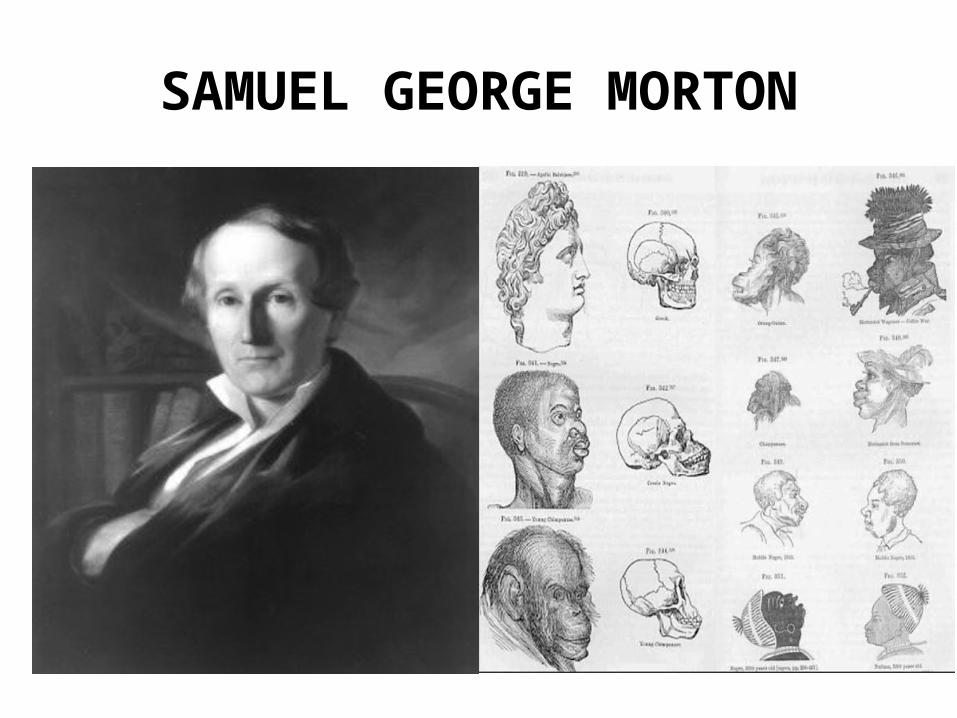
SAMUEL GEORGE MORTON

GANGSTA RAPPERS

FEMALE GANGSTA RAPPERS

Prejudice is an attitude that people employ to judge others on their group’s real or imagined characteristics. Discrimination is unfair treatment of people due to their perceived group membership.
Prejudice and Discrimination


DNA Snips
DNA is a chemical that contains the genetic instructions for all living organisms. When people have a child, the DNA of the mates combines and the child inherits the parents’ DNA. DNA consists of 3 billion pairs of four types of molecules. Different sequences of molecules result in different characteristics (e.g., skin colour). 99.5% of the DNA of all people is identical. The remaining 0.5% of DNA may differ between any two people; these differences (known as Single Nucleotide Polymorphisms, SNPs or “snips”) are the focus of research in the field of comparative genomics.

Comparative Genomics
Snips influence readily apparent physical differences such as skin pigmentation and less apparent physical differences such as the capacity to absorb and utilize various chemicals. Identifying snips of the latter type enables the production of “designer” drugs that are best suited to groups with unique genetic characteristics. Significantly, comparative genomics research focuses on differences between socially distinct groups, such as blacks and whites. Yet genetic diversity is greatest among people of African origin, and genetic variation within other racial groups may be pharmacologically significant.

Race, Biology, and Society
There is no biological evidence that races differ in ways that explain behavioural differences. Behavioural differences between racial groups are not constant. Behavioural differences between racial groups vary by social circumstance.

RACIALIZATION
1) At the individual, interactional, micro-level:
A SOCIAL PROCESS WHEREBY DISPOSITIONAL ATTRIBUTIONS ARE MADE BASED ON PHYSICAL CHARACTERISTICS ASSOCIATED WITH RACIAL OR ETHNIC HERITAGE

RACIALIZATION
2) At the group-level, the macro-level:
A SOCIO-HISTORICAL PROCESS WHEREBY A GROUP OF INDIVIDUALS ARE TRANSFORMED INTO A “RACIAL” OR “ETHNIC” GROUP BASED ON SHARED POSITION IN THE SOCIETY

Race and Ethnicity Defined
A race is composed of people whose perceived physical markers are socially significant (especially in creating and maintaining systems of social inequality). An ethnic group is composed of people whose perceived cultural markers are socially significant (especially in creating and maintaining systems of social inequality).
RACE & ETHNICITY DEFINED:
• RACE & ETHNICITY ARE SOCIAL CONSTRUCTS USED TO CREATE AND MAINTAIN SYSTEMS OF SOCIAL INEQUALITY

6 SOCIETAL RESPONSES TO RACIAL & ETHNIC DIFFERENCE Genocide: group extermination Expulsion: forcible removal of group from a territory Slavery: legal ownership of a group Segregation: spatial and institutional separation of groups Pluralism: retention of identity and equal access to basic social resources (Canada today) Assimilation: cultural blending of majority and minority groups (Canada today)

NAZI CONCENTRATION CAMP
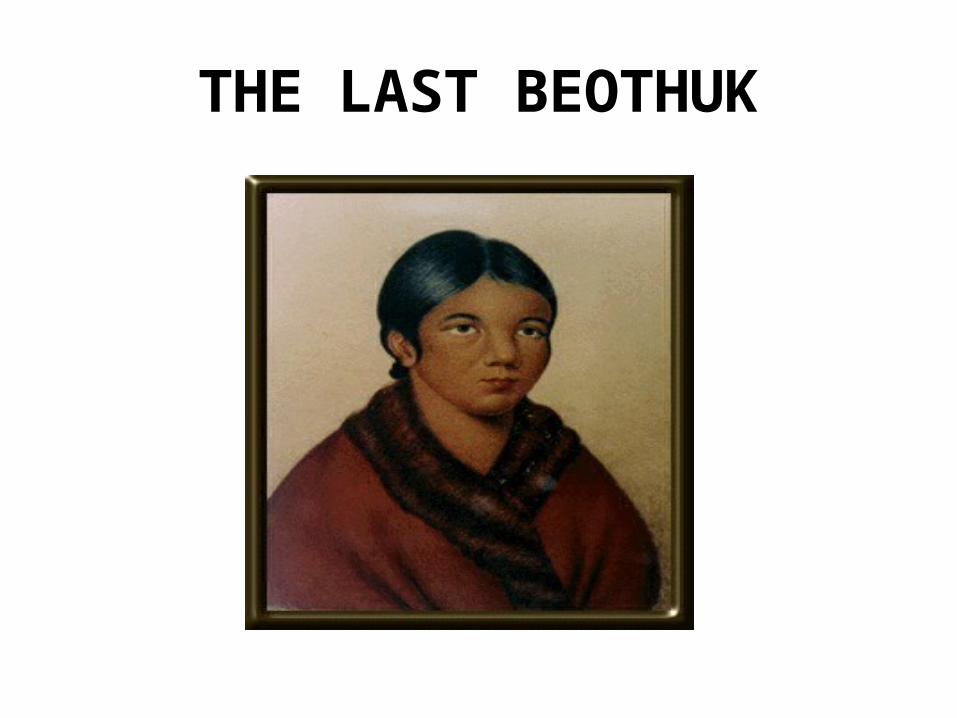
THE LAST BEOTHUK

AFRICAN SLAVE MARKET
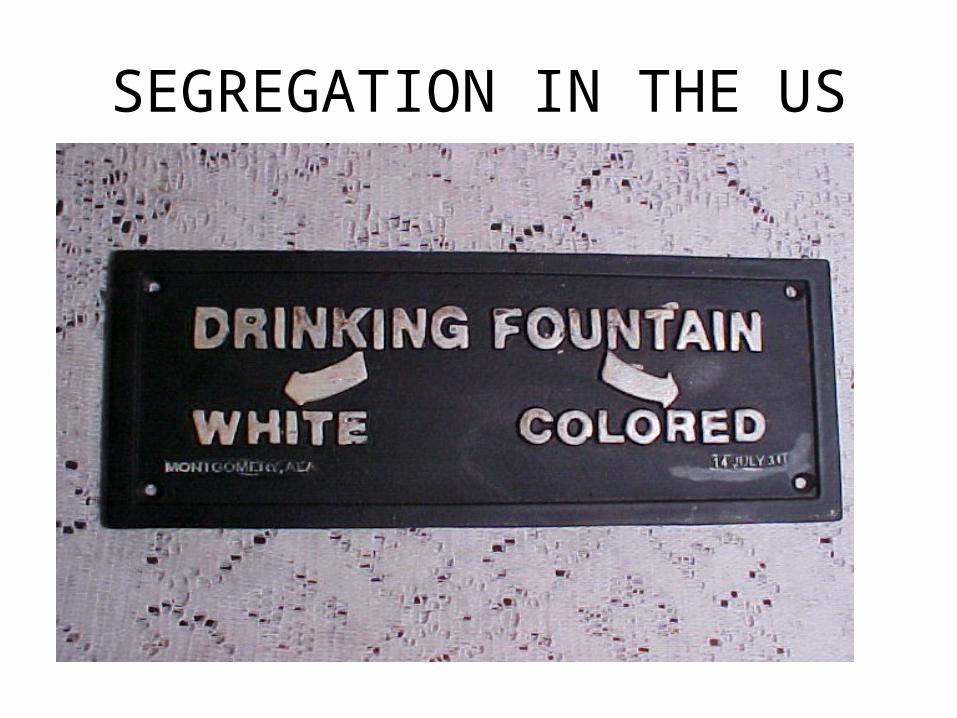
SEGREGATION IN THE US
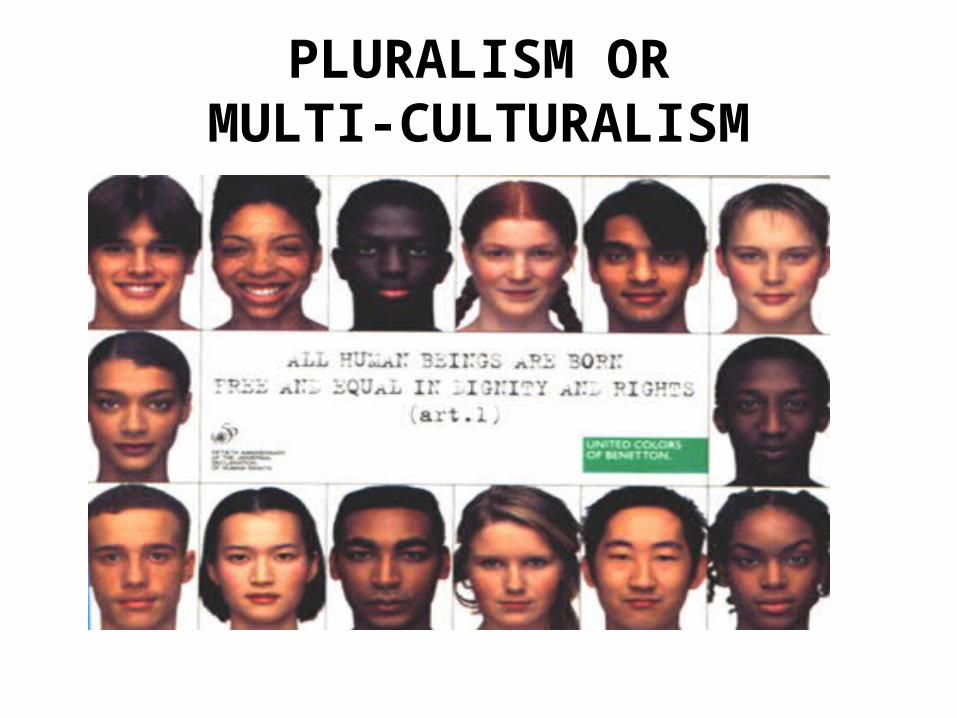
PLURALISM ORMULTI-CULTURALISM

ASSIMILATION

Ethnic Groups inCanada, 2006

2006 2031
Group Thousands % of Population Thousands % of Population
South Asian 1 320 4.1 3 640 8.7
Chinese 1 269 3.9 2 714 6.4
Black 815 2.5 1 809 4.3
Filipino 427 1.3 1 020 2.4
Latin American 317 1.0 733 1.7
Arab 276 0.8 930 2.2
Southeast Asian 250 0.8 449 1.1West Asian 164 0.5 523 1.2
Korean 148 0.5 407 1.0
Japanese 85 0.3 142 0.3
Other 213 0.7 489 1.2
Total 5 285 16.3 12 855 30.6
Visible Minority Groups, Canada, 2006 and 2031 (projected)
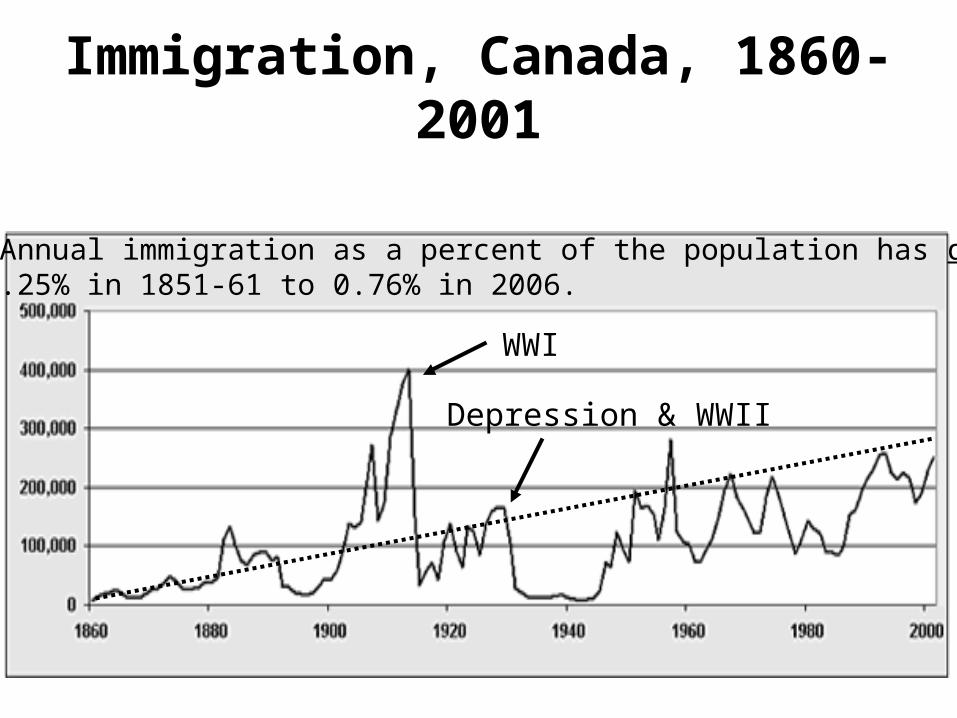
Immigration, Canada, 1860-2001
WWI
Depression & WWII
Note: Annual immigration as a percent of the population has declinedfrom 1.25% in 1851-61 to 0.76% in 2006.

Independent Immigrants Need 67 Points Based On:
criterion maximum points
education 25 (PhD or MA max)
language 24 (French, English)
work experience 21 (4+ yrs max)
age 10 (21-49 max)
arranged employment 10
adaptability 10 (work, study, family)
total 100
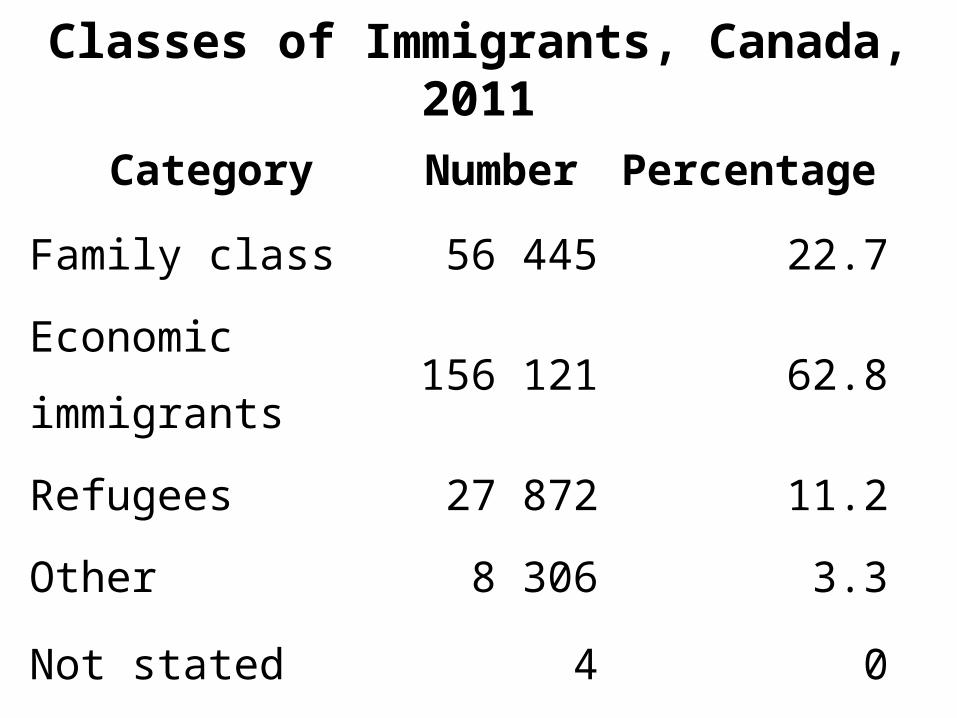
Classes of Immigrants, Canada, 2011
Category Number Percentage
Family class 56 445 22.7
Economic
immigrants156 121 62.8
Refugees 27 872 11.2
Other 8 306 3.3
Not stated 4 0
Total 248 748 100.0


Percent of Population Whose Mother Tongue is not English or French, Canada’s Five Biggest
Cities, 2001
0
10
20
30
40
Toronto
Vancouver
Calgary
Montreal
Edmonton
Winnipeg
Percent

Attitudes Toward Immigration and Cultural Diversity, Canada
Immigration in 21st century... More14
Same 43Less 41DK 2
Cultural diversity enhances or erodes ID...
Enhances 59Erodes 30DK 11

Canadians Feeling Uncomfortable or Out of Place
because of Ethno-Cultural Characteristics, 2002
9
76
24
91
0
20
40
60
80
100Nev
er/R
arely
Sometim
es/m
ostly
/alw
ays
Not a visibleminorityVisible minority
Percent

Canadians Reporting Discrimination or Unfair Treatment “Sometime” or “Often”
in Past 5 Years, 2002
0
10
20
30
40
Total
pop
ulat
ion
Not a
visi
ble
mino
rity
Total
visi
ble
min
ority
Chine
seSou
th A
sian
Black
Oth
er v
isibl
e m
inorit
y
PercentNote: The ‘often’ category alone ranges from a low of 2% for Chinese to a high of 9.5% for Blacks.

Percent Not Wanting Neighbour of a Different Race, Selected
Countries, 2000
0
10
20
30
40
50
60
70
Egypt
Indi
a
South
Kor
ea
Nigeria Ira
n
Philipi
nnes
Poland Ita
ly
Ukrain
eUK
Franc
e
Russia USA
Canad
a
Percent

Canadian Research on Ethnicity, Race, and SES: A Summary
Ethnicity is a poor predictor of SES and social mobility in Canada when other causes are held constant. Ethnic inequality is decreasing over time. Members of most ethnic groups experience considerable net upward mobility. The effect of ethnicity on SES weakens as immigrants become more assimilated. These generalizations do not hold as strongly for members of some groups – especially members of racial minorities – as they do overall. In the 90s, upward mobility among racial minority immigrants slowed.